
Motives for sending Remittances to Jamaica - Bank of … · Motives for sending Remittances to...
36
Motives for sending Remittances to Jamaica: An application of the BPM6 1 definition of Remittances Chandar Henry, Jermaine Moulton and Jermaine Ricketts 2 Economic Information and Publications Department Research and Economic Programming Division Bank of Jamaica February 2009 Abstract This paper seeks to explore the motives of migrants in sending remittances to Jamaica. Remittances were estimated by using the definition proposed in the sixth edition of the Balance of Payments manual and were utilized throughout the paper. The literature reveals three motives for sending remittances: altruism, self-interest/investment and tempered altruism or enlightened self- interest. A VAR model was used to examine the possible motives migrants might have when remitting to Jamaica. The results indicate a combination of altruistic and self-interest/investment motive for sending remittances. JEL Classification Numbers: C32, D64, F21, F24 Keywords: Remittances, Altruism, Investment, Motive, VAR. 1 BPM6 is the sixth edition of the Balance of Payments and International Investment Position Manual, which was published in December 2008. 2 The views expressed in this paper are those of the authors and do not necessarily reflect those of the Bank of Jamaica (BOJ) or its policy.
Transcript of Motives for sending Remittances to Jamaica - Bank of … · Motives for sending Remittances to...

Motives for sending Remittances to Jamaica:
An application of the BPM61 definition of Remittances
Chandar Henry, Jermaine Moulton and Jermaine Ricketts2 Economic Information and Publications Department
Research and Economic Programming Division Bank of Jamaica
February 2009
Abstract
This paper seeks to explore the motives of migrants in sending remittances to Jamaica.
Remittances were estimated by using the definition proposed in the sixth edition of the Balance of
Payments manual and were utilized throughout the paper. The literature reveals three motives for
sending remittances: altruism, self-interest/investment and tempered altruism or enlightened self-
interest. A VAR model was used to examine the possible motives migrants might have when
remitting to Jamaica. The results indicate a combination of altruistic and self-interest/investment
motive for sending remittances.
JEL Classification Numbers: C32, D64, F21, F24 Keywords: Remittances, Altruism, Investment, Motive, VAR. 1 BPM6 is the sixth edition of the Balance of Payments and International Investment Position Manual, which was published in December 2008. 2 The views expressed in this paper are those of the authors and do not necessarily reflect those of the Bank of Jamaica (BOJ) or its policy.

- 2 -
TABLE OF CONTENTS Page Number
Statistical Notes 3
1.0 Introduction 4
2.0 Measurement Issues of Remittances 5 2.1 Definition of Remittances 5 2.2 Application of the revised definition 7
3.0 Theories of Remittances 9 3.1 Self-interest 9 3.2 Pure Altruism 10 3.3 Tempered Altruism/Enlightened Self-interest 11
4.0 Data and Variable Selection 12
5.0 Stylized Facts 13
6.0 Empirical Methodology 14 6.1 The VAR 14 6.2 Other Tests 17
7.0 Results 17
8.0 Conclusion 21
9.0 Reference List 23
Appendices 27

- 3 -
STATISTICAL NOTES
Page Number
List of Tables
1. Summary of unit root tests on quarterly data 17
2. Variance decomposition of remittances for quarterly analysis 19
3. Summary of unit root tests on monthly data 20
4. Variance decomposition of remittances for monthly analysis 21
5. Latin America and Caribbean countries’ remittance details 28
6. Major components of remittances and the difference with the old defn 29
7. Key macroeconomic indicators 30
8. Macroeconomic shares 30
9. Selected ratios 31
10. Variable details 31
11. Correlation matrix for quarterly series 32
12. Correlation matrix for monthly series 32
List of Figures
1. Remittance inflows with the old and new definitions 7
2. Monthly average remittance inflows 8
3. Contribution of remittances by source country 8
4. Quarterly level series 33
5. Monthly level series 34
6. Impulse response functions for quarterly analysis 35
7. Impulse response functions for monthly analysis 36

- 4 -
1.0 INTRODUCTION
In light of the current global economic downturn, increasing attention has been placed on
remittances, as it is a significant international source of income for many developing
countries (LDCs). According to the World Bank (2008), remittance flows to LDCs
totalled US$251 billion in 2007.
The Latin America and Caribbean (LAC) region is one of the world’s largest recipients of
remittances. The region’s remittance inflows are important as it represents more than 10
per cent of GDP in several countries in the region (World Bank estimates, 2008)3.
Inevitably, these remittance inflows offer indispensable support in financing the current
account deficit faced by Jamaica and other countries in the region. The buoyancy of
remittances, according to Gupta (2005), has been instrumental in substantially mitigating
current account deficit on the balance of payments (BOP) account. Other studies have
concurred, as they have established a positive relationship between remittances and
current account balance (Alleyne, 2006; Aydas, 2005 and Jackson, 2005).
Remittances have become a stable source of foreign exchange for many developing
countries. In recent times, remittance inflows in some remittance-receiving countries
have surpassed other forms of foreign exchange flows, such as foreign direct investment
(FDI) and other types of private capital flows (Gupta, 2005). This is in line with the
findings of Jackson (2005), as he purported that the importance of remittances as a source
of foreign exchange in Jamaica becomes obvious when compared to the major traditional
foreign exchange earners such as tourist expenditures, FDI and alumina exports4.
Numerous studies have tried to examine the motives of migrants in sending remittances.
Investigating these motives is crucial, as remittances are perceived as an important source
of foreign exchange in emerging economies. Understanding the motives for remitting can
aid policy makers in understanding and facilitating remittances through the formal
3 See table 5 for further details. 4 See table 6 for further details for Jamaica.

- 5 -
financial system as well as channelling more remittances for investment purposes
(Schiopu and Siegfried, 2006).
Historically, the BOP manual (BPM) has defined the flows that are classified as
remittances. The sixth edition of the manual (BPM6) was published in December 2008
with several amendments, one of which was a change in the definition of remittances. It
was believed that a revision to the definition was necessary, as it would provide further
clarification on the flows that constitute remittances.
Using this revised definition of remittances, the paper aims to analyze the determinants of
these flows in order to uncover the motives of migrants for remitting to Jamaica from
January 1995 to September 2008. Studies have classified the determinants of remittances
as being either socio-demographic or macroeconomic in nature. For the purpose of this
paper, the focus is on macroeconomic determinants.
The remainder of the paper is organized as follows. The revised definition for remittances
based on the BPM6 is outlined in section 2. Section 3 outlines the main theories
suggested for remittances. Data and the variables used in this paper are discussed in
section 4. A descriptive behaviour of the data is given in section 5. Section 6 describes
the empirical methodology, while section 7 outlines the results. The paper is concluded in
section 8.
2.0 MEASUREMENT ISSUES OF REMITTANCES5
2.1 Definition of Remittances
According to the BPM5, remittances are defined primarily by ‘workers remittances’.
Workers remittances cover current transfers by migrants who are employed in new
economies and are considered residents in these new economies. The BPM6 implemented
an expansion in the items considered as remittances. First, the concept ‘workers
remittances’ was replaced with personal transfers. Second, three classifications of
remittances, namely: (1) personal remittances; (2) total remittances and (3) total
5 This section is based on the BPM6.

- 6 -
remittances and transfers to non-profit institutions serving households (NPISH)6 were
introduced.
Personal remittances represent personal transfers plus compensation of employees less
taxes and social contributions plus capital transfers between households less transport and
travel expenditures made by residents employed by non-residents. Personal transfers is a
new concept that consists of all current transfers in cash or in kind made or received by
resident households to or from non-resident households. These transfers are independent
of the source of income of the sender, irrespective of whether the sender receives income
from labour, entrepreneurial or property income, social benefits or any other type of
transfers. It is also independent of the relationship between the individuals.
Compensation of employees is comprised of wages, salaries, and other benefits, in cash
or kind, earned by individuals in economies other than those in which they are residents.
Included are contributions paid by employers, on behalf of employees, to social security
schemes or to private insurance or pension funds to secure benefits for employees.
Employees, in this context, include seasonal or other short-term workers (less than one
year) and border workers who have centres of economic interest in their own economies.
Capital transfers result in a change in the stocks of assets of one or both parties in a
transaction without affecting the savings of either party. The transfer of ownership of
non-financial assets or forgiveness of debt is defined as capital transfers in kind. A
transfer of cash is a capital transfer only when it is linked to or conditional on the
acquisition or disposal of a fixed asset.
Travel refers to the acquisition of goods and services in an economy by individuals who
are visiting but not resident in that economy. Travel excludes the acquisition of valuables
and consumer durables.
6 These refer to entities that provide goods and services to households or communities free of charge or at prices that are economically insignificant, except those that are controlled and financed by government units.

- 7 -
The second classification of remittances was total remittances. Total remittances include
personal remittances plus social benefits. Social benefits refer to returns payable under
social security funds and pension funds.
The final proposed classification of remittances was total remittance and transfers to non-
profit institutions serving households. Total remittances and transfers to NPISHs include
total remittances plus current and capital transfers to NPISHs. This classification of
remittances incorporates donations from overseas based governmental and private sector
enterprises to charitable organizations, such as Food for the Poor and Salvation Army.
This is the definition of remittances that was used in the paper to reveal the motives for
remitting to Jamaica.
2.2 Application of the revised definition
Figure 1, Remittance inflows based on the old and revised definitions.
0.0
50.0
100.0
150.0
200.0
250.0
Jan-95
Jul-95
Jan-96
Jul-96
Jan-97
Jul-97
Jan-98
Jul-98
Jan-99
Jul-99
Jan-00
Jul-00
Jan-01
Jul-01
Jan-02
Jul-02
Jan-03
Jul-03
Jan-04
Jul-04
Jan-05
Jul-05
Jan-06
Jul-06
Jan-07
Jul-07
Jan-08
Jul-08
Time
Flow
s $U
S M
n
Old Definition New Definition
Hurricane 'May Floods' Hurricane Ivan
Hurricane Dean
Source: BOJ
Looking at the results, the impact of applying the revised definition of remittances was
minimal in 1995 (figure 1). Although both definitions displayed a similar pattern (an
upward trend) over the review period, the difference between the two definitions
becomes greater as the series continues7. Also, remittances deviated slightly from its
normal trend path in 2002, 2004 and 2007. These deviations can be attributed to the May
floods in 2002 and hurricanes Ivan and Dean in 2004 and 2007, respectively. These
7 This is attributed to the increasing flows of current transfers to NPISH (see table 6).
- 8 -
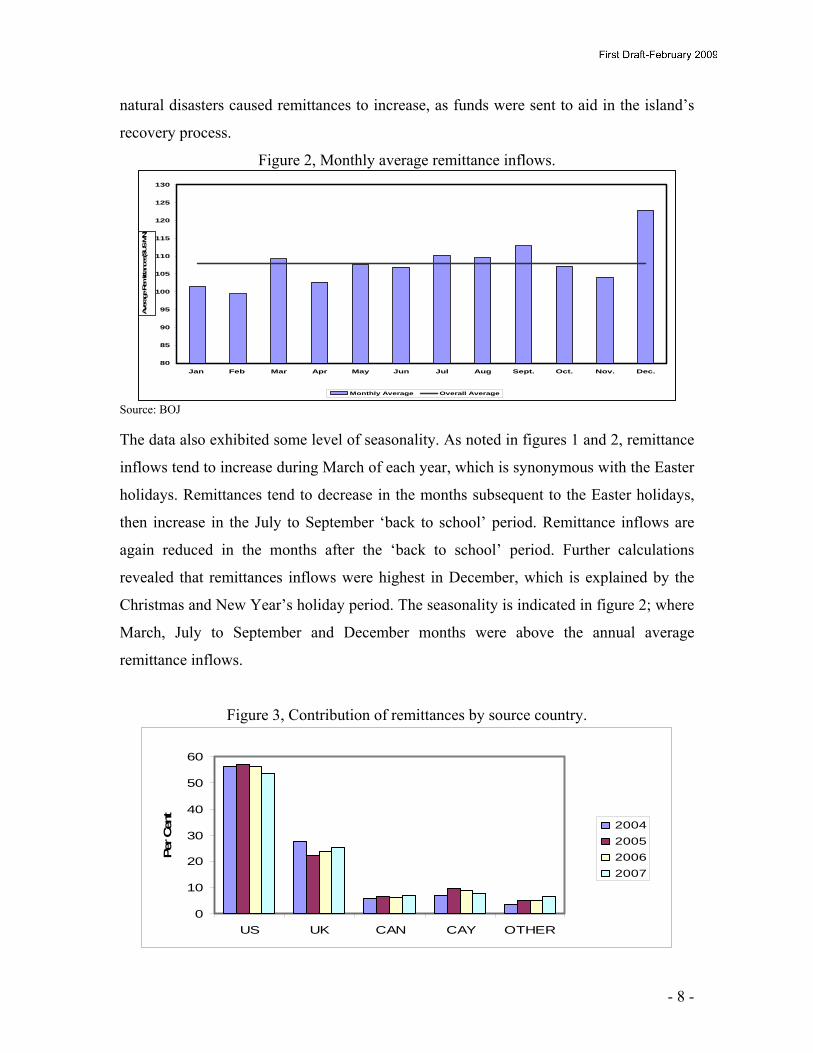
natural disasters caused remittances to increase, as funds were sent to aid in the island’s
recovery process.
Figure 2, Monthly average remittance inflows.
80
85
90
95
100
105
110
115
120
125
130
Jan Feb Mar Apr May Jun Jul Aug Sept. Oct. Nov. Dec.
Ave
rage
Rem
ittan
ces(
$US
MN)
Monthly Average Overall Average Source: BOJ The data also exhibited some level of seasonality. As noted in figures 1 and 2, remittance
inflows tend to increase during March of each year, which is synonymous with the Easter
holidays. Remittances tend to decrease in the months subsequent to the Easter holidays,
then increase in the July to September ‘back to school’ period. Remittance inflows are
again reduced in the months after the ‘back to school’ period. Further calculations
revealed that remittances inflows were highest in December, which is explained by the
Christmas and New Year’s holiday period. The seasonality is indicated in figure 2; where
March, July to September and December months were above the annual average
remittance inflows.
Figure 3, Contribution of remittances by source country.
0
10
20
30
40
50
60
US UK CAN CAY OTHER
Per C
ent
2004200520062007

- 9 -
Source: BOJ Analyzing the source of Jamaica’s remittances from 2004 to 2007 revealed that the US is
the largest source, accounting for, on average, approximately 55 per cent of total
remittances received. The US was followed by the United Kingdom, The Cayman Islands
and Canada which accounted for, on average, 25, 7 and 6 per cent, respectively.
3.0 THEORIES OF REMITTANCES8
A plethora of literature has examined the various theories of remittances. A common
trend within the literature is that there are three main rationales for sending remittances:
self-interest, pure altruism and tempered altruism or enlightened self-interest.
3.1 Self-Interest9
As its name suggest, the self-interest motive purports that migrants send money to
households in their home country in the pursuit of personal gain. A possible reason for
the self-interest motive is the intent of a migrant to return to his/her home country.
Vargas-Silva and Huang (2006) suggested that some emigrants send remittances because
they expect to return home in the future and can benefit from the household’s gratitude
from having sent remittances. Lucas and Stark (1985) mentioned that when emigrants
intend to return to their home country, they would send more remittances to ensure that
their social assets, that is, relationships with family and friends are intact.
Anticipation of a bequest is another factor that studies have offered in an attempt to
explain the self-interest motive for sending remittances. Those who support this view
suggested that a migrant might use remittances as a strategy for investing in future
inheritance (Rapoport and Docquier, 2005 and Hoddinott, 1994). Lucas and Stark (1985)
provided one of the best explanations for the self-interest motive in sending remittances.
They believed that if inheritance is conditioned by behaviour, an avaricious migrant’s
motive for supporting his or her family might include the concern to maintain favour in
the line of inheritance. Others have argued that if there is a minimal amount of money to
8 This section benefits from work done by Lucas and Stark, 1985; van Dalen et al, 2005 and Rapoport and Docquier, 2005. 9 Self-interest and investment are used interchangeably throughout the paper.

- 10 -
be remitted, parents and other family members can encourage transfers above this
benchmark level by offering a ‘reward’ in the form of land or any other inheritable assets
(Hoddinott, 1994).
The ‘exchange argument’ motive for remitting is a possible reason in explaining the self-
interest motive for sending remittances. Here, migrants use remittances to purchase
various types of services such as taking care of their assets or relatives (Rapoport and
Docquier, 2005). It is assumed that migrants trust family members or caretakers to
acquire and/or maintain the assets or relatives on their behalf.
In summarizing the self-interest theory of remittances, Rapoport and Docquier (2005)
claimed that a positive relationship exists between migrants sending remittances and their
income and education, recipient household wealth and short-run income shortfalls as well
as familial ties. They however stated that the relationship between migrants remitting and
the recipient households’ long run income is ambiguous.
3.2 Pure Altruism
For many persons, altruism would first come to mind when considering a migrant’s
motive for remitting. Altruism refers to a migrant’s genuine care for his/her remaining
household members. Lucas and Stark (1985) mentioned that migrants enjoy remitting
because they care about household consumption. Others have argued that only permanent
migrants remit for altruistic purposes, as temporary migrants are more likely to remit for
investment and future consumption smoothing (Glytsos, 2002).
With an altruistic model, the strength of family ties as well as the net earnings of
recipients will be important. According to the altruism model offered by Rapoport and
Docquier (2005), the more migrants earn, the more remittances recipient households
should anticipate. Furthermore, strong family ties between migrants and remaining
households would increase the probability of migrants remitting. On the other hand,
remittances would decline with an increase in the recipient household’s wealth and the
length of time the migrant stays in the host country.

- 11 -
Many studies have investigated the validity of this motive and most have concluded that
altruism is insufficient in explaining remittance inflows. Alleyne (2006) suggested that
there is a strong investment motive rather than an altruistic motive for remitting. Lucas
and Stark (1985) concurred, as they believed it is incorrect to assume that the
fundamental factor for sending remittance is altruism. van Dalen et al (2005) also
confirmed this claim, as he believed that trying to model altruism would yield
inconclusive results.
3.3 Tempered Altruism or Enlightened Self-interest
The tempered altruism or enlightened self-interest view of remittances is suggested as an
alternative to the pure altruistic and self-interest motives. This proposed motive views
remittances as a mutually beneficial arrangement between a migrant and his/her
household (Lucas and Stark, 1985). This mutually beneficial arrangement or ‘contract’
has two elements, investment and risk.
Many studies have viewed the sending of remittances as a repayment of the principal
invested by family members in the education of a migrant (Johnson and Whitelaw, 1974;
Rempel and Lobdell, 1978; van Datel et al, 2005). Rapoport and Docquier (2005)
concurred, as they viewed remittances as repayment of loans that were used to finance
the migrant’s investments in human capital or expenditures in the course of migration.
The higher the ‘loan’, the recipient family would expect more to be remitted.
Migration can be viewed as a household strategy for risk-diversification, a subtle form of
insurance (van Dalen et al, 2005). Lucas and Stark (1985) suggested that households
might want to spread their risk by sending some of their members away. It is purported
that migrants and the remaining household members should enter into a contract, wherein
migrants would insure the remaining household in the event there is a shortfall in their
income and the migrant would receive assistance from the remaining household members
in case of unemployment or retirement.

- 12 -
4.0 DATA AND VARIABLE SELECTION
Monthly and quarterly data spanning the period January 1995 to September 2008 were
collected. The existing literature classifies variables explaining remittances into either
host country or home country variables10. The home country variables used in the paper
were consumer price index (CPI), the end of period US selling rate (EX_RATE),
unemployment rate (UNEMP), remittance inflows (REM), and Jamaica’s Gross
Domestic Product (JAGDP). The US Gross Domestic Product (USGDP) was the only
host country variable used in this study. Interest rate differential (INT) was always
utilized in the paper.
The consumer price index was used to capture movement in prices. If the motive for
sending remittances was self-interest, then there would be a reduction in the amount sent
if there is inflation. If remittances were sent because of an altruistic motive, remittances
would increase in the presence of inflation.
The end of period US dollar selling rate was utilized, as it gives an indication of
Jamaica’s macroeconomic stability. An increase in the exchange rate is indicative of a
depreciation of the domestic currency, while a decrease reflects an appreciation of the
domestic currency.
A country’s unemployment rate is oftentimes used as an indication of its economic
performance. It has been argued that unemployment significantly influences remittances,
especially in developing countries (Loser et al, 2006). The correlation between
unemployment and remittances would be determined by migrants’ motives for remitting.
A negative relationship is expected if the fundamental rationale for remitting is for
investment purposes, whilst altruism would cause remittances to increase if
unemployment increases.
10 The home country refers to Jamaica, while the host country used in this paper was the US as more than half of the remittance flowing to Jamaica comes from the US (see figure 3).

- 13 -
Interest rate differential is the difference between the rates on the six-month Jamaica T-
bills and the six-month US T-bills. A large interest rate differential makes assets in the
domestic economy attractive (Williams, 2008). If remittances are sent for
investment/self-interest purposes, there will be an increase in the amount of remittances
sent. The opposite is true if remittances are sent to finance the consumption needs of a
migrant’s remaining household members.
The GDP of the US and Jamaica were used to depict income for migrants and household
members, respectively. If the host country’s economy grows, in this case the US, more
remittances would be expected in the home country, regardless of the motive for
remitting. On the other hand, economic growth in the home country would have an
unambiguous effect on remittances. If the remitter’s motive is investment oriented, then
less remittances will be sent. However, if altruism is the fundamental factor for remitting,
more remittances will be sent as there would be a reduction in household income.
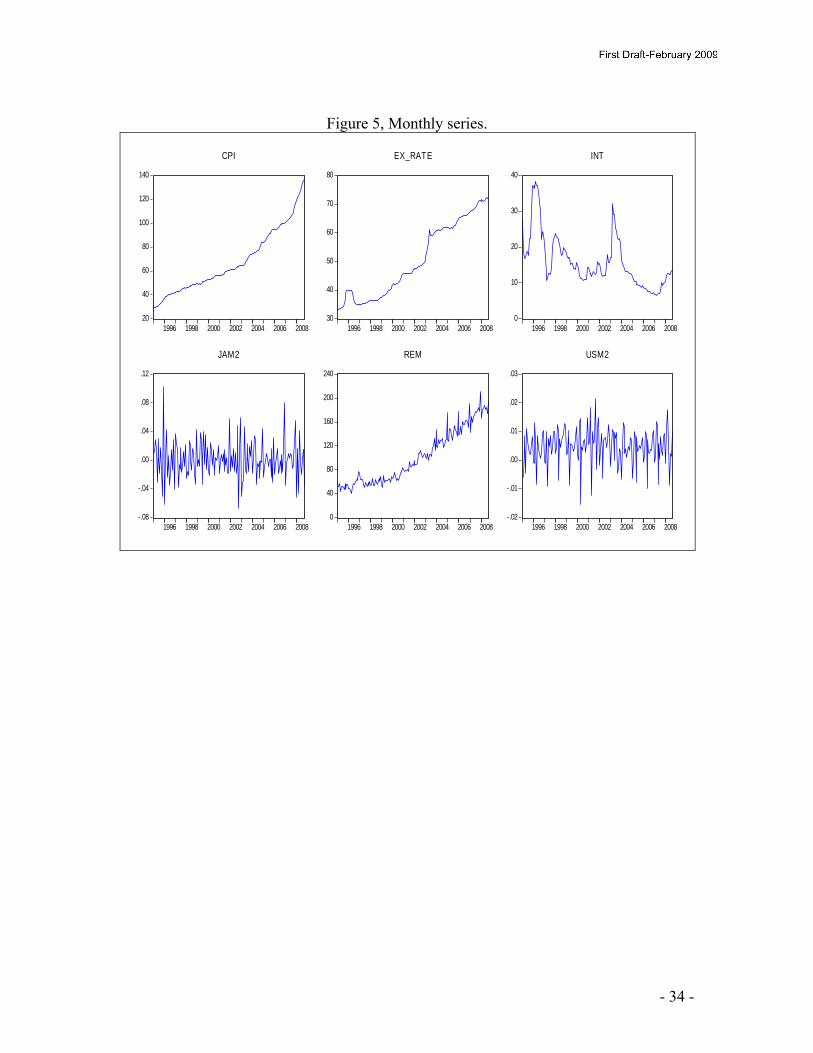
5.0 STYLIZED FACTS
This section reviews the behaviour of the variables (on a quarterly basis) used in the
paper except remittances. Quarterly CPI displayed an upward trend over the review
period; starting at 29.78, the lowest for the sample period and finished at 136.46 in
September 2008. The average quarterly CPI for the review period was 68.08. A
noticeable accelerated upward drift was observed in the series in the quarters subsequent
to hurricanes Ivan and Dean and in the three quarters of 2008.
The average end of period quarterly US selling rate was JA$50.36, with the highest
reported in the quarter ending September 2008 at JA$72.16 and the lowest at JA$33.41 in
the quarter ending March 1995. The Jamaican dollar depreciated against the US dollar
over the review period as depicted by the upward trend noticed in the series. However,
the Jamaican dollar showed some appreciation in the June and September quarters in
1996.

- 14 -
Unemployment rate for Jamaica at the beginning of the sample period was 16.37 per cent
and declined in the following two quarters. The series then started to trend upwards and
peaked in the quarter ending June 1997 at 17.2 per cent, the highest over the review
period. The unemployment rate remained relatively stable for the next five years, as it
moved within a 150 basis points band. Subsequent to the December 2002 quarter, the
unemployment rate started to fall and displayed more volatility. The lowest
unemployment rate was reported in September 2006 quarter at 9.25 per cent and the
average rate for the sample period was calculated at 13.66 per cent.
The average quarterly interest rate differential was calculated at 16.04 per cent. Further
examination of the data revealed that the widest differential was reported in the quarter
ending December 1995 at 37.15 per cent and the narrowest at 6.55 per cent in March
2007. Interest rate differential was most volatile in the three years of the financial sector
meltdown that took place in the island in the mid to late 1990s. The series became stable
after June 1999, especially for the quarters between March 2004 and June 2007.
Quarterly GDP growth, for Jamaica and the US was somewhat stable over the period
under consideration. A deeper examination of the data revealed that the average quarterly
GDP growth rate for Jamaica was 0.3 per cent, while the US quarterly average GDP
growth rate was 0.6 per cent.
6.0 EMPIRICAL METHODOLOGY
6.1 The VAR
Vector autoregression (VAR) is commonly utilized for forecasting systems of interrelated
time series and for analyzing the dynamic impact of random disturbances on the system
of variables (Eviews Users Guide II, 2007). VAR treats all variables in a model as
symmetrical without assuming whether a variable is dependent or independent. Thus,
VAR bypass the need for structural modelling by assuming each endogenous variable in
the system is a function of the lagged values of all the endogenous variables in the
system.

- 15 -
Consider an n-equation VAR. This equation can be represented in a matrix form as:
A(L)Yt = A+ εt [1]
where A(L) = 1 - a1L - a2L2 -…- anLn [2]
From equations [1] and [2], Yt is an n×1 vector of endogenous variables, A is an n×1
vector of constants and εt is an n×1 vector of random variables that may be
contemporaneously correlated, but are uncorrelated with their own lagged values and
uncorrelated with all of the right-hand side variables. A(L) is an n×n matrix of normalized
polynomial of the endogenous variables in lag operators, with the first entry of each
polynomial on A is unity. The VAR specified in [1] can be extended to include
exogenous variables, such as:
A(L)Yt = A + μxt + εt [3]
In [3], μ is an n×k coefficient matrix and xt is the k×1 vector of exogenous variables
and/or dummy variables.
The right-hand side of the equations in the VAR contains only the predetermined
variables. As a result, ordinary least squares (OLS) estimation can be applied, as the
estimates are asymptotically efficient and consistent. Before estimating the model, the lag
length must be chosen so that the actual data generating process can be captured. It is
important to not over fit (selecting a higher order lag length than the true lag length) and
thereby increase forecasting errors or under fit the VAR and generate autocorrelated
residuals. Several tests and lag length criteria have been purported to help select the
optimal lag length to use in VAR (see Lütkepohl, 1991). This paper uses the Akaike
Information Criterion (AIC), Hannan-Quinn Information Criterion (HQ) and the
Schwartz Criterion (SC) to select the appropriate lags to use in the VAR.
VAR provides impulse response functions and variance decompositions, which aid in the
interpretation of the results. Impulse response functions provide information to analyze
the dynamic behaviour of a variable due to innovations in other variables in the VAR.
The impulse response traces the time path of a variable in response to a shock in another

- 16 -
variable. The y-axis gives the intensity and direction of the shock, while the x-axis gives
the duration of the shock. This paper applied the Choleski decomposition to get the
impulse response functions. According to Doan (1984), the Choleski decomposition
method is ideal to identify orthogonalized innovations in each variable as well as the
dynamic responses of such innovations. This method imposes an ordering of the variables
in the VAR and attributes all of the effect of any common component to the variable that
comes first in the VAR system (Eviews User Guide II, 2007). The theorized ordering of
the variables was:
REMUNEMPJAGDPCPIEX_RATEINTUSGDP →→→→→→ [4]
This ordering is informed on the a priori knowledge that an unexpected high foreign
(US)GDP growth is believed to be potentially inflationary if the economy is close to full
capacity. This will cause bond prices to drop and yield and interest rates to rise. Interest
rates are theorized to affect exchange rates through induced portfolio adjustments
(McFarlane, 2002). For example, a higher rate of return on investments overseas could
lead to greater demand for foreign currency, which influences the exchange rate.
Exchange rate is expected to influence the CPI through the pass-through effect. The CPI
in turn is expected to influence local GDP in the sense that an increase in prices will lead
to a reduction in demand, which could result in a contraction in GDP (the opposite is also
true). Local GDP is expected to have a direct impact on the unemployment level/rate,
which could influence the amount of remittances received.
Whereas the impulse response function illustrate the qualitative response of a variable in
the system to shocks of another variable, variance decomposition separates the variation
in an endogenous variable into the component shocks to the VAR (Eviews User Guide II,
2007). Thus, the variance decomposition provides information about the relative
importance of each innovation. The paper also interprets the results of the VAR through
variance decomposition analysis11.
11 The VAR coefficients were not interpreted, as coefficients on successive lags tend to oscillate and there may exist complicated cross equation feedback (Sims, 1980).

- 17 -
6.2 Other tests
The time series property of each variable was evaluated using the Augmented Dickey-
Fuller and the Phillips-Perron unit root tests. Diagnostic checks for heteroskedasticity and
serial correlations were conducted to ensure the validity of the model as well as to
guarantee that the results garnered are efficient and unbiased.
Seasonal fluctuations in data make it difficult to analyze, whether the changes in the data
for a specified period reflect increases or decreases in the level of the data or due to
regularly occurring variation12. The use of raw data in such cases can be quite misleading.
Remittance inflows displayed some seasonality thus, the ratio to moving average method
or the multiplicative decomposition approach was used to seasonally adjust the series.
7.0 RESULTS
The results of the unit root tests on the quarterly series revealed that only JAGDP and
USGDP were level stationary. All the other variables were stationary after differencing
was applied (see table 1).
Table 1, Summary of unit root test results on the quarterly data. Augmented Dickey-Fuller Phillips-Perron
Variables Level Transformed
series1
Order of
integrationLevel
Transformed
series
Order of
integration
CPI 3.85 -3.91 I(1) 2.74 -3.9 I(1)
EX_RATE -0.01 -4.6 I(1) 0.3 -4.3 I(1)
INT -2.12 -6.04 I(1) -2.32 -5.94 I(1)
UNEMP -1.36 -8.53 I(1) -1.12 -18 I(1)
JAGDP -15.14 N/A I(0) -9.44 N/A I(0)
REM -1.69 -7.06 I(1) -2.56 -22.35 I(1)
USGDP -5.47 N/A I(0) -5.46 N/A I(0) Note: 1. Augmented Dickey-Fuller and Phillips-Perron critical value =-3.43.
The lag length criteria inform that a lag length of one should be used in the VAR. The
White’s heteroskedasticity test with cross terms revealed that there was evidence of 12 Explanatory Notes-Monthly Seasonal Adjustment of Statistical Time Series.

- 18 -
homoskedastic error terms. This attest to the validity of the specifications as well as the
unbiasedness and efficiency of the estimates. Additionally, the LM serial correlation test
and the correlograms conclude that the residuals are serially uncorrelated. Further, the
AR roots graph indicated that all the variables in the VAR were stationary as all the
characteristic roots are less than unity, that is, lies inside the unit circle.
Impulse Response13 and Variance Decomposition analysis on the quarterly data
The results indicated that remittance inflows are strongly autoregressive over the forecast
horizon. Examining the response of remittance to the shock to domestic unemployment
rate revealed an investment motive, as depicted by the negative response observed in that
function. In addition, the shock to domestic economic growth insinuated an altruistic
motive as indicated by the negative response seen by remittances.
The shock to CPI has a small but positive effect on remittances, which decays after three
quarters. This is in line with the altruistic argument for sending remittances. Of
significance is the response of remittances to innovations in the exchange rate variable.
Remittances responded with a lag and subsequently declined, suggesting that devaluation
of the domestic currency would cause fewer remittances to be sent.
The simulations implied that a shock to interest rate differential innovations would result
in more remittances being sent. This positive response of remittances from a shock to
remittances indicates that there is room for policies that can encourage migrants to invest
locally in financial instruments.
Remittances responded positively to the shock in USGDP, which confirms a priori
expectation. That is, remittances should increase with increasing income of migrants.
Equally, a reduction in the income generating potential of migrants would lead to a
reduction in remittances to Jamaica. Overall, the results indicate a combination of the
altruistic and investment motives.
13 The graphs can be viewed in appendix 6.

- 19 -
Table 2 shows the variance decomposition of remittances over six quarters. The results
indicated that remittances accounted for most of the variability in itself. Next to
remittances was USGDP, which accounted for, on average, 12 per cent of the innovations
in remittances. This result confirmed the findings of Vargas-Silva and Huang (2006),
who indicated that host country determinants are more important in explaining remittance
flows. Interest rate differential and home country economic growth also contributed
significantly to the variations of remittances. These results highlight the importance of
the investment driven determinants. CPI explained the smallest proportion of the variance
in remittances.
Table 2, Variance decomposition of remittances (%). Horizon REM UNEMP JAGDP CPI EX_RATE INT USGDP
1 100 0 0 0 0 0 0
2 73.73 4.93 5.61 1.67 0.01 2.47 11.57
3 62.31 10.59 4.08 1.49 1.74 7.41 12.37
4 59.09 10.48 5.10 1.43 2.85 8.53 12.53
5 59.83 9.95 4.56 1.49 2.82 8.49 12.86
6 59.7 10.03 4.53 1.49 2.82 8.56 12.88
Sensitivity Analysis
The validity of the results garnered from the VAR was tested by using monthly data for
most of the variables14. Money supply (M2) was used as a proxy for both domestic and
host country economic growth. The rationale for using M2 as the proxy for economic
growth was based on Fisher’s equation of exchange:
MV = PY [5]
Where M is the quantity of money, V is the velocity of circulation of money (which
serves as the link between money and output), P is the price level and Y is aggregate
output/income. From this equation, it is believed that the demand for money is a function
of an economy’s wealth.
14 UNEMP, JAGDP AND USGDP were not included in this analysis due to the unavailability of monthly data.

- 20 -
The unit root tests revealed that all the variables in consideration were non-stationary
except JAM2 and USM2. First differencing was applied to the non-stationary variables.
Table 3, Summary of unit root test on the monthly data. Augmented Dickey-Fuller Phillips-Perron
Variables Level Transformed
series1
Order of
integrationLevel
Transformed
series
Order of
integration
CPI 3.85 -3.91 I(1) 3.28 -6.43 I(1)
EX_RATE -0.01 -4.6 I(1) -2.02 -8.71 I(1)
INT -2.12 -6.04 I(1) -2.62 -11.51 I(1)
JAM2 -10.69 N/A I(0) -22.93 N/A I(0)
REM -1.71 -5.36 I(1) -2.52 -7.52 I(1)
USM2 -11.59 N/A I(0) -15.02 N/A I(0) Note: 1. Augmented Dickey-Fuller and Phillips-Perron critical value =-3.43.
The lag length criteria suggested that a lag of two should be incorporated in the VAR.
The diagnostic checks revealed homoskedastic errors and serially uncorrelated residuals.
Furthermore, the AR roots graph indicated that all the variables in the VAR were
stationary.
Impulse Response15 and Variance Decomposition analysis on the monthly data
The impulse response functions for the monthly variables confirm most of the results that
were garnered from the quarterly analysis. The only difference was with the response of
remittances to a shock in exchange rate. With monthly data, remittances respond
positively to a shock in exchange rate, while the simulation in exchange rate resulted in a
negative response by remittances when quarterly data was applied. The positive response
of remittances to a shock in exchange rate suggests that a devaluation in the domestic
currency will lead to more remittances flowing into Jamaica.
The variance decomposition indicated that remittances accounted for most of the
variability in itself. USM2 was next to remittances, which confirms the results from the
quarterly analysis as well as further highlighting the importance of host country
15 The graphs can be viewed in appendix 6.

- 21 -
determinants in explaining remittance flows. Interest rate differential also was significant
in explaining the variability in remittances, followed by JAM2. The CPI and exchange
rate variables do not explain the variance in remittances significantly.
Table 4, Variance decomposition of remittances (%). Horizon REM JAM2 CPI EX_RATE INT USM2
1 100 0 0 0 0 0
2 86.42 1.17 0.06 0.33 5.42 6.6
3 75.67 6.49 0.56 1.02 7.37 8.89
4 66.19 7.83 2.26 2.82 9.25 11.65
5 62.29 8.98 2.31 3.02 10.32 13.08
6 59.77 9.09 2.42 3.27 11.62 13.83
8.0 CONCLUSION
The paper aims to uncover the motives migrants have in sending remittances to Jamaica
from January 1995 to September 2008. Looking at the revised definition for remittances,
as proposed by the BPM6, both definitions displayed similar pattern, that is, an upward
trend over the review period, with a gradual divergence observed between the two
definitions. Although the review period for the paper ends at September 2008,
preliminary data subsequent to September 2008 reveals a deceleration in remittances to
Jamaica. This reduction in remittances is predicated by the current global economic
downturn, which is consistent with the findings from our analysis. The literature revealed
three main motives for sending remittances: altruism, self-interest and tempered
altruism/enlightened self-interest. The data indicated that more than half of all
remittances to Jamaica originate from the US, followed by the United Kingdom and the
Cayman Islands. Furthermore, remittances have consistently been a main source of
foreign exchange for the island and an indispensable support for financing Jamaica’s
current account deficit.
A VAR framework was applied to quarterly data and it was discovered that a mixture of
altruistic and investment motives were present in sending remittances to Jamaica. The
VAR also points to the importance of host country variable in influencing the amount of

- 22 -
remittances received, as indicated by the variance decomposition. In testing the validity
of the quarterly analysis, monthly data was applied. The results confirmed most of the
results that were garnered from the quarterly analysis.
The main policy implication from these findings is the need for effective policies to be
implemented to channel remittances for investment purposes. These policies could be in
the form of a tax concession for remitters or other non-fiscal policies. To qualify for these
benefits, migrants would have to submit proof of sending remittances. Additionally, the
government could organize a centralized remittance bureau, whose mandate would be to
promote the use of remittances for economic development.
Further work on remittances to Jamaica is definitely encouraged. These could include
other areas on the importance of remittances to Jamaica that were not highlighted in this
paper.

- 23 -
9.0 REFERENCE LIST
Acosta, Pablo, Cesar Calderon, Pablo Fajnzylber, and Humberto Lopez. 2006.
"Remittances and Development in Latin America." World Economy 29, no. 7: 957-987.
Akkoyunlu, Sule, and Boriss Siliverstovs. 2007. "The Role of Remittances in Migration
Decision: Evidence from Turkish Migration." German Institute of Economic Research Discussion Papers, no. 691.
Alleyne, Dillon. 2006. "Motivations to Remit in CARICOM: A GMM Approach." Social
and Economic Studies 55, no. 3: 69-87. Alper, Ahmet Murat, and Bilin Neyapti. 2006. "Determinants of Workers' Remittances:
Turkish Evidence from High-Frequency Data." Eastern European Economics 44, no. 5: 91-100.
Amuedo-Dorantes, Catalina, and Susan Pozo. 2006. "Remittance Receipt and Business
Ownership in the Dominican Republic." World Economy 29, no. 7: 939-956. Aydas, Osman Tuncay, Kivilcim Metin-Ozcan, and Bilin Neyapti. 2005. "Determinants
of Workers' Remittances: The Case of Turkey." Emerging Markets Finance and Trade 41, no. 3: 53-69.
Balance of Payments and International Investment Position Manual, 6th Edition. 2008.
IMF: Washington D.C. Chami, Ralph, Connel Fullenkamp, and Samir Jahjah. 2003. "Are Immigrant Remittance
Flows a Source of Capital for Development." IMF Working Paper, no. 189. Clark, Ken, and Stephen Drinkwater. 2007. "An Investigation of Household Remittance
Behaviour: Evidence from the United Kingdom." The Manchester School 75, no. 6: 717-741.
Doan, Thomas, Robert Litterman, and Christopher Sims. 1984. "Forecasting and
Conditional Projection Using Realistic Prior Distributions." Econometric Reviews 3, no. 1: 1-100.
Docquier, Hillel, and Frederic Rapoport. 2005. "The Economics of Migrants’
Remittances." The Institute for the Study of Labour Discussion Papers, no. 1531. Enders, Walter. 2004. "Applied Econometric Time Series (2nd ed.)." New Jersey: John
Wiley & Sons. Engle, Robert F., and Clive W. J. Granger. 1987. "Co-integration and Error Correction:
Representation, Estimation, and Testing." Econometrica 55, no. 2: 251-276.

- 24 -
Eviews 6 User’s Guide II. 2007. Funkhouser, Edward. 1995. "Remittances from International Migration: A Comparison of
El Salvador and Nicaragua." Review of Economics and Statistics 77, no. 1: 137-146.
Glytsos, Nicholas P. 2002. "Dynamic effects of Migrant Remittances on Growth: An
Econometric Model with an Application to Mediterranean Countries." Centre of Planning and Economic Research, no.74.
Gupta, Poonam. 2005. "Macroeconomic Determinants of Remittances: Evidence from
India." IMF Working Paper, no. 224. Jackson, Dwayne. 2005. "Remittance Inflows in Jamaica." BOJ Working Paper. Johnson, George E., and W. E. Whitelaw. 1974. "Urban-Rural Income Transfers in
Kenya: An Estimated-Remittances Function." Economic Development and Cultural Change 22, no. 3: 473-479.
Hayle, Elaine. 2005. "Remittance Inflows and Jamaica." BOJ Working Paper. Hoddinott, John. 1994. "A Model of Migration and Remittances Applied to Western
Kenya." Oxford Economic Papers 46, no. 3: 459-476. Kritz, Mary M., and Douglas T. Gurak. 2001. "The Impact of Immigration on the Internal
Migration of Natives and Immigrants." Demography 38, no. 1: 133-145. Lake, Lisa. 2005. "Remittances and the Jamaican Economy: From Fundamentals to
Effective Policy Recommendations." BOJ Working Paper. Lopez, Jose Roberto, and Mitchell A. Seligson. 1991. "Small Business Development in
El Salvador: The Impact of Remittances." In Migration, remittances, and small business development: Mexico and Caribbean Basin countries, 175-206. Series on Development and International Migration in Mexico, Central America, and the Caribbean Basin, vol. 4, 1991.
Loser, Claudio, Caitlin Lockwood, Adam Minson and Lucia Balcazar. 2006. "The
Macro-Economic Impact of Remittances in Latin America- Dutch Disease or Latin Cure?" XXIII G24 Technical Group Meeting: Suntec, Singapore.
Lucas, Robert E. B., and Oded Stark. 1985. "Motivations to Remit: Evidence from
Botswana." Journal of Political Economy 93, no. 5: 901-918. Lütkepohl, Helmut. 1993. "New Introduction to Multiple Time Series Analysis." New
York: Springer-Verlag.

- 25 -
McFarlane, Lavern. 2002. "Consumer Price Inflation and Exchange Rate Pass-Through in
Jamaica." BOJ Working Paper. McLean, Esmond. 2008." An Investigation of Recent trends In the Remittance Industry:
Evidence from Jamaica." BOJ Working Paper. Moulton, Jermaine. 2007. "Are Interest Rate Spreads Viable Policy Targets?" Central
Bank of Trinidad and Tobago Working Paper. Orozco, Manuel. 2007. "Migrant Foreign Savings and Asset Accumulation." In Reducing
Global Poverty: The Case for Asset Accumulation, 225-238. Washington, D.C.: Brookings Institution Press, 2007.
Ozcicek, Omer, and W. Douglas McMillin. 1999. "Lag Length Selection in Vector
Autoregressive Models: Symmetric and Asymmetric Lags." Applied Economics 31, no. 4: 517-524.
Ramirez, Miguel D., and Hari Sharma. 2008. "Remittances and Growth in Latin America:
A Panel Unit Root and Panel Cointegration Analysis." Department of Economics Working Paper no. 51: Yale University.
Rempel, Henry, and Richard A. Lobdell. 1978. "The Role of Urban-to-Rural Remittances
in Rural Development." Journal of Development Studies 14, no. 3: 324-341. Salisu, Mohammed. 2005. "The Role of Capital Flight and Remittances in Current
Account Sustainability in Sub-Saharan Africa." African Development Review/Revue Africaine de Developpement 17, no. 3: 382-404.
Schiopu, Ioana, and Nikolaus Siegfried. 2006. “Determinants of Workers' Remittances -
Evidence from the European Neighbouring Region.” ECB Working Paper, no. 688.
Sims, Christopher A. 1980. "Macroeconomics and Reality." Econometrica 48, no.1:1-48. Tahir, Rizwan, and Ahmed Abdul Ghani. 2006. "Modelling Bahrain’s Economy: A
Vector Autoregression (VAR) Approach." Tracey, Marlon. 2007. "A VAR Analysis of the Effects of Macroeconomic Shocks on
Banking Sector Loan Quality in Jamaica." BOJ Working Paper. van Dalen, Hendrik P., George Groenewold, and Tineke Fokkema. 2005. "The Effect of
Remittances on Emigration Intentions in Egypt, Morocco, and Turkey." Population Studies 59, no. 3: 375-392.

- 26 -
Vargas-Silva, Carlos, and Peng Huang. 2006. "Macroeconomic Determinants of Workers' Remittances: Host versus Home Country's Economic Conditions." Journal of International Trade and Economic Development 15, no. 1: 81-99.
Williams, Kamilah. 2008. "The International Oil Market: An Application of the Three-
Agent Model." BOJ Working Paper. Williams, Pierre. 2008. "Estimating Jamaica’s Real Equilibrium Exchange Rate." BOJ
Working Paper. World Bank Publications, World Bank. 2008.

- 27 -
APPENDICES
• Appendix 1 (A1): LAC Remittance Details
• Appendix 2 (A2): Jamaica’s Main Foreign Exchange Earners
• Appendix 3 (A3): Variable Definition and Data Information
• Appendix 4 (A4): Bivariate Associations
• Appendix 5 (A5): Level Series
• Appendix 6 (A6): Impulse Response Functions

- 28 -
A1: LAC remittance details
Table5, Remittance details for the first 25 LAC countries for 2007.
Countries
Remittance
Inflows
(US$Mn) World Rank LAC Rank
Remittance
as a Share of
GDP (%)
Mexico 25037 3 1 2.8
Colombia 4523 21 2 3.0
Brazil 4382 23 3 0.3
Guatemala 4254 24 4 10.6
El Salvador 3711 28 5 18.4
Dominican Republic 3414 30 6 9.3
Ecuador 3094 32 7 6.9
Honduras 2625 37 8 24.5
Jamaica 2325 41 9 18.1
Peru 2131 42 10 1.9
Haiti 1222 62 11 20.0
Bolivia 927 69 12 6.6
Nicaragua 740 76 13 12.1
Costa Rica 635 82 14 2.3
Argentina 604 84 15 0.2
Paraguay 469 90 16 3.2
Guyana 278 99 17 23.5
Panama 180 107 18 0.8
Barbados 140 115 19 N/A
Suriname 140 116 20 N/A
Venezuela, RB 136 118 21 0.1
Uruguay 97 124 22 0.4
Trinidad & Tobago 92 125 23 0.4
Belize 75 127 24 5.3
Grenada 55 129 25 N/A Source: World Bank

- 29 -
A2. Main foreign exchange earners
Table 6, Major components of remittances and the difference with the old definition (US$Mn)
Year
Personal
Transfer
& Social
Benefits
Net
compensation
of employees
Total
Remittances
Current
Transfers
to NPISH
Total
Remittances
& transfers to
NPISH
Old
Definition of
Remittances
Difference
1995 582.3 38.4 620.7 8.4 629.1 582.3 46.8
1996 635.4 37.6 673.0 8.4 681.4 635.4 46.0
1997 654.4 53.8 708.2 9.2 717.4 654.4 63.0
1998 654.7 61.1 715.8 9.1 724.9 654.7 70.2
1999 681.0 65.2 746.2 9.6 755.8 681.0 74.8
2000 789.5 53.8 843.3 7.8 851.1 789.5 61.6
2001 940.1 67.2 1007.3 8.1 1015.4 940.1 75.3
2002 1130.6 74.5 1205.1 74.5 1279.6 1130.6 140.0
2003 1269.5 71.6 1341.1 84.0 1425.1 1269.5 155.6
2004 1465.9 90.2 1556.1 133.3 1689.4 1465.9 223.5
2005 1621.2 98.9 1720.1 130.1 1850.2 1621.2 229.0
2006 1769.3 102.4 1871.7 156.4 2028.1 1769.3 258.7
2007 1964.3 99.3 2063.6 261.6 2325.0 1964.3 360.7
2008* 1554.7 62.0 1616.7 196.2 1812.9 1554.7 258.2 * The 2008 value excludes December 2008 quarter, due to the unavailability of the data. Source: BOJ

- 30 -
Table 7, Key macroeconomic indicators (US$ Mn).
Year Remittances Foreign Direct Investment
Tourist Expenditure Exports Alumina
Exports Imports GDP
1995 629.1 147.4 1068.8 1796.0 632.0 2625.3 6459.1
1996 681.4 183.7 1092.3 1721.0 607.0 2715.2 7462.2
1997 717.4 203.3 1130.8 1700.3 651.7 2832.6 8394.3
1998 724.9 369.1 1196.9 1613.4 600.7 2743.9 8718.3
1999 755.8 523.7 1279.6 1499.1 626.5 2685.6 8795.8
2000 851.1 455.8 1332.6 1562.8 684.3 3004.3 8929.4
2001 1015.4 613.9 1232.2 1454.4 642.6 3072.6 9087.9
2002 1279.6 478.8 1208.7 1309.1 603.8 3179.6 9652.2
2003 1425.1 720.7 1355.1 1385.6 688.4 3328.2 9368.3
2004 1689.4 601.6 1437.9 1601.6 814.6 3545.1 10111.4
2005 1850.2 682.5 1545.1 1664.3 920.3 4245.6 11112.6
2006 2028.1 882.2 1870.1 2133.62 1040.5 5077.0 11963.9
2007 2325.0 866.5 1905.3 2226.4 1193.1 6614.8 12873.3Source: BOJ
Table 8, Macroeconomic shares (%).
Year Remittances as a Share of
GDP
FDI as a Share of
GDP
Tourist Expenditure as
a Share Of GDP
Exports as a Share of
GDP
Alumina Exports as a Share Of
GDP 1995 9.7 2.3 16.5 27.8 9.8 1996 9.1 2.5 14.6 23.1 8.1 1997 8.6 2.4 13.5 20.3 7.8 1998 8.3 4.2 13.7 18.5 6.9 1999 8.6 6.0 14.5 17.0 7.1 2000 9.5 5.1 14.9 17.5 7.7 2001 11.2 6.8 13.6 16.0 7.1 2002 13.3 5.0 12.5 13.6 6.3 2003 15.2 7.7 14.5 14.8 7.3 2004 16.7 5.9 14.2 15.8 8.1 2005 16.7 6.1 13.9 15.0 8.3 2006 17.0 7.6 15.6 17.8 8.7 2007 18.1 6.7 14.8 17.3 9.3
Source: BOJ

- 31 -
Table 9, Selected ratios (%).
Year Remittances as a share of Tourist Exp
Remittance as a share of
Exports
Remittances as a share of
FDI
Remittances as a share of
Imports
Remittances as a share of
Alumina Exports
1995 58.9 35.0 426.8 24.0 99.5
1996 62.4 39.6 370.9 25.1 112.3
1997 63.4 42.2 352.9 25.3 110.1
1998 60.6 44.9 196.4 26.4 120.7
1999 59.1 50.4 144.3 28.1 120.6
2000 63.9 54.5 186.7 28.3 124.4
2001 82.4 69.8 165.4 33.0 158.0
2002 105.9 97.7 267.3 40.2 211.9
2003 105.2 102.9 197.7 42.8 207.0
2004 117.5 105.5 280.8 47.7 207.4
2005 119.7 111.2 271.1 43.6 201.0
2006 108.5 95.1 223.6 40.0 194.4
2007 122.0 104.4 268.3 35.1 194.9 Source: BOJ
A3. Variable Definitions and Data Information Table 10, Variable details.
Variable Definition Unit Period Source
CPI Consumer price index Index No. 1995-2008 BOJ
EX_RATE E.O.P US selling rate Ja dollars 1995-2008 BOJ
INT Interest rate differential Percent 1995-2008 BOJ
JAGDP Jamaica’s GDP growth Percent 1997-2008 BOJ/STATIN
JAM2 Jamaica M2 growth Percent 1995-2008 BOJ
REM Total remittance inflows US$ Mns 1995-2008 BOJ
UNEMP Ja’s unemployment rate Percent 1996-2008 BOJ/STATIN
USGDP US GDP growth Percent 1998-2008 Bloomberg LP software
USM2 US M2 Percent 1995-2008 Bloomberg LP software

- 32 -
A4. Bivariable associations
Table 11, Correlation matrix for quarterly series. CPI EX_RATE INT JAGDP REM UNEMP USGDP
CPI 1.0000
EX_RATE 0.9571 1.0000
INT -0.3261 -0.3628 1.0000
JAGDP -0.0094 0.0187 0.0782 1.0000
REM 0.4568 -0.1521 0.4312 -0.1359 1.0000
UNEMP -0.4248 -0.6693 0.2652 -0.0541 -0.4475 1.0000
USGDP -0.0423 -0.045 0.1775 -0.1758 0.6852 0.0769 1.0000
The correlation matrix indicates a positive with remittances and CPI, US GDP, interest
rate differential, while a negative between remittances and Jamaica’s GDP, exchange rate
and Jamaica’s unemployment rate.
Table 12, Correlation matrix for monthly series. CPI EX_RATE INT JAM2 REM USM2
CPI 1.0000
EX_RATE 0.4549 1.0000
INT -0.5785 -0.5080 1.0000
JAM2 0.3961 0.4368 -0.3681 1.0000
REM 0.2619 0.1638 0.5629 -0.4195 1.0000
USM2 0.4682 0.4813 -0.5972 0.4646 0.4634 1.0000
The correlation matrix reveals that remittances is positively correlated with CPI,
exchange rate, interest rate differentials and US M2, while a negative associated is
observed between remittances and Jamaica’s M2.

- 33 -
A5. Level Series
It is obvious that JAGDP, JAM2, USM2 and USGDP were the only stationary variables.
Figure 4, Quarterly series.
20
40
60
80
100
120
140
1996 1998 2000 2002 2004 2006 2008
CPI
8
10
12
14
16
18
1996 1998 2000 2002 2004 2006 2008
JAEMP
30
40
50
60
70
80
1996 1998 2000 2002 2004 2006 2008
EX_RATE
0
10
20
30
40
1996 1998 2000 2002 2004 2006 2008
INT
40
80
120
160
200
240
1996 1998 2000 2002 2004 2006 2008
REM
-.04
-.02
.00
.02
.04
.06
.08
1996 1998 2000 2002 2004 2006 2008
JAGDP
-.005
.000
.005
.010
.015
.020
1996 1998 2000 2002 2004 2006 2008
USGDP
- 34 -
Figure 5, Monthly series.
20
40
60
80
100
120
140
1996 1998 2000 2002 2004 2006 2008
CPI
30
40
50
60
70
80
1996 1998 2000 2002 2004 2006 2008
EX_RATE
0
10
20
30
40
1996 1998 2000 2002 2004 2006 2008
INT
-.08
-.04
.00
.04
.08
.12
1996 1998 2000 2002 2004 2006 2008
JAM2
0
40
80
120
160
200
240
1996 1998 2000 2002 2004 2006 2008
REM
-.02
-.01
.00
.01
.02
.03
1996 1998 2000 2002 2004 2006 2008
USM2

- 35 -
A6. Impulse response functions
Figure6, Impulse response functions on the quarterly variables.
-2.0
-
-1.0
-
0.0
1.0
2.0
1 2 3 4 5 6 7 8 9 10
Response of DREM to DUNEMP
-4
-2
0
2
4
6
8
1 2 3 4 5 6 7 8 9 10
Response of DREM to DREM
-4
-2
0
2
4
1 2 3 4 5 6 7 8 9 10
Response of DREM to JAGDP
-4
-2
0
2
4
6
8
1 2 3 4 5 6 7 8 9 10
Response of DREM to DCPI
-1.0
-0.5
0
0.5
1.0
1 2 3 4 5 6 7 8 9 10
Response of DREM to DEX_RATE
-4
-2
0
2
4
6
8
1 2 3 4 5 6 7 8 9 10
Response of DREM to DINT
-4
-2
0
2
4
1 2 3 4 5 6 7 8 9 10
Response of DREM to USGDP
Response to Cholesky One S.D. Innovations
-1.0 -0.5 0.0 0.5
1.0
1 2 3 4 5 6 7 8 9 10
R e s p o ns e o f
D R E M to
D C P I
-1.0 -0.5 0.0 0.5
1.0
1 2 3 4 5 6 7 8 9 10
R e s p o n s e o f D R E M t o D IN T

- 36 -
Figure7, Impulse response functions on the monthly variables.
-8
-4
0
4
8
12
1 2 3 4 5 6 7 8 9 10
Response of DREM to DREM
-2
-1
0
1
2
1 2 3 4 5 6 7 8 9 10
Response of DREM to DINT
-1
-0.5
0
0.5
1
1 2 3 4 5 6 7 8 9 10
Response of DREM to DCPI
-2
-1
0
1
2
1 2 3 4 5 6 7 8 9 10
Response of DREM to DJAM2
-1
-0.5
0
0.5
1
1 2 3 4 5 6 7 8 9 10
Response of DREM to DEX_RATE
-2
-1
0
1
2
1 2 3 4 5 6 7 8 9 10
Response of DEX_RATE to USM2
Response to Cholesky One S.D. Innovations
Response of DREM to USM2