
Motion graphic title page headline long 34pt - ceconomy.de · August/September 2019 // 6. CECONOMY...
45
Investor Presentation August/September 2019
Transcript of Motion graphic title page headline long 34pt - ceconomy.de · August/September 2019 // 6. CECONOMY...

Investor Presentation
August/September 2019

// 2August/September 2019
(segmental or other) information in the consolidated financialstatements of the former METRO Group and, thus, may not befully comparable to such financial statements. Historicalinformation contained in this presentation which is not taken orderived from the unaudited combined financial statements ismostly based on or derived from the consolidated (interim)financial statements for the respective period. Financialinformation with respect to the business of MediaMarktSaturnRetail Group is particularly based on or derived from the segmentreporting contained in these financial statements. In addition, thehistorical financial and operative information included in thispresentation is not necessarily indicative for the operationalresults, the financial position and/or the cash flow of theCECONOMY business on a stand-alone basis neither in the pastnor in the future and may, in particular, deviate from anyhistorical financial information based on corresponding combinedfinancial statements with respect to the CECONOMY business.Given the aforementioned uncertainties, readers are cautionednot to place undue reliance on any of this information. Norepresentation or warranty is given and no liability is assumed byCECONOMY, express or implied, as to the accuracy, correctness orcompleteness of the information contained in this presentation.All numbers shown are before special items, unless otherwisestated. All amounts are stated in million euros (€ million) unlessotherwise indicated. Amounts below €0.5 million are roundedand reported as 0. Rounding differences may occur.
This presentation contains certain supplemental financial oroperative measures that are not calculated in accordance withIFRS and are therefore considered as non-IFRS measures. Webelieve that such non-IFRS measures used, when considered inconjunction with (but not in lieu of) other measures that arecomputed in accordance with IFRS, enhance the understanding of
our business, results of operations, financial position or cashflows. There are, however, material limitations associated withthe use of non-IFRS measures including (without limitation) thelimitations inherent in the determination of relevant adjustments.The non-IFRS measures used by us may differ from, and not becomparable to, similarly-titled measures used by othercompanies.
To the extent that statements in this presentation do not relate tohistorical or current facts they constitute forward-lookingstatements. All forward-looking statements herein are based oncertain estimates, expectations and assumptions at the time ofpublication of this presentation and there can be no assurancethat these estimates, expectations and assumptions are or willprove to be accurate. Furthermore, the forward-lookingstatements are subject to risks and uncertainties including(without limitation) future market and economic conditions, thebehaviour of other market participants, investments in innovativesales formats, expansion in online and multichannel salesactivities, integration of acquired businesses and achievement ofanticipated cost savings and productivity gains, and the actions ofpublic authorities and other third parties, many of which arebeyond our control, that could cause actual results, performanceor financial position to differ materially from any future results,performance or financial position expressed or implied in thispresentation. Accordingly, no representation or warranty (expressor implied) is given that such forward-looking statements,including the underlying estimates, expectations andassumptions, are correct or complete. Readers are cautioned notto place reliance on these forward-looking statements.
BY ACCESSING THIS PRESENTATION YOU AGREE TO THEFOLLOWING RESTRICTIONS
This document and the presentation to which it relates isintended for information only, does not constitute a prospectusor similar document and should not be treated as investmentadvice. It is not intended and should not be construed as an offerfor sale, or as a solicitation of an offer to purchase or subscribe to,any securities in any jurisdiction. Neither this presentation noranything contained therein shall form the basis of, or be reliedupon in connection with, any commitment or contractwhatsoever. This presentation may not, at any time, bereproduced, distributed or published (in whole or in part) withoutprior written consent of CECONOMY AG (“CECONOMY”).
Historical financial or operative information contained in thispresentation, if not taken or derived from our accounting recordsor our management reporting or unless otherwise stated, is takenor derived from the unaudited combined financial statements ofCECONOMY for the respective period and not from theconsolidated (interim) financial statements of the former METROGroup. The combined financial statements of CECONOMY havenot been audited and may also deviate substantially from
DISCLAIMER AND NOTES
PublicInvestor Presentation

// 3August/September 2019
We do not undertake any obligation to publicly update anyforward-looking statements or to conform them to events orcircumstances after the date of this presentation. Thispresentation contains forecasts, statistics, data and otherinformation relating to markets, market sizes, market shares,market positions and other industry data on the Company’sbusiness and markets (together the “market data”) provided bythird party sources as interpreted by us. This market data is, inpart, derived from published research and additional marketstudies prepared primarily as a research tool and reflectsestimates of market conditions based on research methodologiesincluding primary research, secondary sources and econometricmodelling. We want to point out that part of the market dataused has been collected in the framework of a market surveycarried out as a panel observation. The panel is a regular surveymonitoring sales of specific products and product categories,using a range of distribution channels including internet, retailoutlets (e.g. high street, mail order) and companies (e.g.resellers). The market data does not represent actual sales figuresglobally or in any given country; rather, the market datarepresents a statistical projection of sales in a given territory andis subject to the limitations of statistical error and adjustments atany time (e.g. reworks, changes in panel structure). Therepresentativeness of the market data may be impacted byfactors such as product categorisation, channel distribution andsupplier universe identification and statistical sampling andextrapolation methodologies. The market data presented is basedon statistical methods and extrapolation. In addition, marketresearch data and trend information as interpreted or used by
CECONOMY is based on certain estimates and assumptions andthere can be no assurance that these estimates and assumptionsas well as any interpretation of the relevant information byCECONOMY are accurate. The market research institutes whichdata CECONOMY used as basis for this presentation are neitherregistered broker dealers nor financial advisors and the permitteduse of any market research data does not constitute financialadvise or recommendations.
CECONOMY operates, in part, in industries and channels forwhich it is difficult to obtain precise market data. Such marketdata should therefore be considered with caution and not besolely relied on as market studies are often based on informationand assumptions that may be inaccurate or inappropriate, andtheir methodology is inherently predictive and speculative. Wehave no reason to believe that such information is false ormisleading or that any material fact has been omitted that wouldrender such information false or misleading. Our own estimateshave not been checked or verified externally. They may differfrom estimates made by competitors of our group or from futurestudies conducted by market research institutes or otherindependent sources. Information prepared by third parties hasnot been independently verified by us or any other party.
Therefore you acknowledge that the market data presented isbased on statistical methods and extrapolation and so due to thenature of such data no guarantee for completeness and accuracycan be given by us or any third party. Neither we nor any thirdparty, including those third parties whose data is cited in this
presentation, warrant that the data collected, processed andanalysed by it in accordance with the rules and methods ofmarket and social research, will be able to be used by in a specificway, in particular not in the legal sense of an expert report. Itshould be noted that all liability for completeness and correctnessof the information provided by us or any third party is explicitlyexcluded. Under no circumstance shall a third party whose data iscited in this presentation be liable for damages incurred throughor in connection with your or our interpretation of the providedinformation. Neither we nor any third party shall be responsiblefor any loss or damage arising out of your or our use or relianceupon the information contained herein, or for actions of anddecisions taken by us, you or any third parties that receive thisinformation. Neither we nor any third party give anyrepresentations as to the accuracy of the market data included inthis presentation. The third parties whose data is cited in thispresentation are neither registered broker-dealers nor financialadvisors and the permitted use of any market research data doesnot constitute financial advice or recommendations.
Disclaimer and Notes (cont’d)
PublicInvestor Presentation

01 CECONOMY at a glance
02 Q3 18/19 Trading & Outlook
03 Strategic Update
Agenda

// 5August/September 2019
CECONOMY at a glance

// 6August/September 2019
CECONOMY at a glance
PublicInvestor Presentation
Europe’s largest Consumer Electronics platform
21.4 €bn of sales, 650 €m EBITDA in FY 17/18
>2.5 €bn online sales and 1.4 €bn Services & Solutions sales in FY 17/18
Leading position in 8 out of 14 countries
2 strong brands: MediaMarkt and Saturn
Multi-channel 1,000+ store network
Solid financial framework
Minority investments in Fnac Darty (c. 24%) and M.video (c. 15%)
HighlightsShareholder structure1 Product category breakdown
Sales per segment Number of stores
996 1,022
Sept. ’17 Sept. ’18
+26
6.6% Meridian Stiftung
freenet
22.7%
Haniel
14.3%
Beisheim
9.1%
47.2%
Free float22%
21%
21%
21%
9%5%
WhiteGoods
BrownGoods
Computer Hardware2 & Accessories
Telecom
EntertainmentOther3
1Calculated on the basis of the number of voting rights in disclosures pursuant to section 40 para. 1 sentence 1 WpHG; 2Telecommunication devices such as iPads without SIM card included; 3Includes in essence Photo&Office equipment.
2.5%
57.9% DACH31.6%
W. &S. Europe
Others incl. Sweden
7.9%
Eastern Europe

// 7August/September 2019
Solid progress in the Online and Services & Solutions business
PublicInvestor Presentation
Strong Online business
10.6% 12.1%
Sales (€m)
% of totalsales
Stable pick-up rate Increasing Services & Solutions business
Ongoing rightsizing of stores
Numberof stores
Growing CRM basis Rising number of customer contacts
17/1816/17
2,5932,300
16/17
42%40%
17/18
In % of orders
6.2% 6.9%
Sales (€m)
% of totalsales
16/17 17/18
1,344 1,478
16.8
16/17 17/18
12.8
In million members
16/17 17/18
2.02 2.06
In billion contacts
2,808 2,724Avg. store size m²
996
16/17 17/18
1,022
Note: Business figures represent the continuing operations of CECONOMY, i.e. excl. the Russian MediaMarkt business. CRM data for Poland not included due to change to new CRM IT platform.

// 8August/September 2019
New leadership teams at CECONOMY and MediaMarktSaturn in place
PublicInvestor Presentation
Other Operations Media-Saturn-Holding GmbH
CECONOMY AG shareholders
100 %
78.38 %
Supervisory Board
Jörn Werner (CEO) Karin Sonnenmoser (CFO)
Ferran Reverter (CEO)
CECONOMY AG
Advisory Board
Shareholders Meeting
New leadership team

// 9August/September 2019
Why invest in CECONOMY?
PublicInvestor Presentation
CECONOMY HAS THE POTENTIAL TO LEAD THE RETAIL CONSOLIDATION AND TRANSFORMATION IN THE FUTURE
CECONOMY HAS A STRONG FINANCIAL PROFILE
#4
CECONOMY HAS THE POTENTIAL TO INCREASE MARGINS AND FREE CASH FLOW GENERATION
#3#2
CECONOMY IS THE LEADER IN MULTI-CHANNEL AND SCALE
#1

// 10August/September 2019
Mid-term targets
PublicInvestor Presentation
Sales1 EBITDA margin Tax rate
>3% CAGR direction 5% direction 40%
Investments2 FCF conversion3 Dividend pay-out ratio4
1.5% of sales 60-70% 45-55%
1 At constant currency before portfolio effects. CAGR = Compound Annual Growth Rate. 2 Cash investments. 3 Free Cash Flow conversion defined as EBITDA less cash investments plus/minus changes in net working capital divided by EBITDA; EBITDA adjusted for investment in Fnac Darty stake. 4 % of EPS.

// 11August/September 2019
Q3 18/19 Trading

// 12August/September 2019
Solid results in Q3, despite facing a lower gross margin which was partly compensated by operational cost savings
PublicInvestor Presentation
Slight fx-adjusted sales growth despite strong World Cup campaigns in PY
Dynamics in operational cost savings accelerated
Germany again with sound operational performance and stabilization in Spain
Online and Services & Solutions growth impacted by strong GSM campaigns in PY
Weak performance in the Netherlands and Poland ongoing
Lower gross margin

// 13August/September 2019
Q3 performance supports achievement of full-year targets
PublicInvestor Presentation
+0.2% Positive sales development in
DACH and W.&S. Europefx-adjusted
–628 €m Change in NWC –646 €m
lower than PY
10 €m Adj. EBITDA*excl. Fnac Darty
–16 €m below PY –45 €m Adj. EBIT*excl. Fnac Darty
–15 €m below PY
*Adjusted EBIT/DA excl. expenses in connection with the reorganization and efficiency program and management changes. Note: Change in Net Working Capital (NWC) acc. to Cash Flow Statement. PY = prior year.
in 9M

// 14August/September 2019
Slight sales increase driven by DACH and Western & Southern Europe
PublicInvestor Presentation
Total sales (in €m)
Q3 18/19 sales by segment (fx-adjusted, yoy change)
Overall market share gains per 9M
DACH: Successful VAT campaign in Germany and Easter business offset strong World Cup campaigns in PY; Switzerland impacted by store closure in previous quarter
Western & Southern Europe: Italy benefited from solid Online business and strong campaigns; Netherlands still impacted by competitive environment
Eastern Europe: Ongoing sales decline in Poland; Turkey with solid growth
Others: Lower sales in Sweden
E. EuropeDACH W. & S. Europe-3.5%Others
0.2%
-2.5%
1.3%
Q3 18/19Q3 17/18
4,586 4,565
-0.5%Highlights+0.2%
fx-adjusted

// 15August/September 2019
Online and Services & Solutions impacted by strong campaigns in PY
PublicInvestor Presentation
Online Sales (in €m)
Services & Solutions sales acc. to IAS 18 (in €m)
Slower online growth, esp. in Germany, mainly due to strong GSM mobile campaigns in PY and reduced free shipping offers
Online LTM accounted for 13.6% of total sales vs. 11.7% in the prior-year period
Higher pick-up rate in Q3 at around 46% vs. 40% in the prior-year period
Decline in Services & Solutions especially due to strong GSM mobile campaign in PY
Services & Solutions LTM accounted for 7.0% of total sales vs. 6.8% in the prior-year period
Services & Solutions sales impacted by application of IFRS 15 (c. –60 €m)
Highlights
369 338
Q3 18/19Q3 17/18
-8.4%
7.4%8.1%
584 594
Q3 17/18 Q3 18/19
+1.7%
13.0%12.7%
In % of sales
In % of sales
// 16August/September 2019
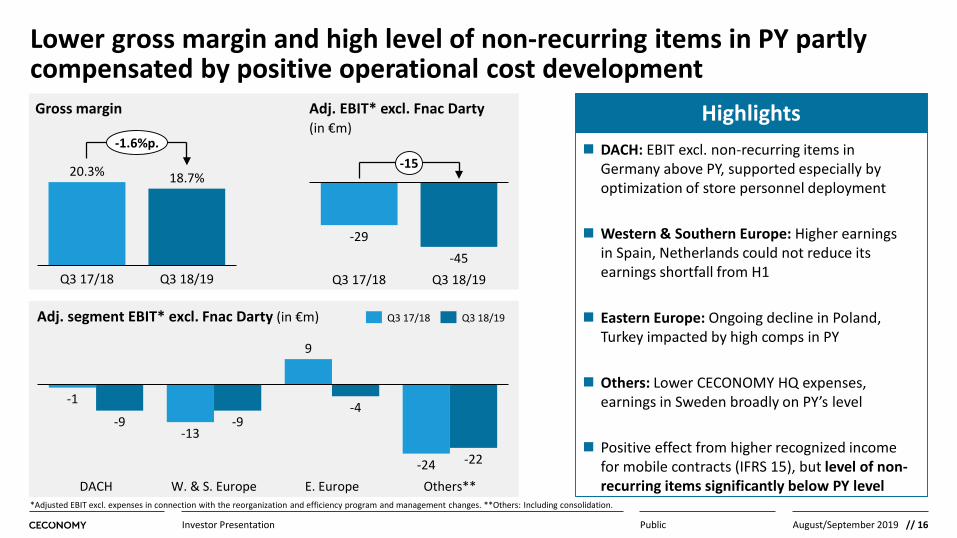
Lower gross margin and high level of non-recurring items in PY partly compensated by positive operational cost development
PublicInvestor Presentation
-1
-13
9
-24
-9 -9-4
-22
DACH W. & S. Europe Others**E. Europe
Q3 17/18 Q3 18/19
*Adjusted EBIT excl. expenses in connection with the reorganization and efficiency program and management changes. **Others: Including consolidation.
DACH: EBIT excl. non-recurring items in Germany above PY, supported especially by optimization of store personnel deployment
Western & Southern Europe: Higher earnings in Spain, Netherlands could not reduce its earnings shortfall from H1
Eastern Europe: Ongoing decline in Poland, Turkey impacted by high comps in PY
Others: Lower CECONOMY HQ expenses, earnings in Sweden broadly on PY’s level
Positive effect from higher recognized income for mobile contracts (IFRS 15), but level of non-recurring items significantly below PY level
Highlights
Q3 18/19
18.7%20.3%
Q3 17/18
-1.6%p.
-29-45
Q3 18/19Q3 17/18
-15
Gross margin Adj. EBIT* excl. Fnac Darty (in €m)
Adj. segment EBIT* excl. Fnac Darty (in €m)

// 17August/September 2019
Adjusted EBIT below PY as expected; restructuring-related expenses weigh on reported earnings
EBIT excl. Fnac Darty (in €m)
-29
-45
-125
-15
-80
Adj. EBIT Q3 18/19EBIT Q3 17/18 Yoy change Restructuring-related expenses*
EBIT Q3 18/19
PublicInvestor Presentation
*Expenses in connection with the reorganization and efficiency program in EBIT.
+ Operational cost reductions
− Weak gross margin development
− High level of non-recurring items in PY

// 18August/September 2019
EPS negatively impacted by restructuring-related expenses, partly offset by positive impact from METRO transaction
PublicInvestor Presentation
€m Q3 17/18 Q3 18/19 Change
EBITDA 26 –69 –95
EBIT –30 –126 –95
Net financial result –154 12 166
Earnings before taxes –184 –113 70
Income taxes 93 51 –42
Tax rate 50.8% 45.4% –5.4%p.
Profit or loss for the period –90 –62 29
Non-controlling interest 13 –14 –27
Net result –104 –48 55
EPS (€) –0.32 –0.13 0.18
Reported EBIT impacted by 80 €m restructuring-related expenses
Net financial result with positive impact from transaction of 5.4% METRO stake; PY mainly impacted by impairment of METRO AG stake
Tax rate in 9M 18/19 at 32.2%; PY impacted by METRO AG impairment; further improvement compared to H1 18/19 especially due to additional tax groups in Germany
Highlights
Note: Reported EBIT/DA incl. Fnac Darty and incl. expenses in connection with the reorganization and efficiency program and management changes.

// 19August/September 2019
Free Cash Flow impacted by expected NWC outflow mainly due to high starting point on 30 September 2018 and active cash management
PublicInvestor Presentation
9M 18/19: Free Cash Flow (in €m)
9M 17/18: Free Cash Flow (in €m)
436
256
70
18
OtherEBITDA Δ NWC Tax
-109
OCF FCFCash investments
-89
-185
305
-409-540
-105-131
EBITDA FCFCash investments
Δ NWC Tax Other OCF
-62819
Change in NWC –646 €m lower than PY, mainly driven by anticipated decline in trade payables due to a high starting point on 30 September 2018, the discontinuation of temporary payment term extensions and the planned early payment of invoices
Cash taxes in PY impacted by high tax refund
Other OCF mainly driven by reorganisation and efficiency program-related positions and the settlement of receivables in connection with the Russia transaction
Cash investments declined by –54 €m yoy due to lower modernization investments and more selective expansion strategy
Highlights
Note: Cash investments and FCF for 9M 17/18 were restated to exclude investments in money market funds from cash investments.

// 20August/September 2019
Total sales
EBITDA (excl. Fnac Darty)
EBIT (excl. Fnac Darty)
Fnac Darty profit share
Net Working Capital
Outlook for FY 18/19 confirmed
Adjusted for exchange rate effects and before portfolio changes
Excludes expenses in connection with the reorganization and efficiency program
Excludes expenses for already announced management changes in top management
PublicInvestor Presentation
FY 17/18€m
21,418
630
399
21
FY 18/19
Slight increase
Slight decline
Slight decline
c. 22
Moderate decline
Included non-recurring effects such as: • Re-assessment of
inventory costs• Valuation of gift card
liabilities• Pension income

// 21August/September 2019
Strategic Update

// 22August/September 2019PublicInvestor Presentation
Leading multi-channel player for Consumer Electronics
Differentiated value proposition with Services & Solutions offering
Large customer base
Trusted brands
Strong and trusted partner of suppliers
Digital opens up new product categories
Ageing population is increasingly seeking technical support
Connectivity and product complexity drive rising demand
for Services & Solutions
We have a strong set of assets and operate in an attractive market

// 23August/September 2019
We have not fully utilized our potential and our performance has been disappointing in recent years
PublicInvestor Presentation
CECONOMY’s EBIT margin development (before special items, excl. Fnac Darty and Russia)
Peers’ EBIT margin (last FY)
2.3%
FY 17/18FY 15/16* FY 16/17
1.9%2.4%
Peer 1 Peer 2 Peer 3
4.0%3.8%
4.6%
We need to increase our efficiency and profitability
*Unaudited pro-forma figure for FY 15/16 excluding Russia.
Peer margins

// 24August/September 2019
We need to become a more agile organization – our current structures and processes slow down execution
PublicInvestor Presentation
We need to streamline processes, enable faster decision-making and ultimately reduce costs
Group administrative expenses1 in Germany Complex structures and redundant functions
Unclear roles and responsibilities
Limited resources for future investments
Non-standardized processes
0.5 €bn
FY 15/16 FY 16/17 FY 17/18
+12%
1 Before cost allocation to other P&L line items.

// 25August/September 2019
We have identified four strategic initiatives – short-term, we focus on reducing complexity and costs
Public
DIGITALGROWTH
SERVICES & SOLUTIONS
CATEGORY & SUPPLY CHAIN MANAGEMENT
ORGANIZATION & COST STRUCTURE
Investor Presentation
ONGOING ONGOING GRADUAL PROGRESS SHORT TERMReorganization & Efficiency Program

// 26August/September 2019
Our program focuses on two pillars: reorganizing central functions and optimizing the operational entities portfolio
Public
Reorganization & Efficiency Program (expected duration up to 18 months)
Central Functions Portfolio
Reorganization of central functions atCECONOMY and MediaMarktSaturn Retail Group
and the country organizations (primarily Germany)
Review of non-core portfolio companies and associates
c. 85% of savings1
c. 15% of savings
1 thereof around 90% from Germany
Investor Presentation
// 27August/September 2019
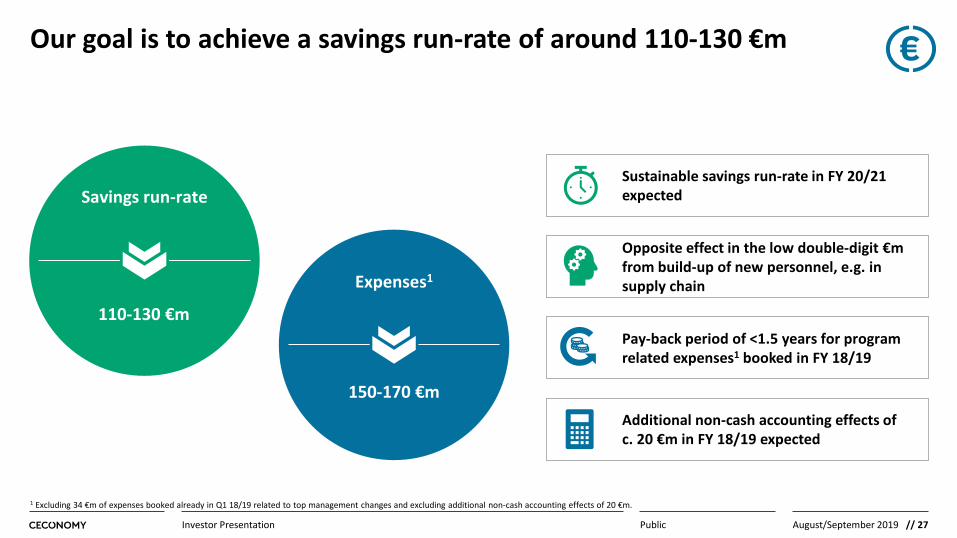
Our goal is to achieve a savings run-rate of around 110-130 €m
Public
Opposite effect in the low double-digit €m from build-up of new personnel, e.g. in supply chain
Pay-back period of <1.5 years for program related expenses1 booked in FY 18/19
Savings run-rate
110-130 €m
Expenses1
150-170 €mAdditional non-cash accounting effects of c. 20 €m in FY 18/19 expected
Sustainable savings run-rate in FY 20/21 expected
1 Excluding 34 €m of expenses booked already in Q1 18/19 related to top management changes and excluding additional non-cash accounting effects of 20 €m.
Investor Presentation

// 28August/September 2019
We have made progress regarding the streamlining of centralfunctions and the optimization of our operational entities portfolio
Reorganization & Efficiency Program
Central Functions Portfolio
One function responsible for CECO & MMSRG
Completed management team with right mindset and skills
First reductions of indirect spend and personnel
Centralisation of support functions
Headcount reduction across all entities (c. 600 FTEs planned)
Enable fast decision-making through reduction of layers and process improvements
Sustainable solution with Public in Greece
Closure of streaming platform
Termination of business activities
Completed review of smaller portfolio companies
PublicInvestor Presentation

// 29August/September 2019
New corporation
Target structure
CECONOMY’s majority shareholding MediaMarktSaturn and Olympia Group create a new company with a 25%/75% shareholding in Greece
Public
78.38%
25% 75%
CECONOMY’s majority shareholding MediaMarktSaturn and Olympia Group have signed a deal to create a new company in Greece and Cyprus
Transfer of entire Greek MediaMarkt retail business as contribution in kind
Olympia to contribute Greek CE and entertainment retailer Public covering the Greek & Cypriot market
Continuation of MediaMarkt and Public store network under their respective brands
Timing of closing depending on merger control clearance, most likely in FY 2019/20
Highlights
Investor Presentation

// 30August/September 2019
We have found a sustainable solution for our Greek MediaMarkt activities and gain an immediate scale advantage
Public
Further optimizing CECONOMY’s portfolio
Combining strengths to unlock synergies Participating in a solid business case
Closing the gap to the market leader
In line with “Lead or Leave” principle
Eliminating operational losses
Optimizing assortment and supplier approach
Optimizing costs from systems alignment
With an estimated share of c. 14%1 at eye level with the market leader
Enabling future-oriented positioning in the Greek & Cypriot market
Business plan with positive contribution
Preferred option with minimized funding requirement
1 Indicative shares based on publicly available information and own estimates based on own market intelligence.
Investor Presentation
// 31August/September 2019
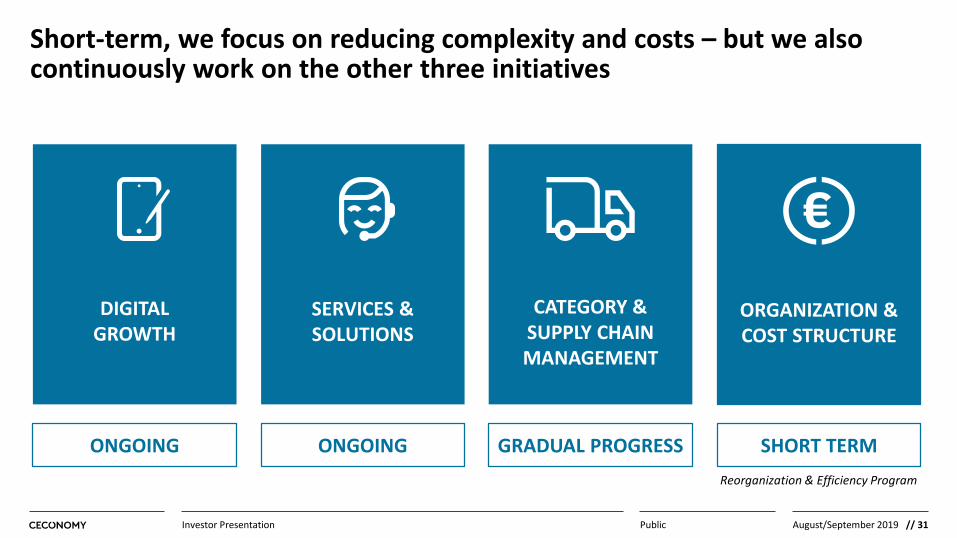
Short-term, we focus on reducing complexity and costs – but we also continuously work on the other three initiatives
Public
DIGITALGROWTH
SERVICES & SOLUTIONS
CATEGORY & SUPPLY CHAIN MANAGEMENT
ORGANIZATION & COST STRUCTURE
ONGOING ONGOING GRADUAL PROGRESS SHORT TERMReorganization & Efficiency Program
Investor Presentation

// 32August/September 2019
We accelerate our Digital Growth and Services & Solutions efforts to become the partner of choice for our customers at all touchpoints
PublicInvestor Presentation
Digital Growth
Refocus marketing investments and leverage data analytics
Optimize user experience and customer journey to improve conversion
Push relevant online services to improve margins
Full multi-channel integration of online, mobile and store
Services & Solutions
Drive recurring revenue models through own billing platform for e.g. security software
Ramp-up at-home tech support
Full roll-out of SmartBars including core services: Ready2Use, screen protection and in-store repairs
Improved insurances & warranties proposition in Germany: new proposition, new partners, smart billing solution

// 33August/September 2019
We also centralize our business, improving our Category and Supply Chain Management, but the full roll-out will take time
PublicInvestor Presentation
Pricing Category Management Supply Chain
Piloting first central warehouse, testing processes with three major suppliers
Finalizing roll-out of SAP system
Establish central warehouses in further countries
Developed a central pricing strategy using advanced data analytics and AI
Implementation in Germany by summer
Full roll-out to other countries once Germany is up and running
First progress in terms of buying and forecasting & replenishment planning in Germany
Full ramp-up in Germany by the end of next year
Full ramp-up of space & assortment planningthereafter
Continue ramp-up of central platform for supply to go live in September
Buying in Spain, Italy, Poland and the Netherlands already highly centralized

// 34August/September 2019
Business transformation of overriding importance for ongoing initiatives
Business Transformation
Customer value proposition / Customer experience
Digital Growth
Defines
Services & Solutions
Ctg. Mgmt. & SCM
Organization & Costs …
Strategic target picture
Success Factors & Requirements
Fuels
Sets Framework
PublicInvestor Presentation
Kick-off of overarching business transformation process to set the missing strategic target picture
Implement customer-centric approach by taking customer perspective

// 35August/September 2019PublicInvestor Presentation
The recent developments emphasize the importance of executing the transformation and setting the course for the future
Fixing the basics
Simplifying the corporate structure
Transforming the business with a customer-centric approach

// 36August/September 2019
Back-up

// 37August/September 2019
Reorganization & Efficiency Program: savings, P&L expenses and cash outflows
PublicInvestor Presentation
Annual gross savings(in €m)
Cash outflows(in €m)
Total P&L expenses(in €m)
100-1200-10
110-130
150-170
3450-60
100-120
FY 18/19 FY 19/20 FY 20/21Timing
Top management changes (already booked in Q1)
Non-cash accounting effects3420
Reorganization & Efficiency Program

// 38August/September 2019
Net Working Capital
PublicInvestor Presentation
€m 30/09/20171 30/06/2018 Change 30/09/2018 30/06/20192 Change
Inventories 2,449 2,819 371 2,480 2,802 322
Trade receivables 497 545 48 613 493 –120
Receivables due from suppliers 1,197 1,102 –95 1,239 1,157 –82
Receivables from credit cards 66 57 –9 71 77 5
Advance payments on inventories 0 0 0 0 0 0
Trade payables –4,817 –5,151 –333 –5,277 –4,794 483
Liabilities to customers –129 –32 97 –45 –13 33
Deferred revenues from vouchers and customer loyalty programmes –63 –144 –81 –137 –148 –11
Provisions for customer loyalty programmes and rights of return –19 –17 2 –23 –19 4
Prepayments received on orders –39 –38 1 –46 –59 –13
Net Working Capital –858 –857 1 –1.125 –505 620
1 Balance sheet figures were adjusted for discontinued operations to enable comparison.2 Balance sheet figures for the current period do not include the assets and liabilities of the disposal group. The resulting effect for net working capital amounted to –15 €m.

// 39August/September 2019
IFRS 9 and 15 accounting changes
PublicInvestor Presentation
IFRS 9Financial Instruments
The IFRS 9 accounting change will reduce the impairment requirement for the receivables portfolio
According to an impact analysis no material impact expected
IFRS 15
IFRS 15 related changes in the sales allocation on the basis of standalone selling prices are mainly applicable to Telco related package deals
As a result a low triple-digit €m shift from Services & Solutions to product sales is expected
Comparable figures according to IAS18 will be provided on a quarterly basis
Effective: 1 Oct. 2018
Revenue from Contracts with Customers
Effective: 1 Oct. 2018
Financial Impact1
Not material
Financial Impact2
Product sales: Low triple-digit €m
Service sales: Low triple-digit €m
1Preliminary and unaudited impact analysis as of 31 Dec. 2017; 2Preliminary and unaudited impact analysis as of 30 Sep. 2017.

// 40August/September 2019
CECONOMY’s new shareholder structure
PublicInvestor Presentation
* Calculated on the basis of the number of voting rights in disclosures pursuant to section 40 para. 1 sentence 1 WpHG
Pre-transaction structure based on voting rights*
Post-transaction structure based on voting rights*
24.9%
Meridian Stiftung
Haniel
Beisheim
9.1%
15.8%50.1%Free float
22.7%
Haniel
14.3%
freenet
9.1%
Meridian Stiftung6.6%
Beisheim
47.2%Free float
ShareholderNumber of
voting rights% of
voting rightsDate of
publicationHaniel 81,015,280 24.99% 13 May 2015Meridian Stiftung 51,117,363 15.77% 02 June 2017Beisheim 29,493,970 9.10% 12 August 2013Total 324,109,563
ShareholderNumber of
voting rights% of
voting rights*Date of
publicationHaniel 81,015,280 22.71% 13 May 2015Meridian Stiftung 51,117,363 14.33% 16 July 2018freenet 32,633,555 9.15% 12 July 2018Beisheim 23,615,334 6.62% 18 July 2018Total 356,743,118
Beisheim reported 23,615,334voting rights to METRO
Wholesale & Food Specialist AG (now METRO AG) on 12 July 2017
In addition: 2,677,966 non-voting preference shares outstanding
In addition: 2,677,966 non-voting preference shares outstanding
// 41August/September 2019
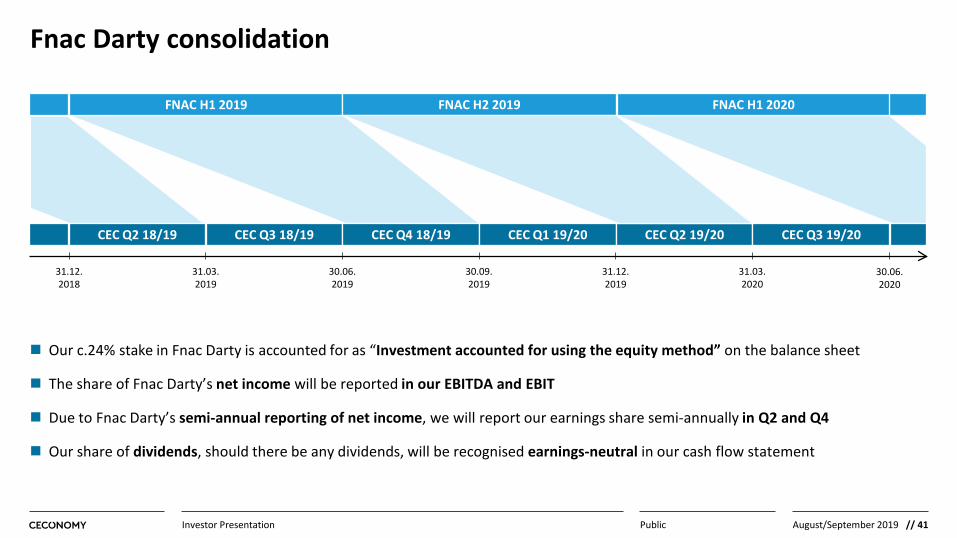
Fnac Darty consolidation
PublicInvestor Presentation
Our c.24% stake in Fnac Darty is accounted for as “Investment accounted for using the equity method” on the balance sheet
The share of Fnac Darty’s net income will be reported in our EBITDA and EBIT
Due to Fnac Darty’s semi-annual reporting of net income, we will report our earnings share semi-annually in Q2 and Q4
Our share of dividends, should there be any dividends, will be recognised earnings-neutral in our cash flow statement
FNAC H1 2020FNAC H2 2019
CEC Q2 18/19 CEC Q3 18/19 CEC Q4 18/19 CEC Q1 19/20 CEC Q2 19/20 CEC Q3 19/20
31.12.2018
31.03.2019
30.06.2019
30.09.2019
31.12.2019
31.03.2020
30.06.2020
FNAC H1 2019
// 42August/September 2019
Store network
PublicInvestor Presentation
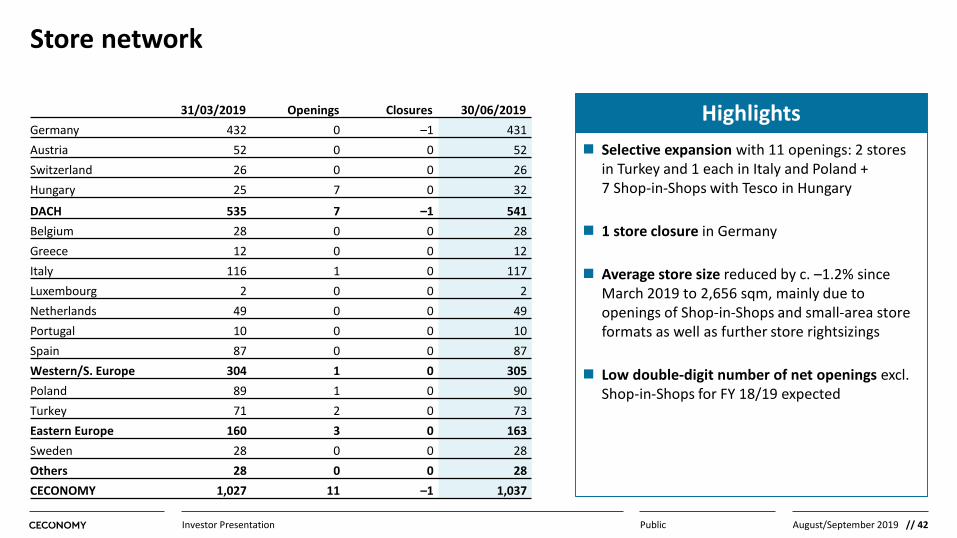
Selective expansion with 11 openings: 2 stores in Turkey and 1 each in Italy and Poland + 7 Shop-in-Shops with Tesco in Hungary
1 store closure in Germany
Average store size reduced by c. –1.2% since March 2019 to 2,656 sqm, mainly due to openings of Shop-in-Shops and small-area store formats as well as further store rightsizings
Low double-digit number of net openings excl. Shop-in-Shops for FY 18/19 expected
Highlights31/03/2019 Openings Closures 30/06/2019Germany 432 0 –1 431Austria 52 0 0 52Switzerland 26 0 0 26Hungary 25 7 0 32
DACH 535 7 –1 541Belgium 28 0 0 28Greece 12 0 0 12Italy 116 1 0 117Luxembourg 2 0 0 2Netherlands 49 0 0 49Portugal 10 0 0 10Spain 87 0 0 87Western/S. Europe 304 1 0 305Poland 89 1 0 90Turkey 71 2 0 73Eastern Europe 160 3 0 163Sweden 28 0 0 28Others 28 0 0 28CECONOMY 1,027 11 –1 1,037

// 43August/September 2019
Sales & number of stores by country
PublicInvestor Presentation
Note: All figures shown from continued operations. 1 Sales figures for Italy for 2016/17 and 2017/18 were restated to present revenues related to extended warranties on a net basis.
Sales (€m) Number of Stores
FY 16/17 FY 17/18 FY 16/17 Openings Closures FY 17/18Germany 10,556 10,340 429 5 –2 432Austria 1,169 1,161 50 2 0 52Switzerland 635 569 27 1 –1 27Hungary 302 340 24 0 0 24DACH 12,662 12,410 530 8 –3 535Belgium 686 701 28 1 0 29Greece 187 186 12 0 0 12Italy1 2,064 2,096 116 1 –2 115Luxembourg 63 65 2 0 0 2Netherlands 1,590 1,581 49 0 0 49Portugal 133 146 10 0 0 10Spain 1,967 2,002 83 2 0 85Western/S. Europe1 6,691 6,777 300 4 –2 302Poland 1,033 1,037 86 3 –3 86Turkey 666 651 53 18 0 71Eastern Europe 1,699 1,689 139 21 –3 157Sweden 474 462 27 1 0 28Others 553 542 27 1 0 28CECONOMY1 21,605 21,418 996 34 8 1,022

// 44August/September 2019
Financial calendar and events
PublicInvestor Presentation
Financial calendar
24 October 2019
17 December 2019
Upcoming events
Roadshow Frankfurt
Commerzbank Sector Conference (IR only)
Q4/FY 2018/19 trading statement
FY 2018/19 results
Roadshow US & GS Global Retailing Conference
Roadshow Paris
14 August 2019
29 August 2019
3-5 September 2019
11–12 September 2019

// 45August/September 2019PublicInvestor Presentation