MPPS: Most Michigan local officials are satisfied with privatized services, but few seek to expand
Upload
closup-u-mCategory
view
217download
0description

This report examines Michigan local government leaders’ opinions on law enforcement services in their community, including the perception of problems with crime in the community, satisfaction with law enforcement performance, and funding of law enforcement at the local level. The findings are based on statewide surveys of local government leaders in the Fall 2015 wave of the Michigan Public Policy Survey (MPPS).
Key Findings
• Over half (54%) of local leaders statewide say drug crimes are some-what of a problem (37%) or a significant problem (17%) in their com-munity. In addition, property crimes such as burglary, vandalism, identity theft, or embezzlement are rated as a community problem by 48% of local officials statewide. Violent crimes and public-order offenses like drunk driving and disorderly conduct are less common.
» When considering all types of crimes combined, approximately a quarter (24%) of Michigan’s local officials say that crime over-all is somewhat of a problem (22%) or a significant problem (2%) in their community.
» Officials in the state’s largest jurisdictions are more likely than others to say crime is a problem, including 57% who say overall levels of crime are a problem. They are also more likely to say various types of crime are problems in their communities, in-cluding drug crimes (86%), property crimes (81%), public-order offenses (63%), and violent crimes (35%).
• When it comes to local law enforcement services, 28% of the state’s cities, townships, and villages provide police services directly by running their own police departments. Meanwhile, 24% contract for law enforcement services with another provider such as a neigh-boring jurisdiction or the county sheriff. By comparison, 48% do neither, and instead simply rely on the county sheriff and/or state police to respond when called.
• Satisfaction with law enforcement services is high, with local offi-cials saying they are either somewhat or very satisfied with per-formance of the state police (74%), county sheriffs (79%), and local police (94%) in those jurisdictions that have them.
» Local leaders estimate that their citizens’ satisfaction with law enforcement services is somewhat lower than their own, but is still relatively high in terms of state police (60%), county sheriffs (68%), and local police (88%) in those jurisdictions that have them.
» However, 22% of Michigan local officials—including 30% from the largest jurisdictions—say that recruitment and/or retention of law enforcement personnel has been a problem, now or recently.
• When it comes to funding, 22% overall say that they do not have sufficient funds to meet their law enforcement needs. This increases to 47% among the state’s largest jurisdictions.
Most local officials are satisfied with law enforcement services, but almost half from largest jurisdictions say their funding is insufficient
>> The Michigan Public Policy Survey (MPPS) is a census survey of all 1,856 general purpose local governments in Michigan conducted by the Center for Local, State, and Urban Policy (CLOSUP) at the University of Michigan in partnership with the Michigan Municipal League, Michigan Townships Association, and Michigan Association of Counties. The MPPS takes place twice each year and investigates local officials’ opinions and perspectives on a variety of important public policy issues. Respondents for the Fall 2015 wave of the MPPS include county administrators, board chairs, and clerks; city mayors, managers, and clerks; village presidents, managers, and clerks; and township supervisors, managers, and clerks from 1,418 jurisdictions across the state.
For more information, please contact: [email protected]/ (734) 647-4091. You can also follow us on Twitter @closup
By Debra Horner and Thomas Ivacko
www.closup.umich.edu
The Center for Local, State, and Urban PolicyGerald R. Ford School of Public Policy >> University of Michigan
Michigan Public Policy Survey April 2016

2 www.closup.umich.edu
The Center for Local, State, and Urban Policy
BackgroundEnsuring public safety and the health and welfare of citizens is one of the fundamental functions of government, and local governments in particular play a key role. According to the latest U.S. Census data from the Annual Survey of Local Government Finances, nationwide, local governments contributed 87% of all state and local government expenditures for police protection ($97.0 billion).1 Similarly, here in Michigan, local governments accounted for $2.2 billion of the $2.5 billion spent by both the state and local units on policing in 2013.2
Michigan’s local law enforcement services are provided at three different levels: through the state police, by county sheriff’s agencies, and by many local units of government (cities, villages, and townships). For those Michigan communities that are relatively rural or have low levels of crime or need for law enforcement, local governments may decide that state police and the county sheriff provide sufficient levels of service. As population size increases or other factors contribute to more frequent law enforcement needs, local governments may contract with sheriffs’ agencies or other local governments’ police departments for additional patrols or other services. Finally, many local governments choose to fund their own police departments or have set up arrangements to provide law enforcement on a shared basis with other units.
The number of law enforcement officers statewide has decreased in recent years. According to tracking by the Michigan Commission on Law Enforcement Standards (MCOLES), since 2001 the number of law enforcement agencies in Michigan declined by 23 and the number of police officers declined by more than 4,000.3 These declines occurred simultaneously with several demographic and fiscal changes in Michigan jurisdictions. Crime4 and population levels5 in many Michigan communities declined over the last decade, which may have enabled many jurisdictions to maintain high-quality public safety services with reduced staffing levels or alternative approaches such as contracting out for law enforcement services. At the same time, revenue for all local government services, including law enforcement, took hits beginning with state revenue sharing cuts in the early 2000s,6 and declined further with property tax revenue cuts due to the Great Recession. And while the recent economic recovery has allowed many local jurisdictions to plan to increase spending on public safety, local officials also report they are seeing continued increases in public safety demands.7
To learn more about the state of local law enforcement services in Michigan and local officials’ views on issues from performance to funding, the Fall 2015 MPPS survey asked local leaders a wide range of questions about law enforcement service provision, policies, and the status of funding in their communities.

3
Michigan Public Policy Survey
Drug and property crimes reported as common problems throughout MichiganTo understand law enforcement services, it is helpful to first understand the types of crimes and public safety challenges Michigan jurisdictions face. The MPPS asked local officials about different types of crimes in their communities—including drug crimes, property crimes, violent crimes, and public-order offenses—and also about crime levels overall.
Drug crimes—including possession, manufacturing, distribution, etc.—are reported as the most common types of crimes by local leaders across the state. Over half (54%) of local officials statewide say drug crimes are somewhat of a problem (37%) or a significant problem (17%) in their community (see Figure 1). In addition, property crimes such as burglary, vandalism, identity theft, or embezzlement are rated as a community problem by 48% of local officials statewide. Fewer (37%) say public-order offenses such as drunk driving (DUI), weapons violations, disorderly conduct, or even traffic violations are a local problem, and only 8% say violent crime—including rape, assault, and homicide—are local problems.
All of these types of crimes show clear correlations with community size, as officials from larger jurisdictions are more likely to report these types of crimes as problems experienced in their community, compared to leaders from smaller jurisdictions (see Figure 2a). In the state’s largest jurisdictions—those with more than 30,000 residents—86% of local leaders report that drug crimes are a problem, compared with just under half (49%) of officials from the state’s smallest jurisdictions—those with fewer than 1,500 residents. Similarly, officials from the largest jurisdictions are much more likely to cite property crimes, public-order offenses, and violent crimes as local law enforcement problems. In fact, while violent crime is reported as a problem in just 3% of the smallest communities, this rises to 35% among the state’s largest jurisdictions.
There is also some variation in reports of specific types of crime across the different regions of the state (see Figure 2b). Drug crimes are reported to be community problems most frequently in the Upper Peninsula (63%), Southwest (62%), and Northern Lower Peninsula (60%) regions. Meanwhile, property crimes are reported to be problems most frequently in the Southeast (55%), and least often in the U.P. (41%).
Figure 2aLocal officials’ assessments of whether various types of crime are a problem in their community (% who say each type is “somewhat” of a problem or a “significant” problem), by population size
Figure 2bLocal officials’ assessments of whether various types of crime are a problem in their community (% who say each type is “somewhat” of a problem or a “significant” problem), by region
Figure 1Local officials’ assessments of various types of crime as problems in their community
37%
33%41%
7%41%
4%5%
A significant problem
Somewhat of a problem
Not much of a problem
Don’t know
Not a problem at all
Drugcrimes
Property crimes
Public-order offenses
Violentcrimes
6%17% 7%
46%
41%
46%
10%
31%
7% 7%7%
1%
5%
41%
29%
50%45%
34%
60%54%
46%
64% 64%
52%
21%
86%81%
63%
35%
8%7%4%
Drug crimes Property crimes Public-order offenses Violent crimes
< 1,500 1,500-5,000 5,001-10,000 10,001-30,000 > 30,000
3%
49%
47%
60%
44%49% 49%
34%43% 42%
29%
60%54%
46%
62%
49%40%
11%
51%55%
38%
10%6% 5%
Drug crimes Property crimes Public-order offenses Violent crimes
6%
63%
41%37%
9%
Upper Peninsula
Northern Lower Peninsula
West Central
EastCentral
Southwest Southeast

4 www.closup.umich.edu
The Center for Local, State, and Urban Policy
A quarter of local officials statewide say overall levels of crime are a problem in their community, including 57% of those from the largest jurisdictionsIn addition to asking about different types of crime, the MPPS also asked local leaders whether overall levels of crime are a problem. And despite the relatively high levels of drug and property crimes perceived by local leaders across Michigan (compared to their assessments of less common violent crimes and public order offenses), only a quarter (24%) of local leaders say overall levels of crime are a problem in their community (see Figure 3a). Meanwhile 62% believe overall levels of crime are not much of a problem, and 10% believe they are not a problem at all. It would appear that the perception of relatively low levels of violent crime and public order offenses may balance out the higher levels of drug and property crimes in the minds of local leaders, who may also be considering overall crime against other problems they face, such as fiscal challenges, infrastructure problems, and so on.
Still, just like with the different types of crimes, officials’ assessments of overall crime levels are also correlated with jurisdiction size. As shown in Figure 3b, in the state’s smallest jurisdictions only 17% of local leaders believe that overall levels of crime are a problem, but this increases along with each population category, rising to 57% among the state’s largest jurisdictions.
Interestingly though, there are relatively few significant differences in officials’ perceptions of overall crime when broken down by region of the state. The percentage of officials that believe overall crime is a problem in their communities ranges from a low of 19% in the East Central region, to a high of 28% in the Southwest (see Figure 3c).
Figure 3aLocal officials’ assessments of overall crime in their jurisdiction
Figure 3bLocal officials’ assessments of overall crime in their jurisdiction, by population size
Figure 3cLocal officials’ assessments of overall crime in their jurisdiction, by region
A significant problem
Not a problem at all
Somewhat of a problem
Not much of a problem
Don't know
62%
10%4%
22%
2%
14%
63%
16%
67%
9% 7%
24%
62%
4%
A significant problem
Somewhat of a problem
Not much of a problem
Don’t know
Not a problem at all
< 1,500 1,500-5,000 5,001-10,000 10,001-30,000 > 30,000
38%18% 9%
48%
39%
7%
51%
4%5% 1%
4%2%2%1%
4%
60%
11%
24% 17% 25%
59%67%
22%
65%
6%
20%
61%
13%
22%
15%
60%
9% 9%5%6% 5%
2% 2% 2% 3%1%
1% 3%
Upper Peninsula
Northern Lower
Peninsula
West Central
EastCentral
Southwest Southeast
3%
3%
A significant problem
Somewhat of a problem
Not much of a problem
Don’t know
Not a problem at all

5
Michigan Public Policy Survey
How law enforcement services are provided How do local jurisdictions address crime or other public safety issues? Local law enforcement services in Michigan are generally provided through a combination of state police, county sheriffs, and local police departments. When asked about local jurisdictions’ primary law enforcement service arrangement, overall, just over one quarter (28%) of all cities, townships, and villages report that they are directly involved in providing law enforcement services. This includes running their own police departments and/or participating in a joint police department with another jurisdiction (see Figure 4a). Another quarter (24%) of jurisdictions say they have an indirect role, contracting for law enforcement services to be provided by a special authority/district, by another municipality, or through a contract with the county sheriff. Finally, just under half (48%) report they have no real role in law enforcement, and they simply rely on the county sheriff or state police to respond when there is a public safety issue.
Not surprisingly, larger jurisdictions are the most likely to report that they provide their own law enforcement services directly, including 61% of cities, villages, and townships with 10,001-30,000 residents, and 82% of the state’s largest townships and cities (see Figure 4b). By contrast, 62% of the state’s smallest jurisdictions have no formal role in providing law enforcement services.
Looking at differences regionally, Southeast Michigan—where many larger jurisdictions are located—is where the greatest percentage communities (52%) provide their own law enforcement services (see Figure 4c). By contrast, the Upper Peninsula and Northern Lower Peninsula are where the smallest percentages of jurisdictions have either a direct or even indirect role in providing law enforcement services. In the U.P., 66% of jurisdictions report they have no role, as do 62% in the Northern Lower Peninsula.
Figure 4aPercentage of jurisdictions (excluding counties) reporting how local law enforcement services are provided
Directly
Don't know
Indirectly
None
24%
48%
28%
1%
Figure 4bPercentage of jurisdictions (excluding counties) reporting how local law enforcement services are provided, by population size
62%
22%
14%
25%
50%
24%
52%
24%
1%
Directly
Indirectly
None
Don't know
< 1,500 1,500-5,000 5,001-10,000 10,001-30,000 > 30,000
61%25% 82%
18%6%
33%
1%
Figure 4cPercentage of jurisdictions (not including counties) reporting how local law enforcement services are provided, by region
22%
26%
14% 26% 31%
27%24%
52%
24%
62%
23%
27%
49%
15%
66%
19%
50%41%
2%1%
Upper Peninsula
Northern Lower
Peninsula
West Central
EastCentral
Southwest Southeast
1%1%1%
Directly
Indirectly
None
Don't know

6 www.closup.umich.edu
The Center for Local, State, and Urban Policy
The MPPS also asked local officials how likely it is that their city, village, or township will change its approach to law enforcement services within the next two years, and found only a small percentage (3%) think it is likely they will do so (see Figure 5). Regardless of community size or region of the state, only small percentages of jurisdictions of any type expect to change how law enforcement services are provided anytime soon.
Most local officials are satisfied with law enforcement services, and believe their citizens are, tooThe MPPS asked officials how satisfied they are with three levels of law enforcement service providers: the state police, their county sheriffs, and—if applicable—their own local police department. Overall, local leaders express high levels of satisfaction with the services from all three, though the greatest satisfaction is with local police, followed by county sheriffs, and then the state police. Local officials think their citizens are generally satisfied too (though at somewhat lower levels than the leaders themselves), and that their levels of satisfaction follow similar patterns.
Statewide, nearly three-quarters (74%) of local officials say they are either somewhat (31%) or very (43%) satisfied with state police services in their jurisdiction. While local officials from the state’s smaller jurisdictions express the highest satisfaction with state police services, even in the largest jurisdictions a solid majority (60%) express satisfaction (see Figure 6). Local officials estimate somewhat lower levels of satisfaction with the state police among their citizens, with 60% overall saying their citizens are somewhat or very satisfied.
Figure 5Local officials’ assessments of the likelihood of jurisdiction (excluding counties) changing its law enforcement service delivery arrangement in next two years, by population size
Very likely
Somewhat unlikely
Somewhat likely
Neither likely nor unlikely
Very unlikely
Don't know79%
7%
4%8%
2%1%
Figure 6Local officials’ own satisfaction, and assessments of citizen satisfaction, with state police (% who say they are “somewhat” or “very” satisfied), by population size
43%
34%
36%
30%
38%
25%
22%
32%
34%
26%
19%
40%
21%
35%
28%
40%
30%
36%30%
46%
Very satisfied Somewhat satisfied
< 1,500 1,500-5,000 5,001-10,000 10,001-30,000 > 30,000

7
Michigan Public Policy Survey
Local officials express even higher levels of satisfaction with their county sheriff’s law enforcement services. Half (50%) of local officials statewide say they are “very” satisfied with their county sheriff’s services, and another 29% say they are somewhat satisfied. Once again, officials from smaller jurisdictions report the highest satisfaction with these law enforcement services, but even among officials from the largest jurisdictions, nearly three-quarters (73%) report satisfaction with county sheriffs (see Figure 7). There is no significant difference in county sheriffs’ ratings among those officials whose jurisdiction has its own local police force compared to those who rely on county sheriffs or state police for their law enforcement. When it comes to citizen satisfaction, local leaders again believe it is somewhat lower than their own, but still robust, with officials estimating that 68% of citizens are satisfied with their county sheriff’s services. Officials from mid-sized communities (those with between 5,001-10,000 residents) estimate the lowest levels of citizen satisfaction (59%), although a majority still believes most of their citizens are satisfied.
Local officials give their highest satisfaction ratings to their own local police (in those communities that have police departments). More than nine in ten (94%) say they are satisfied with their local police services, including 74% who say they are “very” satisfied. Furthermore, there is little difference in satisfaction among those officials from a jurisdiction with its own local police department compared to those for whom local police services are provided indirectly (e.g., by a special authority/district or through a contract with a neighboring jurisdiction). Meanwhile, in Michigan’s larger jurisdictions, local leaders tend to think their citizens are just about as satisfied as they themselves are with the local police departments. In fact, in jurisdictions with between 5,001-10,000 residents, all of the officials surveyed reported that both they and their citizens were either somewhat or very satisfied with their local police. But in the state’s smaller communities local leaders see a gap. For example, while 90% of leaders from the smallest jurisdictions are satisfied with their local police, 73% think that their citizens feel the same (see Figure 8).
Figure 7Local officials’ own satisfaction, and assessments of citizen satisfaction, with county sheriff (% who say they are “somewhat” or “very” satisfied), by population size
46%
32%
40%
29%
47%
26%
29%
37%
53%
20%
31%
35%
25%
34%
28%
42%
33%
36%
27%
55%
Very satisfied Somewhat satisfied
< 1,500 1,500-5,000 5,001-10,000 10,001-30,000 > 30,000
Figure 8Local officials’ own satisfaction, and assessments of citizen satisfaction, with local police (% who say they are “somewhat” or “very” satisfied), among those jurisdictions directly or indirectly providing law enforcement services, by population size
73%
21%
85%
15%
80%
16%
74%
21%
78%
17%
63%
28%
59%
41%
49%
40%
40%
33%26%
64%
Very satisfied Somewhat satisfied
< 1,500 1,500-5,000 5,001-10,000 10,001-30,000 > 30,000
8 www.closup.umich.edu
The Center for Local, State, and Urban Policy
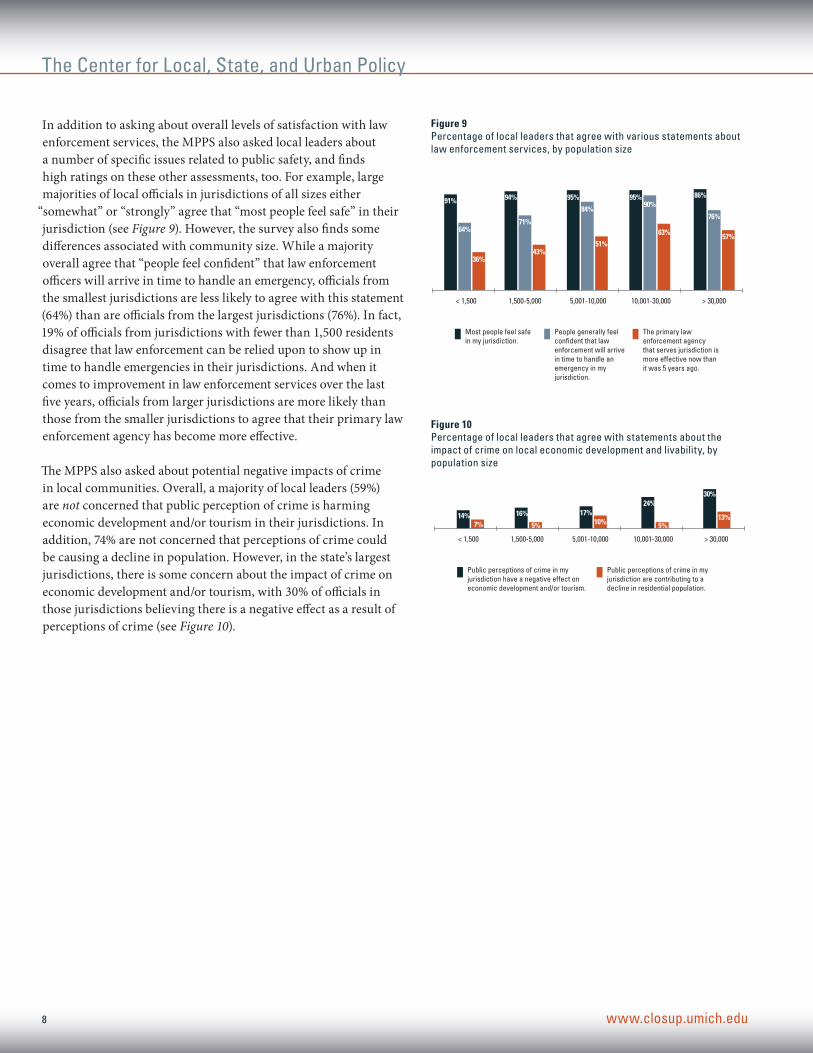
In addition to asking about overall levels of satisfaction with law enforcement services, the MPPS also asked local leaders about a number of specific issues related to public safety, and finds high ratings on these other assessments, too. For example, large majorities of local officials in jurisdictions of all sizes either
“somewhat” or “strongly” agree that “most people feel safe” in their jurisdiction (see Figure 9). However, the survey also finds some differences associated with community size. While a majority overall agree that “people feel confident” that law enforcement officers will arrive in time to handle an emergency, officials from the smallest jurisdictions are less likely to agree with this statement (64%) than are officials from the largest jurisdictions (76%). In fact, 19% of officials from jurisdictions with fewer than 1,500 residents disagree that law enforcement can be relied upon to show up in time to handle emergencies in their jurisdictions. And when it comes to improvement in law enforcement services over the last five years, officials from larger jurisdictions are more likely than those from the smaller jurisdictions to agree that their primary law enforcement agency has become more effective.
The MPPS also asked about potential negative impacts of crime in local communities. Overall, a majority of local leaders (59%) are not concerned that public perception of crime is harming economic development and/or tourism in their jurisdictions. In addition, 74% are not concerned that perceptions of crime could be causing a decline in population. However, in the state’s largest jurisdictions, there is some concern about the impact of crime on economic development and/or tourism, with 30% of officials in those jurisdictions believing there is a negative effect as a result of perceptions of crime (see Figure 10).
Figure 9Percentage of local leaders that agree with various statements about law enforcement services, by population size
Figure 10Percentage of local leaders that agree with statements about the impact of crime on local economic development and livability, by population size
51%
84%
95%
43%
71%
94%91%
64%
36%
90%95%
63%
86%
57%
76%
Most people feel safe in my jurisdiction.
People generally feel confident that law enforcement will arrive in time to handle an emergency in my jurisdiction.
The primary law enforcement agency that serves jurisdiction is more effective now than it was 5 years ago.
< 1,500 1,500-5,000 5,001-10,000 10,001-30,000 > 30,000
10%17%16%14%
7%
24%
5%5%13%
30%
Public perceptions of crime in my jurisdiction have a negative effect on economic development and/or tourism.
Public perceptions of crime in my jurisdiction are contributing to a decline in residential population.
< 1,500 1,500-5,000 5,001-10,000 10,001-30,000 > 30,000

9
Michigan Public Policy Survey
Nearly a quarter of jurisdictions say recruitment and/or retention of law enforcement personnel is a problemOne of the challenges facing many local jurisdictions that provide law enforcement services is recruitment and retention of personnel. Overall, while 31% of Michigan local officials say recruitment and/or retention of law enforcement officers is not a problem at all in their jurisdiction, 22% say it has indeed been a challenge. And these problems, as with so many law enforcement issues, are correlated with population size. Compared with only 20% of small jurisdictions that report experiencing recruitment and retention problems (among those that provide law enforcement directly or indirectly), more of Michigan’s largest jurisdictions (30%) report these challenges (see Figure 11a).
When broken down by region, officials in the Southwest (24%) and Southeast (29%) are somewhat more likely than officials from other regions to say they have experienced challenges with recruitment and/or retention of law enforcement personnel (see Figure 11b).
Figure 11aLocal officials’ assessments of difficulties with local public safety recruitment and/or retention (among those directly or indirectly providing law enforcement services), by population size
Figure 11bLocal officials’ assessments of difficulties with local public safety recruitment and/or retention (among those directly or indirectly providing law enforcement services), by region
30%
23%
17%
28%
28%43%
20%
34%
3%
A significant problem
Somewhat of a problem
Not much of a problem
Don’t know
Not a problem at all
< 1,500 1,500-5,000 5,001-10,000 10,001-30,000 > 30,000
13%17% 17%
13%
21%
40%
17%
41%
14%
22%27%
14%
4%3%
9%
20%
20%
41%
4% 4%1%
15% 8%16%
22%
9%12%
34%
22%
17%
23%
35%
5%
24%
25%
16%
37%
34%
28%
23%29% 28%
Upper Peninsula
Northern Lower
Peninsula
West Central
EastCentral
Southwest Southeast
11%14%23%
A significant problem
Somewhat of a problem
Not much of a problem
Don’t know
Not a problem at all

10 www.closup.umich.edu
The Center for Local, State, and Urban Policy
Nearly half of largest jurisdictions say they do not have enough funding for law enforcement needsLaw enforcement costs in many cases consume a significant portion of government budgets. The MPPS asked local leaders if their jurisdiction has enough funding available to meet the law enforcement needs of their community, and less than half (41%) statewide agree that they do have sufficient funds (see Figure 12a). Meanwhile, 22% specifically disagree that they have sufficient funds, and this sentiment increases to nearly half (47%) of responses given by leaders in Michigan’s biggest jurisdictions. (see Figure 12b).
As noted earlier, some Michigan jurisdictions share law enforcement service delivery with neighboring jurisdictions, either providing services to, or receiving them from, another jurisdiction via contract. The MPPS asked local leaders in these situations whether they feel the division of costs across jurisdictions is appropriate, or are out of whack in some way. Overall, most local leaders think shared service costs are divided appropriately between jurisdictions. Among those that share law enforcement services, 10% think their own jurisdiction is paying too much of the shared costs while only 2% say they are paying too little. Officials from larger jurisdictions are somewhat more likely to say their jurisdiction is paying too much (19%) than are those from jurisdictions with fewer residents (see Figure 13). It is important to note, however, that nearly half (46%) of local leaders from jurisdictions with the smallest population size say they “don’t know” whether they are paying the right amount for shared law enforcement services.
Among those jurisdictions where officials believe overall crime is a “significant” problem for the community, the percentage of officials who say they are paying too much for shared law enforcement services rises to 25%. And in places where officials think their jurisdiction is either paying too much or too little, the percentages who expect to change their law enforcement arrangements in the near future are 12% and 16%, respectively, significantly higher than the 3% of officials overall, reported earlier (see Figure 5).
Figure 12aLocal officials’ assessments of whether jurisdiction has sufficient funding to meet law enforcement needs
Figure 12bWhether local officials agree that their jurisdiction has sufficient funding to meet law enforcement needs, by population size
Figure 13Local officials’ assessments of whether jurisdiction pays fair proportion for shared law enforcement services (among those jurisdictions where services are shared jointly or provided by one jurisdiction for another), by population size
Strongly agree
Somewhat disagree
Somewhat agree
Neither agree nor disagree
Strongly disagree
Don't know
14%
8%
17%
20%
23%
18%
9%10%
21%
12%6%
15%
22%
20%
29%
7%8%
< 1,500 1,500-5,000 5,001-10,000 10,001-30,000 > 30,000
26%
23%
21%
18%
31%
4%28%
12%
19%
34%
18%25%
9%
20%
19%
15%
19%
Strongly agree
Somewhat disagree
Somewhat agree
Neither agree nor disagree
Strongly disagree
Don't know
46%
46%6%
52%
36%
16%
12%
67%
5%4% 3%4%
Jurisdiction pays too much
Jurisdiction pays about the right amount
Jurisdiction does not pay enough
Don't know
< 1,500 1,500-5,000 5,001-10,000 10,001-30,000 > 30,000
16%11% 19%
73%
6%
76%
2%
2%
11
Michigan Public Policy Survey
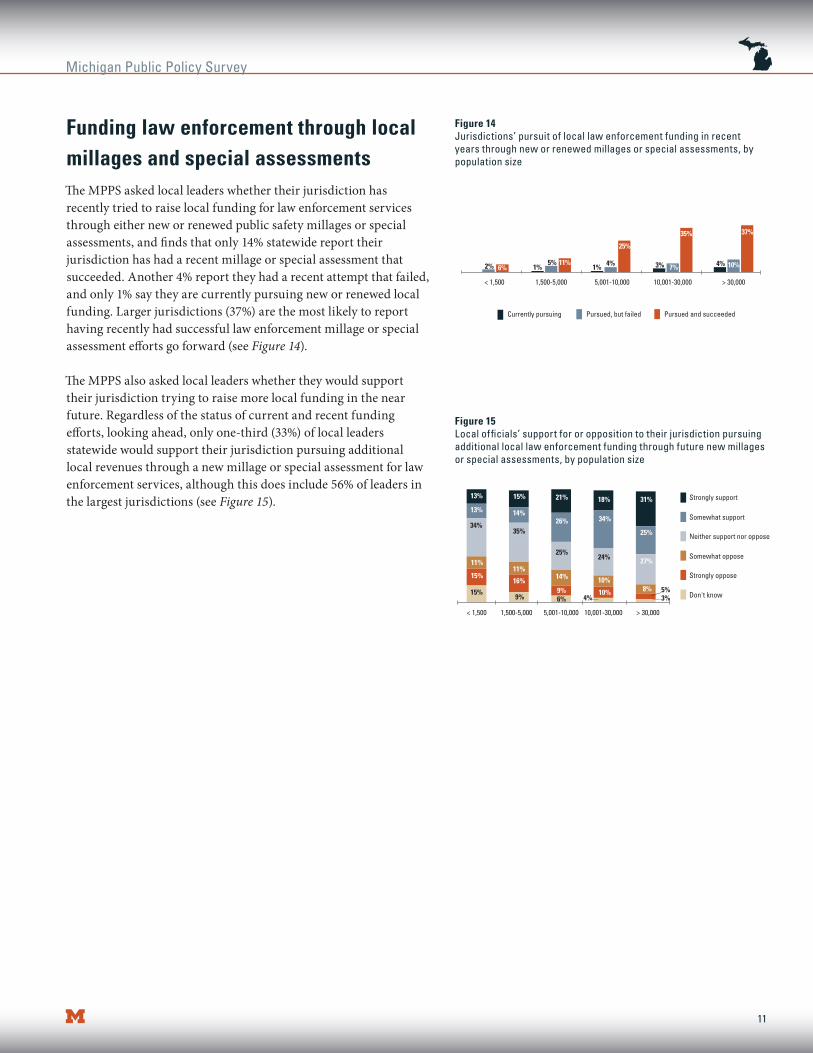
Funding law enforcement through local millages and special assessmentsThe MPPS asked local leaders whether their jurisdiction has recently tried to raise local funding for law enforcement services through either new or renewed public safety millages or special assessments, and finds that only 14% statewide report their jurisdiction has had a recent millage or special assessment that succeeded. Another 4% report they had a recent attempt that failed, and only 1% say they are currently pursuing new or renewed local funding. Larger jurisdictions (37%) are the most likely to report having recently had successful law enforcement millage or special assessment efforts go forward (see Figure 14).
The MPPS also asked local leaders whether they would support their jurisdiction trying to raise more local funding in the near future. Regardless of the status of current and recent funding efforts, looking ahead, only one-third (33%) of local leaders statewide would support their jurisdiction pursuing additional local revenues through a new millage or special assessment for law enforcement services, although this does include 56% of leaders in the largest jurisdictions (see Figure 15).
Figure 14Jurisdictions’ pursuit of local law enforcement funding in recent years through new or renewed millages or special assessments, by population size
Figure 15Local officials’ support for or opposition to their jurisdiction pursuing additional local law enforcement funding through future new millages or special assessments, by population size
25%
11%6% 7%
35%
86%81%
4%3%4%1%1%
37%
10%5%
Currently pursuing Pursued, but failed Pursued and succeeded
< 1,500 1,500-5,000 5,001-10,000 10,001-30,000 > 30,000
2%
15%
11%
34%
11%
16%
25%
14%
21%
26%
6% 4%9%
< 1,500 1,500-5,000 5,001-10,000 10,001-30,000 > 30,000
18%
35%
14%
31%
25%
27%24%
10%
34%
9%15% 10%
15%
13%
13%
8%
Strongly support
Somewhat oppose
Somewhat support
Neither support nor oppose
Strongly oppose
Don't know5%3%

12 www.closup.umich.edu
The Center for Local, State, and Urban Policy
A quarter of Michigan local governments use cost recovery practices to help fund their law enforcement Aside from new millages or special assessments, another approach available to local governments to offset law enforcement expenses is the use of cost recovery policies and ordinances. These might include policies such as charging for police response, or imposing extra fees on drunk drivers or moving vehicle citations, etc. While many of the officials from jurisdictions that provide or contract for law enforcement services surveyed in the MPPS were not sure whether their jurisdiction uses such policies currently, overall, nearly a quarter (24%) report they do have one or more such policies in place. As shown in Figure 16, this practice is strongly correlated with population size, with the state’s largest jurisdictions much more likely than the smallest to pursue this strategy (49% vs. 12%).
Among those jurisdictions that do have cost recovery policies for law enforcement services, the majority (54%) of local leaders are generally satisfied with their experiences (see Figure 17). Only 12% are dissatisfied with the approach, with relatively few differences by jurisdiction size or region.
Figure 16Jurisdictions that use cost recovery policies or ordinances for law enforcement services (among those directly or indirectly providing law enforcement services), by population size
Figure 17Local officials’ satisfaction with their jurisdiction’s use of cost recovery for law enforcement services (among those with cost recovery policies or ordinances)
34%
54%
12%
56%
22%14%
25%
61%
Yes
No
Don’t know
< 1,500 1,500-5,000 5,001-10,000 10,001-30,000 > 30,000
36%23% 49%
42%
8%12%
52%
Very satisfied
Somewhat dissatisfied
Somewhat satisfied
Neither satisfied nor dissatisfied
Very dissatisfied
Don't know
10%
2% 9%
26% 37%
17%

13
Michigan Public Policy Survey
ConclusionMany local leaders across Michigan report that their community faces challenges from crime, especially when it comes to drug crimes and property crimes. In the state’s largest jurisdictions, these and other types of crimes are reported even more frequently as public sector challenges, compared with smaller communities.
To ensure public safety, the state’s local jurisdictions utilize a range of approaches to deliver law enforcement services. While all counties have sheriff’s agencies, only 28% of Michigan’s cities, villages and townships run their own police departments. Another 24% of these local governments don’t run their own police departments, but instead they contract with neighboring jurisdictions, or with the county sheriff, to provide public safety services. Meanwhile, just under half (48%) of Michigan local jurisdictions neither run their own police department nor contract with another jurisdiction. In effect, these jurisdictions simply rely on the county sheriff and/or state police to respond when called.
Michigan’s local leaders express high levels of satisfaction with public safety services provided in their jurisdiction, regardless of how those services are delivered. The greatest levels of satisfaction, however, are in regard to a jurisdiction’s own local police department. Local government leaders also think the citizens in their jurisdiction are generally satisfied with law enforcement services, if at slightly lower levels than the leaders’ own satisfaction.
However, less than half (41%) of local leaders in Michigan say that their jurisdictions have sufficient funds available to meet their law enforcement needs, while 22% explicitly say they do not have enough funding available. Meanwhile, relatively few (14%) report that their jurisdictions have recently tried and succeeded to raise local funding through millages and/or special assessments, and only 33% would support pursuing additional local revenues in the near future.
Notes1. Barnett, J.L., Sheckells, C.L., Peterson, S.and Tydings, E. M. (2014, December 17). “State and Local Government Summary
Report.” 2012 Census of Governments. Retrieved from http://www2.census.gov/govs/local/summary_report.pdf
2. State and Local Government Finances by Level of Government and by State: 2013. (2016). U.S. Census Bureau. Retrieved from http://factfinder.census.gov/faces/tableservices/jsf/pages/productview.xhtml?src=bkmk
3. Law Enforcement Population Trend. (2016, March) Michigan Commission on Law Enforcement Standards. Retrieved from http://www.michigan.gov/documents/mcoles/LEOPop_03-31-16_520255_7.pdf
4. Feldscher, K. (2014, November 10). FBI data: Michigan’s crime rates drop but Detroit remains among nation’s most dangerous cities. MLive. Retrieved from http://www.mlive.com/lansing-news/index.ssf/2014/11/fbi_data_michigans_crime_rates.html.
5. Michigan Department of Health and Human Services. (2016). Michigan Population, 1990-2014. Retrieved from http://www.michigan.gov/mdhhs/0,5885,7-339-73970_2944_5325---,00.html
6. Pratt, E. (2015, July 20). Revenue sharing in the context of state budgetary pressures. Senate Fiscal Agency. Retrieved from http://www.senate.michigan.gov/sfa/Publications/Memos/RevSharePresentation072015.pdf
7. Mills, S. B. & Ivacko, T. (2015). Fiscal health rated relatively good for most jurisdictions, but improvement slows and decline continues for many. Ann Arbor, MI: Center for Local, State, and Urban Policy at the Gerald R. Ford School of Public Policy, University of Michigan. Retrieved from http://closup.umich.edu/files/mpps-fiscal-health-2015.pdf

14 www.closup.umich.edu
The Center for Local, State, and Urban Policy
Survey Background and MethodologyThe MPPS is a biannual survey of each of Michigan’s 1,856 units of general purpose local government, conducted once each spring and fall. While the spring surveys consist of multiple batteries of the same “core” fiscal, budgetary and operational policy questions and are designed to build-up a multi-year time- series of data, the fall surveys focus on various other topics.
In the Fall 2015 iteration, surveys were sent by the Center for Local, State, and Urban Policy (CLOSUP) via the internet and hardcopy to top elected and appointed officials (including county administrators and board chairs; city mayors and managers; village presidents, clerks, and managers; and township supervisors, clerks, and managers) from all 83 counties, 278 cities, 255 villages, and 1,240 townships in the state of Michigan.
The Fall 2015 wave was conducted from October 5 - December 8, 2015. A total of 1,418 jurisdictions in the Fall 2015 wave returned valid surveys (66 counties, 226 cities, 193 villages, and 933 townships), resulting in a 76% response rate by unit. The margin of error for the survey for the survey as a whole is +/- 1.26%. The key relationships discussed in the above report are statistically significant at the p<.05 level or below, unless otherwise specified. Missing responses are not included in the tabulations, unless otherwise specified. Some report figures may not add to 100% due to rounding within response categories. Quantitative data are weighted to account for non-response. “Voices Across Michigan” verbatim responses, when included, may have been edited for clarity and brevity. Contact CLOSUP staff for more information.
Detailed tables of the data analyzed in this report broken down three ways—by jurisdiction type (county, city, township, or village); by population size of the respondent’s community, and by the region of the respondent’s jurisdiction—are available online at the MPPS homepage: http://closup.umich.edu/mpps.php.
The survey responses presented here are those of local Michigan officials, while further analysis represents the views of the authors. Neither necessarily reflects the views of the University of Michigan, or of other partners in the MPPS.
15
Michigan Public Policy Survey
Previous MPPS reports
Local leaders say police-community relations are good throughout Michigan, but those in large cities are concerned about potential civil unrest
over police use-of-force (February 2016)
Report: Responding to budget surplus vs. deficit: the preferences of Michigan’s local leaders and citizens (December 2015)
Michigan’s local leaders concerned about retiree health care costs and their governments’ ability to meet future obligations (October 2015)
Fiscal health rated relatively good for most jurisdictions, but improvement slows and decline continues for many (September 2015)
Confidence in Michigan’s direction declines among state’s local leaders (August 2015)
Michigan local government leaders’ views on private roads (July 2015)
Few Michigan jurisdictions have adopted Complete Streets policies, though many see potential benefits (June 2015)
Michigan local leaders have positive views on relationships with county road agencies, despite some concerns (May 2015)
Michigan local government leaders say transit services are important, but lack of funding discourages their development (April 2015)
Michigan local leaders see need for state and local ethics reform (March 2015)
Local leaders say Michigan road funding needs major increase, but lack consensus on options that would raise the most revenue (February 2015)
Michigan local government leaders’ views on employee pay and benefits (January 2015)
Despite increasingly formal financial management, relatively few Michigan local governments have adopted recommended policies
(December 2014)
Most Michigan local officials are satisfied with their privatized services, but few seek to expand further (November 2014)
Michigan local governments finally pass fiscal health tipping point overall, but one in four still report decline (October 2014)
Beyond the coast, a tenuous relationship between Michigan local governments and the Great Lakes (September 2014)
Confidence in Michigan’s direction holds steady among state’s local leaders (August 2014)
Wind power as a community issue in Michigan (July 2014)
Fracking as a community issue in Michigan (June 2014)
The impact of tax-exempt properties on Michigan local governments (March 2014)
Michigan’s local leaders generally support Detroit bankruptcy filing despite some concerns (February 2014)
Michigan local governments increasingly pursue placemaking for economic development (January 2014)
Views on right-to-work legislation among Michigan’s local government leaders (December 2013)
Michigan local governments continue seeking, and receiving, union concessions (October 2013)
Michigan local government fiscal health continues gradual improvement, but smallest jurisdictions lagging (September 2013)
Local leaders evaluate state policymaker performance and whether Michigan is on the right track (August 2013)

16 www.closup.umich.edu
The Center for Local, State, and Urban Policy
Trust in government among Michigan’s local leaders and citizens (July 2013)
Citizen engagement in the view of Michigan’s local government leaders (May 2013)
Beyond trust in government: government trust in citizens? (March 2013)
Local leaders support reforming Michigan’s system of funding local government (January 2013)
Local leaders support eliminating Michigan’s Personal Property Tax if funds are replaced, but distrust state follow-through
(November 2012)
Michigan’s local leaders satisfied with union negotiations (October 2012)
Michigan’s local leaders are divided over the state’s emergency manager law (September 2012)
Fiscal stress continues for hundreds of Michigan jurisdictions, but conditions trend in positive direction overall (September 2012)
Michigan’s local leaders more positive about Governor Snyder’s performance, more optimistic about the state’s direction (July 2012)
Data-driven decision-making in Michigan local government (June 2012)
State funding incentives increase local collaboration, but also raise concerns (March 2012)
Local officials react to state policy innovation tying revenue sharing to dashboards and incentive funding (January 2012)
MPPS finds fiscal health continues to decline across the state, though some negative trends eased in 2011
(October 2011)
Public sector unions in Michigan: their presence and impact according to local government leaders (August 2011)
Despite increased approval of state government performance, Michigan’s local leaders are concerned about the state’s direction (August 2011)
Local government and environmental leadership: views of Michigan’s local leaders (July 2011)
Local leaders are mostly positive about intergovernmental cooperation and look to expand efforts (March 2011)
Local government leaders say most employees are not overpaid, though some benefits may be too generous
(February 2011)
Local government leaders say economic gardening can help grow their economies (November 2010)
Local governments struggle to cope with fiscal, service, and staffing pressures (August 2010)
Michigan local governments actively promote U.S. Census participation (August 2010)
Fiscal stimulus package mostly ineffective for local economies (May 2010)
Fall 2009 key findings report: educational, economic, and workforce development issues at the local level
(April 2010)
Local government officials give low marks to the performance of state officials and report low trust in Lansing
(March 2010)
Local government fiscal and economic development issues (October 2009)
All MPPS reports are available online at: http://closup.umich.edu/mpps.php

Michigan Public Policy Survey
www.closup.umich.edu
The Center for Local, State, and Urban Policy (CLOSUP), housed at the University of Michigan’s Gerald R. Ford School of Public Policy, conducts and supports applied policy research designed to inform state, local, and urban policy issues. Through integrated research, teaching, and outreach involving academic researchers, students, policymakers and practitioners, CLOSUP seeks to foster understanding of today’s state and local policy problems, and to find effective solutions to those problems.
web: www.closup.umich.eduemail: [email protected]: @closupphone: 734-647-4091
University of Michigan
Center for Local, State, and Urban Policy
Gerald R. Ford School of Public Policy
Joan and Sanford Weill Hall
735 S. State Street, Suite 5310
Ann Arbor, MI 48109-3091
Regents of the University of Michigan
Michael J. BehmGrand BlancMark J. Bernstein Ann ArborLaurence B. DeitchBloomfield HillsShauna Ryder DiggsGrosse PointeDenise Ilitch Bingham FarmsAndrea Fischer NewmanAnn ArborAndrew C. RichnerGrosse Pointe ParkKatherine E. WhiteAnn ArborMark S. Schlissel(ex officio)