
AMS 14C dating at CIRCE: The Major Temple in Cumae (NA â ...

RADIOCARBON, Vol 49, Nr 1, 2007, p 47–67 © 2007 by the Arizona Board of Regents on behalf of the University of Arizona
47
MORTAR DATING USING AMS 14C AND SEQUENTIAL DISSOLUTION: EXAMPLES FROM MEDIEVAL, NON-HYDRAULIC LIME MORTARS FROM THE ÅLAND ISLANDS, SW FINLAND
Alf Lindroos1 • Jan Heinemeier2 • Åsa Ringbom3 • Mats Braskén4 • Árny Sveinbjörnsdóttir5
ABSTRACT. Non-hydraulic mortars contain datable binder carbonate with a direct relation to the time when it was used ina building, but they also contain contaminants that disturb radiocarbon dating attempts. The most relevant contaminants eitherhave a geological provenance and age or they can be related to delayed carbonate formation or devitrification and recrystal-lization of the mortar. We studied the mortars using cathodoluminescence (CL), mass spectrometry (MS), and acceleratormass spectrometry (AMS) in order to identify, characterize, and date different generations of carbonates. The parameters—dissolution rate, 13C/12C and 18O/16O ratios, and 14C age—were measured or calculated from experiments where the mortarswere dissolved in phosphoric acid and each successive CO2 increment was collected, analyzed, and dated. Consequently,mortar dating comprises a CL characterization of the sample and a CO2 evolution pressure curve, a 14C age, and stable isotopeprofiles from at least 5 successive dissolution increments representing nearly total dissolution. The data is used for modelingthe interfering effects of the different carbonates on the binder carbonate age. The models help us to interpret the 14C age pro-files and identify CO2 increments that are as uncontaminated as possible. The dating method was implemented on medievaland younger mortars from churches in the Åland Archipelago between Finland and Sweden. The results are used to developthe method for a more general and international use.
INTRODUCTION
It has been known since the 1960s that it is possible to date old lime mortars using standard radio-carbon carbonate procedures (Labeyrie and Delibrias 1964; Stuiver and Smith 1965). However, themethod is sensitive to contamination effects that are poorly understood and has therefore been usedwith great precaution and with varying success in archaeometry (e.g. Baxter and Walton 1970; Folkand Valastro 1976; Van Strydonck et al. 1983; Willaime et al. 1983). Some systematic studies ofmortar hardening and dissolution versus chemical activity of stable isotopes have been published(Pachiaudi et al. 1986; Van Strydonck et al. 1986, 1989; Van Strydonck and Dupas 1991; Ambers1987), but the link to carbonate mineralogy and stable isotope geochemistry has been weak. Accel-erator mass spectrometry (AMS) 14C dating analyses of mortars have been reported by our researchgroup over the past 10 yr (Ringbom and Remmer 1995, 2000, 2005; Heinemeier et al. 1997; Hale etal. 2003; Ringbom et al. 2006). In these publications, we have presented dates from the ÅlandIslands, as well as classical and medieval Rome and 17th century America. Several hundred sampleshave been dated in 2 or sometimes 3 CO2 fractions, and more recently in 5 fractions. The datingmethod with sample preparation and quality control is based on the guidelines proposed by Folk andValastro (1976) in their decay counting studies, but the sample quality control and the preparationtechniques have been further developed. Cathodoluminescence (CL) was introduced to the samplecontrol, and sequential dissolution and AMS were introduced into the dating procedure. The inter-pretation of the AMS data from the sequential sample dissolutions has been described earlier (Haleet al. 2003; Ringbom et al. 2003), but the theoretical foundations for the method, based on stable iso-tope activity of carbon and oxygen, has only been published locally in a doctoral thesis (Lindroos2005). In this article, we will describe the theoretical background for the interpretation of AMS 14Cdata of mortar. Different carbonate phases commonly present in non-hydraulic mortars will bedescribed in terms of CL characteristics, dissolution behavior in phosphoric acid hydrolysis, stable
1Åbo Akademi University, Finland, Dept. of Geology and Mineralogy. Corresponding author. Email: [email protected] of Århus, Denmark, AMS Dating Centre.3Åbo Akademi University, Finland, Dept. of Art History.4Swedish Polytechnic, Vasa, Finland.5University of Iceland, Science Institute.
https://doi.org/10.1017/S0033822200041898Downloaded from https://www.cambridge.org/core. IP address: 65.21.228.167, on 21 Oct 2021 at 18:52:19, subject to the Cambridge Core terms of use, available at https://www.cambridge.org/core/terms.

48 A Lindroos et al.
isotope signatures, and chemical activity. Case studies of medieval and younger mortars from theÅland Islands in the northern Baltic Sea will be presented and interpreted in these terms. The sam-ples from Åland have been of great importance in developing the dating method for a more generaluse.
MINERALOGY OF NON-HYDRAULIC MORTARS
All mortars have several soluble carbonate phases that produce carbon dioxide during acid hydrol-ysis and contribute to the 14C age of the mortar. Generally, we have the following common phases:
• The dominant and most relevant carbonate phase for dating in non-hydraulic mortars is the cal-citic binder. In an ideal case, this phase has a well-defined 14C age of historical or archaeologi-cal interest. The 14C age reflects the hardening of mortar according to the reaction below(Equation 1).
Ca(OH)2 + CO2 → CaCO3 + H2O (1)
Slaked lime + atmospheric carbon dioxide = calcite + water
• The binder is, however, a complex system of calcites with different growth history, habitus, andtrace element and isotope chemistry. The most important factor controlling calcite growth ispH, which evolves from super-alkaline towards neutral during the hardening of the mortar.
• Calcitic lime lumps are very common. They may form before the mortar is mixed with anaggregate and used. The lumps are homogenous white spots of varying size. They are soft andoften they display a concentric structure with a fine-grained crust and a more coarse-grainedinterior. The interior may have recrystallizations.
• The slaked lime usually contains residues of incompletely burned limestone. These residues arenot identical to the original unburned limestone, as the high temperatures have altered theirhabiti, dissolution rate, and to some extent even their stable isotope signature (Lindroos 2005and references therein).
• Recrystallizations caused by percolating water in mortared constructions are common.• Natural stable carbonate minerals are very likely to be incorporated into the mortar paste during
the mixing of the lime with a geological aggregate or filler materials like sand and gravel. Thereadily soluble minerals calcite and aragonite are of relevance for dating purposes, while othercarbonate minerals are either rare or poorly soluble in cold phosphoric acid, which is typicallyused for acid hydrolysis and gas evolution. Common constituents are limestone and marblegrains and splinters and sandstone grains with a carbonate matrix.
• It is common to find charcoal and ashes in mortars. Ashes contain calcite and potassiumhydroxide. The former contributes directly to the 14C age, and the latter raises the pH and affectsthe mineral chemistry and the chemical activities of the stable isotopes.
IDENTIFICATION AND CHARACTERIZATION OF THE MORTAR CARBONATES
The interpretation of 14C data from a mortar containing several soluble carbonate phases of differentages requires that the carbonates are identified and that their solubility is either known or can bedetermined or modeled from data collected during the dissolution procedure. The CO2 pressurecurve and the stable isotope ratios of carbon and oxygen in the dated CO2 gas increments are themost useful parameters as they are directly linked to the 14C/12C ratio determined for dating. It isimportant to consider the following properties.
https://doi.org/10.1017/S0033822200041898Downloaded from https://www.cambridge.org/core. IP address: 65.21.228.167, on 21 Oct 2021 at 18:52:19, subject to the Cambridge Core terms of use, available at https://www.cambridge.org/core/terms.

Mortar Dating Using AMS 14C and Sequential Dissolution 49
Habitus
The mortar carbonates are usually easy to identify using a petrographic microscope (e.g. Deer et al.1992). However, all carbonates are usually calcite and commonly they are all fine-grained. In thinsections of mortar, some of the phases can be readily identified, for example, natural aggregate car-bonates such as marbles, lime lumps, and unburned residues, but there are usually problems as well:
• The non-hydraulic mortars are often soft, and it may be difficult to prepare proper thin sections.• The natural carbonates may be fine-grained and very similar to the binder carbonates.• The binder carbonates are not discrete phases with well-defined habiti, but continuous series
with respect to crystallinity, trace element and stable isotope ratios, and sometimes even 14C agewhen voluminous constructions are considered (Sonninen et al. 1985).
• A thin section represents only a small part of the usually rather heterogeneous sample. Fracturesand voids with efflorescent recrystallizations may or may not have been included.
• After the sample has been crushed, sieved, and homogenized for dating, it is even more difficultto distinguish between the different carbonate phases.
A very useful complement to petrographic microscopy is cathodoluminescence (CL). This methodis especially sensitive when it comes to distinguishing between carbonate phases with slightly dif-ferent crystallinity and trace element chemistry (e.g. Marshall 1988). It is possible to inspect mortarpieces directly or after preparation of cut and polished surfaces. Grain-size fractions can be pressedinto pellets, or alternatively the grains can be spread over a glass backing. We have used the latterapproach because it requires less material and does not deform or break soft grains. It is possible toassess how many contaminants are in the grain-size fractions by performing image analyses (IA)(see e.g. Figure 14 and text), but the results are at best only semi-quantitative due to many problems(e.g. variable luminescence, segmentation problems, etc.; Lindroos 2005). Below, we present someCL images of common calcite phases in non-hydraulic mortars (Figure 1).
The most important factor determining the color and intensity of the luminescence is the Mn2+/Fe2+
ratio in the calcite (e.g. Habermann et al. 2000). The chemical activity of these ions is controlled bythe decreasing pH in crystallizing mortars.
Solubility
14C dating and the determination of δ13C and δ18O of carbonates are carried out by phosphoric acidhydrolysis of the carbonates in the samples. In mass spectrometry (MS), the measurement is donedirectly on CO2, while the AMS dating is performed after reduction to graphite. In our laboratory,concentrated H3PO4 (85 wt%) is used. By assuming that the dissolution rate (volume dissolved perunit time) is proportional to the remaining grain surface area, the dissolution course of a single,homogenous carbonate grain-size fraction can be modeled according to Equation 2:
ln(1–F) = –Γt (2)
where F is the progress variable (the dissolved fraction of the grain volume) going from 0 → 1, Γ isthe dissolution constant, and t is the dissolution time. The relationship implies that the decrease ofthe radius of a dissolving grain is a linear function of time. It is strictly valid for spherical grains ofuniform size and homogenous chemistry. Experiments on narrow grain-size windows of homoge-neous marble and limestone splinter have shown that the dissolution can be fairly well modeled withEquation 2 (Lindroos 2005). Usually, the dissolution starts with a rapid release of CO2, but the reac-tion stabilizes within a few seconds and can thereafter be described with a constant Γ value. A prac-
https://doi.org/10.1017/S0033822200041898Downloaded from https://www.cambridge.org/core. IP address: 65.21.228.167, on 21 Oct 2021 at 18:52:19, subject to the Cambridge Core terms of use, available at https://www.cambridge.org/core/terms.

50 A Lindroos et al.
tical problem to be considered is that very fine-grained fractions are sometimes used in datingbecause they are enriched in soft carbonates and the sample may originally have been small. Thismay cause modeling problems because the sample tends to float on the viscous acid, and no linearrelation will be registered in the logarithmic plots.
Mortars are rarely single-carbonate systems, but instead tend to be multiphase systems with carbon-ates having different dissolution constants. They can be characterized in terms of discrete Γ valuesif the phases are significantly different, which is usually the case. Figure 2 shows a case where 3 car-bonate phases having different dissolution constants add up to form a composite curve (Figure 2A).Time intervals dominated by CO2 evolution from only 1 carbonate phase should define a straightline in the plot. Figure 2B presents the 14C ages of the 4 increments and a final increment of the res-idue after overnight dissolution. The third increment represents 23.1% of the sample. Together withthe second synchronous increment they represent 50.8% of the sample; their combined age of 736 ±28 BP has been used in archaeometry (Ringbom and Remmer 2005 and references therein).
Isotopic Signature
Technical and natural carbonates usually differ significantly in their isotopic signatures. Therefore,it may be tempting to use the delta values (see Hoefs 2004) of carbon and oxygen isotopes as a mea-sure of binder carbonates’ contamination by limestone in the same way as in petrologic mixing sys-tems. Mortar carbonate systems tend, however, to be too complex for similar modeling, and thereare also some analytical problems to consider related to CO2 solubility in the 85% acid (Walters etal. 1972; Wachter and Hayes 1985; Swart et al. 1991). Proper isotope measurements should be done
Figure 1 CL images of mortars from the church of Saltvik. A) Dark mortar binder with inclusions of limestone (LS) in red,quartz (Q) in blue, feldspar (F) in green, and a lime lump (R)—in this case a residue after lime burning. B) Grain-size fraction(<38 µm) from a contaminated sample.
https://doi.org/10.1017/S0033822200041898Downloaded from https://www.cambridge.org/core. IP address: 65.21.228.167, on 21 Oct 2021 at 18:52:19, subject to the Cambridge Core terms of use, available at https://www.cambridge.org/core/terms.

Mortar Dating Using AMS 14C and Sequential Dissolution 51
using a large excess of dehydrated 100% acid; otherwise, the produced CO2 will strive towards equi-librium with dissolved CO2 in the water and acid and in the water produced during hydrolysis(Equation 1). This will lead to enrichment of heavy isotopes in solution and light isotopes in the gasphase. The equilibration process is, however, disturbed every time a gas increment is chilled out, butthe general trend is towards a heavier isotopic signature towards the end of the dissolution. In ourdissolution procedure, we usually extract the last increment after dissolution overnight. This incre-ment is in near equilibrium with the dissolved phase that is enriched in heavy isotopes. Therefore, ittends to have a heavier signature regardless of whether it is affected by contaminants or not.
14C Age
The hardening process of a mortar is relatively rapid compared with the half-life of 14C and the res-olution of the dating method. Normally, the hardening is completed within weeks or months at thesurface of the mortar (Pachiaudi et al. 1986), but it can take years and decades before the whole con-struction has carbonated (Delibrias and Labeyrie 1965; Van Strydonck and Dupas 1991) and evencenturies for voluminous structures (Sonninen et al. 1985). Medieval mortars may still be incom-pletely carbonated and show an alkaline reaction due to residual Ca(OH)2 (our data). The resolutionof the 14C method is a relatively small percentage of the age.
The age, T, of a mortar will be the ages Tn of the n different soluble carbonate phases Mn weightedwith their relative proportions, so that:
(3)
The apparent age of the whole system, after total dissolution is:
(4)
and the age of any single phase is:
(5)
Figure 2 A) Cumulative CO2 pressure curve converted to a –ln(1–F) versus t plot. For each increment, a Γ (G) value isdefined and a regression line is fitted. The slopes of the lines are Γ values. The third increment has the best ln-linear fit,which is the most well-defined Γ value. The pressure drops during chill-outs of CO2 have been omitted from the graph.B) 14C ages and sizes of the increments 1–4 in A and a fifth increment from the residue.
G= 0.0043
R2 = 0.9818G = 0.0007R2 = 0.9774
G = 0.0003
R2 = 0.9886
G = 0.0001R2 = 0.9731
0
0.5
1
1.5
2
2.5
0 1000 2000 3000 4000 5000 6000 7000
Sund, sacristySample Suka 034 (AAR-7570, 1-4, 46-75µm)
-ln(1-F)
t (s)
A
200
400
600
800
1000
1200
1400
0 0.2 0.4 0.6 0.8 1
Increments
C-14 age BP
C-14 age BP
Dissolution progress
F
Sund, sacristySample Suka034 (AAR-7570,1-5)
B
i∑ 1nMi 1= =
Ttot 1 λ⁄ M1eT1λ–
M2eT2λ– …Mne
Tnλ–+ +( )ln–=
Ti 1 λ⁄ eTtotλ–
M1eT1λ–
M2eT2λ– … Mi 1– e
Ti– 1λ–Mi 1+ e
Ti– 1λ+ …–––––– MneTnλ–
–( ) Mi⁄( )ln–=
https://doi.org/10.1017/S0033822200041898Downloaded from https://www.cambridge.org/core. IP address: 65.21.228.167, on 21 Oct 2021 at 18:52:19, subject to the Cambridge Core terms of use, available at https://www.cambridge.org/core/terms.
52 A Lindroos et al.
Incremental dissolution introduces the chemical activities or solubilities of the carbonate phases intothe system. The phases Mn will now be split into CO2 gas for dating and CaCO3 residue. The relationbetween the gas and the residue is expressed in Equation 2. As the amount of dissolved materialfrom each carbonate phase is a function of time (t), we express the dissolution-time dependent 12C/14C ratio accordingly:
(6)
Positive M values represent liberated CO2 and negative M values represent residual CaCO3. Phasescontaining only dead carbon can be omitted from the denominator.
MODELING 14C AGE PROFILES
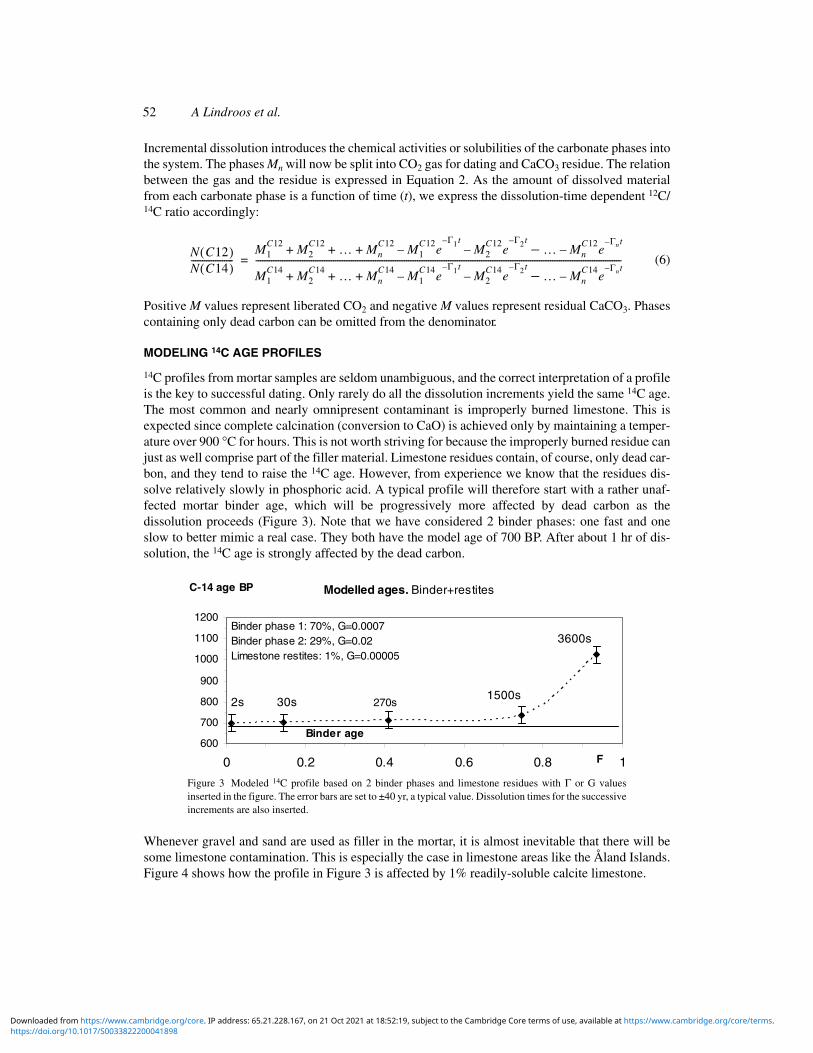
14C profiles from mortar samples are seldom unambiguous, and the correct interpretation of a profileis the key to successful dating. Only rarely do all the dissolution increments yield the same 14C age.The most common and nearly omnipresent contaminant is improperly burned limestone. This isexpected since complete calcination (conversion to CaO) is achieved only by maintaining a temper-ature over 900 °C for hours. This is not worth striving for because the improperly burned residue canjust as well comprise part of the filler material. Limestone residues contain, of course, only dead car-bon, and they tend to raise the 14C age. However, from experience we know that the residues dis-solve relatively slowly in phosphoric acid. A typical profile will therefore start with a rather unaf-fected mortar binder age, which will be progressively more affected by dead carbon as thedissolution proceeds (Figure 3). Note that we have considered 2 binder phases: one fast and oneslow to better mimic a real case. They both have the model age of 700 BP. After about 1 hr of dis-solution, the 14C age is strongly affected by the dead carbon.
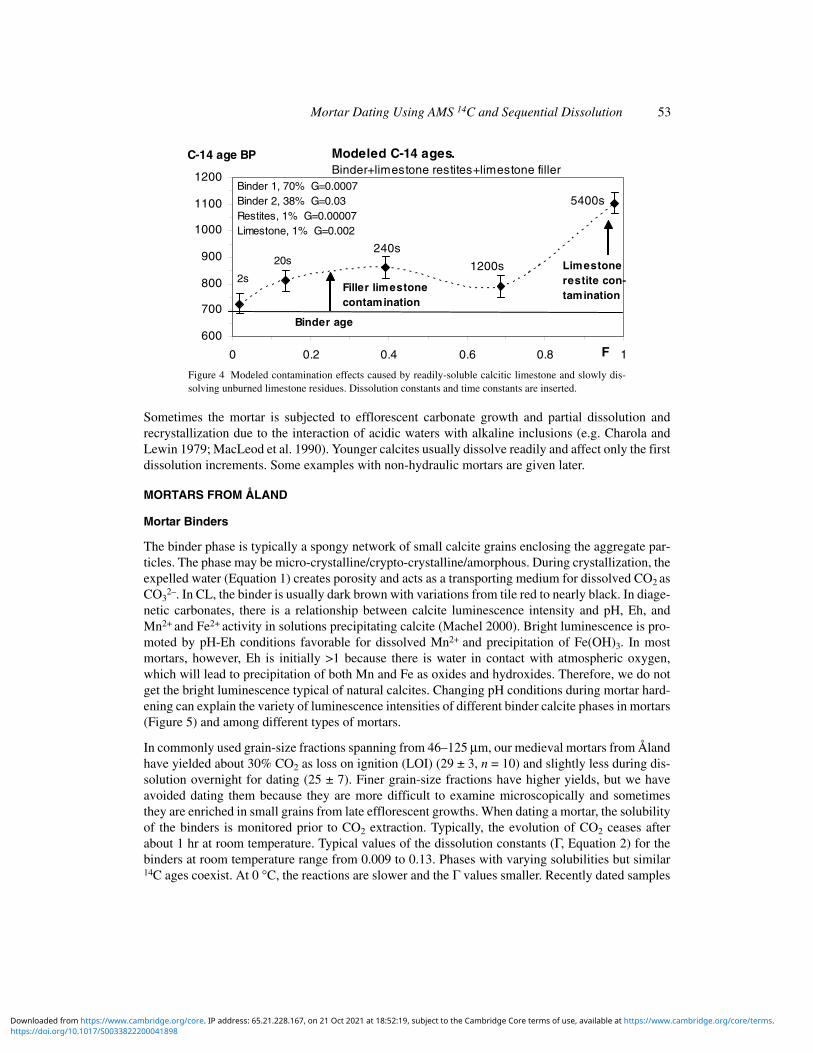
Whenever gravel and sand are used as filler in the mortar, it is almost inevitable that there will besome limestone contamination. This is especially the case in limestone areas like the Åland Islands.Figure 4 shows how the profile in Figure 3 is affected by 1% readily-soluble calcite limestone.
Figure 3 Modeled 14C profile based on 2 binder phases and limestone residues with Γ or G valuesinserted in the figure. The error bars are set to ±40 yr, a typical value. Dissolution times for the successiveincrements are also inserted.
N C12( )N C14( )-------------------
M1C12
M2C12 … Mn
C12M1
C12e
Γ1t–– M2
C12e
Γ2t–…–– Mn
C12e
Γnt––+ + +
M1C14
M2C14 … Mn
C14M1
C14e
Γ1t–M2
C14e
Γ2t–…––– Mn
C14e
Γnt––+ + +
---------------------------------------------------------------------------------------------------------------------------------------------------------------------=
C-14 age BP
600
700
800
900
1000
1100
1200
0 0.2 0.4 0.6 0.8 1
2s 30s 270s1500s
3600s
Modelled ages. Binder+restites
F
Binder phase 1: 70%, G=0.0007Binder phase 2: 29%, G=0.02Limestone restites: 1%, G=0.00005
Binder age
https://doi.org/10.1017/S0033822200041898Downloaded from https://www.cambridge.org/core. IP address: 65.21.228.167, on 21 Oct 2021 at 18:52:19, subject to the Cambridge Core terms of use, available at https://www.cambridge.org/core/terms.
Mortar Dating Using AMS 14C and Sequential Dissolution 53
Sometimes the mortar is subjected to efflorescent carbonate growth and partial dissolution andrecrystallization due to the interaction of acidic waters with alkaline inclusions (e.g. Charola andLewin 1979; MacLeod et al. 1990). Younger calcites usually dissolve readily and affect only the firstdissolution increments. Some examples with non-hydraulic mortars are given later.
MORTARS FROM ÅLAND
Mortar Binders
The binder phase is typically a spongy network of small calcite grains enclosing the aggregate par-ticles. The phase may be micro-crystalline/crypto-crystalline/amorphous. During crystallization, theexpelled water (Equation 1) creates porosity and acts as a transporting medium for dissolved CO2 asCO3
2–. In CL, the binder is usually dark brown with variations from tile red to nearly black. In diage-netic carbonates, there is a relationship between calcite luminescence intensity and pH, Eh, andMn2+ and Fe2+ activity in solutions precipitating calcite (Machel 2000). Bright luminescence is pro-moted by pH-Eh conditions favorable for dissolved Mn2+ and precipitation of Fe(OH)3. In mostmortars, however, Eh is initially >1 because there is water in contact with atmospheric oxygen,which will lead to precipitation of both Mn and Fe as oxides and hydroxides. Therefore, we do notget the bright luminescence typical of natural calcites. Changing pH conditions during mortar hard-ening can explain the variety of luminescence intensities of different binder calcite phases in mortars(Figure 5) and among different types of mortars.
In commonly used grain-size fractions spanning from 46–125 µm, our medieval mortars from Ålandhave yielded about 30% CO2 as loss on ignition (LOI) (29 ± 3, n = 10) and slightly less during dis-solution overnight for dating (25 ± 7). Finer grain-size fractions have higher yields, but we haveavoided dating them because they are more difficult to examine microscopically and sometimesthey are enriched in small grains from late efflorescent growths. When dating a mortar, the solubilityof the binders is monitored prior to CO2 extraction. Typically, the evolution of CO2 ceases afterabout 1 hr at room temperature. Typical values of the dissolution constants (Γ, Equation 2) for thebinders at room temperature range from 0.009 to 0.13. Phases with varying solubilities but similar14C ages coexist. At 0 °C, the reactions are slower and the Γ values smaller. Recently dated samples
Figure 4 Modeled contamination effects caused by readily-soluble calcitic limestone and slowly dis-solving unburned limestone residues. Dissolution constants and time constants are inserted.
C-14 age BP
600
700
800
900
1000
1100
1200
0 0.2 0.4 0.6 0.8 1
Modeled C-14 ages. Binder+limestone restites+limestone filler
Binder age
Filler limestonecontamination
Limestonerestite con- tamination
F
Binder 1, 70% G=0.0007Binder 2, 38% G=0.03Restites, 1% G=0.00007Limestone, 1% G=0.002
2s
20s240s
1200s
5400s
https://doi.org/10.1017/S0033822200041898Downloaded from https://www.cambridge.org/core. IP address: 65.21.228.167, on 21 Oct 2021 at 18:52:19, subject to the Cambridge Core terms of use, available at https://www.cambridge.org/core/terms.
54 A Lindroos et al.
from the church of Sund in Åland had Γ values of 0.00063 ± 0.00014 (n = 6) at 0 °C, for incrementswith historically reasonable 14C ages for the 46–75-µm fraction, and F values from 0.3–0.8.
The δ values are determined from the same CO2 increments as the respective ages. By convention,they denote per mil fractionation versus a standard (e.g. Hoefs 2004). (The standards referred to areindicated in the stable isotope plots.) The δ13C and δ18O values for mortars, which yielded theknown, expected, or acceptable historical 14C age for more than 50% of the carbonate in the sample,are compiled in Figure 6A–B. Early or late dissolution increments yielding deviating 14C ages areomitted. The δ13C values have a wide range starting from –22 to –6‰, with an average at 13.1 ±4.1‰ (n = 96). Most of the variation can be explained as kinetic effects controlled by diffusion dis-tance (sampling depth) and the binder/filler ratio (Pachiaudi et al. 1986). δ18O values are rather low:11.3 ± 3.2‰ (n = 70). They are partly controlled by the delta values for local meteoritic water usedin slaking the lime and as an ingredient in the mortar mix. They reflect the high latitude of the ÅlandIslands, around 60°N, with precipitation of 18O-depleted water (Dansgaard 1964; Yurtsever 1975).Samples with relatively high values around 15‰, e.g. from the church of Sund in Åland (sund =strait), may well reflect the presence of brackish water from the Baltic Sea as the church is situatedclose to a medieval strait (due to postglacial regression it is no longer an open strait).
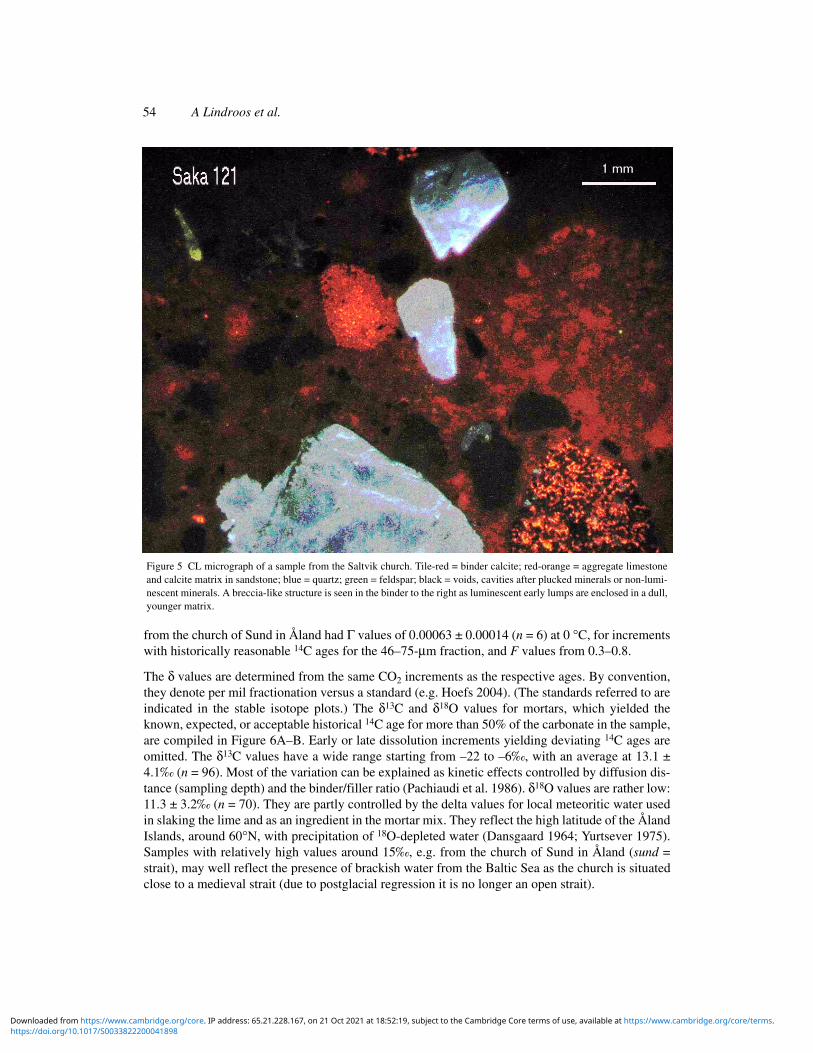
Figure 5 CL micrograph of a sample from the Saltvik church. Tile-red = binder calcite; red-orange = aggregate limestoneand calcite matrix in sandstone; blue = quartz; green = feldspar; black = voids, cavities after plucked minerals or non-lumi-nescent minerals. A breccia-like structure is seen in the binder to the right as luminescent early lumps are enclosed in a dull,younger matrix.
https://doi.org/10.1017/S0033822200041898Downloaded from https://www.cambridge.org/core. IP address: 65.21.228.167, on 21 Oct 2021 at 18:52:19, subject to the Cambridge Core terms of use, available at https://www.cambridge.org/core/terms.

Mortar Dating Using AMS 14C and Sequential Dissolution 55
Some samples show very little contamination either directly in CL or indirectly in the 14C ages ofsuccessive dissolution increments. The stable isotopes for these samples usually display patternswhere the δ13C and usually also the δ18O values for the first increments are more negative than thebulk of the mortar. After around 30% dissolution (F = 0.3), the δ values reach a maximum, afterwhich they show a decreasing trend. Figure 7 shows the δ13C versus δ18O trend for a sample from atomb in the church of Sund (Suka 010) and for 1 sample from the nave and another from the sacristyof the Saltvik church (Saka 122 and Saka 148, respectively). In Figure 8, data for the sample fromthe tomb are presented. (The relation to the chronology of the Sund church is discussed in Ringbomand Remmer [2005]). The dated grain-size fraction contains no luminescent limestone. The lastincrement was isolated after overnight dissolution at ambient temperature. Although it is so smallthat there was not enough CO2 for MS measurements, the last increment is still only slightly affectedby unburned limestone residues, and hence the degree of contamination in the other increments isnegligible. Due to the careful sample preparation, the whole 46–75-µm grain-size fraction repre-sents only about 1% of the whole sample (The size of the increments and the dissolution times aredisplayed along the F axis in Figure 8. In some later plots, we will omit these and they will bereported separately in the Appendix).
In Figure 9, two samples from the church of Saltvik are presented. They both display profiles wherethe contamination effect from the Ordovician limestone (Tynni 1982) is somewhat insignificant. (Itis seen as a typical “bump” at the third increment.) In CL, the sample Saka 122 showed 0.20 ± 0.07%luminescent limestone, and in Saka 148, 0.11 ± 0.03% was found. The chronology of the nave ver-sus the sacristy is discussed further in Ringbom and Remmer (2000). The contamination by lime-stone residues in the final “overnight increments” is also identified on empirical grounds for both
Figure 6 Experimentally determined delta values for calcite binders in non-hydraulic mortars from Åland: A) δ13C (‰ vsPee Dee Belemnite [PDB]); B) δ18O (‰ vs standard mean ocean water [SMOW] and PDB). The horizontal bars denote therelative increment size and its position (Fn → Fm) on the abscissa.
- 2 5
- 2 3
- 2 1
- 19
- 17
- 15
- 13
- 11
- 9
- 7
0 0 .2 0 .4 0 .6 0 .8 1
Delta 13C(per mill vs PDB)
F
A
4
6
8
10
12
14
16
18
20
22
24
26
0 0.2 0.4 0.6 0.8 1
-26
-24
-22
-20
-18
-16
-14
-12
-10
-8
-6
Delta 18O(per mill vs SMOW)
Delta18O(per mill vs PDB)
F
B
https://doi.org/10.1017/S0033822200041898Downloaded from https://www.cambridge.org/core. IP address: 65.21.228.167, on 21 Oct 2021 at 18:52:19, subject to the Cambridge Core terms of use, available at https://www.cambridge.org/core/terms.

56 A Lindroos et al.
samples. In Saka 148, the contamination is also statistically significant. In both cases, the incre-ments are rather large and therefore not very sensitive to contamination.
Alkaline and Recrystallized Mortars
Carbonate phases with 14C ages younger than the age of the main binder phase are occasionallyfound in non-hydraulic mortars (they are common in hydraulic mortars). There appear to be 2 types:calcitic crusts and calcites forming when alkaline inclusions are exposed to CO2.
Calcitic crusts and stalactite-like formations on the mortar surface and in voids are typical for mod-ern (MacLeod et al. 1990, 1991) and ancient (hydraulic) concrete (Lindroos 2005), but sometimes
Figure 7 δ13C vs δ18O for the samples presented in Figures 8 and9. The arrows indicate trends as functions of increasing F values.
Figure 8 14C data as a function of dissolution progress for a sample from within the Sund church.The last increment was collected after dissolution overnight.
5
7
9
11
13
15
17
19
21
23
25
-21 -16 -11 -6
Suka 010
Saka 122
Saka 148
Delta O-18 vs SMOW
Delta C-13 vs PDB
7
https://doi.org/10.1017/S0033822200041898Downloaded from https://www.cambridge.org/core. IP address: 65.21.228.167, on 21 Oct 2021 at 18:52:19, subject to the Cambridge Core terms of use, available at https://www.cambridge.org/core/terms.

Mortar Dating Using AMS 14C and Sequential Dissolution 57
they occur in somewhat non-hydraulic mortars. They form when percolating acidic water comesinto contact with alkaline inclusions. Figure 10 shows a piece of mortar where the binder has beenpartly dissolved and recrystallized calcite has formed a crust around a partly dissolved lime lump. Invoids inside the lump, some efflorescent, luminescent crystals have grown. They indicate slowergrowth in more neutral pH conditions.
Figure 11A shows the 14C age profile of a 5-step incremental dissolution of the same mortar togetherwith the corresponding profile from another similar sample from the same site and chronology. Thefirst increments are affected by the recrystallizations with 14C ages younger than the bulk sample.Figure 11B presents the delta values for the dated increments. Note the low values for both carbonand oxygen for the first increments showing deviating, younger 14C ages. We have not isolatedrecrystallizations for AMS or MS measurements, but for the first increments there seems to be arelation: the large dissolution relates to constant, young 14C ages and highly negative δ13C values.MacLeod et al. (1990) have measured the stable isotopes in calcite crusts and stalactite-like forma-tions in modern concrete and have found δ13C values from –18.5‰ to –19.2‰ (n = 2) correspondingto calcite growth and strong kinetic fractionation in a super-alkaline milieu.
Both of our samples were devoid of luminescent limestone. The age interpretation in Figure 11A,including 7 increments (Suka 017,2–5 and Suka 014,3–5) from these 2 samples, is similar to the agegiven by Ringbom and Remmer (2005) based on all available data. They suggested an age ofAD 1240–1295 for the nave.
Calcites also form when deeper alkaline parts of the mortar are exposed to modern atmospheric CO2
(or the exhalation of the sampler). The minerals have not been identified directly, but their presenceis evident when the mortar shows an alkaline reaction and early dissolution increments showextremely young 14C ages. Table 1 lists the data from a dating of an alkaline sample.
Both types of young calcites seem to be easily soluble and/or concentrated into the most fine-grained grain-size fractions.
Figure 9 Conventional 14C ages (BP) as a function of the dissolution progress parameter F. Each data pointis plotted at the middle of the Fn–Fn+1 interval. The trend lines are only connecting the increments from eachsample, and they are not modeled according to the description in the text.
500
550
600
650
700
750
800
850
900
0 0.2 0.4 0.6 0.8 1
C-14 age BP
Saka 122 Sacristy (AAR-2536.2,1-5)
76-125 micrometer
Saka148 Nave (AAR-4241.2,1-5)
63-75 micrometer
Saltvik Church
F
https://doi.org/10.1017/S0033822200041898Downloaded from https://www.cambridge.org/core. IP address: 65.21.228.167, on 21 Oct 2021 at 18:52:19, subject to the Cambridge Core terms of use, available at https://www.cambridge.org/core/terms.

58 A Lindroos et al.
Figure 10 A piece of mortar from the church of Sund (sample Suka 017). Percolating waters have dissolved some of thebinder, and new calcites have formed a crust around a lime lump. In voids inside the lump, still younger, light efflorescentcalcites have grown.
Figure 11 A) 14C age profiles showing the presence of a readily soluble young and minor carbonate phase affecting incre-ment 1 in 2 samples from the same building. B) The contaminated first increments display low delta values.
7
8
9
10
11
12
13
-30 -25 -20 -15 -10 -5
Suka 014
Suka 017
Delta O-18(per mill vs SMOW)
Delta C-13 (per mill vs PDB)
F F
B
https://doi.org/10.1017/S0033822200041898Downloaded from https://www.cambridge.org/core. IP address: 65.21.228.167, on 21 Oct 2021 at 18:52:19, subject to the Cambridge Core terms of use, available at https://www.cambridge.org/core/terms.
Mortar Dating Using AMS 14C and Sequential Dissolution 59
Lime Lumps
White spots or lime lumps can commonly be seen on the surfaces of all kinds of mortar. These spotsare the result of poor mixing of lime and aggregate, usually due to lime that has partly hardenedalready before mixing. Lime lumps may be so abundant that it is impossible to avoid them in sam-pling for 14C dating. They are also usually softer than the proper binder and yield abundant materialto the finest fractions during crushing and sieving. The potential for 14C dating and/or contaminatingproperties have therefore been tested (Ambers 1987). Actual lime burials have also been dated(Stuiver and Waldren 1975). Van Strydonck et al. (1992) also dated lime lumps from several mortarsamples. They found similar age distributions among samples and sample fractions for the lumps aswere found for the bulk mortars. The δ13C values were generally higher. We have also done some 2-increment datings of lime lumps and observed similar results (Heinemeier et al. 1997).
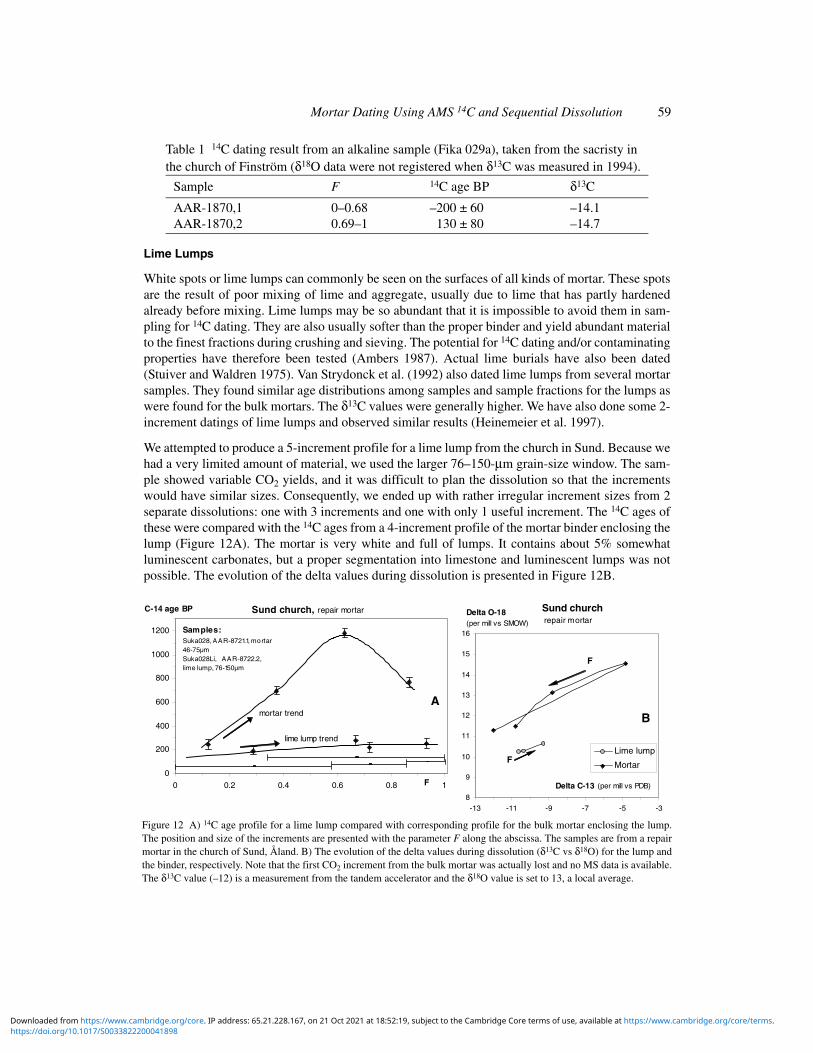
We attempted to produce a 5-increment profile for a lime lump from the church in Sund. Because wehad a very limited amount of material, we used the larger 76–150-µm grain-size window. The sam-ple showed variable CO2 yields, and it was difficult to plan the dissolution so that the incrementswould have similar sizes. Consequently, we ended up with rather irregular increment sizes from 2separate dissolutions: one with 3 increments and one with only 1 useful increment. The 14C ages ofthese were compared with the 14C ages from a 4-increment profile of the mortar binder enclosing thelump (Figure 12A). The mortar is very white and full of lumps. It contains about 5% somewhatluminescent carbonates, but a proper segmentation into limestone and luminescent lumps was notpossible. The evolution of the delta values during dissolution is presented in Figure 12B.
Table 1 14C dating result from an alkaline sample (Fika 029a), taken from the sacristy inthe church of Finström (δ18O data were not registered when δ13C was measured in 1994).
Sample F 14C age BP δ13C
AAR-1870,1 0–0.68 –200 ± 60 –14.1AAR-1870,2 0.69–1 130 ± 80 –14.7
Figure 12 A) 14C age profile for a lime lump compared with corresponding profile for the bulk mortar enclosing the lump.The position and size of the increments are presented with the parameter F along the abscissa. The samples are from a repairmortar in the church of Sund, Åland. B) The evolution of the delta values during dissolution (δ13C vs δ18O) for the lump andthe binder, respectively. Note that the first CO2 increment from the bulk mortar was actually lost and no MS data is available.The δ13C value (–12) is a measurement from the tandem accelerator and the δ18O value is set to 13, a local average.
0
200
400
600
800
1000
1200
0 0.2 0.4 0.6 0.8 1
C-14 age BP
Samples:Suka028, AAR-8721.1, mortar46-75µmSuka028Li, AAR-8722.2,lime lump, 76-150µm
mortar trend
lime lump trend
F
Sund church, repair mortar
A
8
9
10
11
12
13
14
15
16
-13 -11 -9 -7 -5 -3
Lime lump
Mortar
Delta C-13 (per mill vs PDB)
Delta O-18(per mill vs SMOW)
Sund church repair mortar
F
F
B
https://doi.org/10.1017/S0033822200041898Downloaded from https://www.cambridge.org/core. IP address: 65.21.228.167, on 21 Oct 2021 at 18:52:19, subject to the Cambridge Core terms of use, available at https://www.cambridge.org/core/terms.
60 A Lindroos et al.
The increments from the lime lump show rather uniform 14C ages and delta values. The dissolutionconstant attained the values 0.0001–0.0002 at 0 °C. Unfortunately, these values are not very usefulbecause of the large grain-size window and the unpredictable dissolution behavior. The lime lumps,however, seem to be composed of 1 calcite phase with 1 14C age or a narrow distribution of ages,which can be connected to the building or repair history. The spans in delta values reflect onlykinetic fractionation during dissolution (note that the incremental dissolution displays differencesbetween early increments and residues more efficiently than a cumulative procedure). The binder,on the other hand, is severely contaminated by local Ordovician limestone, and the 14C ages are oflittle use in archaeometry. A preliminary conclusion is that lime lumps are not contaminants from anarchaeometric point of view, but are a datable component. It is, however, important to identify themand distinguish them from limestone residues.
Aggregate Limestone
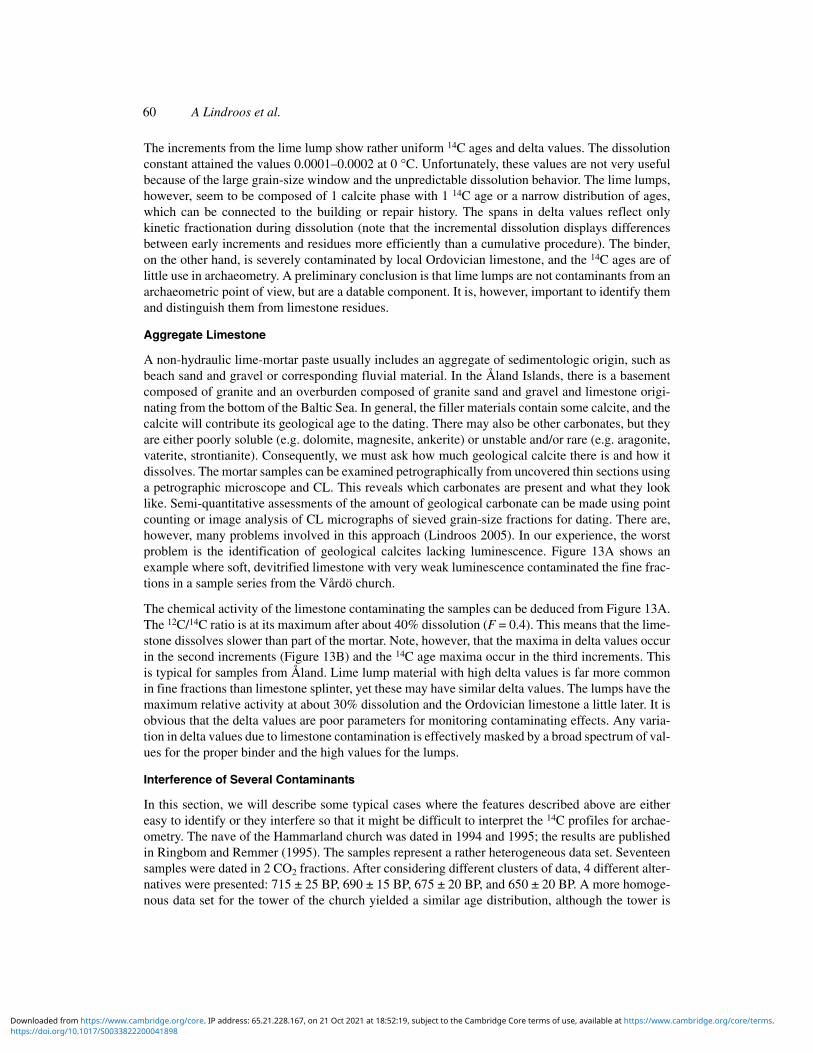
A non-hydraulic lime-mortar paste usually includes an aggregate of sedimentologic origin, such asbeach sand and gravel or corresponding fluvial material. In the Åland Islands, there is a basementcomposed of granite and an overburden composed of granite sand and gravel and limestone origi-nating from the bottom of the Baltic Sea. In general, the filler materials contain some calcite, and thecalcite will contribute its geological age to the dating. There may also be other carbonates, but theyare either poorly soluble (e.g. dolomite, magnesite, ankerite) or unstable and/or rare (e.g. aragonite,vaterite, strontianite). Consequently, we must ask how much geological calcite there is and how itdissolves. The mortar samples can be examined petrographically from uncovered thin sections usinga petrographic microscope and CL. This reveals which carbonates are present and what they looklike. Semi-quantitative assessments of the amount of geological carbonate can be made using pointcounting or image analysis of CL micrographs of sieved grain-size fractions for dating. There are,however, many problems involved in this approach (Lindroos 2005). In our experience, the worstproblem is the identification of geological calcites lacking luminescence. Figure 13A shows anexample where soft, devitrified limestone with very weak luminescence contaminated the fine frac-tions in a sample series from the Vårdö church.
The chemical activity of the limestone contaminating the samples can be deduced from Figure 13A.The 12C/14C ratio is at its maximum after about 40% dissolution (F = 0.4). This means that the lime-stone dissolves slower than part of the mortar. Note, however, that the maxima in delta values occurin the second increments (Figure 13B) and the 14C age maxima occur in the third increments. Thisis typical for samples from Åland. Lime lump material with high delta values is far more commonin fine fractions than limestone splinter, yet these may have similar delta values. The lumps have themaximum relative activity at about 30% dissolution and the Ordovician limestone a little later. It isobvious that the delta values are poor parameters for monitoring contaminating effects. Any varia-tion in delta values due to limestone contamination is effectively masked by a broad spectrum of val-ues for the proper binder and the high values for the lumps.
Interference of Several Contaminants
In this section, we will describe some typical cases where the features described above are eithereasy to identify or they interfere so that it might be difficult to interpret the 14C profiles for archae-ometry. The nave of the Hammarland church was dated in 1994 and 1995; the results are publishedin Ringbom and Remmer (1995). The samples represent a rather heterogeneous data set. Seventeensamples were dated in 2 CO2 fractions. After considering different clusters of data, 4 different alter-natives were presented: 715 ± 25 BP, 690 ± 15 BP, 675 ± 20 BP, and 650 ± 20 BP. A more homoge-nous data set for the tower of the church yielded a similar age distribution, although the tower is
https://doi.org/10.1017/S0033822200041898Downloaded from https://www.cambridge.org/core. IP address: 65.21.228.167, on 21 Oct 2021 at 18:52:19, subject to the Cambridge Core terms of use, available at https://www.cambridge.org/core/terms.
Mortar Dating Using AMS 14C and Sequential Dissolution 61
clearly secondary in relation to the nave. The average of 3 samples (6 CO2 fractions) is 690 ± 25 BP,and the average of the first fractions only is 685 ± 35 BP. Two samples were re-dated as a control in5-increment profiles 2004 (Figure 14). Sample Haka 052 has 0.22 ± 0.16% luminescent limestone,while Haka 055 has 0.14 ± 0.07%, but part of the limestone is dolomitic. The profiles suggest thatthere are mortars from the second half of the 13th century in the nave, and the nave seems to be afew decades older than the tower. Four charcoal inclusions from other mortar samples from the naveare clearly older (Figure 14). These 2 samples show typical contamination patterns similar to themodel in Figure 4. The mid-parts of the profiles are contaminated by filler limestone, and there aretypical effects from poorly calcinated limestone residues in the last increments. If we model the con-tamination, the same Γ values can be used for both samples.
In Saltvik, dendrochronological analyses from 9 pine logs suggest a building phase in the secondhalf of the 14th century, probably in the early 1370s (Ringbom and Remmer 2000). In the late 1990s,we performed mortar datings on a number of samples. The average age for the first fractions (n = 10)was 643 ± 11 BP. This age was used for archaeometry. Due to the nature of the calibration curve atthis point, the resolution is very poor, but it corresponds to the 14th century. Two samples were rean-alyzed as 14C profiles. The sample Saka 146 is contaminated with 0.14 ± 0.08% and Saka 148 with0.11 ± 0.03% luminescent limestone according to our IA assessments. Figure 15 shows the results.The profiles yield the same age as earlier and they verify that it was a correct approach to utilize thefirst fractions for archaeometry. Note, however, how important it is to use several samples. Takenalone, the profile from sample Saka 146 could be misinterpreted to suggest an age where the profilelevels out at about 900 BP.
The mortar from the nave of the church of Eckerö has been dated by Ringbom and Remmer (1995;in 2 CO2 fractions only) and re-dated by Ringbom et al. (2006). The first fractions of 8 samplesyielded the average age 718 ± 25 BP, corresponding to AD 1270–1290 (68.2% confidence level).One sample was re-dated as a profile 2004 (Figure 16). In CL, this sample seems contaminated:0.39 ± 0.15% limestone was assessed and 1.71 ± 0.41% somewhat luminescent limestone residues
Figure 13 A) 14C age profiles for 3 mortar samples contaminated with devitrified Ordovician limestone. The age of a char-coal inclusion (the horizontal line) defines a maximum age. B) Stable isotope patterns for the same samples. Extremely lowdelta values for 2 early CO2 increments indicate the presence of recrystallizations.
0
2
4
6
8
10
12
14
16
-26 -21 -16 -11 -6 -1
Delta O-18(per mill vs SM OW)
Delta C-13(per mill vs PDB)
F
F
F
Vaka 002
Vaka 001
Vaka 003
B
Vårdö church, nave
https://doi.org/10.1017/S0033822200041898Downloaded from https://www.cambridge.org/core. IP address: 65.21.228.167, on 21 Oct 2021 at 18:52:19, subject to the Cambridge Core terms of use, available at https://www.cambridge.org/core/terms.

62 A Lindroos et al.
were also identified. The results are presented together with the older data for the same sample. The6 fractions with the youngest ages define a cluster with the combined age of 720 ± 25 BP. A chip ofwood in the sample turned out to be about 100 yr older than the mortar.
CONCLUSIONS
Mortars are heterogeneous carbonate systems and dating them using 14C requires detailed studies ofthe carbonates and, in particular, their solubilities. Ideally, a series of samples from each mortarbatch should be analyzed. In the 1990s, we dated mortar in masonry constructions using an AMSmodification of the “Texas method”: the mortars were allowed to react with phosphoric acid for onlya few seconds, and the dating was conducted on the CO2 that was initially liberated. The residue ofthe sample was dated for reference and contamination control only. The results from the first CO2
fractions were treated statistically considering the averages from age clusters and rejecting outliers.In the late 1990s, cathodoluminescence (CL) control was introduced, and in many cases samplescould be rejected already before AMS analysis, which resulted in cost savings and more coherent
Figure 14 14C profiles for 2 mortar samples from the nave in the church of Hammarland. The average age of 4charcoal inclusions is included.
Figure 15 14C profiles for 2 mortar samples from the nave of the church in Saltvik. The mortar age 620 ± 26has been calculated from the 3 CO2 fractions within the gray field. Other fractions are considered contaminatedby filler limestone and unburned limestone as described above.
https://doi.org/10.1017/S0033822200041898Downloaded from https://www.cambridge.org/core. IP address: 65.21.228.167, on 21 Oct 2021 at 18:52:19, subject to the Cambridge Core terms of use, available at https://www.cambridge.org/core/terms.

Mortar Dating Using AMS 14C and Sequential Dissolution 63
age clusters for the mortar batches, respectively. After some trials with hydraulic mortars includingreadily soluble recrystallizations, we modified the dating procedure so that each sample is nowdated in 5 or more fractions representing successive CO2 increments from a dissolution procedurelasting up to 18 hr. Each sample is thereby described in terms of 14C age and δ13C-δ18O profiles plot-ted versus the dissolution progress variable F. The introduction of the profiles has helped us tounderstand and even model some of the contamination effects commonly encountered in the dating.We have also become more aware of the risk connected with readily soluble recrystallizations,which sometimes contaminate the first fractions of non-hydraulic, as well as hydraulic, mortars. Ourexperience from the mortars from the Åland Islands has been most useful for our work on the devel-opment of the method for a more general use, including hydraulic mortars in samples from classicaland medieval Rome, and we are now concentrating on defining the limits of the implementation ofmortar dating. After dating some 250 samples from Åland, Norway, Portugal, Spain, and Italy, wecan conclude that the least problematic samples have been clearly non-hydraulic mortars withoutashes from areas with crystalline basement rocks. In favorable cases, when the mortar is clearly non-hydraulic, the filler material has very few carbonates (which are preferably dolomitic marble), andthe site has an arid climate. It may be possible to reduce the number of CO2 fractions from each sam-ple. However, our work in the Åland Archipelago shows that even if the local soils and mortar fillersmay have abundant limestone, dating is still possible. Although mortar dating is a rather expensivemethod, sometimes mortar is the only datable material available and often mortar dating is an alter-native to even more expensive, large-scale excavations.
ACKNOWLEDGMENTS
We gratefully acknowledge the Foundation of Åbo Akademi University, The Finnish Society of Sci-ences and Letters, The County Government of the Åland Islands, and The Danish Research Councilof Natural Science. We thank Dr Henrik Loft Nielsen and Dr Fiona Brock for valuable commentsand for correcting the language of the manuscript.
Figure 16 14C profile including 5 CO2 fractions presented together with older data from the same sample(in 2 fractions).
https://doi.org/10.1017/S0033822200041898Downloaded from https://www.cambridge.org/core. IP address: 65.21.228.167, on 21 Oct 2021 at 18:52:19, subject to the Cambridge Core terms of use, available at https://www.cambridge.org/core/terms.
64 A Lindroos et al.
REFERENCES
Ambers J. 1987. Stable carbon isotope ratios and theirrelevance to the determination of accurate radiocarbondates for lime mortars. Journal of Archaeological Sci-ence 14:569–76.
Baxter MS, Walton A. 1970. Radiocarbon dating of mor-tars. Nature 225(5236):937–8.
Charola AE, Lewin SZ. 1979. Efflorescences on buildingstones. SEM in the characterization and elucidation ofthe mechanisms of formation. Scanning Electron Mi-croscopy 1:379–86.
Dansgaard W. 1964. Stable isotopes in precipitation. Tel-lus 16:436–68.
Deer WA, Howie RA, Zussman J. 1992. An Introductionto the Rock-Forming Minerals. 2nd edition. NewYork: Wiley. 696 p.
Delibrias G, Labeyrie J. 1965. The dating of mortars bythe carbon-14 method. In: Chatters RM, Olson EA,editors. Proceedings from the 6th International Con-ference on 14C and Tritium Dating. Washington, D.C.:Clearinghouse for Federal Scientific & TechnologicalInformation, Natural Bureau of Standards. U.S. Dept.Commerce. p 344–7.
Folk RL, Valastro S Jr. 1976. Successful technique fordating of lime mortars by carbon-14. Journal of FieldArchaeology 3:203–8.
Habermann D, Neuser RD, Richter K. 2000. Quantitativehigh resolution spectral analysis of Mn2+ in sedimen-tary calcite. In: Pagel M, Barbin V, Blanc P, Ohnen-stetter D, editors. Cathodoluminescence in Geo-sciences. New York: Springer-Verlag. p 331–58.
Hale J, Heinemeier J, Lancaster L, Lindroos A, RingbomÅ. 2003. Dating ancient mortar. American Scientist91(2):130–7.
Heinemeier J, Jungner H, Lindroos A, Ringbom Å, vonKonow T, Rud N. 1997. AMS 14C dating of lime mor-tar. Nuclear Instruments and Methods in Physics Re-search B 123(1–4):487–95.
Hoefs J. 2004. Stable Isotope Geochemistry. 5th edition.New York: Springer-Verlag. 244 p.
Labeyrie J, Delibrias G. 1964. Dating of old mortars bythe carbon-14 method. Nature 201(4920):742.
Lindroos A. 2005. Carbonate phases in historical build-ing mortars and pozzolana concrete. Implications forAMS 14C dating [FD thesis]. Turku, Finland: Åbo Ak-ademi University. ISBN 952-12-1560-7. 92 p.
Machel H. 2000. Application of cathodoluminescence tocarbonate diagenesis. In: Pagel M, Barbin V, Blanc P,Ohnenstetter D, editors. Cathodoluminescence inGeosciences. New York: Springer-Verlag. p 271–301.
MacLeod G, Hall AJ, Fallick AE. 1990. An applied min-eralogical investigation of concrete degradation in amajor concrete road bridge. Mineralogical Magazine54:637–44.
MacLeod G, Hall AJ, Fallick AE. 1991. Mechanism ofcarbonate mineral growth on concrete structures aselucidated by carbon and oxygen isotope analyses.
Chemical Geology 86:335–43.Marshall DJ. 1988. Cathodoluminescence of Geological
Materials. Boston: Unwin Hyman. 146 p.Pachiaudi C, Marechal J, Van Strydonck M, Dupas M,
Dauchot-Dehon M. 1986. Isotopic fractionation ofcarbon during CO2 absorption by mortar. Radiocar-bon 28(2A):691–7.
Ringbom Å, Remmer C. 1995. Ålands Kyrkor. Volume I.Hammarland Och Eckerö. Ålands landskapsstyrelse/museibyrån. 300 p. In Swedish with English summary.
Ringbom Å, Remmer C. 2000. Ålands Kyrkor. Volume II.Saltvik. Ålands landskapsstyrelse/museibyrån. 300 p.In Swedish with English summary.
Ringbom Å, Remmer C. 2005. Ålands Kyrkor. VolumeIII. Sund Och Vårdö. Ålands landskapsstyrelse/museibyrån. 336 p. In Swedish with English summary.
Ringbom Å, Lindroos A, Heinemeier J, Lancaster L,Hale J. 2003. When did mortar harden? [abstract].XVI International Congress of Classical Archaeology,AIAC conference. 23–26 August 2003, Cambridge,Massachusetts, USA. Harvard University. p 54–5.
Ringbom Å, Hale J, Heinemeier J, Lindroos A, Brock F.2006. Mortar dating in medieval and classical archae-ology. Construction History Newsletter 73:10–7.
Sonninen E, Erämetsä P, Jungner H. 1985. Dating ofmortar and bricks from the castle of Kastelholm. Iskos5:384–9.
Stuiver M, Smith CS. 1965. Radiocarbon dating of an-cient mortar and plaster. In: Chatters RM, Olson EA,editors. Proceedings of the 6th International Confer-ence on Radiocarbon and Tritium Dating. Washing-ton, D.C.: Clearinghouse for Federal Scientific &Technological Information, Natural Bureau of Stan-dards. U.S. Department of Commerce. p 338–43.
Stuiver M, Waldren WH. 1975. 14C carbonate dating andthe age of post-Talayotic lime burials in Mallorca. Na-ture 255(5508):475–6.
Swart PK, Burns SJ, Leder JJ. 1991. Fractionation of thestable isotopes of oxygen and carbon in carbon diox-ide during the reaction of calcite with phosphoric acidas a function of temperature and technique. ChemicalGeology (Isotope Geoscience Section) 86:89–96.
Tynni R. 1982. On Paleozoic microfossils in clasticdykes on the Åland Islands and in the core samplesfrom Lumparn. In: Paleozoic Sediments in the Rapa-kivi Area of the Åland Islands. Geological Survey ofFinland, Bulletin 317:35–94.
Van Strydonck M, Dupas M. 1991. The classification anddating of lime mortars by chemical analysis and radio-carbon dating: a review. In: Waldren WH, EnsenyatJA, Kennard RC, editors. Second Deya InternationalConference of Prehistory. Volume II. BAR Interna-tional Series 574:5–43
Van Strydonck M, Dupas M, Dauchot-Dehon M. 1983.Radiocarbon dating of old mortars. In: Mook WG,Waterbolk HT, editors. 14C and Archaeology, Pro-
https://doi.org/10.1017/S0033822200041898Downloaded from https://www.cambridge.org/core. IP address: 65.21.228.167, on 21 Oct 2021 at 18:52:19, subject to the Cambridge Core terms of use, available at https://www.cambridge.org/core/terms.
Mortar Dating Using AMS 14C and Sequential Dissolution 65
ceedings. PACT 8:337–43.Van Strydonck M, Dupas M, Dauchot-Dehon M, Pachi-
audi C, Marechal J. 1986. The influence of contami-nating (fossil) carbonate and the variation of δ13C inmortar dating. Radiocarbon 28(2A):702–10.
Van Strydonck M, Dupas M, Keppens E. 1989. Isotopicfractionation of oxygen and carbon in lime mortar un-der natural environmental conditions. Radiocarbon31(3):610–8.
Van Strydonck MJY, van der Borg K, de Jong AFM, Kep-pens E. 1992. Radiocarbon dating of lime fractionsand organic material from buildings. Radiocarbon34(3):873–9.
Wachter EA, Hayes JM. 1985. Exchange of oxygen iso-topes in carbon dioxide-phosporic acid systems.
Chemical Geology (Isotope Geoscience Section) 52:365–74.
Walters LJ, Claypool GE, Choquette PW. 1972. Reactionrates and δ18O variation for the carbonate-phosphoricacid preparation method. Geochimica et Cosmochim-ica Acta 36(2):129–40.
Willaime B, Coppens R, Jaegy R. 1983. Datation desmortiers du château de Châtel-sur-Moselle per le car-bon 14. In: Mook WG, Waterbolk HT, editors. 14C andArchaeology, Proceedings. PACT 8:345–50. InFrench.
Yurtsever Y. 1975. Worldwide survey of stable isotopesin precipitation. Rep. Isotope Hydrology Section. No-vember 1975. Vienna: IAEA. 40 p.
APPENDIX
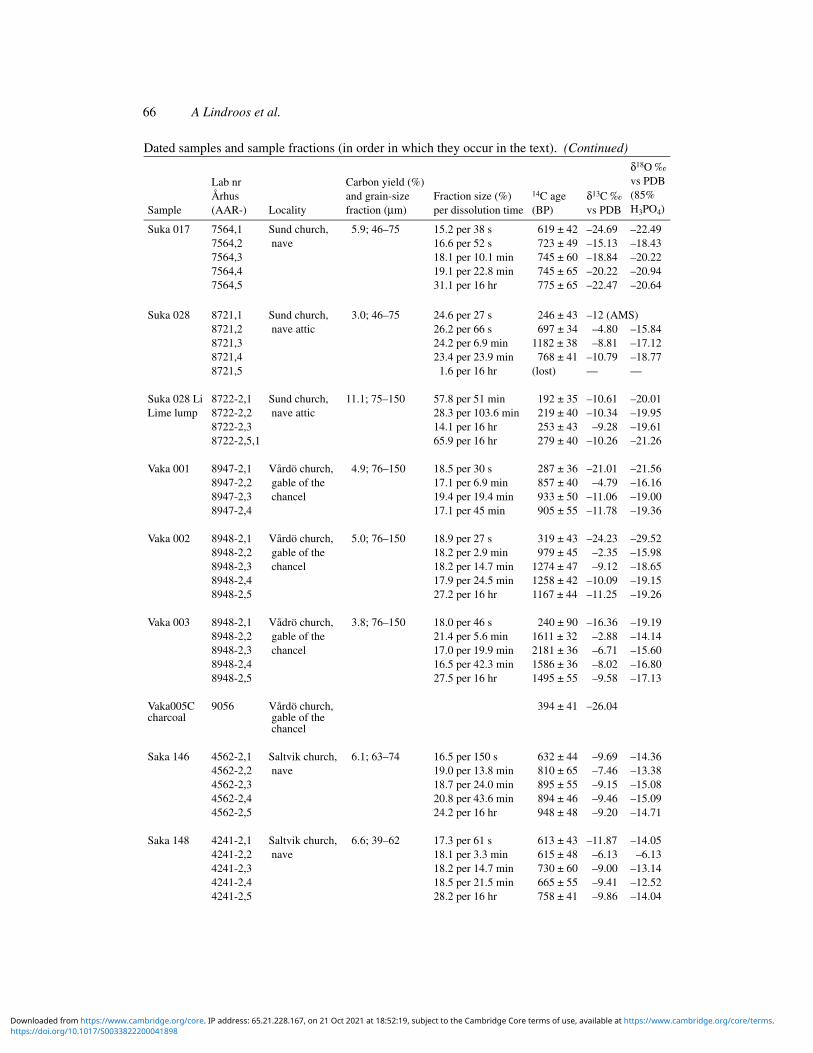
Dated samples and sample fractions (in order in which they occur in the text).
Sample
Lab nrÅrhus(AAR-) Locality
Carbon yield (%)and grain-sizefraction (µm)
Fraction size (%)per dissolution time
14C age(BP)
δ13C ‰vs PDB
δ18O ‰vs PDB(85%H3PO4)
Suka 034 7570,1 Sund church, 4.6; 46–75 16.9 per 71 s 451 ± 43 –13.50 –18.117570,2 sacristy 27.7 per 5.2 min 743 ± 43 –8.06 –15.497570,3 23.1 per 22.9 min 728 ± 39 –10.11 –17.367570,4 20.6 per 80.5 min 835 ± 33 –10.74 –16.257570,5 11.7 per 16 hr 1275 ± 38 –10.78 –16.14
Suka 010 7561,1 Sund church, 3.0; 46–75 21.3 per 61 s 354 ± 36 –20.03 –23.307561,2 tomb 25.0 per 10.4 min 420 ± 55 –13.07 –15.697561,3 27.3 per 28.5 min 318 ± 39 –16.04 –19.117561,4 22.6 per 72.3 min 385 ± 37 –16.17 –17.837561,5 3.8 per 16 hr 548 ± 45 –17 (AMS)
Saka 122 2537-2,1 Saltvik church, 7.9; 76–125 13.3 per 90 s 763 ± 42 –16.55 –17.452537-2,2 sacristy 16.2 per 8.2 min 751 ± 50 –10.02 15.952537-2,3 15.9 per 21.5 min 825 ± 55 –12.98 –17.482537-2,4 32.7 per 32.7 min 740 ± 55 –13.36 –17.262537-2,5 36.5 per 16 hr 840 ± 55 –13.53 –16.52
Saka 148 4241-2,1 Saltvik church, 6.6; 39–62 17.3 per 61 s 613 ± 43 –11.87 –14.054241-2,2 nave 18.1 per 3.3 min 615 ± 48 –6.13 –6.134241-2,3 18.2 per 14.7 min 730 ± 60 –9.00 –13.144241-2,4 18.5 per 21.5 min 665 ± 55 –9.41 –12.524241-2,5 28.2 per 16 hr 758 ± 41 –9.86 –14.04
Suka 014 7563,1 Sund church, 5.9; 46–75 14.4 per 16 s 496 ± 32 –22.26 –21.967563,2 nave 15.7 per 49 s 683 ± 33 –11.9 –19.747563,3 23.3 per 7 min 781 ± 33 –10.81 –17.767563,4 18.8 per 13 min 777 ± 36 –13.09 –19.787563,5 27.8 per 16 hr 819 ± 33 –13.87 –19.47
https://doi.org/10.1017/S0033822200041898Downloaded from https://www.cambridge.org/core. IP address: 65.21.228.167, on 21 Oct 2021 at 18:52:19, subject to the Cambridge Core terms of use, available at https://www.cambridge.org/core/terms.
66 A Lindroos et al.
Suka 017 7564,1 Sund church, 5.9; 46–75 15.2 per 38 s 619 ± 42 –24.69 –22.497564,2 nave 16.6 per 52 s 723 ± 49 –15.13 –18.437564,3 18.1 per 10.1 min 745 ± 60 –18.84 –20.227564,4 19.1 per 22.8 min 745 ± 65 –20.22 –20.947564,5 31.1 per 16 hr 775 ± 65 –22.47 –20.64
Suka 028 8721,1 Sund church, 3.0; 46–75 24.6 per 27 s 246 ± 43 –12 (AMS)8721,2 nave attic 26.2 per 66 s 697 ± 34 –4.80 –15.848721,3 24.2 per 6.9 min 1182 ± 38 –8.81 –17.128721,4 23.4 per 23.9 min 768 ± 41 –10.79 –18.778721,5 1.6 per 16 hr (lost) — —
Suka 028 Li 8722-2,1 Sund church, 11.1; 75–150 57.8 per 51 min 192 ± 35 –10.61 –20.01Lime lump 8722-2,2 nave attic 28.3 per 103.6 min 219 ± 40 –10.34 –19.95
8722-2,3 14.1 per 16 hr 253 ± 43 –9.28 –19.618722-2,5,1 65.9 per 16 hr 279 ± 40 –10.26 –21.26
Vaka 001 8947-2,1 Vårdö church, 4.9; 76–150 18.5 per 30 s 287 ± 36 –21.01 –21.568947-2,2 gable of the 17.1 per 6.9 min 857 ± 40 –4.79 –16.168947-2,3 chancel 19.4 per 19.4 min 933 ± 50 –11.06 –19.008947-2,4 17.1 per 45 min 905 ± 55 –11.78 –19.36
Vaka 002 8948-2,1 Vårdö church, 5.0; 76–150 18.9 per 27 s 319 ± 43 –24.23 –29.528948-2,2 gable of the 18.2 per 2.9 min 979 ± 45 –2.35 –15.988948-2,3 chancel 18.2 per 14.7 min 1274 ± 47 –9.12 –18.658948-2,4 17.9 per 24.5 min 1258 ± 42 –10.09 –19.158948-2,5 27.2 per 16 hr 1167 ± 44 –11.25 –19.26
Vaka 003 8948-2,1 Vådrö church, 3.8; 76–150 18.0 per 46 s 240 ± 90 –16.36 –19.198948-2,2 gable of the 21.4 per 5.6 min 1611 ± 32 –2.88 –14.148948-2,3 chancel 17.0 per 19.9 min 2181 ± 36 –6.71 –15.608948-2,4 16.5 per 42.3 min 1586 ± 36 –8.02 –16.808948-2,5 27.5 per 16 hr 1495 ± 55 –9.58 –17.13
Vaka005Ccharcoal
9056 Vårdö church,gable of thechancel
394 ± 41 –26.04
Saka 146 4562-2,1 Saltvik church, 6.1; 63–74 16.5 per 150 s 632 ± 44 –9.69 –14.364562-2,2 nave 19.0 per 13.8 min 810 ± 65 –7.46 –13.384562-2,3 18.7 per 24.0 min 895 ± 55 –9.15 –15.084562-2,4 20.8 per 43.6 min 894 ± 46 –9.46 –15.094562-2,5 24.2 per 16 hr 948 ± 48 –9.20 –14.71
Saka 148 4241-2,1 Saltvik church, 6.6; 39–62 17.3 per 61 s 613 ± 43 –11.87 –14.054241-2,2 nave 18.1 per 3.3 min 615 ± 48 –6.13 –6.134241-2,3 18.2 per 14.7 min 730 ± 60 –9.00 –13.144241-2,4 18.5 per 21.5 min 665 ± 55 –9.41 –12.524241-2,5 28.2 per 16 hr 758 ± 41 –9.86 –14.04
Dated samples and sample fractions (in order in which they occur in the text). (Continued)
Sample
Lab nrÅrhus(AAR-) Locality
Carbon yield (%)and grain-sizefraction (µm)
Fraction size (%)per dissolution time
14C age(BP)
δ13C ‰vs PDB
δ18O ‰vs PDB(85%H3PO4)
https://doi.org/10.1017/S0033822200041898Downloaded from https://www.cambridge.org/core. IP address: 65.21.228.167, on 21 Oct 2021 at 18:52:19, subject to the Cambridge Core terms of use, available at https://www.cambridge.org/core/terms.

Mortar Dating Using AMS 14C and Sequential Dissolution 67
Haka 052 3168-2,1 Hammarland 2.9; 76–125 19.5 per 45 s 756 ± 44 –17.04 –13.533168-2,2 church, nave 17.1 per 2.6 min 841 ± 43 –3.98 –16.193168-2,3 18.1 per 12.5 min 882 ± 44 –9.19 –18.523168-2,4 16.9 per 27.3 min 729 ± 33 –9.72 –19.123168-2,5 28.1 per 16 hr 1010 ± 55 –11.04 –19.07
Haka 055 2172-2,1 Hammarland 3.0; 76–125 16.8 per 127 s 739 ± 32 –13.85 –18.832172-2,2 church, nave 17.0 per 8.7 min 768 ± 30 –8 (AMS)2172-2,3 (partially lost) 16.4 per 19.6 min 807 ± 33 –10.25 –18.602172-2,4 17.1 per 34.1 740 ± 33 –8.68 –14.322172-2,5 32.0 per 16 hr 825 ± 50 –10.32 –19.28
Eka 030 2067-2.2,1 Eckerö church, 7.7; 63–74 22.1 per 84 s 705 ± 55 –19.64 –19.942067-2.2,2 nave 27.0 per 8.5 min (lost) — —2067-2.2,3 23.9 per 16.9 min 955 ± 44 –14.62 –17.892067-2.2,4 17.9 per 77.7 min 895 ± 55 –15.42 –17.392067-2.2,5 8.7 per 16 hr 1200 ± 50 –15 (AMS)2067-2.1,1 (aliquot) 7.7; 63–74 14.9 per 36 s (lost) — —2067-2.1,2 17.3 per 102 s 889 ± 49 –7.73 –14.94
Dated samples and sample fractions (in order in which they occur in the text). (Continued)
Sample
Lab nrÅrhus(AAR-) Locality
Carbon yield (%)and grain-sizefraction (µm)
Fraction size (%)per dissolution time
14C age(BP)
δ13C ‰vs PDB
δ18O ‰vs PDB(85%H3PO4)
https://doi.org/10.1017/S0033822200041898Downloaded from https://www.cambridge.org/core. IP address: 65.21.228.167, on 21 Oct 2021 at 18:52:19, subject to the Cambridge Core terms of use, available at https://www.cambridge.org/core/terms.


![SkeletalMuscleAMP-activatedProteinKinaseIsEssentialfor … · 2009-10-07 · 15min.Theupperaqueousphase(containing2-[14C]DG)wasusedtodetermine2-[14C]DG-Pasdescribedpreviously(29).Aportion](https://static.fdocuments.us/doc/165x107/5f3b5d9a091da77b4f678521/skeletalmuscleamp-activatedproteinkinaseisessentialfor-2009-10-07-15mintheupperaqueousphasecontaining2-14cdgwasusedtodetermine2-14cdg-pasdescribedpreviously29aportion.jpg)


![[14] Accelerator Mass Spectrometry for Biomedical …measurement of variousisotopes.(B) The1 MV accelerator mass spectrometry (AMS) system dedicated to the analysis of 14C in biomedical](https://static.fdocuments.us/doc/165x107/5f10edbbf5b3822f2b53dab7/14-accelerator-mass-spectrometry-for-biomedical-measurement-of-variousisotopesb.jpg)
