Mortality and causes of death 2015
58
Dr Pali Lehohla StatisticianGeneral What do South Africans die of? Findings from registered deaths, 2015 #StatsSA
-
Upload
statistics-south-africa -
Category
Data & Analytics
-
view
60 -
download
0
Transcript of Mortality and causes of death 2015

Dr Pali LehohlaStatistician-General
What do South Africans die of?
Findings from registered deaths, 2015
#StatsSA

Death:A permanent
disappearance of all evidence of life after a live birth has occurred
From death to statistics
Reporting of causes of death is based on the underlying
cause:“the disease or injury that initiated the train of events leading directly
to death”
Births and Deaths Registration Act, 1992 Statistics Act, 1999
Doctor verifies death & completes death DHA 1663 form
Submitted to DHA & entered on population register
3
Sent to Stats SA to code causes of death to ICD-10, process and analyze
ICD-10Death occurs
1 2
Statistics released
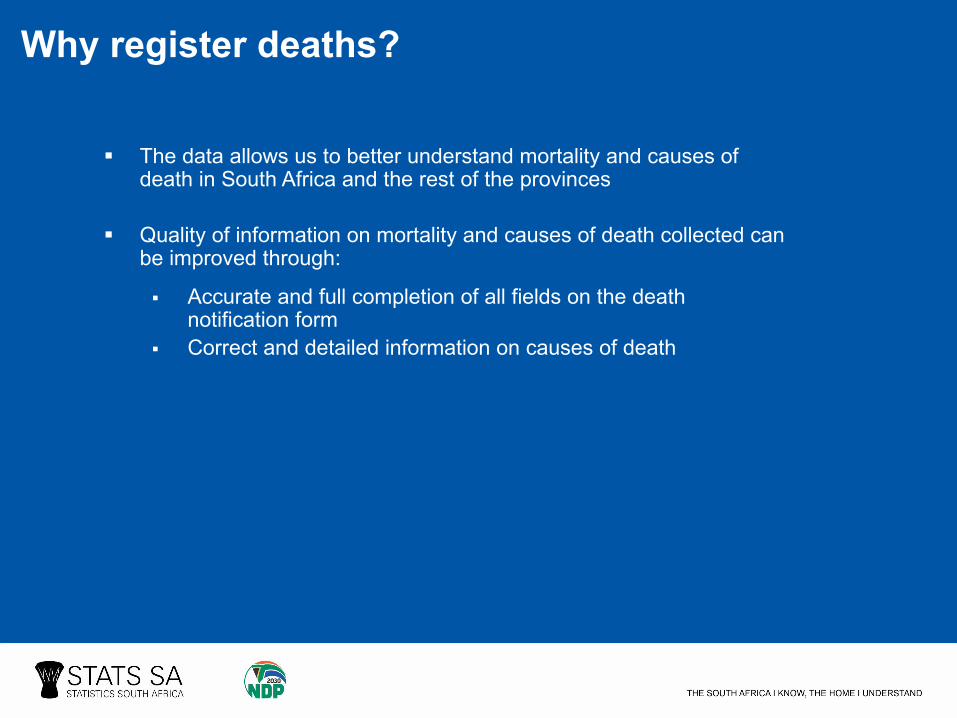
Why register deaths?
§ The data allows us to better understand mortality and causes of death in South Africa and the rest of the provinces
§ Quality of information on mortality and causes of death collected can be improved through:
§ Accurate and full completion of all fields on the death notification form
§ Correct and detailed information on causes of death

Strengths of death registration data § South Africa as a leader in sub-Saharan Africa : Only country in Africa using:
§ An automated system (IRIS) for coding causes of death § WHO data editing tools (ANACOD & CoDEdit)
§ Training of doctor on death certification
§ To improve the quality of causes of death certification
§ Improving Civil Registration and Vital Statistics Systems (CRVS)
§ Efforts at global, continental and country levels to improve CRVS)
§ Improved coverage of death registration
§ 96% completeness of death registration
§ Deaths registered soon after they occurred (3-Days regulation)§ Statistics compiled in accordance with WHO standards§ General improvements noted in the quality of data

Limitations of death registration data § 24% of deaths outside health facilities: occurred at home (22,2%) and dead on
arrival (1,8%);; and “other” (26%)§ May compromise proper diagnosis of the causes of death
§ Statistics are coded from what is recorded§ Not all information is accurate or fully completed§ Misreporting and insufficient reporting of causes of death § High proportion of non-natural deaths unspecified to give a conclusive profile
§ Delayed transfer of data from DHA§ Affects number of deaths processed

Implications for National Development Plan (NDP) Priorities
§ By 2030, South Africa should have:§ Raised life expectancy to at least 70 years§ Reduced maternal, infant and child mortality§ Significantly reduced prevalence of non-communicable diseases§ Reduced injuries, accidents and violence by 50% from 2010 levels§ Progressively reduced deaths from tuberculosis\
§ Tracking of NDP objectives has implications for setting of Sustainable Development Goals (SDGs) baselines and targets to “ensure healthy lives and promote well-being for all at all ages” AND to meet the aspirations of Agenda 2063 that “African people have a high standard of living, and quality of life, sound health and well-being”.

Life Expectancy at birth, 2007−2015
53,356,5
60,9 61,957,3
61,266,6 67,7
55,358,9
63,8 64,8
2007 2010 2014 2015
LIFE EXPECTANCY
DEATH YEAR
Males Females Total deaths
Data source: civil registration deaths and mid-year population estimates

Life Expectancy at birth, 2015
Data source: civil registration deaths and mid-year population estimates
NDP Targeted Life Expectancy in
2030
70 years
Females : 67,7 yearsMales : 61,9 years
64,8 years Total 2015 Life Expectancy from registered deaths
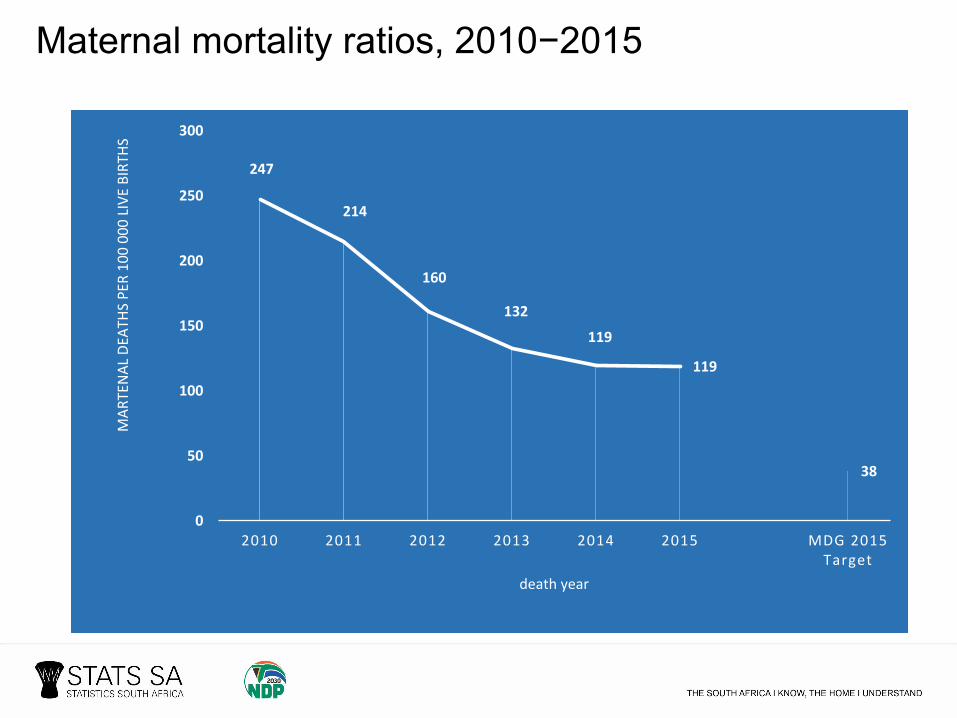
Maternal mortality ratios, 2010−2015
247
214
160
132119
119
38
0
50
100
150
200
250
300
2010 2011 2012 2013 2014 2015 MDG 2015 Target
MAR
TENA
L DE
ATHS
PER
100 000 LIVE BIRT
HS
death year

29
24 22 22 22 1918
40
32 31 29 2926
20
0
5
10
15
20
25
30
35
40
45
2010 2011 2012 2013 2014 2015 MDG Target 2015
Deaths per 1000 live births
Death Year
Infant mortality Under-‐5 child mortality
Infant and child mortality rates, 2010−2015

National Development plan target or actions by 2030 Deaths 2015 show:
q Increase life expectancy to at least 70 years
q Progressively reduced deaths from tuberculosis, HIV disease and other communicable diseases
q Reduced injuries, accidents and violence by 50% from 2010 levels
q 460 236 deaths in 2015 – peak age group 60−64 years
q Communicable diseases: § TB number one leading cause of
death but decreasing proportions especially for females
§ TB & HIV part of top ten causes only for black Africans and coloureds.
§ HIV mostly amongst ages 25−54 years.
q [51 227] non-natural deaths in 2015 –increase of 3,9% from 2010 levels [49 318].§ Account for 61,3% of deaths to males 20−24 years

National Development plan target or actions by 2030
Deaths 2015 show:
q Significantly reduced prevalence of non-communicable diseases
q Reduce maternal, infant and child mortality
q Non-communicable diseases (NCDs) –Account for 55,5% deaths in 2015 – 8,9% points increase from 2010 levels [46,6%].§ In 2015, top three causes for whites and Indian/Asians were NCDs
q In 2015, the 24 216 (5,3%) infant deaths and 31 938 (6,9%) child deaths.
Mortality rates:§ 19 Infant deaths per 1000 live births§ 26 Under-5 deaths per 1000 live births
§ 119 Maternal deaths per 100 000 live births

Key findings

Number of deaths in South Africa, 1997−2015317 860
366 585
382 624
417 191
456 238
503 335
558 388
578 355
599 593
614 158
606 112
598 165
583 419
551 320
515 427
493 493
475 510
474 659
460 236
1997
1998
1999
2000
2001
2002
2003
2004
2005
2006
2007
2008
2009
2010
2011
2012
2013
2014
2015
NUMBER OF DEATHS
Year of death
The number of registered deaths has been declining
since 2007
460 236deaths occurred in South Africa in 2015

Age
Demographic profileSex Geography

0
2
4
6
8
100
1-4
5-9
10-14
15-19
20-24
25-29
30-34
35-39
40-44
45-49
50-54
55-59
60-64
65-69
70-74
75-79
80-84
85-89
90+
Percentage
Age group
2011 2012 2013 2014 2015
The age profile of deaths is starting to normalise as the
proportion of deaths has shifted from young adult to older age
groups
Percentage of deaths by age and year, 2011−2015

0
1
2
3
4
5
6
7
8
9
100
1-4
5-9
10-14
15-19
20-24
25-29
30-34
35-39
40-44
45-49
50-54
55-59
60-64
65-69
70-74
75-79
80-84
85-89
90+
Percentage
Male Female
Age group
Percentage distribution of deaths by age and sex, 2015
Males tend to die at younger ages than females

Provincial distribution of registered deaths, 2015
21,3%
17,7%
14,9%
10,8% 10,2%
7,5% 7,4% 6,9%
3,0%
Gauteng KwaZulu Natal
Eastern Cape
Western Cape
Limpopo North West Mpumalanga Free State Northern Cape
The biggest proportion of deaths were recorded in
Gauteng followed by KwaZulu-Natal.

Number of deaths per 1 000 population, 2015
LP8,2
MP8,0
GP7,4
KZN7,4
EC9,9
FS11,3
NW9,3
NC11,6
WC8,1
South Africa8,4 deaths per 1 000 population
Northern Cape (11,6) and Free State (11,3) had the highest number of deaths per 1 000
population
How we die
• Communicable diseases • are diseases caused by pathogenic microorganisms and can be spread, directly or indirectly, from one person to another.
• Non-communicable diseases • are medical conditions or diseases that are non-infectious or non-transmissible among people. These last for longer periods of time and progress slowly and include, amongst others
• (WHO, 2013).• Injuries• Non-natural deaths e.g accidents;; assault;; suicide

0
10
20
30
40
50
601997
1998
1999
2000
2001
2002
2003
2004
2005
2006
2007
2008
2009
2010
2011
2012
2013
2014
2015
Percentage of total deaths
Year of death
Percentage of deaths: Communicable, Non-communicable and Injuries, 1997−2015
2015Gap was22% points
1997 Gap was24% points
CommunicableNon-communicable Injuries

0
10
20
30
40
50
60
70
80
01-4
5-9
10-14
15-19
20-24
25-29
30-34
35-39
40-44
45-49
50-54
55-59
60-64
65-69
70-74
75-79
80-84
85-89
90+
Percentage of deaths
Age group
Male
Percentage of deaths: Communicable by age and sex
From Ages 5−44 yearsfemales had higherpercentages of deaths due to communicable
diseases
0
10
20
30
40
50
60
70
80
90
01-4
5-9
10-14
15-19
20-24
25-29
30-34
35-39
40-44
45-49
50-54
55-59
60-64
65-69
70-74
75-79
80-84
85-89
90+
Percentage of deaths
Age group
Male
Generally, there were more female deaths than male deaths due to non-
communicable diseases
Percentage of deaths: Non-communicable by age and sex

0
10
20
30
40
50
60
70
0
1-4
5-9
10-14
15-19
20-24
25-29
30-34
35-39
40-44
45-49
50-54
55-59
60-64
65-69
70-74
75-79
80-84
85-89
90+
Percentage of deaths
Age group
Male Female
Percentage of deaths: Injuries by age and sex
Injury deaths for females peak at 29% and much younger age group (5−9)
Above 60% deaths due to injuries for males 20−24 years

39,2%
41,0%
36,1%
37,9%
35,4%
33,7%
32,6%
29,9%
21,2%
33,4%
49,5%
50,1%
52,4%
53,2%
54,5%
54,8%
56,6%
58,4%
65,6%
55,5%
11,2%
8,9%
11,5%
8,9%
10,1%
11,6%
10,8%
11,7%
13,2%
11,1%
Mpumalanga
Limpopo
KwaZulu-Natal
North West
Free State
Eastern Cape
Northern Cape
Gauteng
Western Cape
South Africa
CD NCD Injuries
Percentage of communicable, non-communicable and injuries by Province, 2015

Total Deaths460 236
Main groups of causes of death, 2015
17,8%
9,1%
11,1%
Other
TB
HIV disease
Infectious diseases
19,5%
9,6%
6,9%Metabolic diseases
26,0%

20141 Tuberculosis 8,3%
2 Cerebrovascular diseases 5,1%
3 Diabetes mellitus 5,0%
4 Other forms of heart disease 4,8%
5 Influenza and pneumonia 4,8%
6 HIV disease 4,8%
7 Hypertensive diseases 3,9%
8 Intestinal infectious diseases 3,1%
9 Other viral diseases 3,1%
10 Chronic lower respiratory diseases 2,7%
Top ten leading causes of death, 20152015
1 Tuberculosis 7,2%
2 Diabetes mellitus 5,4%
3 Cerebrovascular diseases 5,0%
4 Other forms of heart disease 4,8%
5 HIV disease 4,8%
6 Influenza and pneumonia 4,5%
7 Hypertensive diseases 4,2%
8 Other viral diseases 3,5%
9 Chronic lower respiratory diseases 2,8%
10 Ischaemic heart diseases 2,7%
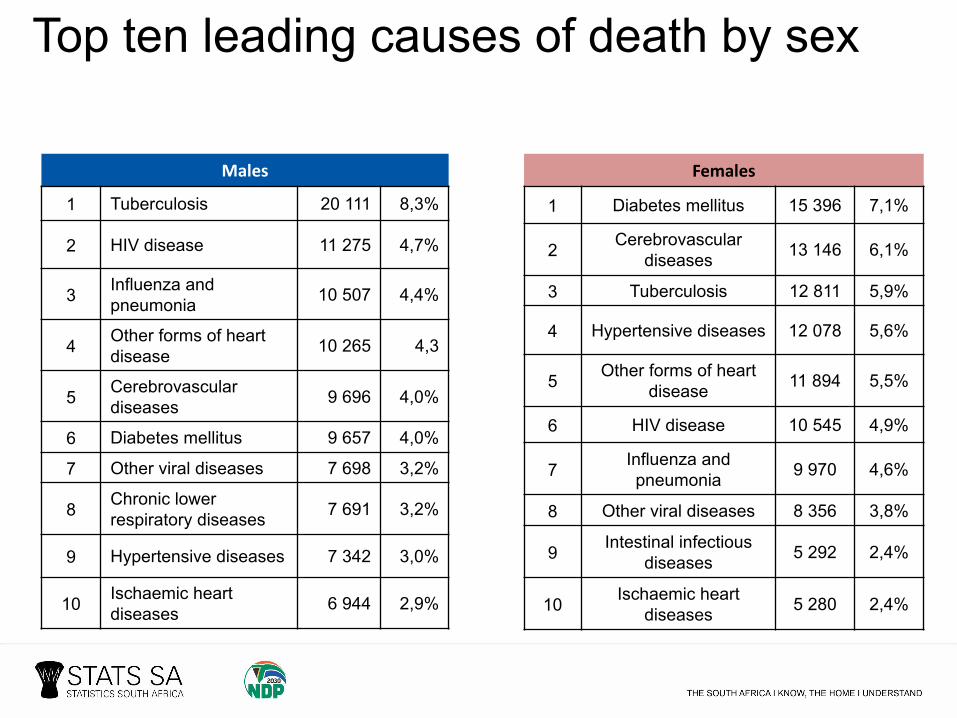
Males
1 Tuberculosis 20 111 8,3%
2 HIV disease 11 275 4,7%
3 Influenza and pneumonia 10 507 4,4%
4 Other forms of heart disease 10 265 4,3
5 Cerebrovascular diseases 9 696 4,0%
6 Diabetes mellitus 9 657 4,0%
7 Other viral diseases 7 698 3,2%
8 Chronic lower respiratory diseases 7 691 3,2%
9 Hypertensive diseases 7 342 3,0%
10 Ischaemic heart diseases 6 944 2,9%
Top ten leading causes of death by sex
Females
1 Diabetes mellitus 15 396 7,1%
2 Cerebrovascular diseases 13 146 6,1%
3 Tuberculosis 12 811 5,9%
4 Hypertensive diseases 12 078 5,6%
5 Other forms of heart disease 11 894 5,5%
6 HIV disease 10 545 4,9%
7 Influenza and pneumonia 9 970 4,6%
8 Other viral diseases 8 356 3,8%
9 Intestinal infectious diseases 5 292 2,4%
10 Ischaemic heart diseases 5 280 2,4%
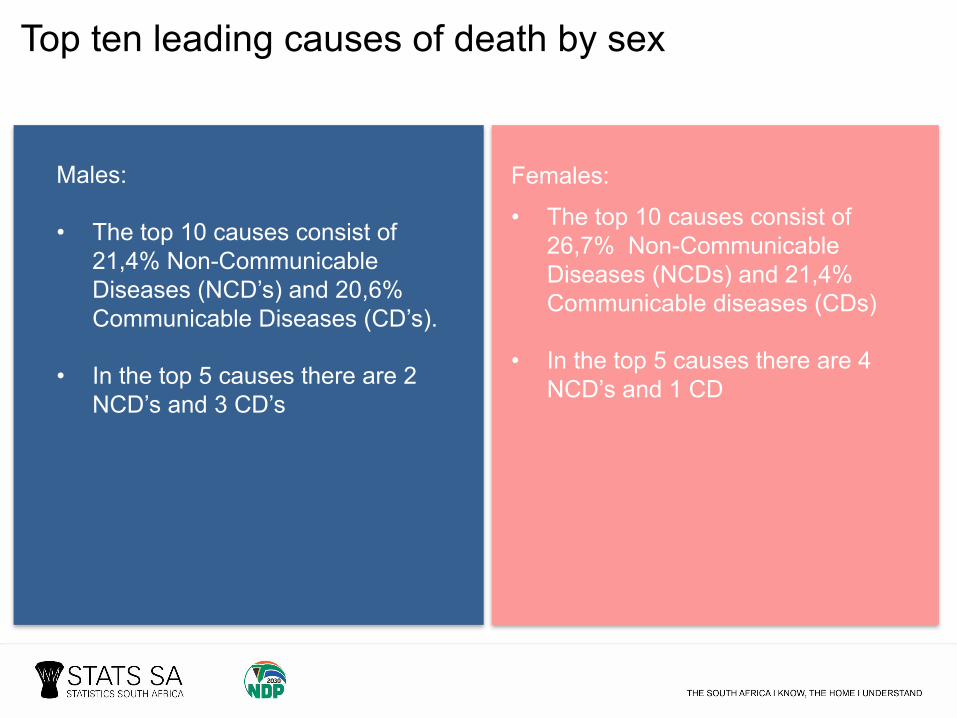
Males:
• The top 10 causes consist of 21,4% Non-Communicable Diseases (NCD’s) and 20,6% Communicable Diseases (CD’s).
• In the top 5 causes there are 2 NCD’s and 3 CD’s
Top ten leading causes of death by sex
Females:
• The top 10 causes consist of 26,7% Non-Communicable Diseases (NCDs) and 21,4% Communicable diseases (CDs)
• In the top 5 causes there are 4 NCD’s and 1 CD

*Excluding unspecified sex and age
500
1 000
1 500
2 000
2 500
3 000
01-4
5-9
10-14
15-19
20-24
25-29
30-34
35-39
40-44
45-49
50-54
55-59
60-64
65-69
70-74
75-79
80-84
85-89
90+
Num
ber of deaths
Age group
Sex and age distribution of Tuberculosis deaths, 2015
01-4
5-9
10-14
15-19
20-24
25-29
30-34
35-39
40-44
45-49
50-54
55-59
60-64
65-69
70-74
75-79
80-84
85-89
90+
Num
ber of deaths
Age group
Sex and age distribution of Diabetes Mellitus deaths, 2015
N = 20 050
N = 12 794
N = 9 654
N = 15 390
TB concentrated in males of working ages
More women are dying of diabetes from age 45 years
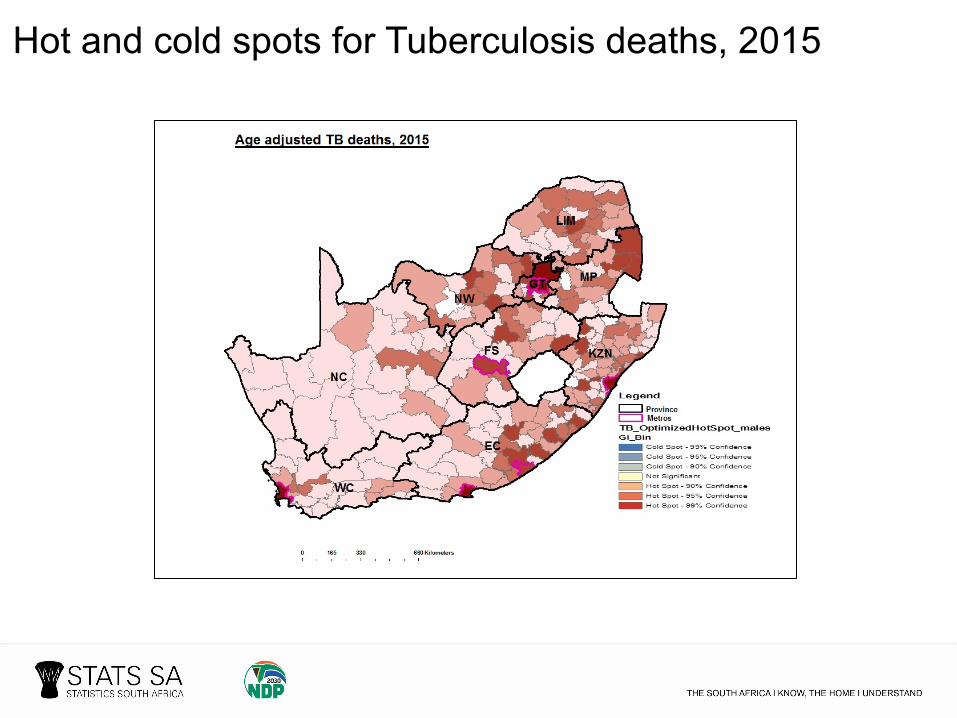
Hot and cold spots for Tuberculosis deaths, 2015

500
1 000
1 500
2 000
2 5000
1-4
5-9
10-14
15-19
20-24
25-29
30-34
35-39
40-44
45-49
50-54
55-59
60-64
65-69
70-74
75-79
80-84
85-89
90+
Number of deaths
Age group
Sex and age distribution of Diabetes Mellitus deaths, 2015
*Excluding unspecified sex and age
More women are dying of diabetes from age 45 years
N = 9 654
N = 15 390

Hot and cold spots for Diabetes Mellitus deaths, 2015
Age adjusted diabetes mellitus, Males Age adjusted diabetes mellitus, Females
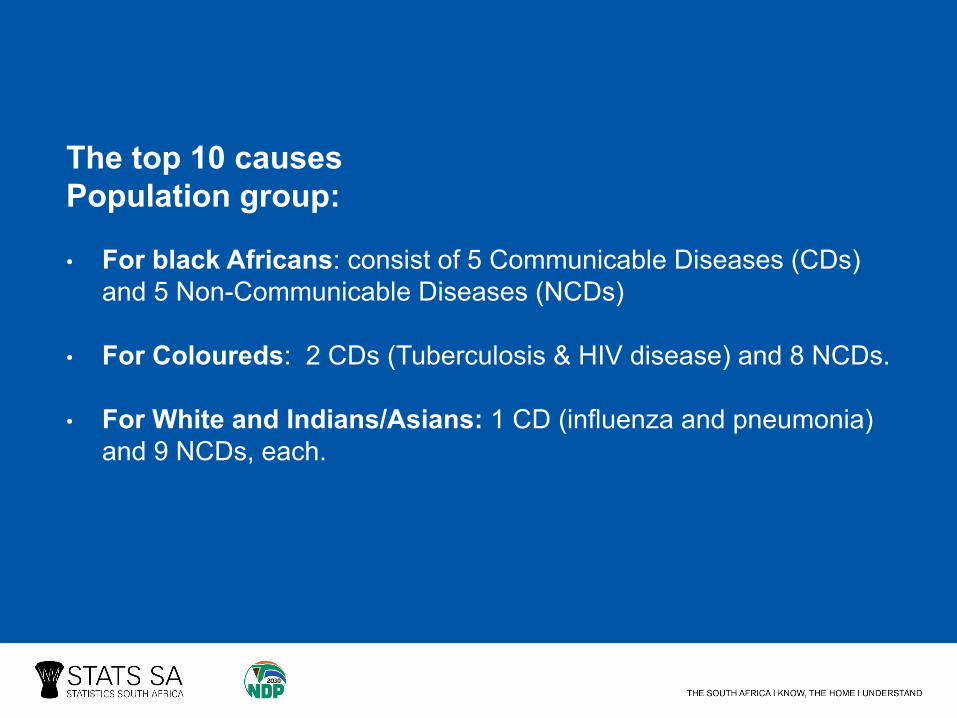
The top 10 causes Population group:
• For black Africans: consist of 5 Communicable Diseases (CDs) and 5 Non-Communicable Diseases (NCDs)
• For Coloureds: 2 CDs (Tuberculosis & HIV disease) and 8 NCDs.
• For White and Indians/Asians: 1 CD (influenza and pneumonia) and 9 NCDs, each.
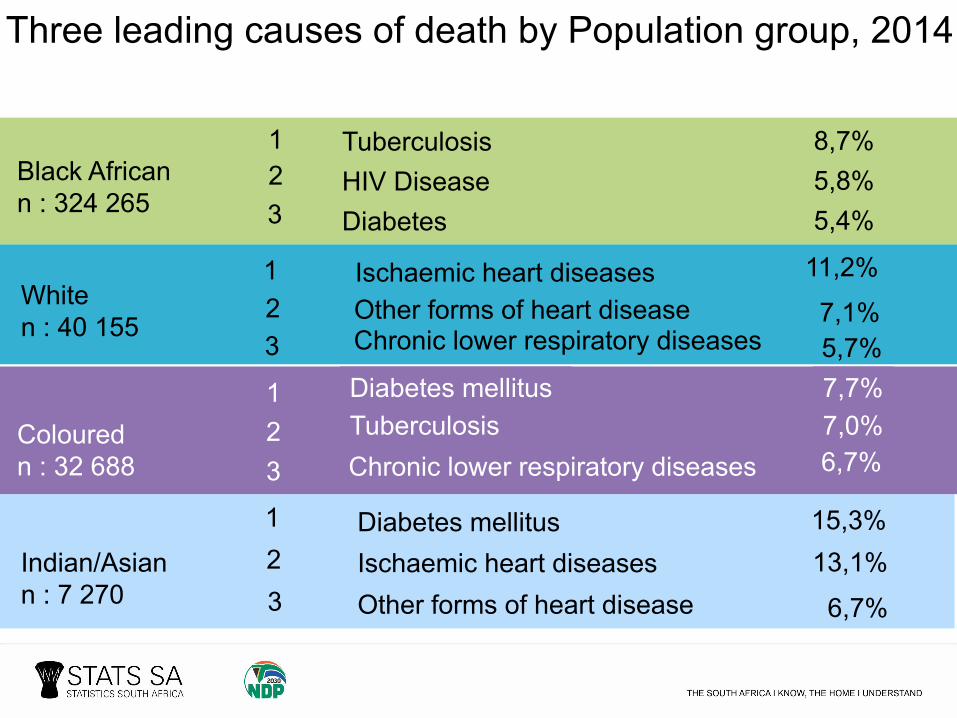
Three leading causes of death by Population group, 2014
Black Africann : 324 265
TuberculosisHIV DiseaseDiabetes
8,7%5,8%5,4%
123
Whiten : 40 155
Ischaemic heart diseases Other forms of heart disease Chronic lower respiratory diseases
123
11,2%7,1%5,7%
Indian/Asiann : 7 270
Ischaemic heart diseases Other forms of heart disease
123
Diabetes mellitus 15,3%13,1%
6,7%
Colouredn : 32 688
TuberculosisDiabetes mellitus 7,7%
7,0%123 6,7%Chronic lower respiratory diseases

Young people 15−24 years causes of death by population group, 2015
Black Africans89,7%
White2,1%
Coloured7,5%
Indian/Asian0,8%
[N= 18 533]
Black Africans White
Coloured Indian/Asian
*Excluding unspecified population group
Coloured [n= 1 381]
Indian/Asian [n= 146]
Natural causes 38,0% Natural causes 47,3%
Tuberculosis 9,5% Tuberculosis 2,7%
HIV disease 5,3%Other forms of heart
disease 2,7%
Non-natural causes 62,0% Non-natural causes 52,7%
Assault 14,3% Assault 6,8%
Transport accidents 6,3% Transport accidents 4,8%
Black Africans[n= 16 616]
White[n= 390]
Natural causes 43,6% Natural causes 35,1%
Tuberculosis 8,7% Tuberculosis 3,3%
HIV disease 6,0% HIV disease 2,8%
Non-natural causes 56,4% Non-natural causes 64,9%
Assault 10,7% Transport accidents 11,8%
Transport accidents 4,8% Assault 2,6%

Three leading underlying causes of death for infants
11,2%
12,1%
35,1%
DISORDERS RELATED TO LENGTH OF
GESTAT ION AND FETAL GROWTH
OTHER D ISORDERS
OR IG INAT ING IN THE PER INATAL
PER IOD
RESP IRATORY AND
CARD IOVASCULAR D ISORDERS SPEC IF IC TO
THE PER INATAL PER IOD
NEONATAL (0−28 DAYS)[N: 10 663]
6,1%
14,9%
15,7%
MALNUTR I T ION
INF LUENZA AND
PNEUMON IA
INTEST INAL INFECT IOUS D I S EASES
POST-‐NEONATAL (29 DAYS -‐ <1
YEAR)[N: 13 553]
8,4%
9,5%
15,6%
INF LUENZA AND PNEUMON IA
INTEST INAL INFECT IOUS D I S EASES
RESP I RATORY AND
CARD IOVASCULAR D I SORDERS S PEC I F I C TO
THE PER INATAL P ER IOD
INFANTS (<1 YEAR)
[N: 24 216]

Three leading underlying causes of death for children
8,4%
10,1%
11,9%
INF LUENZA AND PNEUMON IA
INTEST INAL INFECT IOUS D I S EASES
RESP I RATORY AND CARD IOVASCULAR
D I SORDERS S PEC I F I C TO THE PER INATAL P ER IOD
UNDER 5-‐YEARS[N= 31 938]
8,4%
8,6%
12,3%
MALNUTR I T ION
INF LUENZA AND PNEUMON IA
INTEST INAL INFECT IOUS D I S EASES
AGE 1−4[N= 7 722]

Three leading causes of death by age groups, 2015
5,0%
6,8%
8,9%
MALNUTR I T ION
INF LUENZA AND PNEUMON IA
INTEST INAL INFECT IOUS D I S EASES
AGE 1−14 [N= 13 938]
7,4%
10,5%
12,4%
OTHER V I RAL D I S EASES
H IV D I S EASE
TUBERCULOS I S
AGE 15−44 [N= 131 593]
5,1%
7,0%
8,9%
CEREBROVASCULAR D I S EASES
D IABETES MEL L I TUS
TUBERCULOS I S
AGE 45−64 [N= 130 997]
8,2%
9,0%
9,1%
HYPERTENS IVE D I S EASES
CEREBROVASCULAR D I S EASES
D IABETES MEL L I TUS
AGE 65+ [N: 158 270]

Leading causes of death within each province, 2015Influenza and pneumonia
Tuberculosis
Diabetes mellitusOther forms of heart disease
LP
MP
KZN
EC
NW
NC
GP
FS
WC

HIV related deathsThese are deaths attributed to HIV,
Tuberculosis, Influenza and pneumonia, Intestinal infectious diseases, Certain
disorders involving the immune mechanism,Kaposi's sarcoma and Meningitis

HIV related vs non-HIV related deaths, 1997 - 2015
Deaths related to HIV
Deaths not related to HIV
0
100000
200000
300000
400000
500000
600000
7000001997
1998
1999
2000
2001
2002
2003
2004
2005
2006
2007
2008
2009
2010
2011
2012
2013
2014
2015
Number of deaths
Death year

HIV related vs non-‐HIV related by age in 2015
HIV related deaths
5 000
10 000
15 000
20 000
25 000
30 000
35 000
40 0000
1-4
5-9
10-14
15-19
20-24
25-29
30-34
35-39
40-44
45-49
50-54
55-59
60-64
65-69
70-74
75-79
80-84
85-89
90+
Number of deaths
Age group
HIV related Deaths in25−54 Age Group
[N= 70 547]
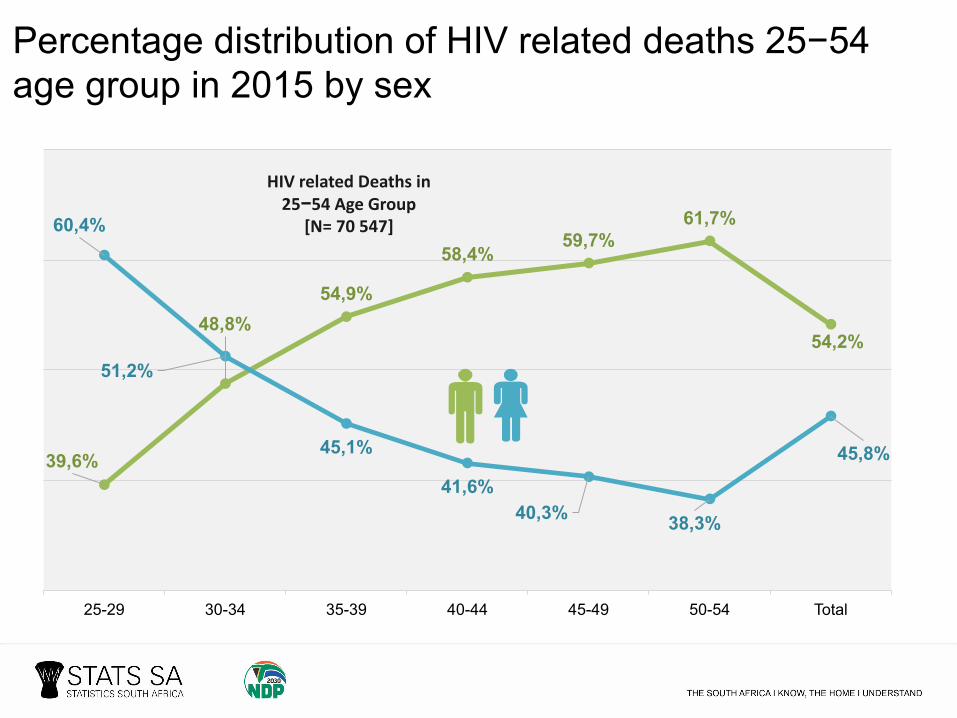
Percentage distribution of HIV related deaths 25−54 age group in 2015 by sex
39,6%
48,8%54,9%
58,4%59,7%
61,7%
54,2%
60,4%
51,2%
45,1%
41,6%40,3% 38,3%
45,8%
25-29 30-34 35-39 40-44 45-49 50-54 Total
HIV related Deaths in25−54 Age Group
[N= 70 547]

Non-natural causes of death

Percentage of non-natural deaths, 1997 - 2015
17,0%
8,7% 9,1%
11,1%
0
4
8
12
16
201997
1998
1999
2000
2001
2002
2003
2004
2005
2006
2007
2008
2009
2010
2011
2012
2013
2014
2015
Percentage of deaths
Death Year
Non-natural deaths include all external causes of morbidity and mortality
The percentage of non-natural deaths in South Africa has decreased over the years, but has increased
slightly since 2010
NDP requires a 50% reduction in injuries,
accidents and violence from 2010 levels by 2030

Number of deaths: Communicable, Non-communicable and Injuries, 1997−2015
4500
54500
104500
154500
204500
254500
1997 1998 1999 2000 2001 2002 2003 2004 2005 2006 2007 2008 2009 2010 2011 2012 2013 2014 2015
CD NCD Injuries
Increases in communicable and non-communicable deaths peaked in 2006.
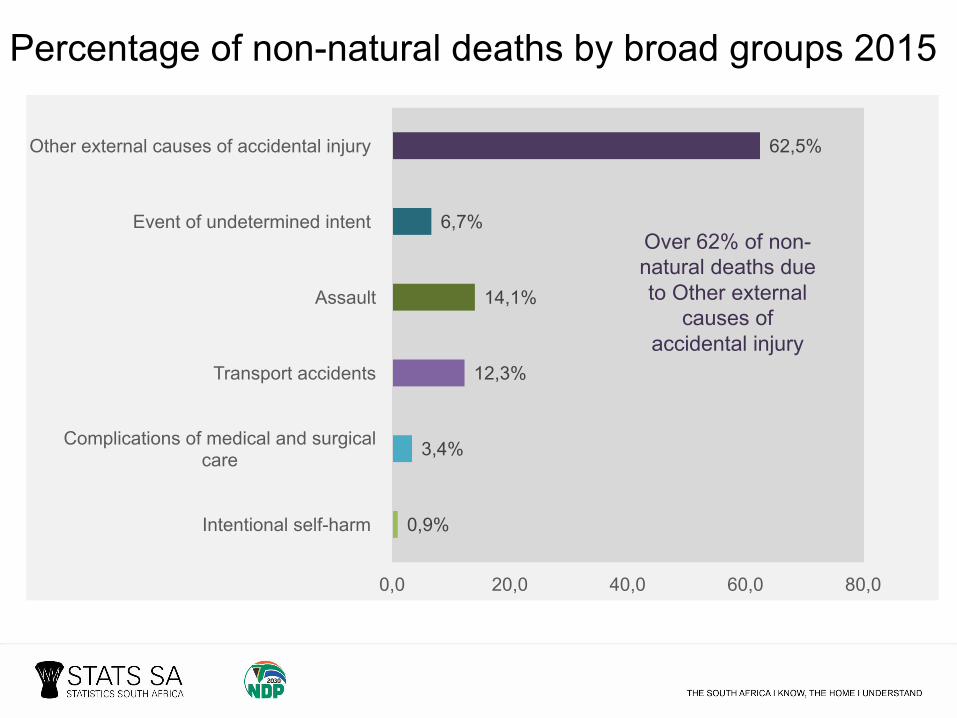
0,9%
3,4%
12,3%
14,1%
6,7%
62,5%
0,0 20,0 40,0 60,0 80,0
Intentional self-harm
Complications of medical and surgical care
Transport accidents
Assault
Event of undetermined intent
Other external causes of accidental injury
Percentage of non-natural deaths by broad groups 2015
Over 62% of non-natural deaths due to Other external
causes of accidental injury
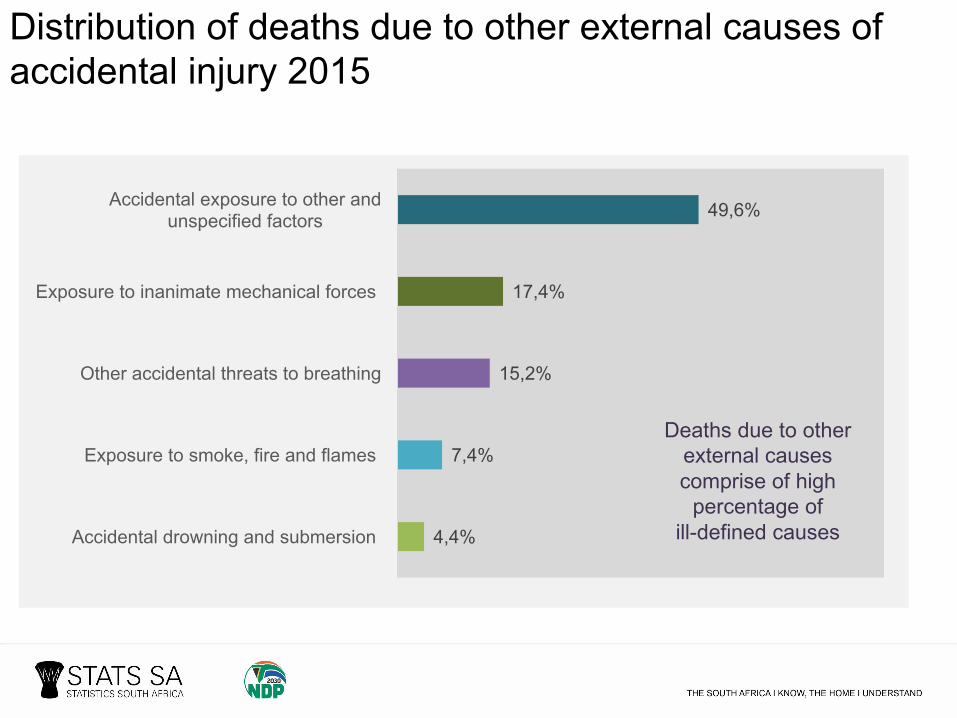
4,4%
7,4%
15,2%
17,4%
49,6%
Accidental drowning and submersion
Exposure to smoke, fire and flames
Other accidental threats to breathing
Exposure to inanimate mechanical forces
Accidental exposure to other and unspecified factors
Distribution of deaths due to other external causes of accidental injury 2015
Deaths due to other external causes comprise of high percentage of
ill-defined causes

Transport accident deaths percentage of non-natural deaths within each province
LP31,9%
MP11,2%
KZN12,2%
EC13,0%
NW17,0%
NC28,9%
GP
FS20,5%
WC6,8%
GP2,5%
South Africa12,3%
Limpopo & Northern Cape had the highest percentage of deaths due to transport accidents

Transport accident deaths percentage of non-‐natural deaths by District Municipality: 2015
The Waterberg District Municipalityrecorded the highest percentage of deaths due to transport accidents in South
Africa
Rank District Municipality ProvincePercentage of non-natural deaths in DM
1 Waterberg Limpopo 41,0%
2 John Taolo Gaetsewe North West 38,4%
3 Greater Sekhukhune Limpopo 37,3%
4 Capricorn Limpopo 35,3%
5 Fezile Dabi Free State 34,3%
6 Central Karoo Western Cape 32,5%
7 Namakwa Northern Cape 31,0%
8 Ngaka Modiri Molema North West 30,2%
9 Siyanda Northern Cape 28,7%
10 Frances Baard Northern Cape 27,3%
Ranking of Metro Municipalities
32. Mangaung34. Nelson MM38 City of Tshwane40. City of eThekwini41. Buffalo City 43. City of Cape Town48. City of Johannesburg51. Ekurhuleni MM

Hot and cold spots for Transport deaths, 2015

Assault related deaths percentage of non-natural deaths within each province
LP7,3%
MP5,6%
KZN13,2%
EC22,3%
NW9,1%
NC21,6%
FS16,1%
WC21,6%
GP9,2%
South Africa14,1%
The Eastern Cape experienced the
highest percentage of deaths due to assault
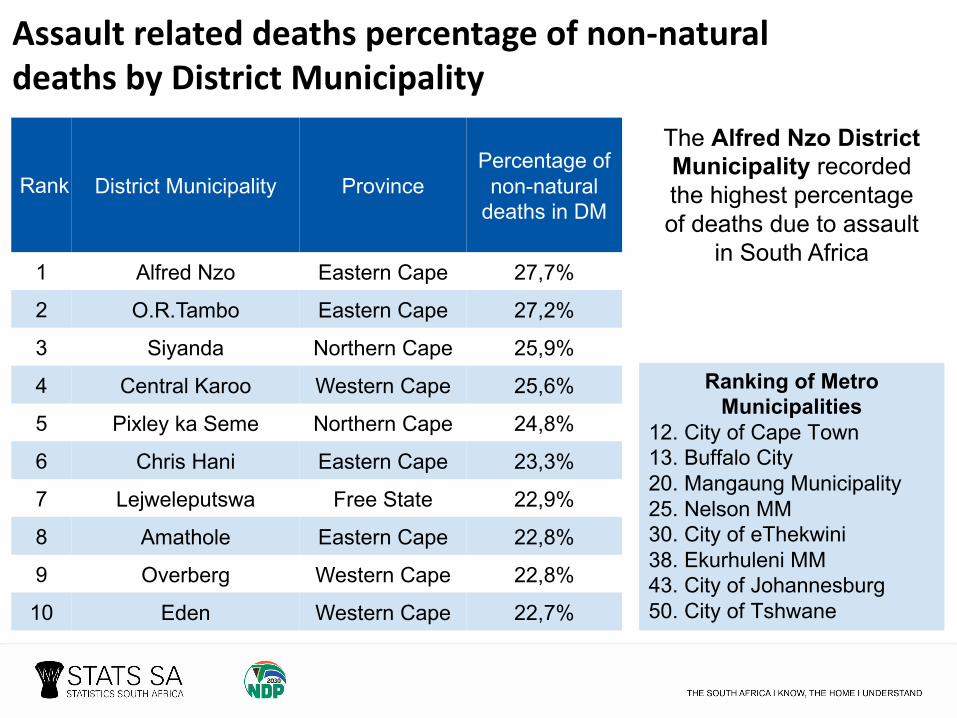
Assault related deaths percentage of non-‐natural deaths by District Municipality
The Alfred Nzo District Municipality recorded the highest percentage of deaths due to assault
in South Africa
Rank District Municipality ProvincePercentage of non-natural deaths in DM
1 Alfred Nzo Eastern Cape 27,7%
2 O.R.Tambo Eastern Cape 27,2%
3 Siyanda Northern Cape 25,9%
4 Central Karoo Western Cape 25,6%
5 Pixley ka Seme Northern Cape 24,8%
6 Chris Hani Eastern Cape 23,3%
7 Lejweleputswa Free State 22,9%
8 Amathole Eastern Cape 22,8%
9 Overberg Western Cape 22,8%
10 Eden Western Cape 22,7%
Ranking of Metro Municipalities
12. City of Cape Town13. Buffalo City 20. Mangaung Municipality25. Nelson MM30. City of eThekwini38. Ekurhuleni MM43. City of Johannesburg50. City of Tshwane

Firearm and breathing related deaths as a percentage of non-natural deaths within each province
0,0%
5,0%
10,0%
15,0%
20,0%
25,0%
Discharge from firearm Accidental threats to breathing

45,0%
2,1%
Hospital
Emergency Roomoutpatient
1,8%Dead on arrival
22,2%2,9%
Nursing Home
Distribution of deaths by place of death occurrence
*Other, Unknown or Unspecified 26,0%
Home

Conclusions§ The overall number of deaths in South Africa continues to decline
since 2007. § The age and sex profile of deaths shows proportion of deaths
shifting from young adults to older age groups, particularly among females.
§ The profile of the global burden of disease shows that on average South Africans are dying of non-communicable diseases.
§ Leading causes show that:§ Tuberculosis 1st leading cause in 2014 and 2015 § Diabetes moved up from 3rd position in 2014 to 2nd in 2015§ Diabetes was 1st among females and 5th amongst males § HIV disease was 2nd among males and 6th amongst females

§ Mortality and causes of death 2016 release scheduled for November 2017
§ SADHS § data collection completed. § Currently busy with data analysis§ The Key Indicator Report (KIR) will be released within three months.
Next Steps

The Mortality report, 2015 is also available to
download from the Stats SA app