MORPHOMETRIC ANALYSIS AND TECTONIC … · ANALYSIS AND INTERPRETATION OF DIGITAL TERRAIN DATA 809...
16
Copyright © 2003 John Wiley & Sons, Ltd. Earth Surface Processes and Landforms Earth Surf. Process. Landforms 28, 807–822 (2003) Published online in Wiley InterScience (www.interscience.wiley.com). DOI: 10.1002/esp.469 MORPHOMETRIC ANALYSIS AND TECTONIC INTERPRETATION OF DIGITAL TERRAIN DATA: A CASE STUDY GYOZO JORDAN 1,2,3 * 1 Joint Research Centre of the European Commission, Institute for Environment and Sustainability, TP 280, I-21020, Ispra (VA), Italy 2 Geological Institute of Hungary, Hungarian Geological Survey, Budapest, Hungary 3 Uppsala University, Institute for Earth Sciences, Uppsala Sweden Received 4 September 2000; Revised 15 July 2002; Accepted 3 October 2002 ABSTRACT Tectonic movement along faults is often reflected by characteristic geomorphological features such as linear valleys, ridgelines and slope-breaks, steep slopes of uniform aspect, regional anisotropy and tilt of terrain. Analysis of digital elevation models, by means of numerical geomorphology, provides a means of recognizing fractures and characterizing the tectonics of an area in a quantitative way. The objective of this study is to investigate the use of numerical geomorphometric methods for tectonic geomorphology through a case study. The methodology is based on general geomorphometry. In this study, the basic geometric attributes (elevation, slope, aspect and curvatures) are complemented with the automatic extraction of ridge and valley lines and surface specific points. Evans’ univariate and bivariate methodology of general geomorphometry is extended with texture (spatial) analysis methods, such as trend, autocorrelation, spectral, and network analysis. Terrain modelling is implemented with the integrated use of: (1) numerical differential geometry; (2) digital drainage network analysis; (3) digital image processing; and (4) statistical and geostatistical analysis. Application of digital drainage network analysis is empha- sized. A simple shear model with principal displacement zone with an NE–SW orientation can account for most of the the morphotectonic features found in the basin by geological and digital tectonic geomorphology analyses. Copyright © 2003 John Wiley & Sons, Ltd. KEY WORDS: digital terrain modelling; tectonic geomorphology; digital drainage analysis; morphometry INTRODUCTION Digital elevation models (DEMs) provide an opportunity to quantify land surface geometry in terms of elevation and its derivatives. The basic geometric properties that characterize the terrain surface at a point are: (1) eleva- tion; (2) properties of the gradient vector – its magnitude defining slope, and its direction angle defining terrain aspect; (3) surface curvature, (4) convexity; and (5) surface-specific points and lines, i.e. local maxima (peaks), minima (pits), saddle points (passes), inflection points, break-lines, ridge and valley lines. The relationship between geometric point attributes and tectonic structures such as slope-breaks and fractures is often straight- forward (Siegal and Gillespie, 1980; Drury, 1987; Prost, 1994; Salvi, 1995). Steep slopes of uniform aspect over an area may be related to faulting. Linear valleys, ridgelines and slope-breaks are morphological features commonly associated with faults (Prost, 1994). Complex structures, such as folds and curving fault lines, are difficult to capture by geometric analysis. In contrast to local geometric analysis, numerical geomorphology studies the statistical and spatial charac- teristics and relationships of point attributes (Evans, 1972, 1980). Riley and Moore (1993) used elevation histo- grams to capture and describe step and horizontal pediments in a mountain slope associated with normal faulting. Relationships between point attributes are used to characterize the terrain further (Evans, 1980). In the present tectonic geomorphology study, only the simplest relationships were investigated. The elevation-average slope * Correspondence to: G. Jordan, Joint Research Centre of the European Commission, Institute for Environment and Sustainability, TP 280, I-21020, Ispra (VA), Italy. E-mail: [email protected]
Transcript of MORPHOMETRIC ANALYSIS AND TECTONIC … · ANALYSIS AND INTERPRETATION OF DIGITAL TERRAIN DATA 809...

ANALYSIS AND INTERPRETATION OF DIGITAL TERRAIN DATA 807
Copyright © 2003 John Wiley & Sons, Ltd. Earth Surf. Process. Landforms 28, 807–822 (2003)
Earth Surface Processes and Landforms
Earth Surf. Process. Landforms 28, 807–822 (2003)Published online in Wiley InterScience (www.interscience.wiley.com). DOI: 10.1002/esp.469
MORPHOMETRIC ANALYSIS AND TECTONIC INTERPRETATION
OF DIGITAL TERRAIN DATA: A CASE STUDY
GYOZO JORDAN1,2,3*
1 Joint Research Centre of the European Commission, Institute for Environment and Sustainability, TP 280, I-21020, Ispra (VA), Italy2 Geological Institute of Hungary, Hungarian Geological Survey, Budapest, Hungary
3 Uppsala University, Institute for Earth Sciences, Uppsala Sweden
Received 4 September 2000; Revised 15 July 2002; Accepted 3 October 2002
ABSTRACT
Tectonic movement along faults is often reflected by characteristic geomorphological features such as linear valleys, ridgelinesand slope-breaks, steep slopes of uniform aspect, regional anisotropy and tilt of terrain. Analysis of digital elevation models,by means of numerical geomorphology, provides a means of recognizing fractures and characterizing the tectonics of an areain a quantitative way. The objective of this study is to investigate the use of numerical geomorphometric methods for tectonicgeomorphology through a case study. The methodology is based on general geomorphometry. In this study, the basicgeometric attributes (elevation, slope, aspect and curvatures) are complemented with the automatic extraction of ridge andvalley lines and surface specific points. Evans’ univariate and bivariate methodology of general geomorphometry is extendedwith texture (spatial) analysis methods, such as trend, autocorrelation, spectral, and network analysis. Terrain modelling isimplemented with the integrated use of: (1) numerical differential geometry; (2) digital drainage network analysis; (3) digitalimage processing; and (4) statistical and geostatistical analysis. Application of digital drainage network analysis is empha-sized. A simple shear model with principal displacement zone with an NE–SW orientation can account for most of the themorphotectonic features found in the basin by geological and digital tectonic geomorphology analyses. Copyright © 2003John Wiley & Sons, Ltd.
KEY WORDS: digital terrain modelling; tectonic geomorphology; digital drainage analysis; morphometry
INTRODUCTION
Digital elevation models (DEMs) provide an opportunity to quantify land surface geometry in terms of elevation
and its derivatives. The basic geometric properties that characterize the terrain surface at a point are: (1) eleva-
tion; (2) properties of the gradient vector – its magnitude defining slope, and its direction angle defining terrain
aspect; (3) surface curvature, (4) convexity; and (5) surface-specific points and lines, i.e. local maxima (peaks),
minima (pits), saddle points (passes), inflection points, break-lines, ridge and valley lines. The relationship
between geometric point attributes and tectonic structures such as slope-breaks and fractures is often straight-
forward (Siegal and Gillespie, 1980; Drury, 1987; Prost, 1994; Salvi, 1995). Steep slopes of uniform aspect
over an area may be related to faulting. Linear valleys, ridgelines and slope-breaks are morphological features
commonly associated with faults (Prost, 1994). Complex structures, such as folds and curving fault lines, are
difficult to capture by geometric analysis.
In contrast to local geometric analysis, numerical geomorphology studies the statistical and spatial charac-
teristics and relationships of point attributes (Evans, 1972, 1980). Riley and Moore (1993) used elevation histo-
grams to capture and describe step and horizontal pediments in a mountain slope associated with normal faulting.
Relationships between point attributes are used to characterize the terrain further (Evans, 1980). In the present
tectonic geomorphology study, only the simplest relationships were investigated. The elevation-average slope
* Correspondence to: G. Jordan, Joint Research Centre of the European Commission, Institute for Environment and Sustainability, TP 280,I-21020, Ispra (VA), Italy. E-mail: [email protected]
808 G. JORDAN
Copyright © 2003 John Wiley & Sons, Ltd. Earth Surf. Process. Landforms 28, 807–822 (2003)
curve was considered for the study of slope conditions. Aspect-average slope curve and aspect-slope stereonet
were used for investigating if slopes in a given direction tend to be steeper.
By fitting a trend surface to the study area or its parts, the overall tilt due to tectonic activity can be studied
(Doornkamp, 1972; Fraser et al., 1995; Guth, 1997). Autocorrelation and spectral analysis methods can reveal
anisotropy and periodicity present in the DEM. Both features often result from tectonic control on terrain
morphology (Harrison and Lo, 1996). In addition to autocorrelation analysis, directional variogram analysis was
also applied to investigate patterns in the terrain studied.
The objective of this study is to investigate the use of numerical geomorphometric methods for tectonic
geomorphology through a case study. This paper presents geomorphometric analysis that combines numerical
differential geometry, digital drainage network analysis, digital image processing and statistical and geostatistical
analysis. Univariate and bivariate methods of general geomorphometry were complemented with texture (spatial)
analysis methods such as trend, autocorrelation, spectral and network analysis. A technique to generate artificial
DEMs using drainage lines in order to study anisotropy and periodicity is discussed. Detailed analysis of aspect
data for tectonic geomorphology is also presented.
STUDY AREA
The Káli Basin in Hungary is located in the southwestern part of the Balaton Upland in the Transdanubian
Range, which is a part of the north Pannonian Unit of the Carpatho-Pannonian region (Trunkó, 1995; Budai
et al., 1999). The study area encompasses a 14 km by 18 km rectangle on the northern side of Lake Balaton
(Figure 1). The southern border of the basin is formed by a series of hills made up by folded Permian red
sandstone (Figure 1A). Gentle slopes and shallow valleys are characteristic on the terrain of the fractured
resistant red sandstone. In the middle of the basin and in the east, gently folded Triassic carbonate sediment
series are exposed. The majority of the basin is filled by Tertiary clastic sediments, primarily sand. The basin
is bordered by Pliocene basaltic volcanic masses in the north and west. Pyroclastic and lava rocks constitute the
well-preserved volcanic edifices. The terrain is characterized by thick slope scree and valleys deeply incised in
Figure 1. (A) Geology of the study area. Fault lines and fold axes indicated in geological maps are shown. (B) Shaded relief model forthe Káli Basin. Arrow indicates illumination direction. Letters highlight specific features. See text for details

ANALYSIS AND INTERPRETATION OF DIGITAL TERRAIN DATA 809
Copyright © 2003 John Wiley & Sons, Ltd. Earth Surf. Process. Landforms 28, 807–822 (2003)
the loose tuff. Quaternary deposits consist of wetland sediments in the majority of the basin area, and slope-foot
scree, alluvial sediments and Pleistocene loess in valleys are characteristic of the area. An SE-verging reverse
fault in the north and folds in the south were formed during the Cretaceous (Figure 1A). Left-lateral strike slip
faulting was typical of the region during the Miocene. Extensional tectonics characterized the end of Tertiary
times. The area is seismically dormant in the present. Elevations in the study area range between 104 m and
474 m a.s.l., representing basin areas and the peaks of volcanic hills in the north respectively.
The DEM of the Káli Basin was obtained from the Hungarian Defence Mapping Agency 1 : 50 000-scale
DTM-50 digital grid terrain database. The DTM-50 elevation data was interpolated with a third-order spline
function from scanned and automatically vectorized contour lines of 10 m interval in Gauss–Krüger projection.
The elevation matrix was converted to a regular grid in the EOV (National Uniform Projection) projection. The
horizontal resolution of the grid is 50 × 50 m2 and the vertical resolution is 1 m. Elevations above sea level are
given as integers in metres.
METHODS
Terrain analysis for geomorphological surface characterization
For geomorphometric studies of landscape the five basic parameters calculated are elevation, slope, aspect,
profile and tangential curvatures according to Evans’ general geomorphometric method (Evans, 1972, 1980).
These basic geometric attributes were complemented with the automatic extraction of surface specific points and
ridge and valley lines in this study. Evans’ univariate and bivariate methodology was extended with texture
(spatial) analysis methods such as trend, autocorrelation, spectral and network analysis. In order to implement
the extended geomorphometric analysis, four major fields of terrain modelling were used in integration in this
paper: (1) numerical differential geometry; (2) digital drainage network analysis; (3) digital image processing
(histogram manipulations and spatial filtering); and (4) statistical and geostatistical analysis.
In the present investigation, analysis started with the calculation of frequency histograms of point attributes
and their moments, such as mean, range and standard deviation, over the whole area or its parts. Next in the
analysis, bivariate and multivariate relationships between variables (derivatives and moments) were studied.
Plotting average slope against aspect showed if steeper slopes tend to face in a certain direction. Also, slopes
and aspects were plotted in a stereonet to study if steep slopes are more frequent in a given direction. Steep
slopes with the same orientation can be associated with faulting. Average slope plotted against elevation was
used to identify flat planation surfaces. Finally, terrain texture was studied by means of spatial statistical methods
and network analysis techniques. Trend analysis, autocorrelation, and spectral analysis were carried out for the
whole area and for its elements (basins only, for example). Trend surfaces were fitted to all data points or to
surface specific points, such as peaks or valley lines, to estimate regional dip.
Autocorrelation and spectral analyses reveal lineation (anisotropy) and periodicity of landscape due to faulting
or folding. The autocorrelation property can also be studied by calculating semi-variograms in different direc-
tions (Curran, 1988). Problems emerge, in that valleys often curve and there are confluences downvalley, hence
ridge height and spacing vary (Evans, 1972). In order to overcome the problem of converging ridges of alter-
nating height, analysis was limited only to valley lines and the following method was applied. Valley lines were
defined by digital drainage network identification method using the TOPAZ modelling system (Garbrecht and
Martz, 1995). A binary image of the extracted channel network was used to create an artificial elevation model
of valleys. In order to increase signal width, channel lines were widened with mathematical morphology dila-
tation using a 3 × 3 structuring element (Gonzalez and Woods, 1993). Background pixels were assigned zero,
whereas channel pixels received a constant elevation value. In this way a DEM was obtained depicting a
horizontal plane with three-pixel-wide channel lines carved into it. The three-pixel-wide drainage lines were then
smoothed with a 3 × 3 average filter. This resulted in the widening of the deep canyons into valleys with
smoothly curving sides. The resulting valley network had uniform depth and this was used for analysis of
periodicity by means of autocorrelation, spectral and directional variogram analysis.
Digital image and terrain analysis usually uses image processing techniques applied to grey-scale images for
lineament extraction. This paper proposes the use of the more realistic digitally extracted ridge and valley lines

810 G. JORDAN
Copyright © 2003 John Wiley & Sons, Ltd. Earth Surf. Process. Landforms 28, 807–822 (2003)
with the application of spatial statistics to these networks. Digitally extracted drainage network, drainage channel
orientation, length and density were investigated.
Calculation, processing and display of geometric terrain attributes
The digital model of topography generated by interpolation can be regarded as a z = f (x, y) bivariate function,
and hence analysed by means of differential geometry (Moore et al., 1993). Introducing the following notation
(after Mitásová and Hofierka (1993) and assuming that the continuous second-order partial derivatives of the
function f exist:
fx = ∂z/∂x, fy = ∂z/∂y, fxx = ∂2z/∂x2, fyy = ∂2z/∂y2, fxy = ∂2z/∂x2
and
p = f 2x + f 2
y, q = p + 1
the magnitude of the gradient vector (∇f = grad( fx, fy)) is | grad | = ( f 2x + f 2
y)1/ 2 from which the steepest slope
angle is computed as
γ = arctan
p
and aspect is given by
α = 180° − arctan( fy/fx) + 90( fx/ | fx |)
where azimuth is in degrees and measured clockwise from north.
Profile curvature (curvature of normal plane section in gradient direction) is defined as
kp = ( fxx f 2x + 2fxy fx fy + fyy f 2
y)/p q3
and tangential curvature (measured in the normal plane in a direction perpendicular to the gradient) is given by
kt = ( fxx f 2y − 2fxy fx fy + fyy f 2
x)/p q
Profile curvature reflects the change in slope angle and was used to define slope-breaks for tectonic geomor-
phology interpretation. Tangential curvature is measured in a direction perpendicular to the gradient, and hence
reflects the change in aspect angle. Ridge and valley lines are often represented by high values of tangential
curvature.
For the purpose of topographic analysis, two different types of points on a surface are distinguished: regular
points, where the magnitude of gradient | grad | ≠ 0 ( fx ≠ 0 or fy ≠ 0) with only one direction of flow, and
singular points (peak, pit, or saddle point) where | grad | = 0 ( fx = 0 and fy = 0) with undefined direction of flow.
In this study, local maxima (peaks) were used for the analysis of regional tilt by means of trend fitting. Aspect
and curvatures were calculated only for regular points.
According to Evans (1972), the statistical properties of point attributes are more stable if the DEM is smoothed
before analysis. Guth (1995) also suggested smoothing in order to reduce noise and discrepancies between
various gradient methods. Since curvatures use second derivatives they are particularly sensitive to noise. Evans
(1980) noted the sensitivity of slope curvature to the scale of measurement. Based on these results, the original
DEM of the study area was smoothed prior to curvature calculations. Gradient calculation used the unweighted
eight-point numerical differentiation method (Prewitt operators) for its smoothing effect.
Histogram peaks were sliced and displayed as maps showing elevation, aspect and slope classes in dif-
ferent colours. The displayed areas of uniform geometric attributes were then examined for areal distribution,

ANALYSIS AND INTERPRETATION OF DIGITAL TERRAIN DATA 811
Copyright © 2003 John Wiley & Sons, Ltd. Earth Surf. Process. Landforms 28, 807–822 (2003)
continuity and shape. Aspect data was displayed as frequency histograms and rose diagrams (Wells, 1999;
Baas, 2000). Aspect distribution plots were visually examined for high frequencies in preferred orientations.
Areas with slopes less than 1° have been excluded from most of the statistical analysis.
RESULTS: UNIVARIATE DATA ANALYSIS
Elevation
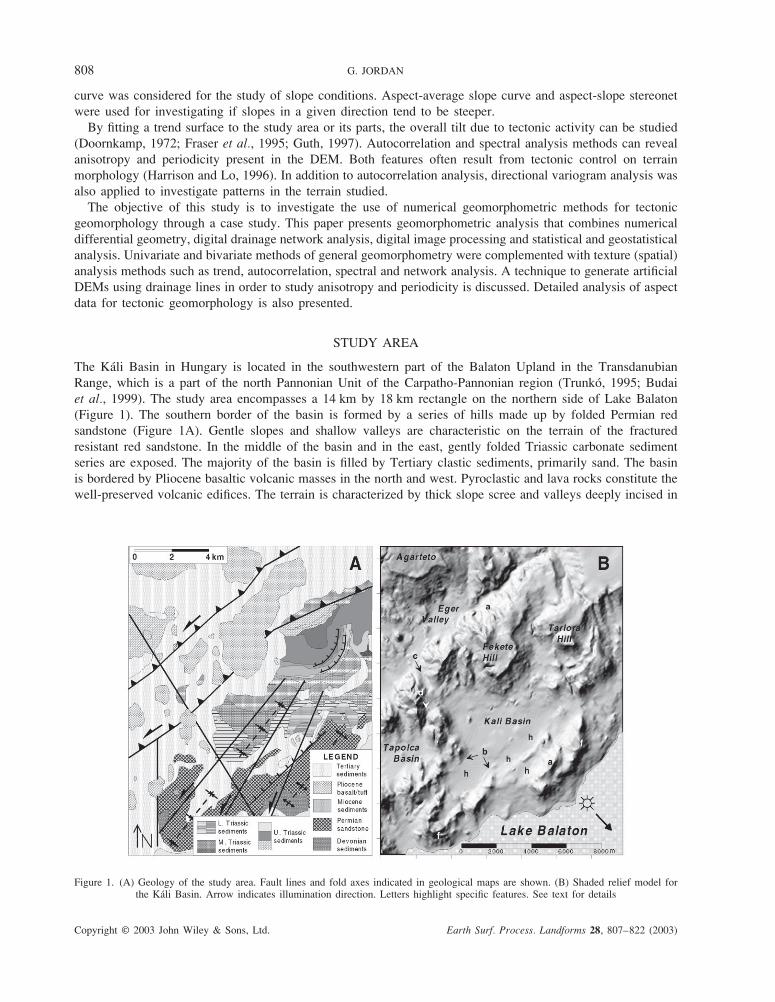
The histogram of grid elevations in Figure 2C shows that elevations in the study area range between 104 m
and 474 m a.s.l. The average elevation of the study area is 215 m a.s.l. Systematic error in the DEM is shown
as spikes corresponding to the original contour lines at 10 m intervals. The large peak at 105 m represents the
flat area of Lake Balaton in the south. The lake area was excluded from further analysis because it influences
calculations, such as average elevation, slope and trend analysis. There are relatively large frequencies of
elevation between 130 and 190 m, between 310 and 320 m, and between 360 and 370 m. Display of correspond-
ing elevation pixels as three classes shows that the first interval corresponds to the plain of the Káli Basin (also
those of the Eger Valley and Tapolca Basin) and the other two intervals correspond to the plateaux of the Fekete
Hill and Agarteto respectively (Figure 2A; compare with Figure 1B). When elevation pixels are displayed as a
grey-scale image it can be seen that basin areas are characterized by increasing elevations from SW to NE
(Figure 2A). A similar increase in hill-top elevations is apparent in the same map. Elevations of saddle points
along the watershed divide of the Káli Basin also increase to the NE. This shows that the area is tilted towards
the SW (Figure 2A).
The cumulative percentage area-elevation curve (‘hypsometric curve’) shows a rapid increase up to 140 m
a.s.l. due to flat basin areas followed by a slower rise, providing a means of defining lowland ‘basin areas’
morphometrically (Figure 2C). The lowlands thus delineated (below 140 m) cover 16% of the land area.
Slope
The cumulative percentage area-slope curve shows that in 38% of the area the slope is less than 3°, of which
about half is less steep than 1°, each value being represented by a break point in the curve (Figure 2D). On this
basis areas were classified as plain, hilly and mountainous, where the slopes are ≤1°, 1–3° and >3° respectively.
The classified slope map displays that the steepest slopes are found around the tops of volcanic edifices and
around hill crests in general (Figure 2B). Note the sharp edges of the Káli Basin in the south and west. The
straight NE–SW linear boundary of the Eger Valley is also apparent. Slightly converging linear features cross-
cutting the basin from NE to SW are clearly seen in the classified slope map.
Aspect
Aspect data displayed as a grey-scale image resemble the shaded relief map, but aspect information is
independent of illumination parameters and, therefore, accurately locates valley lines, slope breaks and ridges.
The main features are the broad NW-oriented slopes in volcanic terrain in the north and on the Permian red
sandstone in the south (a in Figures 3A and 1B). Both of the NE–SW-striking ranges have less uniform aspects
on their opposite sides. Lineaments intersecting the whole basin in the same direction are also revealed by the
aspect image (b in Figures 3A and 1B). Hill slopes facing the east are most apparent along the western border
of the basin. In accordance with the histogram analysis of aspect data, NW–SE- and N–S-striking valleys (c and
d respectively in Figures 3A and 1B) are asymmetric, having larger sides uniformly facing in the easterly
direction (areas characterized by similar tone in Figure 3A), whereas the opposing sides are irregular in aspect.
Gently curved slopes of southern Permian folds are recognized by a gradual grey level change in this area
(f in Figures 3A and 1B). A few closed depressions and asymmetric depressions open to the SW are discernible
in the basin area (h in Figures 3A and 1B).
Systematic errors, shown as peaks in the histogram at factors of 45° azimuth, are due to numerical derivation
over a rectangular grid (Figure 3C). In order to improve interpretation by removing spurious peaks, the curve
was smoothed with a five-point median filter. The rose diagram discussed below is based on frequencies
smoothed in this way.
812 G. JORDAN
Copyright © 2003 John Wiley & Sons, Ltd. Earth Surf. Process. Landforms 28, 807–822 (2003)
Figure 2. (A) Classified grey-scale elevation image. Arrows show saddle points on watershed divide. Scale to the right shows grey-levelclasses of elevations in metres a.s.l. (B) Classified slope map. Slope angles according to shading, light: ≤1°; medium dark: 1–3°; mediumlight: 3–10°; dark: >10°. Lines emphasize linear slope-breaks. (C) Light curve: elevation histogram; heavy curve: cumulative percentagearea curve of elevation (‘hypsometric curve’). (D) Cumulative percentage area curve of slope. This figure is available in colour online at
http://www.interscience.wiley.com/journal/espl
The aspect frequency diagram has local maxima at 120° and 300° azimuths. The 180° separation suggests that
these are either opposing sides of major hills or facing sides of valleys striking roughly in the NNE–SSW
direction. The rose diagram, calculated only for hilly areas with slopes more than 1° (Figure 3D), also displays
two major directions: one facing SE (120°) with the highest frequencies, and the other pointing exactly in the
opposite direction (300°) with lower frequencies but much less dispersion. The diagram is strongly asymmetric
in the perpendicular direction, having higher frequencies and dispersion to the SSW than to the NNE. The
pronounced lack of land facets facing N and S shows that E–W-oriented morphological features are not char-
acteristic of the area (compare with Figures 1B and 7A).
The areal distribution of high-frequency aspect directions was studied by colour-shaded display. In addition
to the major NW and SE directions, the ENE, E and, to a lesser extent, the SW directions form larger continuous
patches. Based on the rose diagram (Figure 3D), aspects were divided into two classes, between 110 and 160°
and between 290 and 340°. The sliced aspect image was blurred by ‘pepper–salt’ noise pixels. In order to
increase tectonic geomorphological interpretability of the classified aspect image, isolated islands of pixels and
discontinuities were removed by means of an 11 × 11 pixel majority filter. Displaying the results shows that the
two aspect frequency peaks correspond to the flanks of the northern and southern hill ranges running in the NE–
SW direction (Figure 3B). Related areas are elongated and limited by sharp linear edges. Slopes of uniform

ANALYSIS AND INTERPRETATION OF DIGITAL TERRAIN DATA 813
Copyright © 2003 John Wiley & Sons, Ltd. Earth Surf. Process. Landforms 28, 807–822 (2003)
Figure 3. (A) Grey-scale aspect image of the Káli Basin. Letters highlight specific features. See text for details. (B) Classified aspect imageafter 11 × 11 majority filtering. Dark and light shaded areas have aspects between 290 and 340° and between 110 and 160° respectively.Lines are drawn to highlight edges of hill slopes. Solid lines: NE–SW direction; dashed lines: N–S direction; dotted lines: NW–SE direction.Solid arrows show location of triangular slope facets (highlighted by dashed lines); 20 m elevation contours are also shown. (C) Histogramof aspects for slopes >1°. Solid line is the five-term median smooth of diagram. (D) Rose diagram for the smoothed aspect frequencies. (E)Simple shear model for the basin. PDZ: principle displacement zone; R: synthetic Riedel shears; R′: antitethic Riedel shears; N: normalfaults; P: secondary synthetic shears; short black arrows: shortening axis. See text for details. This figure is available in colour online at
http://www.interscience.wiley.com/journal/espl
aspect often have N–S and NW–SE edges, irrespective of lithology. Triangular land facets are seen on the
opposing sides of Eger Valley.
The morphometric results obtained so far are in concert with geological observations (Figure 1A; Budai
et al., 1999) and with the left-lateral simple shear tectonic model developed for the area (Figure 3E; Dudko,
1997). The NE–SW-running linear features are parallel to the principal displacement zone. Other directions of
the model coincide with the observed N–S- and NW–SE-running linear features. The tectonic origin of these
features is further supported by evidence provided by more complex analyses presented below.
Curvatures
The tangential curvature map shows valleys and ridges as white and black lines, corresponding to positive and
negative values respectively (Figure 4A). The major NE–SW, NW–SE and N–S directions can be seen clearly.
The valley network is incomplete and disconnected, in contrast to the network identified by digital drainage
analysis (see below). Ridgelines are also discontinuous. This is because not all valleys and ridges are charac-
terized by sharp edges (high absolute curvature values).

814 G. JORDAN
Copyright © 2003 John Wiley & Sons, Ltd. Earth Surf. Process. Landforms 28, 807–822 (2003)
Figure 4. Curvature images after smoothing the DEM twice with 3 × 3 moving average kernel. White and black represent positive andnegative values respectively. Black patches in the middle of the basin are flat areas with undefined curvature. (A) Tangential curvatures.Black lines are ridges and white lines are valleys. (B) Profile curvatures. Slope-breaks are represented by light or dark lines. Arrows
emphasize slope-breaks along and within the Káli Basin
Profile curvatures also locate larger valleys and hill crests (Figure 4B). Since profile curvature is the second
derivative in the gradient direction it identifies slope-breaks. Note the NE–SW-running slope-breaks at basin
margins in the figure. Circular features are identical to volcanic forms. Some waviness observable on hill slopes
is due to differentiation over a contour-based DEM. Original contour lines were overlayed to check spurious
linear features on hill slopes due to differentiation over a contour-based DEM.
RESULTS: BIVARIATE DATA ANALYSIS
Plotting average slope against elevation displays peaks at factors of 10 m and pits in between (Figure 5A).
Coherent with the elevation histogram analysis, the DEM is characterized by flats around original contours and
steep slopes between, yielding the wavy patterns observed in the derivative maps (see Figure 4B). The graph
is evaluated by slicing the curve into elevation classes between local minima and maxima, and displaying
corresponding areas with different colours. Slopes begin to increase at 140 m a.s.l. above the flat basin areas.
These areas correspond to volcanic hills surrounding the Káli Basin. The following decreases and increases are
related to the large slope screes and basaltic steps of the large mass of Fekete Hill. Note that slopes increase
faster with elevation on Fekete Hill than on the other volcanoes. The minimum at 370 m after a decreasing limb
is due to the plateau on Fekete Hill (see Figure 1B). The rest of the curve describes slope conditions in volcanic
terrain to the north of the Eger Valley.
The plot of average slope against aspect for hilly areas (slope >1°) shows that slopes in the NW direction tend
to be steeper than the average (Figure 5B). Slopes facing east and west tend to be less steep, on the other hand.
Peaks at 50° and 230° (NE and SW directions respectively) show that the corresponding slopes are also steeper.
The lowest slopes face north or south. These minima with larger scatter show that E–W-oriented morphological
features are not characteristic to the area. The peak covering orientations from 230 to 270° has a larger scatter.
These orientations correspond to directions found in aspect frequency analysis. Large spikes at factors of 45°
are errors of numerical differentiation over a rectangular grid.

ANALYSIS AND INTERPRETATION OF DIGITAL TERRAIN DATA 815
Copyright © 2003 John Wiley & Sons, Ltd. Earth Surf. Process. Landforms 28, 807–822 (2003)
Figure 5. Bivariate analysis. (A) Average slope versus elevation curve. Solid line: 11-term moving median smooth. (B) Average slopeversus aspect. Solid line: 15-term moving median smooth. Calculation includes pixels with slope >1° only. (C) Slope gradient vectorsplotted on lower hemisphere Schmidt (equal area) stereonet. Gradients with slope >1° are included only. Grey-scale and contours show
point densities. This figure is available in colour online at http://www.interscience.wiley.com/journal/espl
elevation a.s.l. (m)
aver
age
slo
pe
in d
egre
ea
vera
ge s
lope
in d
egr
ee
aspect
A
B
C
14 0 37 0
N WSEE WS N
23 0 27 0N
50
10
5
0
N
S

816 G. JORDAN
Copyright © 2003 John Wiley & Sons, Ltd. Earth Surf. Process. Landforms 28, 807–822 (2003)
Figure 6. Autocorrelation analysis. Contour lines and grey scales show correlation values. Positive values are emphasized with darker tones.R = 0·3 and r = 0·4 contour lines are outlined with white. White arrow indicates NE–SW anisotropy direction. (A) Autocorrelation for thewhole study area. Black arrow shows secondary anisotropy direction. Dashed black arrow indicates periodicity. (B) Autocorrelogram forthe study area with terrain excluded to the north of the Eger Valley. Black arrow shows secondary anisotropy direction. (C) Correlogramfor the DEM with the cumulative exclusion of the Tarlora Hill. (D) Correlogram for the DEM with the additional exclusion of the Fekete
Hill. See text for details. This figure is available in colour online at http://www.interscience.wiley.com/journal/espl

ANALYSIS AND INTERPRETATION OF DIGITAL TERRAIN DATA 817
Copyright © 2003 John Wiley & Sons, Ltd. Earth Surf. Process. Landforms 28, 807–822 (2003)
Another way of studying if slopes tend to be steeper in certain directions is to plot aspect and slope on a
stereonet. In this study, the slope vectors for each pixel were plotted instead of poles of corresponding land facet
planes. Whereas the latter resulted in an indistinguishable patch of points in the middle of the stereonet plot (e.g.
compare with Guth (1995)), the graph thus obtained was more appropriate for the analysis of a large number
of planes with gentle dip, because points were scattered around the perimeter of the strereonet circle. Figure 5C
shows that higher densities of gradients are found in the NW and SE directions, NE and SW directions and the
E and W directions. Scatter is higher in the southerly directions. This was found with the rose diagram analysis
of aspect data. More interesting is that the steepest slopes are associated with hill slopes in the NW and SE
directions. The other major orientations are also associated with steeper slopes. Together with the aspect-average
slope plot, it can be deduced that the NW–SE, E–W and NE–SW directions not only represent higher frequencies
of aspect orientations (see Figure 3D) but are also associated with greater slopes.
RESULTS: TEXTURE ANALYSIS AND SPATIAL STATISTICS
Trend analysis
A gentle SSW-oriented dip is found by the least-squares fit of a trend plane to local maxima (peaks). An over-
all dip of about 1° to the SW is apparent if the trend plane is fitted to the Káli Basin area (below 140 m a.s.l. and
defined by slope ≤1%). If all three basins (Káli Basin, Tapolca Basin and Eger Valley) are used then the same
dip is obtained. A similar result is yielded by the trend fit to larger drainage lines (upstream area >60 ha) (compare
with Figure 7A). The orientation thus obtained is consistent with the SW tilt found in elevation analysis.
Autocorrelation and spectral analysis
Autocorrelation analysis was performed after extraction of a linear trend and subsequent 5 × 5 average smooth-
ing of the DEM, in order to study lineation (anisotropy) and periodicity possibly due to faulting or folding. The
autocorrelogram in Figure 6A shows a strong NE–SW anisotropy caused by the northern and southern hill
ranges. Periodicity to the NW disappears from the correlogram after the removal of Agarteto from the DEM
(Figure 6B). An interesting feature is the shift of autocorrelation anisotropy orientation to the ENE at greater
distances and lower correlations. This is due to the similarity of the Tarlora Hill and Fekete Hill. The cumulative
exclusion of the Tarlora Hill from the scene resulted in a purely NE–SW orientation (Figure 6C). Finally, the
role of the large elongated volcanic mass of the Fekete Hill in the correlation anisotropy was checked. When
Fekete Hill was additionally removed from the DEM the correlations decreased, but the characteristic NE–SW
anisotropy remained (Figure 6D).
Network analysis
Drainage segment orientations are shown in the rose diagram in Figure 7B. Orientations were calculated after
vectorization of channels and smoothing the vector network with ‘tunnelling’. The three major orientations in
the NE–SW, N–S and NW–SE directions are consistent with previous findings. The E–W petal is an error caused
by drainage extraction from a rectangular grid. The NW–SE petal is the longest, although individual valley lines
are shorter than in the other two directions. This shows that NW–SE valleys are shorter but more frequent
(Figure 7A). Note the long and straight line of the Eger Valley highlighted in the figure. Low scatter of segments
around these directions implies that related valley lines are well defined. The N–S direction is represented by
a large petal with little scatter. Although valley lines in this direction are long and well defined, they are most
frequent in the western part of the study area.
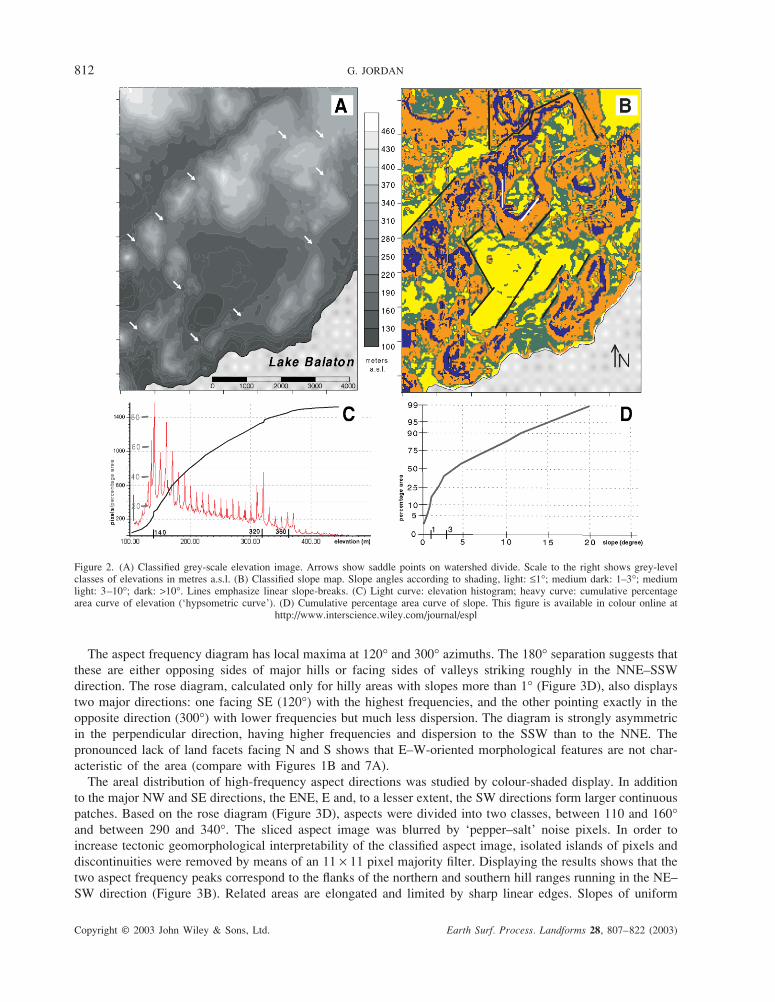
In order to study periodicity and anisotropy in morphology due to tectonic activity, autocorrelation was
calculated to the valley lines only. In this way, the effect of converging ridges of alternating heights was
removed. Although correlation values are very low, in Figure 8A the NE–SW anisotropy is clear. This shows
that this is a fundamental direction for valleys as well, and the longest valleys have NE–SW orientation (com-
pare with Figure 7A). A periodicity caused by two prominent features is clear in the E–W direction. The shape
of the patches suggests that it is due to the similarity of the two major NE–SW-running channels and tributaries
in the basin area.

818 G. JORDAN
Copyright © 2003 John Wiley & Sons, Ltd. Earth Surf. Process. Landforms 28, 807–822 (2003)
Figure 7. (A) Watershed boundary of the Káli Basin (dark polygon) and valley lines for the study area defined by digital drainage extractionand catchment identification method. Valley line for the Eger Valley is highlighted (heavy grey line); 20 m elevation contour lines are also
overlain. (B) Rose diagram for vectorized channel segments with length >300 m
The periodogram of the channel network (Figure 8C) reveals that the large-scale elements are by far the
most important, since the spectrum declines rapidly as scale decreases. Furthermore, the large-scale valleys have
a clear orientation in the NE–SW direction (at right angles to the major axes of elliptical curves).
Variograms in the E–W, NE–SW and NW–SE directions were constructed for the drainage network (Figure 8B).
All three variograms are similar, having steep initial limbs and then undulating about a constant value. The large
nugget effect is due to channel separation being larger than channel width. All of them show periodicity, but
it is most pronounced for the E–W variogram. It is clear that the N–S-running valleys are periodic with about
3000 m separation on average (Figure 8B). For comparison, this type of pattern is absent from the variograms
constructed for the original elevation model (Figure 8D).
DISCUSSION
Directional analysis of the drainage network and inspection of shaded relief and aspect images show that
three major orientations characterize the morphology of the study area: (1) NE–SW; (2) NW–SE; (3) N–S. These
are parallel to the known tectonic lineaments of the area (Figure 1A). Valleys of NE–SW orientation are the
most prominent, as shown by autocorrelation and spectral analysis of the channel network. The large areas with
ANALYSIS AND INTERPRETATION OF DIGITAL TERRAIN DATA 819
Copyright © 2003 John Wiley & Sons, Ltd. Earth Surf. Process. Landforms 28, 807–822 (2003)
Figure 8. Pattern analysis of channel network. (A) Autocorrelogram of drainage network. (B) Variograms of the channel network in theE–W, NE–SW and NW–SE directions shown by dotted line, light and dark grey lines respectively. Arrows and figures indicate periodicityin the E–W direction. (C) Periodogram of the channel network. (D) Variograms in the E–W, NE–SW and NW–SE directions for the original
DEM. Key is the same as for (B)

820 G. JORDAN
Copyright © 2003 John Wiley & Sons, Ltd. Earth Surf. Process. Landforms 28, 807–822 (2003)
NW–SE-facing slopes and related triangular facets along these lineaments are consistent with the geological
map (Figure 1A) and show that the Káli Basin is bounded by NE–SW-oriented strike-slip faults parallel to its
watershed boundaries in the north. Smaller shear zones run across the basin area in the same direction (Figures 1A,
2B, 4B and 7A). The structural origin of these morphological features is supported by related slopes also tending
to be the steepest ones, as shown by the stereonet and aspect-average slope plots. Longer slope-breaks in the
same direction are also widespread in the whole area, as seen in the profile curvature and the classified slope
map. Autocorrelation analysis for the whole area has shown that structures in this direction have the greatest
impact on the morphology and cause an overall anisotropy with NE–SW lineation.
Another set of faults is N–S oriented, along valleys with one major side facing to the east (see Figures 1A
and B, 3A and 7A). This set is most apparent along the western basin border. Based on morphological evidence
and tectonic considerations, they can be interpreted as extentional faults. A third set of faults crosses the whole
area in NW–SE orientation (Figures 1A, 3B and 7A). Associated valley sides are relatively sharp edged. They
correspond to aspect rose diagram petals in the ENE and opposite directions. The tectonic origin of these
features is supported by slopes associated with both sets tending to be steeper on average, as shown by the
stereonet and aspect-average slope plots. They also run across various lithologies and they are parallel to known
tectonic lineaments (Figure 1A). Further evidence for tectonic origin for the N–S valleys is their periodicity, as
shown by the directional variograms. The three major directions found in the Káli Basin are also present in
regional-scale geological maps and DEM.
The major NE–SW strike-slip faults are well known from geological studies (Budai et al., 1999). The Káli
Basin was pre-formed by Cretaceous compressional tectonics, resulting in reverse faults and folds (Figure 1A).
The basin was further shaped by left-lateral strike-slip faults in a stress field with an N–S oriented shortening
axis during the Miocene (Dudko, 1997). The simple shear model (Wilcox et al., 1973; Reading, 1980; Ramsay
and Huber, 1987; Twiss and Moores, 1992) with left-lateral shear sense can account for the three structural
orientations found in aspect and texture analysis (Figure 3E). The sense of these faults inferred by our morpho-
logical study is also consistent with this model. Accordingly, large NW–SE-facing large slopes in the north and
south are parallel to the principal displacement zone (PDZ), N–S-running valleys follow extentional faults and
NW–SE-running slope edges correspond to antithetic shears. Lineaments cross-cutting the basin are synthetic
shears according to the model. The left-lateral sense of these shear zones has also been recognized by Dudko
(1999). Permian folds are not related to this stress field and are the result of Cretaceous compressional tectonic
events (Budai et al., 1999). Trend analysis, together with the inspection of elevation and drainage data, shows
that the whole area is gently tilted to the SW.
We can also conclude on the applicability of various morphometric methods for tectonic geomorphology.
Although detailed lineament analysis was not aimed for in this study, the analysis of the digitally extracted drainage
network has proved to be an efficient tool for extraction of morphological lineaments associated with valleys
and ridges. The advantage of this approach over traditional lineament extraction methods is that identified
lineaments are directly related to the geometry and physics of the terrain and are independent of manipulations
on grey scales of images. The extracted network is fully continuous and the identified ‘lineament’ network reflects
the true nature of related valleys, their spatial distribution, density and intersections. For these reasons, digital
drainage network extraction methods were found superior to lineament extraction methods using grey-scale images
of (shaded) elevation models, aspect, slope and curvature maps in this study. Slope-breaks, however, cannot be
identified by this method, and profile curvatures, together with slope maps, were used for their spatial analysis.
Aspect analysis was a powerful technique to identify slopes of uniform aspect with linear edges in this study.
Visual inspection of shaded relief models, together with grey-scale elevation and classified slope images, was
the most efficient for the tectonic geomorphological investigation of complex features such as folds and circular
volcanic structures. Bivariate plots of elevation and average slope provided the means of finding flat basin areas
and plateaux.
The tangential curvature map did not bring additional information to valley and ridgeline extraction by digital
drainage analysis methods. However, if we assume that valley and ridgelines of tectonic origin tend to be
sharper, extracted drainage features can be classified by the curvature properties along them. Faults are related
not only to valleys and ridges but also to slope-breaks. Local maxima or minima of the second derivatives in
the gradient direction identified slope-breaks as large values in the profile curvature map.
ANALYSIS AND INTERPRETATION OF DIGITAL TERRAIN DATA 821
Copyright © 2003 John Wiley & Sons, Ltd. Earth Surf. Process. Landforms 28, 807–822 (2003)
Regional tilt studied by trend analysis was easier to interpret in the light of prior lineament analysis. Since
trend surface fitting used least-squares it was biased by a few large or extreme features, such as volcanic edifices.
This bias was reduced by fitting to surface-specific points, such as local maxima (peaks) or drainage lines. A
plane fitted to basin areas with gentle slopes proved to be the most revealing. Autocorrelations were also biased
by a few larger morphological features, such as volcanic masses. Bias was reduced by applying the technique
to valley lines only. The two-dimensional autocorrelogram provided a measure of anisotropy due to tectonics.
Variogram analysis also proved to be more efficient when applied to the extracted channel network. The tectonic
origin of valleys was supported by the periodic variogram and by the fact that associated valleys cross-cut all
rock types irrespective of lithology and bedding. Fourier analysis performed on the digitally extracted drainage
network also provided a measure of anisotropy on different scales.
CONCLUSIONS
In this paper, morphometric methods were applied to the tectonic geomorphological analysis of a study area
covering a small watershed. The methods applied were based on the morphometric system of Evans (1972,
1980). This uses differential geometry to describe geometric properties of the digital elevation surface. The
advantages of this approach are that it has a strict mathematical basis, it is directly related to the physical
processes of mass movement on the surface, and is relatively simple. Evans’ system was extended in this study
by automatic extraction of surface-specific points and ridge and valley lines, and with terrain texture analysis.
Morphometric study was implemented with the combined use of numerical differential geometry, digital drain-
age network analysis, digital image processing, and statistical and geostatistical analysis.
Analysis proceeded from simple univariate analysis of elevation and its derivatives to the more complex
bivariate analyses, spatial statistics and pattern analysis. Various methods were applied to the tectonic
geomorphological investigation of the Káli Basin, and some were found more informative than others. For
example, the ‘hypsometric curve’, elevation-average slope curve and curvature maps yielded little additional
information on morphotectonics in the present study. Grey-scale images were intensively used for visual inter-
pretation, but spatial filtering was restricted only to original geometric point attributes in this approach.
Hydrological channel network analysis proved to be a fundamental tool for the tectonic geomorphological
investigation of the Káli Basin. It yielded a fully continuous valley and ridgeline network and hence provided
a more realistic basis for the extraction and pattern analysis of lineaments than traditional image processing
techniques. Since the network is based on hydrological properties the model can be controlled by parameters
related to the physical properties of the erosion surface. Fourier, autocorrelation, and variogram analysis per-
formed only on the channel network seems more efficient than applying them for the original DEM.
Digital tectonic geomorphological analysis showed that the predominant NE–SW-verging hill ranges are
associated with regional strike-slip faults, whereas hill slopes along N–S- and NW–SE-oriented valleys have
primarily extentional and strike-slip sense respectively. A simple shear model with PDZ with NE–SW orienta-
tion can account for most of the morphotectonic features found in the Káli Basin by geological and digital
tectonic geomorphology analyses.
ACKNOWLEDGEMENTS
This research has been carried out with the help of scholarships from the Swedish Institute and The Soros
Foundation. Their assistance is gratefully acknowledged. I thank Emöke Jocháné Edelényi, István Horváth and
György Tóth at the Hungarian Geological Survey for providing facilities for the preparation of this paper. The
help of Gábor Csillag with data acquisition and morphological interpretation is appreciated. The comments of
two anonymous reviewers helped to improve the manuscript.
REFERENCES
Baas JH. 2000. EZ-ROSE: a computer program for equal-area circular histograms and statistical analysis of two-dimensional vectorial data.Computers and Geosciences 26: 153–166.
822 G. JORDAN
Copyright © 2003 John Wiley & Sons, Ltd. Earth Surf. Process. Landforms 28, 807–822 (2003)
Budai T, Csaszar G, Csillag G, Dudko A, Koloszar L, Majoros G (eds). 1999. Geology of the Balaton Highland. Vol. 197 of the OccasionalPapers of the Geological Institute of Hungary. Geological Institute of Hungary: Budapest (in Hungarian and English).
Curran PJ. 1988. The semivariogram in remote sensing: an introduction. Remote Sensing of Environment 24: 493–507.Doornkamp JC. 1972. Trend-surface analysis of planation surfaces, with an East African case study. In Spatial Analysis in Geomorphology,
Chorley RJ (ed.). Methuen: London; 247–281.Drury SA. 1987. Image Interpretation in Geology. Allen and Unwin: London.Dudko A. 1997. Structural Geology of the Balaton Highlands. Field Guide. Manuscript. Geological Institute of Hungary: Budapest (in
Hungarian).Dudko A. 1999. Structural geology of the Balaton Highland. In Geology of the Balaton Highland, Budai T, Csaszar G, Csillag G, Dudko
A, Kolosszar L, Majoros G (eds). Vol. 197 of the Occasional Papers of the Geological Institute of Hungary. Geological Institute ofHungary: Budapest; 133–144, 225–235 (in Hungarian and English summary).
Evans IS. 1972. General geomorphometry, derivatives of altitude, and descriptive statistics. In Spatial Analysis in Geomorphology, ChorleyRJ (ed.). Methuen: London; 17–90.
Evans IS. 1980. An integrated system for terrain analysis for slope mapping. Zeitschrift für Geomorphologie 36: 274–295.Fraser AJ, Huggins P, Cleverley P, Rees JL. 1995. A satellite remote-sensing technique for geological horizon structure mapping. In SEG
Annual Meeting, Expanded Technical Program Abstracts with Biographies 65. Society of Exploration Geophysicists: Tulsa, OK, USA;134–137.
Garbrecht J, Martz LW. 1995. Agricultural Research Service Publication NAWQL 95-3. In TOPAZ: An Automated Digital Landscape
Analysis Tool For Topographic Evaluation, Drainage Identification, Watershed Segmentation and Subcatchment Parameterisation: TOPAZ
User Manual. Rep: #95-1 Grazinglands Research Laboratory, USDA, Agricultural Research Service, EI Reno, Oklahoma.Gonzalez RC, Woods RE. 1993. Digital Image Processing. Addison-Wesley Publishing Company: New York.Guth PL. 1995. Slope and aspect calculations on gridded digital elevation models: examples from a geomorphometric toolbox for personal
computers. Zeitschrift für Geomorphologie Neue Folge, Supplementband 101: 31–52.Guth PL, 1997. Tectonic geomorphology of the White Mountains, eastern California. In Geological Society of America, 1997 Annual
Meeting, Abstracts with Programs. 29. Geological Society of America (GSA): Boulder, CO, USA; 235.Harrison JM, Lo C. 1996. PC-based two-dimensional discrete Fourier transform programs for terrain analysis. Computers and Geosciences
22: 419–424.Mitásová H, Hofierka J. 1993. Interpolation by regularised spline with tension: II. Application to terrain modelling and surface geometry
analysis. Mathematical Geology 25: 655–657.Moore ID, Lewis A, Gallant JC. 1993. Terrain attributes: estimation methods and scale effects. In Modelling Change in Environmental
Systems, Jakeman AJ, Beek MJ, McAleer MJ (eds). John Wiley and Sons: London.Prost GL. 1994. Remote Sensing for Geologists. A Guide to Image Interpretation. Gordon and Breach Science Publishers: Amsterdam.Ramsay JG, Huber MI. 1987. The Techniques of Modern Structural Geology. Vol. 2. Folds and Fractures. Academic Press: London.Reading HG. 1980. Characteristics and recognition of strike-slip fault systems. Spec. Publ. Int. Ass. Sediment 4: 7–26.Riley C, Moore McM. 1993. Digital elevation modelling in a study of the neotectonic geomorphology of the Sierra Nevada, southern Spain.
Zeitschrift für Geomorphologie, Supplement Band 94: 25–39.Salvi S. 1995. Analysis and interpretation of Landsat synthetic stereo pair for the detection of active fault zones in the Abruzzi Region
(central Italy). Remote Sensing of Environment 53: 153–163.Siegal BS, Gillespie AR. 1980. Remote Sensing in Geology. John Wiley and Sons: New York.Trunkó L. 1995. Geology of Hungary. Gebruder Borntraeger: Berlin.Twiss JR, Moores EM. 1992. Structural Geology. W. H. Freeman and Company: New York.Wells NA. 1999. ASTRA.BAS: a program in QuickBasic 4·5 for exploiting rose diagrams, circular histograms and some alternatives.
Computers and Geosciences 25: 641–654.Wilcox RE, Garding TP, Seely DR. 1973. Basic wrench tectonics. American Association of Petroleum Geologists Bulletin 57: 74–96.