Morphology of seismically slow lower-mantle structures ... · Morphology of seismically slow...
10
submitted to Geophys. J. Int. Morphology of seismically slow lower-mantle structures – Supporting Information Sanne Cottaar 1 and Vedran Lekic 2 1 University of Cambridge, Cambridge, United Kingdom, [email protected] 2 Department of Geology, University of Maryland, College Park, United States – Cross sections through P wave vote map Supplementary Figures S1, S2 and S3 present clustering results for the P wave tomographic models and can be directly compared to their S wave equivalents in Figures S4, S5 and S6. – Velocity variations within clusters The high degree of inter-model agreement shown in the vote maps and cross sections may be misinterpreted to suggest V S (or V P ) uniformity within the clusters. In fact, velocities vary within the fast and slow families, across different anomalies, and with depth in the mantle. To give the reader a sense of these variations, we plot contours for m=4 on top of the mean velocities across the five S wave tomographic models used here and mask out regions with disagreement across votes ( Figures S4, S5 and S6). – Additional 3D projections Additional projections of the contours in the vote map without annotations are shown in Figure S7 and in the supplementary videos. The supplied videos show isosurfaces of the clustering results (vote counts) for V S models. Surface topography is projected on the core-mantle boundary for reference.
Transcript of Morphology of seismically slow lower-mantle structures ... · Morphology of seismically slow...

submitted to Geophys. J. Int.
Morphology of seismically slow lower-mantle structures –
Supporting Information
Sanne Cottaar1 and Vedran Lekic2
1 University of Cambridge, Cambridge, United Kingdom, [email protected]
2 Department of Geology, University of Maryland, College Park, United States
– Cross sections through P wave vote map
Supplementary Figures S1, S2 and S3 present clustering results for the P wave tomographic models
and can be directly compared to their S wave equivalents in Figures S4, S5 and S6.
– Velocity variations within clusters
The high degree of inter-model agreement shown in the vote maps and cross sections may be
misinterpreted to suggest VS (or VP ) uniformity within the clusters. In fact, velocities vary within
the fast and slow families, across different anomalies, and with depth in the mantle. To give the
reader a sense of these variations, we plot contours for m=4 on top of the mean velocities across
the five S wave tomographic models used here and mask out regions with disagreement across
votes ( Figures S4, S5 and S6).
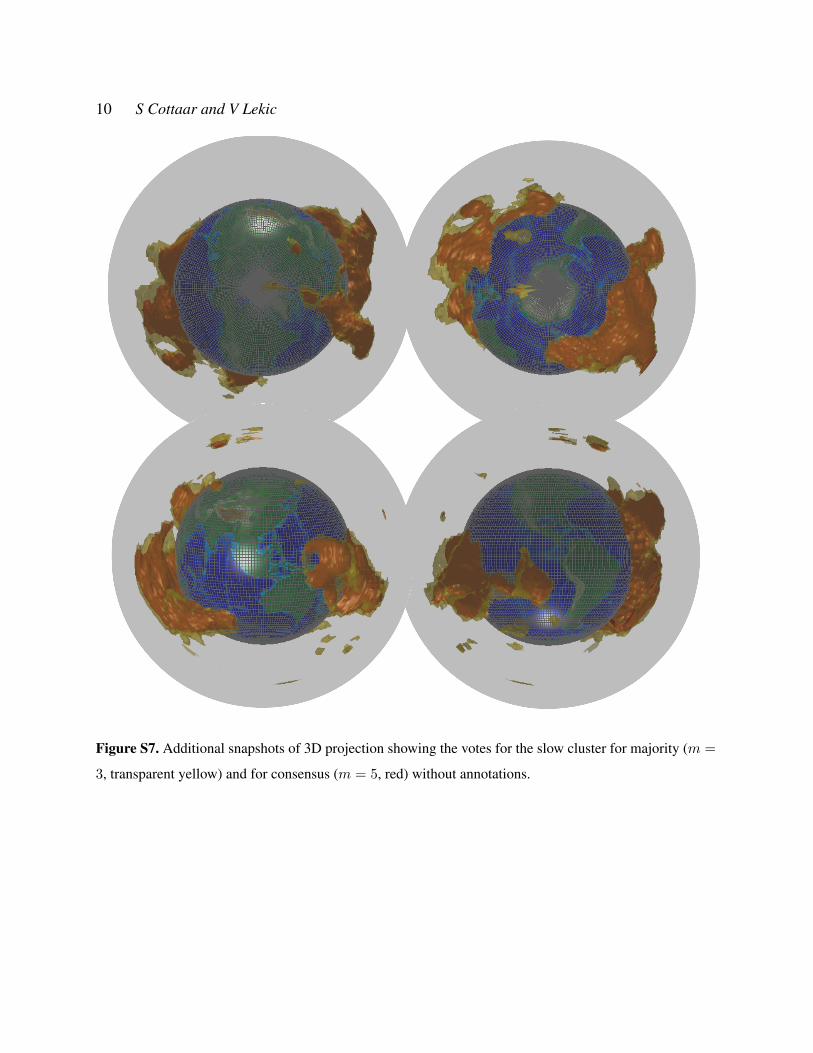
– Additional 3D projections
Additional projections of the contours in the vote map without annotations are shown in Figure S7
and in the supplementary videos. The supplied videos show isosurfaces of the clustering results
(vote counts) for VS models. Surface topography is projected on the core-mantle boundary for
reference.
2 S Cottaar and V Lekic
• Spinning Earth Final Models slow Consensus : Contour for m = 5 (consensus) for the slow
cluster is shown in red.
• Spinning Earth Final Models slow Majority : Contour for m = 5 (consensus) for the slow
cluster is shown in red and m = 3 (majority) is shown in transparent yellow.
• Spinning Earth Final Models neutral Consensus : Contour for m = 5 (consensus) for the fast
cluster is shown in dark grey.
• Spinning Earth Final Models neutral Majority : Contour for m = 5 (consensus) for the fast
cluster is shown in grey and m = 3 is shown in transparent grey.
• Spinning Earth Final Models fast Consensus : Contour for m = 5 (consensus) for the fast
cluster is shown in blue.
• Spinning Earth Final Models fast Majority : Contour for m = 5 (consensus) for the fast
cluster is shown in blue and m = 3 (majority) is shown in transparent cyan.
– Vote map results
Results of the cluster analysis, which are plotted the vote maps, are shared in two text files
included in the Supporting Information, named clustervotes Vs CottaarLekic2016.txt and clus-
tervotes Vp CottaarLekic2016.txt. The format of these files is: longitude (deg), latitude (deg),
depth (km), # votes for slow, # votes for neutral, # votes for fast, color index. The depths
correspond to the centre of a 300 km wide depth window. The last column corresponds to the
colormap in Figure 1 and the corresponding colorscales are provided in text format (colortrian-
gle CottaarLekic2016.txt) and color palette table (colortriangle GMT CottaarLekic2016.cpt).
Acknowledgements
We thank Lauren Waszek for providing the CPT colormap.
Morphology of seismically slow lower-mantle structures – Supporting Information 3
References
Cottaar, S. & Romanowicz, B., 2013. Observations of changing anisotropy across the southern
margin of the African LLSVP, Geophys. J. Int., 195(2), 1184–1195.
Frost, D. A. & Rost, S., 2014. The P-wave boundary of the Large-Low Shear Velocity Province
beneath the Pacific, Earth Planet. Sci. Lett., 403, 380–392.
Lekic, V., Cottaar, S., Dziewonski, A. M., & Romanowicz, B., 2012. Cluster analysis of global
lower mantle tomography: A new class of structure and implications for chemical heterogeneity,
Earth Planet. Sci. Lett., 357-358, 68–77.
Ni, S., V. Helmberger, D., & Tromp, J., 2005. Three-dimensional structure of the African super-
plume from waveform modelling, Geophys. J. Int., 161(2), 283–294.
Sun, D., Helmberger, D., Ni, S., & Bower, D., 2009. Direct measures of lateral velocity variation
in the deep Earth, J. Geophys. Res., 114(B5), B05303.
Takeuchi, N., Morita, Y., Xuyen, N., & Zung, N., 2008. Extent of the low-velocity region in the
lowermost mantle beneath the western Pacific detected by the Vietnamese Broadband Seismo-
graph Array, Geophys. Res. Lett., 35(5), L05307.
To, A., Romanowicz, B., Capdeville, Y., & Takeuchi, N., 2005. 3D effects of sharp boundaries
at the borders of the African and Pacific Superplumes: Observation and modeling, Earth Plan.
Sci. Lett., 233(1-2), 1447–1460.

4 S Cottaar and V Lekic
Figure S1. Cross sections across the Pacific LLSVP showing the vote results for VP models. Map view
shows clustering results at a depth of 2700 km. Cross sections (aA) and (bB) can be directly compared to
those in Figure 7 of Frost & Rost (2014) and the solid black lines represent the boundary as constrained by
their P wave data set, while the dashed lines are extrapolated to shallower depths. Cross section (cC) runs
west to east across the LLSVP, illustrating the Western Anomaly, the Superswell anomaly and the Eastern
anomaly. Black lines represent the boundaries as modeled by Takeuchi et al. (2008). Cross section (dD)
runs north-south across the Superswell anomaly. The color scale is shown in Figure 1of the main paper.

Morphology of seismically slow lower-mantle structures – Supporting Information 5
Figure S2. Cross sections through the African LLSVP showing the vote results for VP models. Map view
shows clustering results at a depth of 2700 km. Cross section (aA) runs south-to-north across the ’toe’ of
the African LLSVP. The solid line represents the nothern boundary of the LLSVP as modeled by Sun et al.
(2009) while the two dashed lines bound the approximate region of the studies of Ni et al. (2005); To et al.
(2005); Sun et al. (2009); Cottaar & Romanowicz (2013). Cross section (bB) runs south-to-north across the
West African anomaly to the Iceland anomaly. Cross section (cC) crosses the length of the anomaly from
the West African anomaly across South Africa and beneath the Indian Ocean. Cross section (dD), running
from the southwest to the northeast across eastern Africa, shows the anomalous nature of the East African
anomaly: it tilts towards the northeast, creating an overhang. The color scale is shown in Figure 1 of the
main paper.

6 S Cottaar and V Lekic
Figure S3. Cross sections across the various meso-scale features showing the vote results for VP models.
Map view shows clustering results at a depth of 2700 km. Perm anomaly is shown in (aA) and (bB). The
black dashed lines show the outline of the cylindrical model proposed in Lekic et al. (2012). (cC) and (dD)
show the South Pacific Anomaly and (eE) and (fF) the Kamchatka Anomaly. The color scale is shown in
Figure 1 of the main paper.

Morphology of seismically slow lower-mantle structures – Supporting Information 7
Figure S4. Cross sections across the Pacific LLSVP showing the mean velocity in VS models and the
contours for m=4 (slow in red, neutral in yellow, and fast in blue). Regions lacking strong agreement (m<4)
for all three clusters are masked in grey. Map view shows clustering results at a depth of 2700 km. Cross
sections (aA) and (bB) can be directly compared to those in Figure 7 of Frost & Rost (2014) and the
solid black lines represent the boundary as constrained by their P wave data set, while the dashed lines are
extrapolated to shallower depths. Cross section (cC) runs west to east across the LLSVP, illustrating the
Western Anomaly, the Superswell anomaly and the Eastern anomaly. Black lines represent the boundaries
as modeled by Takeuchi et al. (2008). Cross section (dD) runs north-south across the Superswell anomaly.

8 S Cottaar and V Lekic
Figure S5. Cross sections through the African LLSVP showing the mean velocity in VS models and the
contours for m=4 (slow in red, neutral in yellow, and fast in blue). Regions lacking strong agreement (m<4)
for all three clusters are masked in grey.. Map view shows clustering results at a depth of 2700 km. Cross
section (aA) runs south-to-north across the ’toe’ of the African LLSVP. The solid line represents the nothern
boundary of the LLSVP as modeled by Sun et al. (2009) while the two dashed lines bound the approximate
region of the studies of Ni et al. (2005) , To et al. (2005), Sun et al. (2009), and Cottaar & Romanowicz
(2013). Cross section (bB) runs south-to-north across the West African anomaly to the Iceland anomaly.
Cross section (cC) crosses the length of the anomaly from the West African anomaly across South Africa
and beneath the Indian Ocean. Cross section (dD), running from the southwest to the northeast across eastern
Africa, shows the anomalous nature of the East African anomaly: it tilts towards the northeast, creating an
overhang.

Morphology of seismically slow lower-mantle structures – Supporting Information 9
Figure S6. Cross sections across the various meso-scale features showing the mean velocity in VS models
and the contours for m=4 (slow in red, neutral in yellow, and fast in blue). Regions lacking strong agreement
(m<4) for all three clusters are masked in grey. Map view shows clustering results at a depth of 2700 km.
Perm anomaly is shown in (aA) and (bB). The black dashed lines show the outline of the cylindrical model
proposed in Lekic et al. (2012). (cC) and (dD) show the South Pacific Anomaly and (eE) and (fF) the
Kamchatka Anomaly.
10 S Cottaar and V Lekic
Figure S7. Additional snapshots of 3D projection showing the votes for the slow cluster for majority (m =
3, transparent yellow) and for consensus (m = 5, red) without annotations.