Morphology, Molecular Phylogeny and Genome Content of ... · Morphology, Molecular Phylogeny and...
73
Morphology, Molecular Phylogeny and Genome Content of Bothriochloa Focusing on Australian Taxa Alex Sumadijaya Thesis submitted to the faculty of the Virginia Polytechnic Institute and State University in partial fulfillment of the requirements for the degree of Master of Science In Biological Sciences Khidir W. Hilu, Committee Chair Brent D. Opell Richard Veilleux May 4th 2015 Blacksburg, VA Key words: Bothriochloa, Capillipedium, chloroplast phylogeny, compilospecies, Dichanthium
Transcript of Morphology, Molecular Phylogeny and Genome Content of ... · Morphology, Molecular Phylogeny and...

Morphology, Molecular Phylogeny and Genome Content of Bothriochloa Focusing on Australian Taxa
Alex Sumadijaya
Thesis submitted to the faculty of the Virginia Polytechnic Institute and State University in partial fulfillment of the requirements for the degree of
Master of ScienceIn
Biological Sciences
Khidir W. Hilu, Committee ChairBrent D. Opell
Richard Veilleux
May 4th 2015Blacksburg, VA
Key words: Bothriochloa, Capillipedium, chloroplast phylogeny, compilospecies, Dichanthium

Morphology, Molecular Phylogeny and Genome Content of Bothriochloa Focusing on Australian Taxa
ALEX SUMADIJAYA
ABSTRACT
The study focuses on the genus Bothriochloa (Andropogoneae, Poaceae) in
Australia. Despite morphological features separating this genus from the closely related
two genera Capillipedium and Dichanthium, (the three hereafter will be called BCD), De
Wet and Harlan introduced the compilospecies complex to show the interbreeding
phenomena that occurred among species of these genera. This study was carried out
to assess species/genus relatedness of the BCD complex using different evidences
from morphology, molecular information and genomic content. Nineteen morphological
characters were observed, three regions (trnT-F, rps16 intron and 3’trnK) of chloroplast
genome phylogenetic were used in phylogenetic reconstruction, and chromosome
counting as well as flow cytometry for chromosome number and genome size were
conducted during the study. Phylogenetic trees were constructed using MP with NJ for
morphological data, and MP, RAxML, and BI for molecular data. Based on morphology,
all three genera were separated as monophyletic units. Bothriochloa consisted of two
clades. However, phylogenetic analyses based on chloroplast genomic regions reveal
that Bothriochloa and Dichanthium are paraphyletic clades and only Capillipedium is
resolved as a monophyletic clade. The concatenated data set has performed better
than individual data sets in terms of resolution and support for clades. Flow-cytometry
and chromosome counting only found diploid and tetraploid but not hexaplod species.
TCS network reveals that tetraploidization followed different pathways from the
ancestral diploid species. This study provided new insight onto the evolution of the
chloroplast genome in the compilospecies and empirical evidence of species grouping
of the compilospecies based on morphology.
ii

DEDICATION
For Ivana & Clementine, two pillars of my life.
Such lonely days without you guys….
iii

ACKNOWLEDGEMENT
The author would like to express the deepest gratitude for the long extensive
discussion, knowledge upgrade, and patience guidance of Dr. K. W. Hilu as the main
advisor and the Committee members: Dr. B. Opell and Dr. R. Veilleux for insight, help,
and support through the research. Author is very grateful to have Tom Wieboldt who
are willing to read author manuscript and undoubtedly made significant grammatical
improvement. The lab coworkers and significant others who share moment in lab of
work, discussion, and keep the high energy of sanity: Dr. Stephanie M. Voshell, Emily A.
Escobedo, Jenna Sackenheim, Bridget Cartwell, Jaimin Patel, Thomas J. Murray, and
Kathryn Moore. The research is partially supported by Fulbright scholarship and 2013
IAPT Award, The Dan Nicolson Fund.
iv

TABLE OF CONTENTS
CHAPTER I: MORPHOLOGICAL STUDY OF THE COMPILOSPECIES
I. INTRODUCTION 1
1. History, Taxonomic Overview, and Habit of Bothriochloa 1
2. The Compilospecies: an Interbreeding Complex 2
3. Study Objective and Area of Focus 4
II. MATERIALS AND METHODS 5
1. Species Used, Source of Materials and Seeds Germination 5
2. Data analysis 7
III. RESULTS 9
IV. DISCUSSION 11
V. CONCLUSION 15
VI. REFERENCES 16
CHAPTER II - MOLECULAR PHYLOGENETIC STUDYI. INTRODUCTION 20
II. MATERIALS AND METHODS 21
1. Taxon sampling and DNA sequencing 212. Sequence data analysis 24
III. RESULTS 25
1. Nuclear genome 25
2. Plastid genome 25
A. Region-Focus Analyses 25
B. Taxa-Focus Analyses 27
v

IV. DISCUSSION 33
1. Integration of Phylogenetic tree, Nucleotide substitution network and
Compilospecies complex of De Wet and Harlan (1970) 35
2. Other regions of trnH-psbA, rpL 16 intron, and petA-psbJ 40
V. CONCLUSION 40
VI. REFERENCES 41
VII. APPENDICES 45
Appendix A. Region Focus trnT-F 45
Appendix B. Region Focus rps16 intron 46
Appendix C. Region Focus 3’trnK 47
Appendix D. Region Focus concatenated data set 48
Appendix E. Taxa Focus trnT-F 49
Appendix F. Taxa Focus 3’trnK 50
Appendix G. Taxa Focus concatenated data set 51
CHAPTER III – CHROMOSOME NUMBER AND GENOMIC CONTENTI. INTRODUCTION 52
II. MATERIALS AND METHODS 54
1. Chromosomal counting 54
2. Flow cytometry 54
III. RESULTS AND DISCUSSION 56
IV. SUMMARY AND CONCLUSION 60
V. REFERENCES 61
FINAL SYNTHESIS 63
vi

LIST OF FIGURES
Figure 1. Compilospecies hybridization network among species of three
genera of Bothriochloa, Capillipedium and Dichanthium 4
Figure 2. Neighbor Joining tree and Maximum Parsimony tree 10
Figure 3. Character optimization of Maximum Parsimony 12
Figure 4. Phylogenetic trees derived from the REGION FOCUS are compared
side by side 28
Figure 5. Sites informativeness curve generated by PhyDesign for the trnTF, rps 16
intron, 3’trnK regions individually and their concatenated data set 29
Figure 6. Phylogenetic trees derived from the TAXA FOCUS are compared side
by side 31
Figure 7. Sites informativeness curve generated by PhyDesign for the trnTF and
3’trnK regions and their concatenations 32
Figure 8. Phylogeny based on RAxML analysis Region-Focus approach is compared
side by side with the modified network of the compilospecies 34
Figure 9. Phylogeny based on RAxML analysis Taxa-Focus approach is compared side
by side with the modified network of the compilospecies(right) 36
Figure 10. TCS network based on concatenated Region-Focus (trnTF +
rps 16 intron + 3’trnK) data set with 95 % parsimony, with gaps treated
as missing data 38
Figure 11. TCS network based on concatenated Taxa-Focus (trnTF + 3’trnK) of the
region Focus approach with 95 % parsimony and gap treated as missing
data 39
Figure 12. The peaks observed in the Flow cytometry experiments 55
Figure 13. Phylogenetic tree of the BCD complex based on the Region-Focus
approach with ploidy status reported below each taxon 58
vii

Figure 14. Superimposed average of flow cytometry result on TCS mapping of Region
Focus (95% parsimony probability, gap coded as missing data) 60
vii
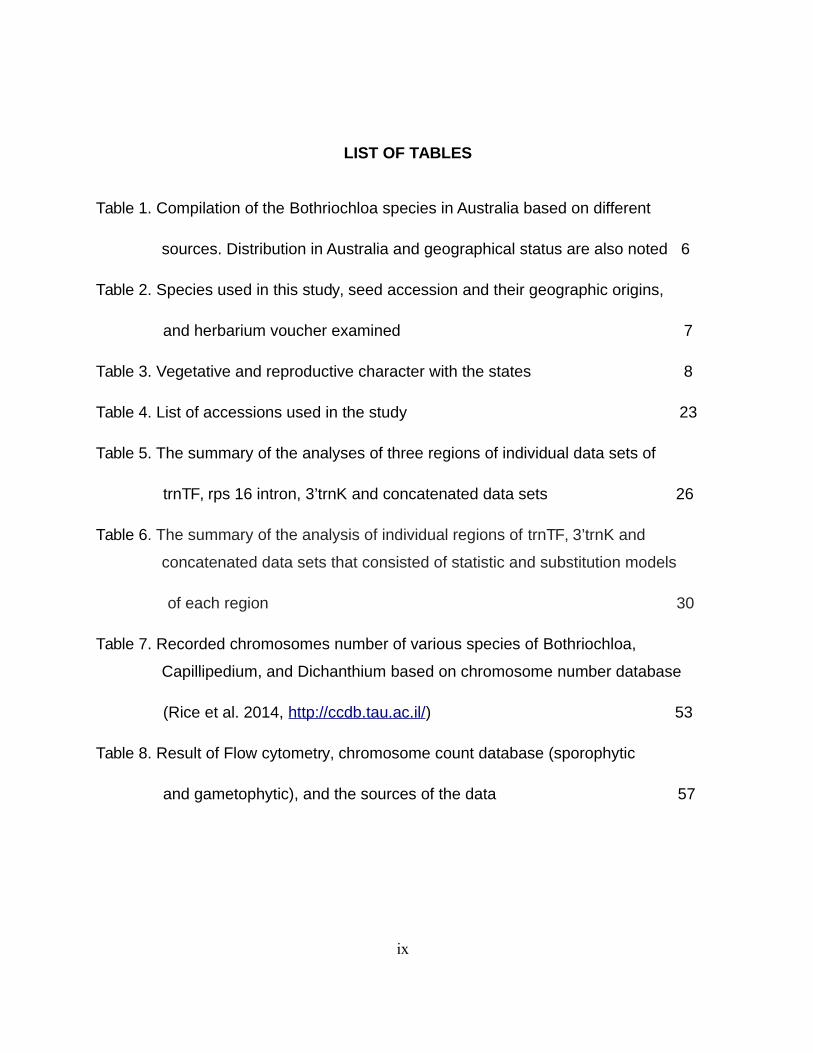
LIST OF TABLES
Table 1. Compilation of the Bothriochloa species in Australia based on different
sources. Distribution in Australia and geographical status are also noted 6
Table 2. Species used in this study, seed accession and their geographic origins,
and herbarium voucher examined 7
Table 3. Vegetative and reproductive character with the states 8
Table 4. List of accessions used in the study 23
Table 5. The summary of the analyses of three regions of individual data sets of
trnTF, rps 16 intron, 3’trnK and concatenated data sets 26
Table 6. The summary of the analysis of individual regions of trnTF, 3’trnK and
concatenated data sets that consisted of statistic and substitution models
of each region 30
Table 7. Recorded chromosomes number of various species of Bothriochloa,
Capillipedium, and Dichanthium based on chromosome number database
(Rice et al. 2014, http://ccdb.tau.ac.il/) 53
Table 8. Result of Flow cytometry, chromosome count database (sporophytic
and gametophytic), and the sources of the data 57
ix

1
CHAPTER I: MORPHOLOGICAL STUDY OF THE COMPILOSPECIES
I. INTRODUCTION
1. History, Taxonomic Overview, and Habit of Bothriochloa Bothriochloa Kuntze, (tribe Andropogoneae, Poaceae) is a cosmopolitan
grass genus of 32 to 35 species (Watson and Dallwitz 1992). Two genera closely
related to Bothriochloa are Capillipedium Stapf with 14 to 17 species and
Dichanthium Willemet that consisted of 16 to 21 species (Watson and Dallwitz
1992, Clayton et al. 2006). Despite their morphological differences, an alliance
between these three genera has been recognized due to their ability to interbreed
(De Wet and Harlan 1970b). The three genera share similar habitat requirement
grassy warm region and open habitats. Morphologically all of them have similar
general habit and inflorescence architectures (Watson and Dallwitz 1992, Clayton et al. 2006, Skendzic et al. 2007).
Kuntze (1891) was the first to describe Bothriochloa using Bothriochloa
anamitica as the type species. Bothrichloa also has also synonyms, Amphilophis
and Gymnandropogon, two taxa that were embedded in the genus Andropogon.
Andropogon was first described in Species Plantarum vol. 2 (Linnaeus, 1753). Von
Trinius (1832) described the subgenus Amphilophis in Andropogon. Nash (1901)
recognized this subgenus as a separate genus, Amphilophis. Within Andropogon,
Nees (1841) placed certain South African species in subgenus Gymnandropogon
in his publication of the Florae Africae Australioris Illustrationes Monographicae.
Dunthie (1882) then raised this subgenus to a genus level, Gymnandropogon.
Roberty (1960) treated Bothriochloa and Amphilophis as sections of the genus
Dichanthium. Currently, Bothriochloa is the legitimate generic name with
Amphilophis and Gymnandropogon as synonyms (Watson and Dallwitz 1992,
Shouliang and Phillips 2006).
Etymologically, the name of Bothriochloa is derived from the Greek words
bothrion, ‘the pit’, and chloe 'culm’, which refer to the pitted (foveolate) lower

2
glumes (Watson and Dallwitz 1992). Bothriochloa is diagnosed by the arrangement
of racemes on a central axis of its inflorescence. Each raceme has more than
eight joints. In some species, the inflorescence are as a panicle of racemes, the
basal raceme does not branches beyond the 2nd degree, and the whole basal
raceme with its secondary branches disarticulates as a single unit (Backer and
Backhuizen van den Brink Jr. 1968, Watson and Dallwitz 1992, Clayton et al. 2006,
Simon et al. 2012).
The morphological feature that unifies the closely related Capillipedium with
Bothriochloa is the translucent mid-line between the thickened margins of the
rachis and the pedicels, a condition termed ‘canaliculate’. However, Capillipedium
differs from Bothriochloa in having a panicle inflorescence that is composed of
strongly branched racemes, the racemes never have more than nine joints, with
joints disarticulating individually. Dichanthium, on the other hand, lacks the
canaliculated character, and is separated as the next closest taxon to Bothriochloa
(Simon et al. 2006, Backer and van den Brink Jr. 1968, Ohwi 1942, De Wet et al.
1961). Nevertheless, some authors united Bothriochloa and Dichanthium into a
single genus of Dichanthium based on morphology. Gardner (1952) pointed out
the unifying characters of these genera, e.g. the pedicelled spikelet being male or
sterile, and when fertile, has much reduced awn; sessile spikelet with the upper
floret being female or bisexual. Roberty (1960) merged Bothriochloa and
Dichanthium based on the presence of foveolate fertile lower glumes and the “lack
of canaliculation”. This lack of canaliculation is inconsistent with Kuntze’s (1891)
description in which he underscored the presence of canaliculation in Bothriochloa.
2. The Compilospecies: an Interbreeding Complex
During the 1950’s, researchers at the Experimental Agricultural Station of
Oklahoma State University conducted extensive research on the improvement of
the pasture quality of native and introduced grass of the tribe Andropogoneae with
a main focus on Bothriochloa and Dichanthium. This represented a preliminary
effort to find a correlation between polyploidy and morphological characters. As

3
part of that intensive research, De Wet and Harlan (1970a) conducted extensive
greenhouse hybridization experiments to map out the interbreeding phenomena
among the species of Bothriochloa, Capillipedium, and Dichanthium (referred to as BCD).
Harlan et al. (1962), Harlan and De Wet (1963), De Wet and Harlan (1970b)
demonstrated that Bothriochloa bladhii (Retz.) S.T. Blake, formerly known as
Bothriochloa intermedia (R.Br.) A. Camus, serves as the hub for gene flow from
intergeneric hybridization among species of these three genera (De Wet and
Harlan 1966). Although the previous specific epithet, intermedia, was well chosen
for explaining intermediate forms produced from hybridization with other taxa, the
name B. bladhii has priority. At the end, this hybrid complex involving
Bothriochloa, Capillipedium, and Dichanthium (BCD, Figure 1) was named as the
compilospecies to represent the existence of species complex as the taxonomic
dilemma of BCD that is morphologically, but not reproductively distinct (Harlan and De Wet 1963, De Wet and Harlan 1970a).
Furthermore, De Wet and Harlan (1970a) proposed the grouping of these
interbreeding taxa as sections under the genus Dichanthium, the earliest published
generic name. Interestingly, this cross hybridization phenomenon happens only at
the tetraploid level, both in greenhouse and in nature, and reproductive isolation
occurred at the diploid and hexaploid levels (Celarier and Harlan 1955, De Wet et
al. 1961). In nature, tetraploid B. bladhii was recorded to hybridize with B.
ewartiana (Domin) C.E. Hubbard, B. ischaemum (L.) Keng, and Capillipedium
parviflorum (R.Br.) Stapf. Interbreeding between B. bladhii and C. parviflorum
possibly produces Capillipedium spicigerum S.T. Blake (Harlan et al. 1962).
Diploid species of Capillipedium and Dichanthium are reproductively isolated and
attempts to hybridize them failed (De Wet and Harlan 1966, 1970b), although
Faruqi (1969) stated that artificial hybrids could be produced at the hexaploid level.
Therefore, I hypothesize that interbreeding blurs demarcation among species of Bothriochloa.

4
Figure 1. Compilospecies hybridization network among species of the three genera Bothriochloa, Capillipedium, and Dichanthium (Redrawn and revised from De Wet and Harlan, 1970, Apomixis, polyploidy, and speciation in Dichanthium, Evolution, Wiley Publisher). Ploidy level is noted as 2x, 4x, 5x and 6x.
3. Study Objective and Area of Focus
The overall objectives of this study is to assess the relationship among
species of the Bothriochloa, Capillipedium, and Dichanthium (BCD) complex by
using morphological characters to provide better insight into the compilospecies
complex with a focus on the Australian taxa. In more detail, there are three points
to be addresses: 1). To assess relationship of Bothriochloa to Capillipedium and
Dichanthium, 2). To check the monophyly of Bothriochloa based on morphology,
and 3). To evaluate the taxonomical relationship among the species of
Bothriochloa. I decided to focus on the Australian species of the BCD complex for
two reasons: 1). limited coverage provides a manageable starting point for this
rather complex taxonomic problem, and 2.) availability of accessions for the

5
Australian taxa from the United States Department of Agriculture (USDA-GRIN)
and the Department of Agriculture Fisheries and Forestry, Australia (DAFF).
Hubbard (1934) listed three species of Bothriochloa in Australia: B.
decipiens (Hack.) C.E.Hubb (and B. decipiens var. cloncurensis), B. ewartiana, and
B. erianthoides (F. Muell) C.E.Hubb. Blake (1944) constructed the earliest
identification key for the Australian Bothriochloa, and recognizing seven taxa: B.
erianthoides, B. biloba S.T. Blake, B. ambigua S.T. Blake, B. decipiens, B.
decipiens var. cloncurensis, B. ewartiana, and B. intermedia. Simon (1982)
described a new species, B. bunyensis Simon. Later, he also recognized B. glabra as a subspecies of B. bladhii (Simon 1989).
As a comprehensive resource of Australian plant, Australian Plant Names
Index (APNI) noted 10 valid species of Bothriochloa. Among these, six are natives
with three being endemic (distributed in only part) of Australia, and the remaining
four are naturalized species. Table 1 summarizes the history of species recognition in Australia and their geographical status.
II. MATERIAL AND METHODS
1. Species Used, Source of Materials and Seeds Germination
Six species of Bothriochloa, two species of Capillipedium and three species
of Dichanthium were used in this study. Materials for these species were in the
form of seeds and herbarium vouchers. The total number of herbarium vouchers
examined and the number of seed samples obtain were 26. The species and the
sources of the materials are noted in Table 2. Compilospecies network (Fig. 1)
copyright permission was followed Wiley Publisher website (http://www.wiley.com/WileyCDA/Section/id-301464.html).

6
Table 1. Compilation of the Bothriochloa species in Australia based on different sources. Symbols are referring (+) present, (-) absent. Numbers refer to literatures 1). Hubbard (1934), 2). Blake (1944), 3). Simon (1982), 4). Simon (1989), 5). APNI (2014). Distribution (APNI: Australian Plant Names Index): A: Australia Capital Territory; NA: not available; Z: New South Wales; N: Northern Territory; Q: Queensland; S: Southern Australia; T: Tasmania; W: Western Australia; V: Victoria. Status; I: Invalid; E: Endemic; Nv: Native Nt: Naturalized; *N & T; partially naturalized in N & T.
Species 1 2 3 4 5 Distribution (APNI) Status (APNI)
B. ambigua - + - - - - I B. biloba - + - - + Q, W E B. bladhii / B. intermedia / B. glabra - + - + + N, Q, W, Z Nv B. bunyensis - - + - + Q E B. decipiens + + - - + N, Q, W, Z Nv B. erianthoides + + - - + Q, Z E B. ewartiana + + - - + N, Q, S, W, Z Nv B. insculpta - - - - + Q, Z Nt B. macra - - - - + A, N, Q, S, T, V, Z *N & T B. pertusa - - - - + N, Q, W Nt B. saccharoides - - - - + A Nt
In the case of seed materials, seeds were germinated in petri dish with a few
drops of KNO3 in the greenhouse. Germinated seeds were grown until seedlings
reached five cm in height before transferring them to plastic container to reach
maturity. After they produced flowers and seeds in the greenhouse, whole plants
were collected for various purposes. Some specimens at the flowering stage were
dried and pressed as herbarium vouchers. Data on morphological characters were
derived from a combination of observations from these herbarium vouchers of
germinated seeds and from descriptions in GrassBase
(http://www.kew.org/data/grasses-db/sppindex.htm). Some taxa that naturally
occur outside Australia were also added to provide a broader picture of the compilospecies.

7
Table 2. Species used in this study, seed accession and their geographic origins, and herbarium voucher examined. Accessions starting with PI were obtained from USDA-GRIN, and those with AUSTRCF were obtained from DAFF.
Species Seeds Herbarium Accession Origin A. glomeratus + + AX 1 United States A. gyrans + + AX 2 United States B. bladhii + + AusTRCF105854 Australia B. bladhii + + PI 239164 Australia B. bladhii + + PI 300909 Australia B. bladhii + + PI 301375 Australia B. decipiens + + PI 239153 Australia B. decipiens + + PI 301294 Australia B. decipiens + + PI 257676 Australia B. decipiens + + PI 301290 Australia B. ewartiana + + PI 300723 Australia B. ewartiana + + PI 300724 Australia B. insculpta + + PI 301418 Mozambique B. insculpta + + AusTRCF320165 Australia B. ischaemum + + PI 300904 Thailand B. ischaemum + + PI 199861 Australia B. macra + + PI 301266 Australia B. macra + + PI 301267 Australia B. macra + + PI 301272 Australia B. macra + + PI 301273 Australia C. parviflorum + + PI 301780 China C. spicigerum + + PI 301775 Australia C. spicigerum + + PI 301378 Australia D. annulatum + + PI 302047 Australia D. aristatum + + PI 301994 Australia D. sericeum + + AusTRCF323612 Australia
2. Data analysis
Five vegetative and 14 reproductive characters (Table 3) were selected
based on documented variability among Bothriochloa species. Characters states
were coded as numeric values, either as bi-state or multistate (Table 3) and saved
in a Nexus format using MacClade (Maddison and Maddison 2011) and Mesquite

8
(Madisson and Madisson 2015). All characters were treated equally and were
unordered. Analyses were conducted using PAUP (Swofford 1997) with Neighbor
Joining (BioNJ) Gascuel (1997). BioNJ was selected over UPGMA to exclude the
molecular clock effect. Based on character substitution, Maximum Parsimony (MP)
searched for the shortest tree. Heuristic search with Stepwise Addition was
conducted with the random option and 100 replicates. Bootstrap (BS) search was
conducted with ‘Fast’ stepwise addition, retaining group with >50% frequency, and
with 100 replicates. Only support values above 50 were visualized with three
confidence levels, high (85--100), moderate (75--84) and low (>50%).
Table 3. Vegetative and reproductive character along with their character states
Character states
Characters 1 2 3 1 Culm habit Erect Decumbent NA 2 Length < 100 cm > 100 cm NA 3 Ligule Ciliate Eciliate NA 4 Ligule tip Truncate Obtuse NA 5 Inflorescence Raceme Panicle NA
6 Infloresencence base Hairy Glabrous Pilose
7 Espatheate raceme Present Absent NA
8 Spikelet vestiture Hairy Glabrous NA 9 Spikelet shape Ellips Lanceolate Linear
10 Ratio sterile vs fertile 100% <100% NA
11 Translucent pedicel Yes No NA
12 Pit presence Present Absent NA 13 Pit number 1 2 NA
14 Lower Glume texture Chartaceous Coriaceous Cartilagineous
15 Lower Glume base Keeled Round NA
16 Lower Glume shape Elliptic Lanceolate NA
17 Lemma surface Pilose Glabrous NA 18 Lemma shape Oblong Lanceolate NA 19 Anther 1 3 NA
9
NA: Not available
Furthermore, character optimization (ACCTRAN or DELTRAN) was also
conducted in PAUP (Swofford 2003) to assess the best support for the topology.
Andropogon was chosen as an outgroup since it has been shown consistency as a
sister lineage to the BCD clade in phylogenetic analysis of sequence data from the
ndhf region (Morrone et al. 2012).
III. RESULTS
Tree topology based on BioNJ (Figure 2) grouped the BCD together
with 61% BS support. Capillipedium and Dichanthium appeared in a single lineage
(<50% BS) sister to the Bothriochloa lineage. Capillipedium and Dichanthium
species segregated into two separate clades with BS support 85% for Dichanthium
and <50% BS support for the Capillipedium clade. Within Capillipedium, the two
accessions of C. spicigerum did not group together but instead one of them, #378,
appeared sister to the single accession of C. parviflorum. In the Dichanthium
lineage (BS= 85), D. aristatum appeared sister to a D. annulatum plus D. sericeum
clade.
The BioNJ analysis recovered two clades (in bold) in the monophyletic
Bothriochloa: the Bladhii (B1) and the Macra (M1) clades (Fig. 2). The B1
(BS<50%) includes B. bladhii, B. insculpta, B. ischaemum #904. The three species
appeared monophyletic, with B. insculpta sister to B. bladhii plus B. ischaemum
#904. The M1 clade comprised of B. macra, B. decipiens, B. ewartiana, and B.
ischaemum #861. The clade is separate into two subclades, both received <50%
BS support. One subclade consisted of two accessions of B. ewartiana (#723 and
#724) and one accession of B. ischaemum #861. The two accessions of B.
ewartiana did not group together, but instead one of them (B. ewartiana #724)
appeared sister with B. ischaemum #861. The other subclade consisted of four
accessions each of B. macra and B. decipiens. The B. macra accession formed a
grade (B. macra #267 / B. macra #273 + #272/ B. macra #266) sister to the B.
decipiens clade (BS=92).

10
Figure 2. Neighbor Joining (BioNJ) tree (left) and Maximum Parsimony (MP) tree (right). Numbers above nodes represent BS support values. Species are color-coded. Colored bars on the right side of taxa represent Capillipedium (blue), Dichanthium (green) and the outgroup Andropogon (red). Colored boxes visualize the congruency between individual clusters on the two trees. Legend: Aglom: A. glomeratus, Agy: A. gyrans, isc: B. ischaemum, ewa: B. ewartiana, ins: B. insculpta, C.pv: C. parviflorum, C.sp: C. spicigerum, D.an: D. annulatum, D.ar: D. aristatum, D.se: D. sericeum.
The MP tree shows consistency index (CI=0.690), retention index
(RI=0.410) and homoplasy index (HI=0.310). The tree showed a major basal
polytomy of three clades: Capillipedium+Dichanthium (CD, BS=87%), Macra
(M2, BS<50%) and Bladhii (B2, BS<50%). The composition of the Capillipedium
(BS=61%), and Dichanthium (BS<50%) subclades was identical with that of the

11
BioNJ tree. The exception is that the accessions of each subclade appeared in a
polytomy.
In the Bothriochloa clades (BS<50%), species composition is almost
identical to that of the BioNJ. The only difference is the position of B. insculpta, as it
appeared in the B1 in the BioNJ whereas it appeared in the M1 subclade in the MP
(Fig. 2). The BS values supporting the sister relationship of B. macra #266 to the
B. decipiens clade and the monophyly of the latter species decreased compare to
the values in the BioNJ (Fig. 2).
Character optimization of ACCTRAN and DELTRAN (Fig. 3) was conducted
to improve tree resolution and support in the MP tree. Both analyses did not
improve on the resolution of the backbone topology since the basal polytomy
remained unchanged. Further, the character optimization analyses did not resolve
the genera Capillipedium and Dichanthium in one lineage as in the MP and BioNJ
analyses (Fig. 2). The composition of the two Bothriochloa clades (M3 and B3)
were similar to that obtained in the BioNJ analysis, but the support for the sister
relationship of B. macra #266 to the B. decipiens clade decreased.
IV. DISCUSSION
This morphological analysis is the first attempt to assess the species
relationship in the compilospecies based on empirical approach. Previous studies
were intuitive based on general observation and measurement without critical
bioinformatics aspect (Sumadijaya and Veldkamp 2009, Sumadijaya and Veldkamp
2011, Roberty 1960). Based on selected reproductive characters, Roberty (1960)
divided the genus Dichanthium into six sections with species of Bothriochloa
distributed in three sections including section Bothriochloa.

12
Figure 3. Character optimization of MP with ACCTRAN tree (left) and DELTRAN tree (right). Numbers above nodes represent BS support values. Species are color-coded. Colored bars on the right side of trees denote Capillipedium (blue), Dichanthium (green) and the outgroup Andropogon (red). Colored boxes visualize the congruency between individual clusters on the two trees. Legend: Aglom: A. glomeratus, Agy: A. gyrans, isc: B. ischaemum, ewa: B. ewartiana, ins: B. insculpta, C.pv: C. parviflorum, C.sp: C. spicigerum, D.an: D. annulatum, D.ar: D. aristatum, D.se: D. sericeum.
Based on the morphological character in both BioNJ and MP analyses,
Capillipedium and Dichanthium were monophyletic genera and appeared in a
single clade sister to each other. The BS support for this CD clade is 87% in MP
and <50% in BioNJ. The relationships among these three genera have been

13
inconsistently resolved. The topology from this morphological study is in
agreement with that obtained in the phylogenetic study of Teerawatananon et al.
(2009) based on combined sequences from trnL–F, atpβ–rbcL and ITS regions.
Mathews et al. (2002) using phyB, GBSSI, and ndhF resolved Dichanthium as
sister lineage to a clade that included Bothriochloa and Capillipedium. On the
other hand, Guissani et al. (2001) and Moronne et al. (2012) have shown a
topology of Bothriochloa plus Dichanthium sister to Capillipedium based on ndhF
sequences. These molecular phylogenetic studies are based on single species per
genus, and thus robustness of the relationship is in question.
Capillipedium is represented in Australia by two species, C. spicigerum and
C. parviflorum. In the CD clade of BioNJ, C. spicigerum appeared paraphyletic
with C. parviflorum nested between its two accessions. This situation may be due
to the small sampling available for these species. Thus, adding more accessions
may refine the topology of the genus.
The genus Dichanthium comprises three species in Australia: D. annulatum,
D. aristatum and D. sericeum. Although in the MP analysis the three species
appeared in a polytomy (BS<50%), the BioNJ analysis (BS=85%) resolved D.
aristatum sister to a clade containing D. annulatum plus D. sericeum (BS=77%).
Similar relationship was also recovered in the molecular phylogenetic study
(Sumadijaya, Chapter 2).
The genus Bothriochloa lacks of comprehensive intrageneric taxonomic
treatment. The name of Bothriochloa was derived from the presence of 1-3 pits in
the fertile glume of the spikelet, and this feature was regarded as an apomorphic
morphological character. The pits, however, do not serve as a consistent character
for species delimitation. Furthermore, pits disappeared in hybrid offspring of B.
bladhii and D. annulatum, but not in B. bladhii and B. ischaemum hybrids.
Therefore, the pit is not an informative character in tree reconstruction and
consequently was not included in the BioNJ and MP analyses. The overall
topology of the Bothriochloa clade resolved in this morphological study shows a
division of the five Australian species into two major clades. The composition of

14
the two clades in both BioNJ and MP analyses (BS<50%) are almost identical.
These two major clades correspond to the two clades recovered by the molecular
phylogenetic study (Sumadijaya, Chapter 2). Due to the small sample for the
genus, we will tentatively refer to them as the Macra (M1 and M2) and Bladhii (B1 and B2) clades without any formal taxonomic recognition at this point.
Clade Bladhii (B1) has three species: B. bladhii, B. insculpta and B.
ischaemum # 904. Although Faruqi (1969) mentioned the plasticity of B. bladhii in
its interbreeding with other species, this species is resolved as a monophyletic unit
in BioNJ and MP analyses. Bothriochloa insculpta also appears as monophyletic
in both analyses. The difference is that B. insculpta emerges sister to clade
B.bladhii plus B. ischaemum #904 in the Bladhii clade in the BioNJ analysis,
whereas this species appeared sister to B. ischaemum #861 in Macra clade in the
MP analysis. This difference in topology represents soft incongruence since the
BS support for these relationships were <50%. Inconsistency of the placement of
B. ischaemum could plausibly be caused by character state variations in spikelet
shape, ligule hair, inflorescence architecture, and spikelet ratio. Matakis et al.
(2011) mentioned that genetic variability in B. ischaemum was contributed by
polymorphism of microsatellite loci.
Clade Macra (M1) consisted of B. decipiens, B. macra, B. ewartiana and B.
ischaemum #861) in the BioNJ, whereas the clade also included B. insculpta in MP
analysis (Fig. 2). With the exception of B. ischaemum, these species are native or
endemic to Australia. The presence of B. ischaemum in the macra clade in the MP
analysis is in agreement with Faruqi (1969) classification where he recognized the
close morphological relationship between B. ewartiana and B. ischaemum in his
identification key.
Bothriochloa macra appeared consistently as a paraphyletic group with B.
decipiens nested within it in both BioNJ and MP analyses. These two species are
sympatric in East Australia (Queensland, NSW, and Victoria based on ALA (Atlas
of Living Australia), (http://spatial.ala.org.au/webportal//#), but their possible

15
interspecific hybridization and chromosome number have not been reported.
Bothriochloa decipiens accessions form a well-defined clade with strong support in
BioNJ (BS=92%) and in MP (BS=82%). Morphologically, the single anther of B.
decipiens sets it apart from B. macra that has three anthers.
V. CONCLUSION
The 19 vegetative and reproductive characters on which BioNJ and MP
analyses were based represent the first empirical study on the compilospecies The
analyses resolved the three genera, Bothriochloa, Capillipedium, and Dichanthium
as distinct individual monophyletic units. This was resolved despite reported
intergeneric hybridization among them. The study also showed the close
relationship between Capillipedium and Dichanthium, where the two emerged as
sister clades in one well-supported lineage. The relationship between Capillipedium
and Dichanthium has been previously disputed. Tree topology based on BioNJ
and MP analyses are highly congruent. The structure of the Bothriochloa lineage
in both analyses was highly similar, resolving two clades that may represent nuclei
for future sectional classification of the genus. The analyses also identified core
species in each subclade of Bothriochloa. These are B. bladhii plus B. ischaemum
#904 of the B subclade and B. macra plus B. decipiens of the M subclade.
The hypothesis is refuted since the interbreeding does not blur the
demarcation among genera and species. The possibilities are either non-viable
hybrids or dominant alleles effect.
This study provided new insight into the relationship among species of the
compilospecies complex in general and on the Australian taxa in particular.
Incorporating other species of Bothriochloa beyond Australia will refine the overall
picture of the classification of this genus.

16
VI. REFERENCES
Atlas of Living Australia website at (http://spatial.ala.org.au/webportal//#),
Accessed 30 March 2015
Backer, C. A. and R. C. B. van den Brink Jr. 1968. Flora of Java. Vol III. Wolters-
Noordhoff: Groningen.
Blake, S. T. 1944. Monographic Studies in the Australian Andropogoneae, Part 1.
Including Revision of the genera Bothriochloa, Capillipedium, Chrysopogon,
Vetiveria and Spathia. University of Queensland, Department of Biology,
Paper 2 (3): 24-41.
Clayton, W. D. and S. A. Renvoize. 1986. Genera graminum: grasses of the world.
HMSO. London.
Clayton, W. D., M. S. Vorontsova, K.T. Harman, and H. Williamson, 2006 onwards.
GrassBase - The Online World Grass Flora. http://www.kew.org/data/grasses-db.html.
De Wet, J. M. J., D. S. Borgaonkar and H. R. Chheda. 1961. Intergeneric Hybrids
in the Bothriochloinieae II: Bothriochloa and Capillipedium. Cytologia 26:
268—273.
De Wet, J. M. J. and J. R. Harlan. 1966. Morphology of the Compilospecies
Bothriochloa intermedia. American Journal of Botany 53(1): 94-98.
De Wet, J. M. J. and J. R. Harlan. 1970. Apomixis, polyploidy, and speciation in
Dichanthium. Evolution 24: 270-277.
De Wet, J. M. J. and J. R. Harlan. 1970. Bothriochloa intermedia: A Taxonomic
Dilemma. Taxon (19) 3: 339-340.
Dunthie, 1882. in Atkinson. Gaz. NW, Prov. and Oude 10: 638.
Edgar, E. E. and H. E. Connor. 2010. Flora of New Zealand: Volume V Grasses.
Manaaki Whenua Press.

17
Faruqi, M. 1969. Range of morphological variation within the Bothriochloa
intermedia complex. Phyton 13 (3 – 4): 285-303.
Gardner, C. A. 1952. Flora of Western Australia.1 (Pt. I): 297-344.
Gascuel O. 1997. BIONJ: an improved version of the NJ algorithm based on a
simple model of sequence data."Molecular Biology and Evolution 14:685-
695.
Giussani L. M., J. H. Cota-Sanches, F. O. Zuloaga and E. A. Kellogg. 2001. A
molecular phylogeny of the grass subfamily Panicoideae (Poaceae) shows
multiple origins of C4 photosynthesis. American Journal of Botany 88:
1993–2012.
Harlan, J. R., H. R. Chheda, and W. L. Richardson. 1962. Range of Hybridization with Bothriochloa intermedia (R.Br.) A. Camus. Crop Science 2: 480—483.
Harlan, J. R., and J. M. J. De Wet. 1963. The compilospecies concept. Evolution 17 (4): 497—501.
Henty, E. E. 1969. A manual of the grasses of New Guinea. Department of Forests,
Lae.
Hubbard C. E. 1934. Gramineae Australienses: II. Bulletin of Miscellaneous
Information Kew 10: 444-451.
Kuntze, O. 1891. Revisio generum plantarum 2. Arthur Felix, Leipzig.
Linnaeus, C. 1753. Species Plantarum Tomus II. Impensis Laurentii Salvii,
Stockholm.
Maddison, W. P. and D. R. Maddison. 2015. Mesquite: a modular system for
evolutionary analysis. Version 3.02 http://mesquiteproject.org
Matakis, S., R. D. Overath, B. Kutil, A.E. Pepper, and J. R. Manhart. 2011. Isolation
and characterization of microsatellite markers for Bothriochloa ischaemum
18
(Poaceae). American Journal of Botany. e192-e194.
Mathews, S. R.E Spangler, R.J. Mason-Gamer, and E.A. Kellogg. 2002. Phylogeny
of Andropgoneae inferred from Phytochrome B, GBSSI and NDHF. International Journal of Plant Sciences 163 (3): 441-450.
Morrone, O., L. Aagesen, M. A. Scataglini, D. L. Salariato, S. S. Denham, M. A.
Chemisquy, S. M. Sede, L. M. Giussani, E. A. Kellogg and F. O. Zuloaga.
2012. Phylogeny of the Paniceae (Poaceae: Panicoideae): integrating
plastid DNA sequences and morphology into a new classification. Cladistics
(28) 333–356.
Nash, N. L. 1901. in Britton, N. Manual of the Flora of the northern States and
Canada.
Nees von Esenbeck, C. G. D., 1841. Florae Africae Australioris Illustrationes
Monographicae 103.
Ohwi, J. 1942. Gramina japonica: III, IV, Acta Phytotaxonomica et Geobotanica 11: 297--344.
Roberty, G. 1960. Monographie systematique des Andropogonees du globe.
Boissiera (9): 1-453.
Shouliang, C., and S. M. Phillips. 2006. 203. Bothriochloa Kuntze in Wu, Z. Y., P.
H. Raven & D. Y. Hong, eds.. Flora of China. Vol. 22 (Poaceae). Science Press, Beijing, and Missouri Botanical Garden Press, St. Louis.
Simon, B. K. 1998. Studies in Australian Grass: 4 Taxonomic and Nomenclatural
Studies in Australian Andropogoneae. Austrobaileya 3(1): 79-99.
Simon, B. K. 2006. GrassWorld-interactive key and information system of world
grasses. Kew Bulletin 62: 475–484.
Simon, B. K., D. Clayton, K. Harman, M. Vorontsova, I. Brake, D. Healy, and Y.
Alfonso. 2012. GrassWorld. http://grassworld.myspecies.info/
Simon, B. K. 1982. New species of Gramineae from South-Eastern Queensland.

19
Austrobaileya 1(5): 455--467.
Skendzic, E. M., J. T. Columbus, and R. Cerros-Tlatilpa. 2007. Phylogenetics of
Andropogoneae (Poaceae: Panicoideae) based on nuclear ribosomal
internal transcribed spacer and chloroplast trnL–F sequences. Aliso: 530–
544.
Sumadijaya, A. and J. F. Veldkamp. 2009. Notes on Bothriochloa Kuntze (Gramineae:Andropogoneae) in Malesia. Reinwardtia 12: 415–417.
Sumadijaya, A. and J. F. Veldkamp. 2011. Bothriochloa Kuntze (Gramineae: Andropogoneae) in Malesia. The Garden's Bulletin Singapore 63: 71–76.
Swofford, D.L. 2003. PAUP. Phylogenetic Analysis Using Parsimony. Version 4.
Sinauer Associates, Sunderland, Massachusetts.
Teerawatananon, A., S. W. L. Jacobs and T.R. Hodkinson. 2009. Phylogenetics of
Panicoideae (Poaceae) based on chloroplast and nuclear DNA sequences. Telopea 13(1–2) 115–142.
The Plant List. 2013. Version 1.1. Published on the Internet;
http://www.theplantlist.org/ (accessed 21st December 2014).
von Trinius. C.B. 1832. Mémoires de l'Académie Imperiale des Sciences de St.-
Pétersbourg. Sixième Série. Sciences Mathématiques, Physiques et
Naturelles 2(4): 285.
Watson, L., and M. J. Dallwitz. 1992 onwards. The grass genera of the world:
descriptions, illustrations, identification, and information retrieval; including
synonyms, morphology, anatomy, physiology, phytochemistry, cytology,
classification, pathogens, world and local distribution, and references. Version: 23rd July 2012.http://delta-intkey.com.
Wiley Publisher. http://www.wiley.com/WileyCDA/Section/id-301464.html. (accessed May 12, 2015)

20
CHAPTER II - MOLECULAR PHYLOGENETIC STUDY
I. INTRODUCTION
Some broad scope studies on Andropogoneae, Panicoideae, and Paniceae
included a small representation from Bothriochloa, Capilipedium, and Dichanthium
(BCD). Mathews et al. (2002) showed that Dichanthium aristatum is a sister
lineage to the clade that included Bothriochloa odorata and Capillipedium
parviflorum based on a molecular phylogeny using phyB, GBSSI, and ndhF.
Guissani et al. (2001) and Moronne et al. (2012) found out that Bothriochloa bladhii
was sister to Dichanthium aristatum. These two taxa were in one clade sister to
Capillipedium parviflorum based on ndhF sequences. Teerawatananon et al.
(2009) constructed a phylogenetic tree based on nucleotide sequences from the
combined regions trnL–F, atpβ–rbcL and ITS that resolved Dichanthium theinlwinii
and Capillipedium assimile as sister to each other, with Bothriochloa pertusa as
their next closest taxon. Therefore, using different genomic regions and different
species show different phylogenetic results. However, these studies were not
focused on the compilospecies and sampled only a single species per genus.
Therefore a reliable relationship among the three genera will require a denser
sampling to resolve finer details of genus/species taxonomic relationships.
Fourteen species of Bothriochloa, Capillipedium and Dichantium were
included in the study of Skendzic et al. (2007) using the nuclear (ITS) and the
chloroplast (trnL-F) regions. In both partitioned and combined data sets, BCD was
resolved as a monophyletic clade with 1.0 Posterior Probability (PP) support for
ITS. However, a species from another genus, Euclasta condylotricha, was nested
within the clade containing most Bothriochloa. The exception here is B. grahamii
that appeared as a separate lineage in a polytomy with C. venustum and D.
annulatum. Their trnL-F analysis although recovered the BCD clade (BS=82%,
PP=1.0), it resulted in a complete basal polytomy for all members of the BCD
genera. The tree based on concatenated data sets also recovered the BCD group
(BS=77%, PP=1.0) and demonstrated the monophyly of Bothriochloa, with the

21
exception of B. grahamii that appeared sister to a polytomy of Capillipedium and
Dichanthium. Although they sampled three genera, the study did not address the
compilospecies issue. Estep et al. (2014) in a study of polyploid evolution in the
tribe Andropogoneae showed B. bladhii as the core of the compilospecies and
noted that its genome has similarity with the genomes of Capilipedium and
Dichanthium. They emphasized the importance of allopolyploidy in the defining the relationship within the compilospecies complex.
The objective of this study is to use chloroplast genomic regions to
reconstruct phylogenetic trees with the focus on the Australian taxa as a starting
point for a detailed understanding of the phylogenetic relationship among the compilospecies globally.
II. MATERIAL AND METHODS
1. Taxon sampling and DNA sequencing
Eight species of Bothriochloa, two species of Capillipedium and three species
of Dichanthium, with total 28 accessions were sampled for the study. Two species
of Andropogon were chosen as outgroup based on the phylogenetic affinity of this
genus to BCD (Morrone et al. 2012). The species used and the sources of the
material are listed in Table 4. When available, fresh leaf material was used to
obtain high quality genomic DNA. Otherwise, leaf tissue was removed from
herbarium specimens and used for DNA isolation. Genomic DNA isolation followed
the CTAB protocol of Doyle and Doyle (1990). The Polymerase Chain Reaction
(PCR) was used for amplifying the regions. A 25 μl PCR reaction was prepared by
mixing 2.5 μl 25mM MgCl2 (New England Biolabs), 2.5 μl Thermopol buffer (New
England Biolabs), 5 μl dNTP 1.25 uM, 1 μl of each primer for chloroplast (Taberlet
et al. 1991), and for nuclear (White et al. 1990), 0.2 μl Taq polymerase (ABI),
genomic DNA, and then adjusted with ddH2O. More genomic DNA was necessary
for successful amplification from herbarium specimens. PCR amplification followed
a modification of Woods et al. (2005) protocol using 30 cycles (trnT-F) and a
modified Dunthie and Dunthie (1999) protocol for rps 16 intron using 35 cycles for

22
3’trnK (Liang and Hilu 1996); other components of the protocol remain the same.
The temperature profile consisted of an initial denaturation step at 94°C for 240 s
followed by 30 cycles of DNA denaturation at 94°C for 30 s, primer annealing at
52°C for 30 s, and an extension step at 72°C for 60 s. The final extension was set
at 72°C for 300 s. PCR products were first run on an agarose gel, the DNA
fragment was excised, and cleaned using Promega Wizard® SV Gel and PCR
Clean-Up System. The sequence reaction was set up using an ABI kit (BigDye®
Terminator v3.1 Cycle Sequencing Kit) and following their protocol. Sequencing
was conducted at the Duke IGSP Sequencing Facility.
Sequence phenograms were checked by 4Peaks
(http://nucleobytes.com/index.php/4peaks), and then manually aligned using
Quickalign (Müller and Müller 2003) and PhyDe (Müller et al. 2006). Gaps
(insertions/deletions, indels) were introduced at the cost of two or more substitution
and coded as additional characters using Simmons and Ochoterena (2000) Simple
Coding option in SeqState (Muller 2005). Absence and presence of gaps was
coded as 0 or 1, respectively, and converted into R and Y states that represent purine and pyrimidine.
The initial target was to examine the phylogenetic suitability of six
chloroplast regions: trnT-F, rps 16 intron, 3'trnK, trnH-psbA, rpl 16 intron and petA-
psbJ. The presence of nucleotide variation and indels were two important factors
determining potential effectiveness of region in phylogenetic reconstruction and
consequently in selecting them for the study. The trnT-F, rps 16 intron, and 3’trnK
regions were selected due greater variation in both nucleotide substitution and
indels. However, the rps 16 intron region was difficult to amplify from some of the
accessions, and a single accession failed to amplify the 3'trnK region in spite of
repeated effort (Table 4). Consequently, two approaches (Region Focus and
Taxa-Focus) were needed to handle the missing data issue. In the Region-Focus
approach, 26 accessions were selected based on the presence of all three genomic regions. In the Taxa-Focus approach, 30 accessions were included that

23
Table 4. List of accessions used in the study. Red outline refers to the REGION FOCUS, and shaded green refers to TAXA-FOCUS approaches. Symbol (+) refers to success; (-) refers to fail.
have the trnT-F and 3'trnK regions only. As such, seven data sets were
constructed, five partitioned data sets and two concatenated ones. The data sets
from the Region Focus approach have more sequence characters but fewer
species compare with the data sets from the Taxa-Focus approach. For each

24
approach, individual data sets were analyzed and the trees were compared with
their respective concatenated data sets to evaluate topology, support and tree resolution.
2. Sequence data analysis
The partitioned and concatenated data sets were analyzed using Maximum
Parsimony (MP), Rapid Accelerated Maximum Likelihood (RAxML), as well as by
the Bayesian Inference (BI) to construct the maternal trees. MP analysis was
performed in PAUP (Swofford 2003) with heuristic search and Stepwise Addition
conducted with the random option and 100 replicates. Characters were equally
weighted. A majority rule tree was selected from the shortest trees. A bootstrap
(BS) search with 100 replicates was conducted with ‘Fast’ stepwise addition
retaining groups with frequency of >50%. To evaluate the possibility of combining
data sets from the different chloroplast regions, a Partition Homogeneity Test
(PHT) was conducted in PAUP (Swofford 2003). The test failed to reach
completion after more than seven days of computing time and thus it was
terminated. Nevertheless, the PHT test has been noted to overestimate
incongruence, and consequently data sets are most often combined regardless of
the outcome (Barker and Lutzoni 2002, Darlu and Lecointre 2002).
The RaxML analysis was conducted in the CIPRES portal (Miller et al.
2010), using the BlackBox option. Two species of Andropogon (A. glomeratus and
A. gyrans) were selected as outgroup species based on published work that
demonstrated the close phylogenetic affinity to the compilospecies genera. The
analysis ran for a maximum of 24 hours. Bipartition tree files were downloaded to
visualize the topology with values above 50% BS support using FigTree
(http://tree.bio.ed.ac.uk/software/figtree/).
In the Bayesian Inference (BI), the nexus file of the data sets was first edited
in PAUP (Swofford 2003) to introduce ModelTest commands, and then the data set
was executed in JModeltest v.3.7 (Muller 2005) to select the most appropriate
model for the BI analysis. The ModelTest result showed different chloroplast

25
regions have different models. The BI analysis was conducted using BEAUTI v.1.6
and BEAST v.1.6 by using 10,000,000 generations. The first 1,000,000 were
discarded as burn-in. The quality of the result was checked using Tracer (Rambaut
et al. 2014). TreeAnnotator (http://beast.bio.ed.ac.uk/TreeAnnotator) was used to
construct the tree. Phylogenetic trees with PP support were visualized using
FigTree (http://tree.bio.ed.ac.uk/software/figtree/) and values above 0.95 were
considered as the best confidence level. All supporting values were noted on the
branches as MP BS / RAxML BS / BI PP. PhyDesign (Lopez-Giraldez and
Townsend 2011, Mayrose et al. 2004, Pond et al. 2005) was used to compute the
phylogenetic informativeness of each plastid region, as well as those of the
concatenated data sets. TCS, a computer program to build phylogenetic network
in estimating genealogies by statistical parsimony (Clement et al. 2000) was used
to map the pattern of nucleotide mutations between pairs of sequences of these
three genera. The assessment visualized the homogeneity sequences using
default settings (95% parsimony probability and indels coded as missing data).
III. RESULT
1. Nuclear genome
The amplification of the nuclear genomic regions ITS and 5S generated
inconsistent results, producing either faint or no amplicons despite following
Skendzic et al. (2007) procedure. I modified the PCR protocol by adjusting the
annealing temperature and DNA template concentration but without success.
Therefore, these two genomic regions were dropped from the study.
2. Plastid genome
A. Region-Focus Analyses
Data sets and tree statistic (number of character, number of variable and
non variable character, Parsimony Informative (PI) characters, number of most
parsimonious, tree length, consistency index (CI=0.771), retention index (RI=
0.833) and homoplasy index (HI=0.229) are reported in Table 5 for analyses based

26
on partitioned and concatenated data sets. Three adenine poly-nucleotide regions
were excluded from the analysis. These regions were at position 84-95 and 760-
768 (8-12 nucleotides in each position) and 422-433 (8-9 nucleotides). Summaries
of the results are shown in Table 5 for Region-Focus.
Table 5. The summary of the analyses of three regions of individual data sets of trnT-F, rps 16 intron, 3’trnK and concatenated data sets. Included are alignments statistic and substitution models for each region, and support for clades. N: not resolved, (p): paraphyletic, (-): BS <50% or PP<0.95.
trnT-F rps 16 intron 3'trnK
3-regions concatenation
Characters 1681 779 477 2937
Substitution 62 14 8 84
Indels 20 8 6 34
Tree number/
length 696/131 16/11 1/8 701/110
Substitution
Model F81 + G +I F81 F81 F81 + G + I
B. bladhii 72%/68%/- -/-/- 65%/73%/0.99 65%/82%/0.99
B. decipiens 92%/82%/-
-/56%/-
(p) -/81%/-(p) 54%/93%/-
B. ewartiana 97/97/- -/88%/- 59%/96%/0.99 97%/100%/0.99
B. insculpta N 77%/91%/0.99 60%/70%/0.99 -/99%/0.99
B. ischaemum -/64%/- 68%/73%/0.99 (p) N -/85%/-
B. macra 72%/64%/0.99 -/-/- N -/79%/0.99
Capillipedium 98%/98%/0.99 74%/78/%0.99 N 95%/100%/0.99
Dichanthium (p) -/60%/- 57%/69%/- 55%/75%/0.99 -/81%/0.98
Based on partitioned data sets of the three genomic regions, none of the
three analyses (MP, RAxML and BI) recovered Bothriochloa and Dichanthium as
monophyletic lineages (Fig. 4, appendix with MP and BI trees). Capillipedium, on

27
the other hand, formed a single clade with the trnT-F and rps 16 intron sequence
data while it appeared as a grade in the 3’trnK based tree with all three analyses
(Fig. 4, appendix with MP and BI trees). The tree based on the concatenated data
set again did not resolved Bothriochloa and Dichanthium as monophyletic lineages,
but also recovered Capillipedium in a single clade (Fig. 4, appendix with MP and BI
trees). In both partitioned and concatenated analyses, B. ewartiana was
monophyletic (Fig. 4, appendix with MP and BI trees). The phylogenetic position of
B. ewartiana is inconsistently resolved in the tree based on the individual genomic
regions. Bothriochloa bladhii is monophyletic in all trees except the on trnT-F-
based tree. With the exception of the tree based on the 3’trnK data set,
Capillipedium and B. decipiens clades were sister to each other. There is a
general trend showing phylogenetic affinities between B. macra and B. insculpta.
Another trend reflected phylogenetic affinity between B. ischaemum and
Dichanthium.
Based on the per site informativeness results (Fig. 5), the concatenated data
sets included more phylogenetic information than each of the individual data sets.
Of the individual chloroplast regions, trnT-F (black) has the most information
followed by the rps 16 intron (blue), and then the 3'trnK (green).
B. Taxa-Focus Analyses
Data sets and tree statistic (number of character, number of variable and non
variable character, Parsimony Informative (PI) characters, number of most
parsimonious, tree length, are reported in Table 6 for analyses based on
partitioned and concatenated data sets. Concatenated data set has consistency
index (CI=0.771), retention index (RI= 0.614) and homoplasy index (HI=0.229).
Three adenine poly-nucleotide regions were excluded from the analysis due to no
variation available though could skew the reading of the next nucleotide after this
region. These regions were at position 84-95 and 760-768 (8-12 nucleotides in
each position) and 422-433 (8-9 nucleotides). A summary of Taxa-Focus statistic
is reported in Table 6.

28
Figure 4. Phylogenetic trees derived from the REGION FOCUS are compared side by side: trnT-F (Left), 3'trnK (Middle left), rps 16 intron (Middle right) and concatenated data sets (Right). Outlines refer to the clades (1, 2, and 3). Values above the nodes refer to MP BS/RAxML BS. Values under the node denote BI PP. Legend: Aglom: A. glomeratus, Agy: A. gyrans, isc: B. ischaemum, ewa: B. ewartiana, ins: B. insculpta, C.pv: C. parviflorum, C.sp: C. spicigerum, D.an: D. annulatum, D.ar: D. aristatum, D.se: D. sericeum.

29
The Taxa-Focus data sets encompasses the trnT-F and 3’trnK region and a total of
13 species and 30 accession including the outgroup species, with two additional
species (4 accessions). The trnT-F based tree as well as the concatenated based
tree recovered three major clades refers to here as clade 1, 2, and 3. Support for
these clades was low or lacking and their position in the tree varied (Fig. 6,
Figure 5. Sites informativeness curve generated by PhyDesign for the trnT-F, rps 16 intron, 3’trnK regions individually and their concatenated data set. The X-axis represents the relative age and the Y-axis represents informativeness.
appendix MP and BI). However, the tree based on 3’trnK data resulted in a grade
with B. decipiens and one accession of B. macra (#266) sister to the remaining
taxa. Support for the backbone of this tree was very low. Bothriochloa decipiens is
recovered monophyletic for the most part of the analyses (Fig. 6, appendix with MP

30
and BI). Clade 1 consisted of B. decipiens plus Capillipedium sister to B.
ewartiana in both trnT-F and concatenated data sets. Clade 2 consisted of B.
bladhiii, B. ischaemum, B. bunyensis, and Dichanthium. However, the structure of
the clade differs from the trees based on the trnT-F and concatenated data sets.
Bothriochloa bladhii is recovered as a monophyletic lineage with the concatenated
and 3’trnK data sets but not with the trnT-F data set.
Table 6. The summary of the analysis of individual regions of trnT-F, 3’trnK and concatenated data sets for the Taxa-Focus approach. Statistic and substitution models of each region, support for monophyly and clades. Information includes of statistic and substitution models of each region, support for monophyly and clades. N: not resolved, (p): paraphyletic, (-): BS <50% or PP<0.95. trnT-F 3'trnK trnT-F + 3'trnK
Character 1681 477 2158
Substitutions 62 8 70
Indels 20 6 26
Tree number
/length ¥/91 126/13 1188/113
Substitution
Model F81 + G + I F81 F81 +G
B. bladhii N 55%/70%/- 65%/74/0.97
B. decipiens -/77%/- -/78%/- 55%/93%/-
B. ewartiana 96%/97%/0.97 -/95%/- 100%/100%/0.99
B. insculpta N 61%/72%/- 55%/74%/0.99
B. ischaemum -/55%/- -/63%/- (p) -/54%/0.99
B. macra 66%/55%/0.99 N -/53%/- (p)
B. bunyensis -/56%/- N -/69%/-
B. erianthoides -/80%/- N -/74%/0.96
Capillipedium 97%/99%/0.99 N 98%/99%/0.99
Dichanthium (p) -/63%/- N -/51%/-

31
Figure 6. Phylogenetic trees derived from the TAXA-FOCUS trees are compared side by side. The trees are TrnT-F (Left), 3'trnK (Middle) and concatenated data sets (Right). Outlines refer to the clades (1, 2, and 3). Values above the nodes refer to MP BS/RAxML BS. Values under the node refer to BI PP. Legend: Aglom: A. glomeratus, Agy: A. gyrans, bun: B. bunyensis, eri: B. erianthoides, isc: B. ischaemum, ewa: B. ewartiana, ins: B. insculpta, C.pv: C. parviflorum, C.sp: C. spicigerum, D.an: D. annulatum, D.ar: D. aristatum, D.se: D. sericeum.

32
Clade 3 consisted of B. macra, B. insculpta, and B.erianthoides. Bothriochloa
macra accessions formed a grade, B. erianthoides appeared in a clade, while B.
insculpta formed a clade in concatenated data set but only one of the two
accession appeared in clade 3; the other accession appeared in clade 2.
Figure 7. Sites informativeness curve generated by PhyDesign for the trnT-F and 3’trnK regions and their concatenations. The X-axis represents the relative age and the Y-axis represents informativeness.
In both Region-Focus and Taxa-Focus approaches, the MP and BI analyses
of the partitioned data sets resulted in some rearrangements but those changes did
not receive significant BS and PP support. However, analysis of the concatenated
data sets with BI and MP resulted in topologies that were highly congruent with that
derived from the RAxML analysis. In general, support for lineages was higher with
concatenated data sets than with the individual regions.
Per sites informativeness for the two regions was similar to that of the
Region-Focus (Fig. 7). The concatenated data set (red) has higher per site and net
informativeness compared with informativeness in either one of the two regions.

33
The 3’trnK region displayed the lowest amount of phylogenetic information across
the history of the compilospecies probably due to low degree of nucleotide
substitution.
IV. DISCUSSION
Compared with morphological analyses where the Bothriochloa,
Capillipedium and Dichanthium genera were recovered as monophyletic units, the
molecular phylogenetic analyses based on the partition and concatenated data
sets only recovered Capillipedium as a monophyletic genus. Both Bothriochloa
and Dichanthium are paraphyletic. Since the concatenated data sets resulted in
the most robust phylogeny, further discussion will focus on the phylogeny derived
from them. Knowing that the three genomic regions are derived from the
chloroplast genome, which is maternally inherited, the discussion of relationship of
the taxa will reflect the maternal phylogeny for the compilospecies.
What stands out is that the topology of the tree based on the concatenated
data sets is highly congruent with the species relationship and pattern of
hybridization in the compilospecies (Fig. 8) proposed by De Wet and Harlan
(1970). In the Region-Focus analyses, B. bladhii, B. ewartiana, B. ischaemum
appeared in one clade, which is similar to the pattern of species hybridization noted
in the compilospecies. This clade also included all three species of Dichanthium.
Members of the genus Dichanthium were proposed by De Wet and Harlan (1970)
to hybridize with species of Bothriochloa through B. grahamii. This latter species is
not in Australia and thus was not included in the study.
In clade 1, Capillipedium is sister to B. decipiens. De Wet and Harlan
(1970) showed that Capillipedium hybridizes with Bothriochloa through C.
parviflorum and B. glabra (a synonym of B. bladhii). However, they did not include
B. decipiens in the compilospecies. This finding points to a link between
Capillipedium and Bothriochloa through B. decipiens, a new, most parsimonious
hypothesis that needs to be verified by interspecific hybridization. A similar
situation relates to the placement of B. macra and B. insculpta in the tree is
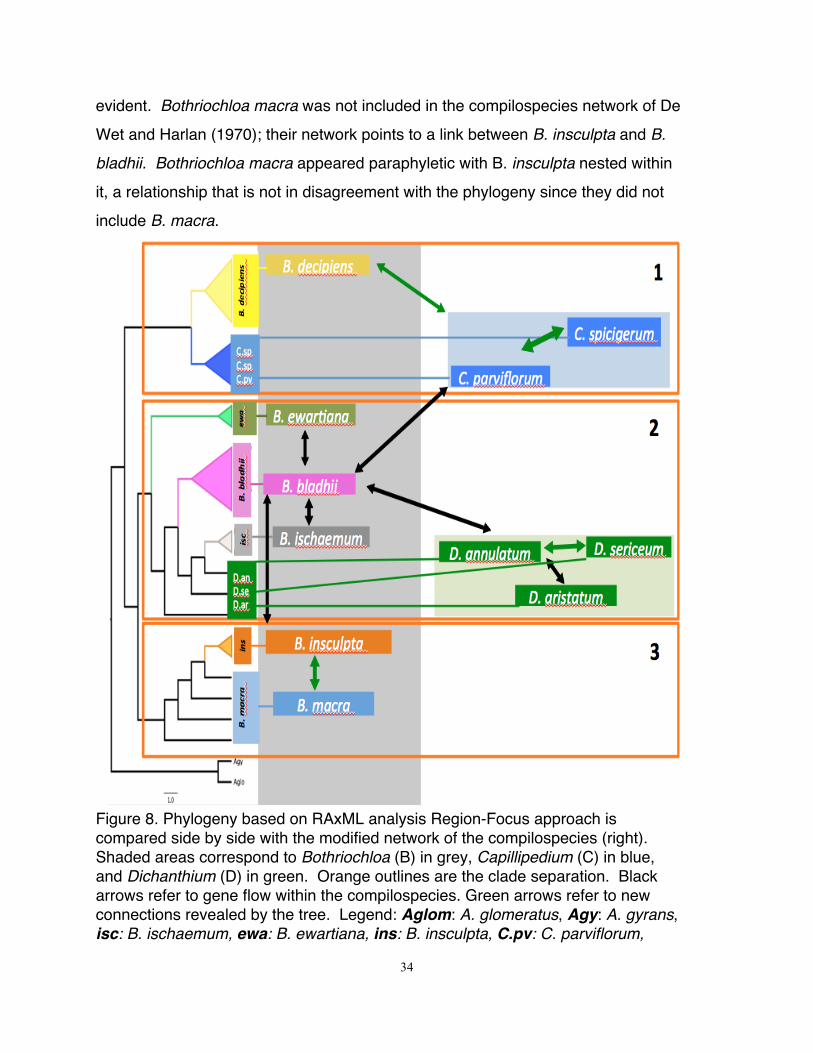
34
evident. Bothriochloa macra was not included in the compilospecies network of De
Wet and Harlan (1970); their network points to a link between B. insculpta and B.
bladhii. Bothriochloa macra appeared paraphyletic with B. insculpta nested within
it, a relationship that is not in disagreement with the phylogeny since they did not
include B. macra.
Figure 8. Phylogeny based on RAxML analysis Region-Focus approach is compared side by side with the modified network of the compilospecies (right). Shaded areas correspond to Bothriochloa (B) in grey, Capillipedium (C) in blue, and Dichanthium (D) in green. Orange outlines are the clade separation. Black arrows refer to gene flow within the compilospecies. Green arrows refer to new connections revealed by the tree. Legend: Aglom: A. glomeratus, Agy: A. gyrans, isc: B. ischaemum, ewa: B. ewartiana, ins: B. insculpta, C.pv: C. parviflorum,

35
C.sp: C. spicigerum, D.an: D. annulatum, D.ar: D. aristatum, D.se: D. sericeum. The Taxa-Focus (Fig. 9) approach also added the Australian endemics
species B. bunyensis and B. erianthoides. The tree topology from this approach
using the concatenated data set is almost identical with that based on the
concatenated data set of the Region–Focus approach. The exception is the shift in
the position of B. ewartiana from clade 2 to clade 1 as sister to Capillipedium plus
B. decipiens, but support for the new placement of B. ewartiana is lacking and thus
it represents soft incongruence. Bothriochloa erianthoides appeared sister to the
B. macra plus B. insculpta clade. Bothriochloa bunyensis on the other hand
appeared sister to D. sericeum (RAxML BS=62%, PP=0.97) in a clade consisted of
B. bladhii, B. ischaemum, and Dichanthium. These phylogenetic associations may
reflect their chloroplast maternal inheritance, but information on their potential
hybridization is not available.
1. Integration of Phylogenetic tree, Nucleotide substitution network and
Compilospecies complex of De Wet and Harlan (1970)
Figure 8 was constructed to integrate phylogenetic relationships and the
compilospecies relationship envisioned in De Wet and Harlan (1970). In clade 1
(Fig. 8), the compilospecies network showed Capillipedium species hybridizing with
B. bladhii. In contrast, our phylogeny revealed phylogenetic relationship between
Capillipedium and B. decipiens and then a sister relationship of the two to
remaining species. Our network analysis demonstrates that B. decipiens is the
ancestral species in the compilospecies complex (Fig. 9). Bothriochloa decipiens
is not included in De Wet and Harlan (1970) study and data are not available on
potential hybridization of B. decipiens with other compilospecies, therefore this
finding represents a new hypothesis that need to be tested. The phylogeny points
to the Capillipedium species as potential ancestral chloroplast genome donors to
remaining compilospecies including B. bladhii, which is in partial agreement with
their compilospecies concept.

36
Figure 9. Phylogeny based on RAxML analysis Taxa-Focus approach is compared side by side with the modified network of the compilospecies(right). Shaded areas correspond to Bothriochloa (B) in grey, Capillipedium (C) in blue, and Dichanthium (D) in green. Orange outlines refer to clade separation. Black arrows refer to gene flow based on compilospecies. Green arrows refer to new connections revealed by the tree. Legend: Aglom: A. glomeratus, Agy: A. gyrans, bun: B. bunyensis, eri: B. erianthoides, isc: B. ischaemum, ewa: B. ewartiana, ins: B. insculpta, C.pv: C. parviflorum, C.sp: C. spicigerum, D.an: D. annulatum, D.ar: D. aristatum, D.se: D. sericeum.

37
In clade 2 (Fig. 8), the grouping of B. ewartiana, B. bladhii, B. ischaemum
and Dichanthium is also reflected in De Wet and Harlan (1970) compilospecies
network. They showed B. bladhii linked to these three Bothriochloa species
directly, and indirectly to Dichanthium through B. grahamii (not included in this
study). Therefore, the structure and composition of clade 2 is in agreement with
De Wet and Harlan (1970) proposed patterns of hybridization. Since this is a
maternal phylogenetic tree, it does not reflect the proposed interbreeding between
B. bladhii and other Bothriochloa and Dichanthium species. The TCS network
(Fig. 10) revealed that B. ischaemum and D. annulatum on one hand and B.
ewartiana on the other hand are connected to B. bladhii through B. decipiens. This
kind of relationship is similar to the one proposed by De Wet and Harlan (1970),
differing only by the presence of B. decipiens in our study and is lacking from their
study. Therefore, the addition of B. decipiens resulted in a modification of their
compilospecies network.
In clade 3 (Fig. 8), B. macra was not included in De Wet and Harlan (1970)
network. However, they showed that B. insculpta interbreed with B. bladhii. The
phylogeny showed that B. insculpta is nested within B. macra. The placement of
B. macra could be proposed into compilospecies complex. This path of
interbreeding is not in disagreement with the compilospecies since the B. macra
plus B. insculpta clade is sister to clade 2 that includes B. bladhii in maternal
phylogeny. Further, based on the TCS network (Fig. 10), B. decipiens is connected
B. bladhii and also to B. macra then to B. insculpta, which is in agreement with De
Wet and Harlan (1970) network.

38
Figure 10. TCS define network based on concatenated of the Region-Focus (trnT-F + rps 16 intron + 3’trnK) data set with 95% parsimony, with gaps treated as missing data. Square indicates ancestral, Outgroup (Andropogon) in red, Capillipedium in blue and Dichanthium in green.
In the Taxa-Focus network (Fig. 9), the rps 16 intron was eliminated and B.
bunyensis and B. erianthoides were added. The rps 16 intron although has less
phylogenetic informativeness than the trnT-F but it is by far more informative than
the 3’trnK. The exclusion of the rps 16 intron and the addition of the two
Bothriochloa species resulted in some changes in the network. In this case, the
newly added species B. bunyensis emerged as an ancestral species to remaining
taxa since it is the first that connect to the outgroup Andropogon. This relationship

39
was not apparent in the phylogenetic tree based on the same concatenated data
set (Fig. 9). Bothriochloa bunyensis has a significant amount of missing data, a
factor that might have effected its placement. In addition, B. insculpta and B.
bunyensis appeared as two potential central species in the network. The pattern of
links among the species in the Taxa-Focus TCS network is not congruent with the
pattern of species relationship of the corresponding phylogenetic tree (Fig. 11).
The noted differences between the Region-Focus TCS network and the Taxa-
Focus network may be due to both the missing data in B. bunyensis and the
addition of the two Bothriochloa species. Whereas, the difference between the
TCS of the Region-Focus network and the corresponding phylogeny may be
possible due to the sensitivity of TCS to the missing data in B. bunyensis.
Figure 11. TCS network based on concatenated of the Taxa-Focus (trnT-F + 3’trnK) of the region Focus approach with 95% parsimony and gap treated as missing data. Square refers to ancestral, outgroup (Andropogon) in Red, Capillipedium in blue and Dichanthium in green.

40
2. Other regions of trnH-psbA, rpL 16 intron, and petA-psbJ
Although trnH-psbA is a commonly used region in plant systematics, in this
study this region exhibited with only single substitution and no indels over a 500
nucleotide sequence. The rpL 16 intron (500 bp) and petA-psbJ (300 bp) regions
could not be aligned properly. The lack or low amount of variation in these regions
from is the main factor for excluding them from further analysis. Low rates of
nucleotide substitution in Andropogoneae has been mentioned by Mason-Gamer et
al. (1998) for GBSSI, Spangler et al. (1999) for ndhF, Lukens and Doebley (2001)
for tb1, and Mathews et al. (2002) for PHYB.
V. CONCLUSION
In these chloroplast-based phylogenies, only Capillipedium appear
monophyletic, whereas both Bothriochloa and Dichanthium are paraphyletic. This
is in contrast with the results of the morphological analyses where all three genera
were recovered as monophyletic units. Therefore, hybridization does not seem to
blur the morphological species boundaries, and the species relationship in the
molecular phylogeny provided insight into the maternal pattern of species
relationship within the context of hybridization. When the topology of the trees
based on concatenated data set is compared with the TCS network and the De
Wet and Harlan (1970) network, a high degree of congruent is noted. However,
the addition of species in our study that were missing from the De Wet and Harlan
(1970) work provided new understanding of the compilospecies complex in the
form of a hypothesis that can be tested by hybridization. The results of the study
can benefit greatly from the inclusion of markers from the bipaternally inherited
nuclear genome.

41
VI. REFERENCES 4Peaks. V. 1.7 2005. Available from http://nucleobytes.com/index.php/4peaks
Barker, F. K. and Lutzoni, F. M. 2002. The utility of the incongruence length
difference test. Systematic Biology 51: 625–637.
Clement, M., Posada, D, and K. Crandall. 2000. TCS: a computer program to
estimate gene genealogies. Molecular Ecology 9(10): 1657-1660.
Darlu, P. and Lecointre, G. 2002. When does the incongruence length difference
test fail? Molecular Biology and Evolution 19: 432–437.
Downie, S. R. and D. S. Katz-Downie. 1999. Phylogenetic analysis of chloroplast
rps16 intron sequences reveals relationships within the woody southern
African Apiaceae subfamily Apioideae. Canadian Journal of Botany 77:
1120–1135.
Doyle, J. J. and J. L. Doyle. 1990. A rapid total DNA preparation procedure for
fresh plant tissue. Focus 12:13-15.
Estep, M. C., M. R. McKain, D. Vela Diaz, J. Zhong, J. G. Hodge, T. R. Hodkinson,
D. J. Layton, S. T. Malcomber, R. Pasquet, and E. A. Kellogg 2014.
Allopolyploidy, diversification, and the Miocene grassland expansion. PNAS.
111 (42):15149-15154.
Giussani LM, J.H. Cota-Sanches, F.O. Zuloaga and E.A. Kellogg. 2001. A
molecular phylogeny of the grass subfamily Panicoideae (Poaceae) shows
multiple origins of C4 photosynthesis. American Journal of Botany 88:
1993–2012.
Drummond A. J., A.Rambaut. 2007. BEAST: Bayesian evolutionary analysis by sampling
trees. BMC Evolutionary Biology, 7, 214.
FigTree. v1.3.1 2009. Available from http://tree.bio.ed.ac.uk/software/figtree/

42
Liang, H. and K. W. Hilu. 1996. Application of the matK gene sequences to grass
systematics. Canadian Journal of Botany 74: 125-134.
Lopez-Giraldez, F., and Townsend, J.P. 2011. PhyDesign: an online application for profiling phylogenetic informativeness. BMC Evolutionary Biology (11): 152.
Lukens L., and J. Doebley. 2001 Molecular evolution of the teosinte branched gene
among maize and related grasses. Molecular Biology and Evolution 18: 627–638.
Maddison, D. R. and W. P. Maddison, 2005. MacClade 4: Analysis of phylogeny and
character evolution. Version 4.08a. http://macclade.org.
Mason-Gamer R. J., C. F. Weil, and E. A. Kellogg 1998 Granule-bound starch
synthase: structure, function, and phylogenetic utility. Molecular Biology and Evolution 15:1658–1673.
Mathews, S., R. E Spangler, R. J. Mason-Gamer, and E. A. Kellogg. 2002.
Phylogeny of Andropgoneae inferred from Phytochrome B, GBSSI and NDHF. International Journal of Plant Sciences 163 (3): 441-450.
Mayrose, I., D. Graur, N. Ben-Tal, and T. Pupko. 2004. Comparison of Site-Specific
Rate-Inference Methods for Protein Sequences: Empirical Bayesian Methods Are Superior. Molecular Biology and Evolution, (21): 1781-91.
Miller, M.A., W. Pfeiffer, and T. Schwartz. 2010. Creating the CIPRES Science
Gateway for inference of large phylogenetic trees in Proceedings of the
Gateway Computing Environments Workshop (GCE), New Orleans, LA: 1 -
8.
Morrone, O., L. Aagesen, M.A. Scataglini, D.L. Salariato, S.S. Denham, M.A.
Chemisquy, S.M. Sede, L.M. Giussani, E.A. Kellogg and F.O. Zuloaga.
2012. Phylogeny of the Paniceae (Poaceae: Panicoideae): integrating
plastid DNA sequences and morphology into a new classification. Cladistics
(28) 333–356.
43
Müller K. 2005. SeqState - primer design and sequence statistics for phylogenetic
DNA data sets. Applied Bioinformatics , 4:65-69
Müller K, D. Quandt, J. Müller, C. Neinhuis. 2006. PhyDE®: Phylogenetic Data
Editor, version 0.995. Program distributed by the authors. PhyDE website. Available:www.phyde.de.
Müller, K. 2004. Quickalign, version 1.03. http://bioinfweb.info/Software/QuickAlign.
Pond, S.L.K., Frost, S.D.W., and Muse, S.V. 2005. HyPhy: hypothesis testing using
phylogenies. Bioinformatics, 21(5): 676–9.
Posada, D. 2008. jModelTest: Phylogenetic Model Averaging. Molecular Biology
and Evolution. 25 (7): 1253-1256.
Rambaut A, M. A. Suchard, D. Xie, and A. J. Drummond. 2014. Tracer v1.6,
Available from http://beast.bio.ed.ac.uk/Tracer
Shanker, A. 2013. Paraphyly of bryophytes inferred using chloroplast sequences.
Archive in Bryology 163: 1-5 of Plant Sciences. 163 (3): 441–450.
Simon, M. P. and H. Ochoterena. 2000. Gaps as Characters in Sequence-Based
Phylogenetic Analyses. Systematic Biology. 49(2): 369-381.
Skendzic, E. M., J. T. Columbus, and R. Cerros-Tlatilpa. 2007. Phylogenetics of
Andropogoneae (Poaceae: Panicoideae) based on nuclear ribosomal
internal transcribed spacer and chloroplast trnL–F sequences. Aliso: 530–
544.
Song, B.-H., X.-Q Wang, F.-Z Li, D.-Y Hong. 2001. Further evidence for paraphyly
of the Celtidaceae from the chloroplast gene matK Plant Systematics and
Evolution 228 (1-2): 107-115.
Spangler, R., B. Zaitchik, E Russo, E. A. Kellogg. 1999. Andropogoneae evolution
and generic limits in Sorghum (Poaceae) using ndhF se-quences.
Systematics Botany 24: 267–281.
Swofford, D.L. 2003. PAUP. Phylogenetic Analysis Using Parsimony .Version 4.
Sinauer Associates, Sunderland, Massachusetts.
P. Taberlet, L. Gielly, G. Pautou, J. Bouvet. 1991. Universal primers for amplification of

44
three non-coding regions of the chloroplast DNA.
Plant Molecular Biology, 17: 1105–1109.
Teerawatananon, A., S. W. L. Jacobs and T. R. Hodkinson. 2009. Phylogenetics of
Panicoideae (Poaceae) based on chloroplast and nuclear DNA sequences. Telopea 13(1–2) 115–142.

45
VII. APPENDICES Appendix A. Region Focus trnT-F
Legend: Aglom: A. glomeratus, Agy: A. gyrans, isc: B. ischaemum, ewa: B.
ewartiana, ins: B. insculpta, C.pv: C. parviflorum, C.sp: C. spicigerum, D.an: D.
annulatum, D.ar: D. aristatum, D.se: D. sericeum.

46
Appendix B. Region Focus rps16 intron
Legend: Aglom: A. glomeratus, Agy: A. gyrans, isc: B. ischaemum, ewa: B.
ewartiana, ins: B. insculpta, C.pv: C. parviflorum, C.sp: C. spicigerum, D.an: D.
annulatum, D.ar: D. aristatum, D.se: D. sericeum.

47
Appendix C. Region Focus 3’trnK
Legend: Aglom: A. glomeratus, Agy: A. gyrans, isc: B. ischaemum, ewa: B.
ewartiana, ins: B. insculpta, C.pv: C. parviflorum, C.sp: C. spicigerum, D.an: D.
annulatum, D.ar: D. aristatum, D.se: D. sericeum.

48
Appendix D. Region Focus concatenated data set
Legend: Aglom: A. glomeratus, Agy: A. gyrans, isc: B. ischaemum, ewa: B.
ewartiana, ins: B. insculpta, C.pv: C. parviflorum, C.sp: C. spicigerum, D.an: D.
annulatum, D.ar: D. aristatum, D.se: D. sericeum.

49
Appendix E. Taxa Focus trnT-F
Legend: Aglom: A. glomeratus, Agy: A. gyrans, bun: B. bunyensis, eri: B.
erianthoides, isc: B. ischaemum, ewa: B. ewartiana, ins: B. insculpta, C.pv: C.
parviflorum, C.sp: C. spicigerum, D.an: D. annulatum, D.ar: D. aristatum, D.se: D.
sericeum.

50
Appendix F. Taxa Focus 3’trnK
Legend: Aglom: A. glomeratus, Agy: A. gyrans, bun: B. bunyensis, eri: B.
erianthoides, isc: B. ischaemum, ewa: B. ewartiana, ins: B. insculpta, C.pv: C.
parviflorum, C.sp: C. spicigerum, D.an: D. annulatum, D.ar: D. aristatum, D.se: D.
sericeum.

51
Appendix G. Taxa Focus concatenated data set
Legend: Aglom: A. glomeratus, Agy: A. gyrans, bun: B. bunyensis, eri: B.
erianthoides, isc: B. ischaemum, ewa: B. ewartiana, ins: B. insculpta, C.pv: C.
parviflorum, C.sp: C. spicigerum, D.an: D. annulatum, D.ar: D. aristatum, D.se: D.
sericeum.

52
CHAPTER III – CHROMOSOME NUMBER AND GENOMIC CONTENT
I. INTRODUCTION
The best way to assess the ploidy level of a taxon is by counting the
chromosomes. The number of chromosomes for a single species can vary greatly
in the cases of aneuploidy and eupolyploidy. Polyploidization is the most common
and important process that can give rise to a new species (Soltis and Soltis 1999,
Levy and Feldman 2002, Madlung 2013). Polyploids could arise from chromosome
doubling in somatic cells as autopolyploidy. However, autopoliploidy more
commonly arises from cytologically unreduced gametes (De Wet 1971). Polyploidy
can associate with hybridization resulting in allopolyploidy. Bothriochloa has a
basic chromosome number x = 10 with 2n = 20, 30, 40, 50, and 120. The ploidy
level of this genus may be 2x, 4x, 5x, 6x, or 12x, and aneuploidy is common. Table
7 lists the different number of chromosomes of various Bothriochloa, Capillipedium
and Dichanthium (BCD) species based on previous chromosome counts (Gould
1956, Singh and De Wet 1960, Cheeda and Harlan 1961, Watson and Dallwitz
1992). Bothriochloa bladhii and B. ischaemum show the greatest variation in
chromosome level for the sporophytic stage, followed by B. insculpta. Surprisingly,
there are no chromosome counts reported for B. ewartiana, B. macra, and B.decipiens.
Hybridization that occurs among the BCD taxa leads to the reasonable
assumption that variation in chromosome number in Capillipedium and
Dichanthium are expected. Capillipedium spicigerum (2n= 40) resembles a hybrid
between B. intermedia (2n= 40, now considered as B. bladhii) and C. parviflorum
(2n= 40) (Harlan et al. 1962). However, B. intermedia x C. spicigerum hybrids
resulted in 2n= 47, whereas B. intermedia (2n=40) x C. parviflorum (2n=40)
resulted in 2n= 40 hybrids (De Wet et al. 1961). The chromosome count database
(Rice et al. 2014) provides the latest compilation of chromosome numbers for these three genera (Table 7).

53
Estep et al. (2014), in their study of the Andropogoneae, summarized the
congruency between their work on the phylogeny of the BCD group with the
hybridization experiments of De Wet and Harlan (1970). They found that
tetraploidization and hexaploidization occurred during lineage separation. Several
of B. bladhii accessions were found to bear Capillipedium and Dichanthium
genomes, which explains the hybridization and introgression leading to the compilospecies situation.
Table 7. Recorded chromosomes number of various species of Bothriochloa, Capillipedium, and Dichanthium based on chromosome number database Rice et al. (2014) (http://ccdb.tau.ac.il/).
Species Sporophytic (2n) / Gametophytic (n) Bothriochloa bladhii 30, 34-44, 50, 60, c.70, 80 Bothriochloa insculpta 50,60 Bothriochloa ischaemum 30, 31, 36, 40, 42, 45, 50, 60 Capillipedium parviflorum 20, 40, 60 Capillipedium spicigerum 40 Dichanthium aristatum 20, 40, 50, 60 Dichanthium annulatum 20, 40, 60 Dichanthium sericeum 5
The objectives of this study are to count the chromosomes and estimate
genomic contents using Flow cytometry to provide more information on the
polyploidy level in the compilospecies. The information will be interpreted in the
context of phylogeny and proposed network of hybridization. Flow cytometry is the
fast, easy and robust way to determine genomic content and to infer polyploidy levels (Doležel et al. 1994, Doležel et al. 2007, Loureiro et al. 2008).

54
II. MATERIALS AND METHODS 1. Chromosomal counting The materials were derived from fresh meristematic leaf sample of 10 species
from USDA –GRIN. Cytological preparations were made to determine the ploidy
level in root tip meristematic cells from both mature plants and seedlings. Pollen
from developing anthers was also examined for chromosome number.
Preparations from mature plants and pollen failed but chromosome were observed
from mitotic squashes of root tips collected from germinated seeds. Leaf materials
were treated at room temperature (20--25 °C) for two hour with
paradichlorobenzena to stop spindle fiber formation and separate homologous
chromosomes. Fixation followed the pretreatment by placing seedings in a fixative
solution of ethanol:acetic acid glacial (3:1) for 20 minute. Samples were then
macerated with HCl:ethanol 70% (1:1) for 5 minute at room temperature, placed in
Basic Fuchsin for 10 minutes, and stained in 45% acetocarmine. Then, the root
tips were cut and put on a slide. Observation and chromosome counting were
conducted under a microscope (Olympus CHT, Ch-2) with 400x magnification.
2. Flow cytometry
Flow cytometry buffer was made by mixing 882 mg sodium citrate, 419 mg
MOPS, 915 mg MgCI2, 0.1 ml Triton X-100, and 250 ml distilled water. Meristem
tissue from the basal portion of young folded leaves was chopped using a razor
blade on petri glass after adding the buffer. The chopped materials were double
filtered using two cylinders (250 um on the top and 63 um on the bottom) into a 1.5
ml tube and placed on ice. Two hour before flow-cytometry, 0.5 ml of
Ribonuclease A (40 mg RNAse in 50 ml chopping buffer) was added. The
digestion of RNA occurred at room temperature. One hour before the flow
cytometry, 0.125 ml of propidium iodide (PI) stain (6.0 mg PI in 15 ml chopping buffer) was added to the sample and kept on ice.

55
These samples were run at the Virginia-Maryland Regional College of
Veterinary Medicine Flow Cytometry Core Facility using their BD FACSCallibur
Flow cytometer. FlowJo software (Treestar Inc.) was used for further analysis.
The graph of the FlowJo result consists of three peaks, two minor one and a major
peak. The major peak represents the diploid cell count. The first minor peak on
left of the major peak is caused by over-chopping of the leaf, while the third peak on the right of the major one corresponds to cells in mitosis (Fig. 12).
Figure 12. The peaks observed in the Flow cytometry experiments. The small first peak represents debris resulted from over chopping. The major peak in the middle (2) represent the most ploidy detected while the small peak (3) was the mitosis result. Y-axis representes the number of nuclear count and the X-axis represents the relative value of the ploidy level Notice that the value of peak # 3 on the X-axis is double of peak # 2.
Flow cytometry was run in duplicate or triplicate for each accession for
accuracy in the measurement of the ploidy level. The value of the peak is the
average of the measurements (minimal two) of each accession. The value for a species is the mean from all accessions for that particular species.
Flow cytometry is calibrated against an accession with known chromosome
count. In this case, one set of chromosomes (haploid) gives a value of about 100
on the graph, therefore 200 refer to diploid and 400 would be tetraploid cytotypes.
The rest of the Flow cytometry results were calibrated using this standard. Some

56
accessions had value not in an increment of 100 (e.g. 250). In this circumstance, the species would be considered diploid with a larger genomic content.
III. RESULTS AND DISCUSSION
Chromosome counting yielded in only one good result where B. macra 264
was determined to have ca. 40 chromosomes (tetraploid). Flow cytometry
demonstrated that the majority of the accessions were either diploid (200) or
tetraploid (400), with no hexaploid detected (Table 8). Some accessions had larger
than normal values (250), such as B. ischaemum, B. ewartiana, B. decipiens, and
D. aristatum. Since their values were between 200 and 300, these accessions
were considered diploid but with a larger genome content since no species are
known to be triploid. This is evidently detects aneuploidy or diploid with larger
chromosome. Table 8 compares flow cytometry with chromosome counts from De Wet and Harlan (1970), Estep et al. (2014) and Rice et al. (2014).
The Flow cytometry results were congruent with most of the published
chromosome data. By applying a flexible delimitation on genomic content, I
deducted that, B. decipiens (250) was diploid, whereas B. insculpta (400),
Capillipedium spp. (400), and D. annulatum (400) were tetraploid (Table 8). For
several species, our results were in disagreement with previous work (De Wet and
Harlan 1970, Rice et al. 2014, Estep et al. 2014). Bothriochloa bladhii diploid value
(200) is a new finding since previous work (De Wet and Harlan 1970, Rice et al.
2014, Estep et al. 2014) noted tetraploid or hexaploid counts. Similarly, the B.
ewartiana (250), B. ischaemum (250), and B. insculpta (400) accessions were
diploid and tetraploid instead of the tetraploid, pentaploid or hexaploid as reported
by De Wet and Harlan (1970) and Estep et al. (2014) (Table 7). These new
findings maybe due to studying different accession, stressing the high degree of chromosome variation in these species and the potential of cross hybridization.

57
Table 8. Result of Flow cytometry, chromosome count database (sporophytic and gametophytic), and the sources of the data. Shaded area refers to differences in chromosome count. Symbol (–) refers to unavailable data.
Species Flow
cytometry values
Sporophytic /Gametophytic
chromosome counts
Ploidy (De Wet and
Harlan (1970)
Ploidy (Estep (2014)) ploidy format X value
B. bladhii 200 30, 34-44, 50, 60, c.70, 80 4x,6x tetraploid,
hexaploid B. insculpta 400 50,60 5x, 6x tetraploid B. ischaemum 250 30, 31, 36, 40, 42,
45, 50, 60 4x,6x tetraploid, diploid
B. ewartiana 250 - 5x, 6x -
B. decipiens 250 - - diploid, tetraploid
B. macra 400 - - tetraploid C. parviflorum 400 20, 40, 60 2x, 4x tetraploid
C. spicigerum 400 40 - tetraploid
D. aristatum 250 20, 40, 50, 60 2x, 4x diploid D. annulatum 400 20,40,60 2x, 4x tetraploid D. sericeum 400 5 -
Superimposing the Flow-cytometry results on the phylogenetic tree based
on the Region–Focus approach using concatenated trnT-F, rps16 intron, and 3’trnK
dataset (Fig. 13) revealed new information. Clade-based perspective shows a
consistent ploidy level for Bothriochloa species. All diploid Bothriochloa were in
clade 1 (B. decipiens) and clade 2 (B. bladhii, B. ischaemum, B. ewartiana).
Species of Capillipedium and Dichanthium, however, were tetraploid, but D.
aristatum was diploid. These results (Table 8) are in partial agreement with De
Wet and Harlan (1970) and Estep et al. (2014). De Wet (1968) pointed out the
extreme rarity of diploids in D. annulatum and D. aristatum since their collection of
hundreds of accessions represent only about 2% of the populations. There were
no data for D. sericeum from previous literature (De Wet and Harlan 1970, Estep et

58
al. 2014). The Chromosome Count Database gives a gametophyte count for this species as x=5, but further information is needed to discuss this species.
Figure 13. Phylogenetic tree of the BCD complex based on the Region-focus approach with ploidy status reported below each taxon. Number reported below each species correspond to from left to right: Flow Cytometry result, ploidy level following De Wet and Harlan (1970), and the ploidy level reported by Estep et al (2014) in Roman numbers. NA refers to Not Available. Legend: Aglom: A. glomeratus, Agy: A. gyrans, isc: B. ischaemum, ewa: B. ewartiana, ins: B. insculpta, C.pv: C. parviflorum, C.sp: C. spicigerum, D.an: D. annulatum, D.ar: D. aristatum, D.se: D. sericeum.

59
Clade 3 (Fig. 13) consisted exclusively of tetraploid estimates for B. macra
and B. insculpta based on the flow cytometry data. This is congruent with Estep et
al. (2014) findings, though De Wet and Harlan (1970) considered B. insculpta as
pentaploid and hexaploid, but gave no information for B. macra. This again
underscores the potential of excessive variation in chromosome numbers existing in the compilospecies complex yet to be fully reported.
Superimposing flow-cytometry on the nucleotide substitution (TCS) map of
Region-Focus (Fig. 13) confirmed the ploidy status of some species and provides a
different perspective. Bothriochloa decipiens (250) was positioned in the middle as
the diploid ancestor with larger genomic content. All of the diploid species were
linked directly to B. decipiens. These diploid species include normal diploid B.
bladhii (200) and diploids with larger genome (250), B. ischaemum, B. ewartiana and D. sericeum.
Tetraploid taxa C. spicigerum (400) and B. macra (400) were also linked
directly with B. decipiens (Fig. 14), indicating direct evolution from diploidy to
tetraploidy. Other instances represent indirect evolution of tetraploidization, such
as the emergence of tetraploids D. sericeum (400). Bothriochloa insculpta (400)
represent a case of speciation at a tetraploid level since it is directly link to tetraploid B. macra (Fig. 14).
Some of the conflicting result in the ploidy level could be explained by the
use of different accessions in the studies focusing on the compilospecies. This
study and Estep et al. (2014) only have a single accession in common (B.
decipiens, PI 153). This accession is consistently shown as diploid in both studies.
Although inconsistancies in flow cytometry data are not unexpected, this study is
based on duplicate or triplicate sampling with the result are highly consistent for the ploidy level.

60
Figure 14. Superimposing average flow cytometry result (number inside circle) on TCS mapping of Region Focus (95% parsimony probability, gap coded as missing data). Tetraploids and diploids are highlighted in green and blue shades. Four black bars refer to tetraploidization events. Square box refer to ancestor species. The outgroup Andropogon is isolated from the rest of the network. The letters B. refers to Bothriochloa, C. refers to Capillipedium, and D. refers to Dichanthium.
V. SUMMARY AND CONCLUSIONS
Flow-cytometry delivers the fastest result for assessing the genomic
content. It detected diploids and tetraploids but not hexaploids. Flow cytometry
points to diploid values for B. decipiens, and a clade consisting of B. bladhii, B.
ewartiana, and B. ischaemum. Bothriochloa insculpta and B. macra formed an
exclusively tetraploid clade. Capillipedium spicigerum and Dichanthium sericeum
were tetraploid. However, no hexaploids were detected during the measurement.
The TCS result showed that speciation has taken place in different paths. The
ancestral diploid species B. decipiens was linked directly to diploid species,

61
tetraploid species, and indirectly to tetraploid species.
Unfortunately, polyploidy and hybridization remained largely unresolved in
explaining the adaptation to variable environmental conditions and potential
invasiveness (Mable 2013). Evaluation of the whole compilospecies would be a
huge effort. Multidimensional studies using aspects such as geography, dispersal,
and various cytotypes may provide more insight into the evolution of the
compilospecies. Until that moment, no comprehensive taxonomic revision of
individual genera can be finished with great confidence, nor can the hybridization
issue in BCD be resolved.
VI. REFERENCES
Cheeda H. R. and J. R. Harlan. 1961. Fertility in Relation to Chromosomal
Abnormalities in Some Hybrids with Bothriochloa intermedia. Prooceding of
the Oklahoma Academy of Sciences for 1960, Biological Sciences: 17-22.
De Wet, J. M. J. 1968. Diploid-tetraploid-haploid cycles Dichanthium agamospecies. Evolution 22: 394-397.
De Wet, J. M. J. 1971. Polyploidy and evolution in plants. Taxon 20: 29-35.
De Wet, J. M. J. and J.R. Harlan. 1970. Apomixis, polyploidy, and speciation in
Dichanthium. Evolution 24: 270-277.
De Wet, J. M. J. and J.R. Harlan. 1972. Chromosome Pairing and Phylogenetic
Affinities. Taxon 21 (1): 67-70.
Doležel, J. 1991. Flow cytometric analysis of nuclear DNA content in higher plants.
Phytochemical Analysis 2: 143–154.
Doležel J., J. Greilhuber, J. Suda. 2007. Estimation of nuclear DNA content in
plants using flow cytometry. Nature Protocols 2: 2233–2244.
Estep, M. C., M. R. McKain, D. Vela-Diaz, J. Zhong, J. G. Hodge, T. R. Hodkinson,
D. J. Layton, S. T. Malcomber, R. Pasquet, and E.A. Kellogg 2014.

62
Allopolyploidy, diversification, and the Miocene grassland expansion. PNAS.
111 (42):15149-15154.
Gould, F. W. 1956. Chromosome Counts and Cytotaxonomic Notes on Grasses of the Tribe Andropogoneae. American Journal of Botany 43 (6): 395-404.
Levy, A. A. and M. Feldman. 2002. The Impact of Polyploidy on Grass Genome
Evolution. Plant Physiology. 130: 1587–1593.
Loureiro J., J. Doležel, J. Greilhuber, C. Santos, J. Suda. 2008. Plant flow
cytometry – far beyond the stone age. Cytometry Part A 73A: 579–580.
Mable, B. K. 2013. Polyploids and hybrids in changing environments: winners or losers in the struggle for adaptation? Heredity. 110: 95–96
Madlung, A. 2013. Polyploidy and its effect on evolutionary success: old questions
revisited with new tools. Heredity.110: 99–104.Rice, A., L. Glick, S. Abadi,
M. Einhorn, N.M. Kopelman, A. Salman-Minkov, J. Mayzel, O. Chay, and
I. Mayrose, 2014. The Chromosome Counts Database (CCDB) – a
community resource of plant chromosome numbers. New Phytologist. DOI: 10.1111/nph.13191. http://ccdb.tau.ac.il/
Sing, A.P. and J.M.J. De Wet. 1960. Interspecific Hybrids in Bothriochloa II.
Relationships Between Some American and Australian Species. Proceeding of Oklahoma Academy of Sciences for Biological Sciences: 35-38.
Soltis, D. E. and P. S. Soltis. 1999. Polyploidy: recurrent formation and genome evolution. Tree. 14 (9): 348—252.
Watson, L., and M.J.Dallwitz. 1992. onwards. The grass genera of the world:
descriptions, illustrations, identification, and information retrieval; including
synonyms, morphology, anatomy, physiology, phytochemistry, cytology,
classification, pathogens, world and local distribution, and references. Version: 23rd July 2012.http://delta-intkey.com

63
FINAL SYNTHESIS
As the first empirical study on the compilospecies, the phylogenetic
analyses based on morphological characters using MP and BioNJ showed that all
three genera Bothriochloa, Capillipedium and Dichanthium (BCD) are individual
monophyletic units. This was resolved despite reported intergeneric hybridization
among them. The study also revealed the close relationship between
Capillipedium and Dichanthium since they were recovered as sister clades in one
well-supported lineage. Their relationship with each other and with Bothriochloa
has been disputed. Tree topology based on BioNJ and MP analyses are highly
congruent. Bothriochloa consisted of two subclades.
In the chloroplast-based phylogeny, Bothriochloa is not monophyletic since
Capillipedium and Dichanthium are nested within it. Capillipedium appeared
monophyletic, whereas Dichanthium is paraphyletic with B. ischaemum and B.
bladhii consistently nested inside it in trees based on individual data sets (trnT-F,
rps16 intron and 3’trnK) and concatenated data set of Region-Focus and Taxa-
Focus. This is a sharp contrast with the results of the morphological analyses
where all three genera were recovered as monophyletic units. Composition of the
clade remains stable and addition of two new species of B. bunyensis and B.
erianthoides only shifted the placement of B. ewartiana. Concatenated data sets
showed the greatest informativeness compared with individual genomic regions.
Of the individual genomic regions, the trnT-F is the most informative, followed by
rps16 intron and 3’trnK; the latter region was considerably less informative. A high
degree of congruency was evident when comparing trees based on concatenated
data set of Region-Focus with the TCS network constructed here and the De Wet
and Harlan (1970) network of the compilospecies. The addition of species in our
study that were missing from the De Wet and Harlan (1970) work provided new
understanding of the compilospecies complex in the form of hypothesis that can be
tested by hybridization.
Flow-cytometry study recorded diploids and tetraploids but no hexaploids. In

64
combination with the TCS result, new patterns of evolution have been detected.
The ancestral species appeared to be diploid B. decipiens not B. bladhii.
Bothriochloa decipiens was linked directly to diploid species, tetraploid species, and indirectly to tetraploid species of the BCD complex.
The evaluation the whole compilospecies will be a massive undertaking.
This Australia-focused study provided a significant new insight into the relationship
among species of the compilospecies complex in general and on the taxa of this
continent in particular. Thus it represents a valuable starting point for
understanding the details of the compilospecies complex. Incorporating other
species of Bothriochloa beyond Australia and using sequence information from
nuclear genomic regions will refine the overall picture of the classification and
evolution of the compilospecies.