Morphological Stream Design and Assessment Tools for … · Morphological Stream Design and...
38
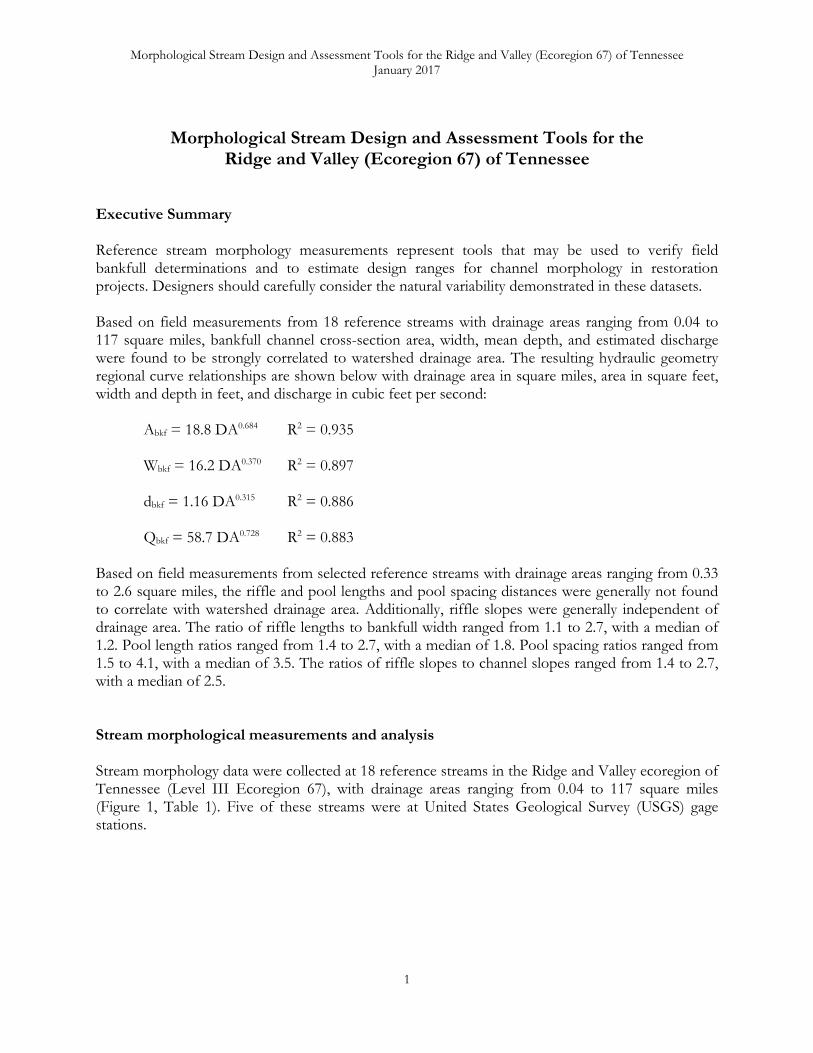
Morphological Stream Design and Assessment Tools for the Ridge and Valley (Ecoregion 67) of Tennessee January 2017 1 Morphological Stream Design and Assessment Tools for the Ridge and Valley (Ecoregion 67) of Tennessee Executive Summary Reference stream morphology measurements represent tools that may be used to verify field bankfull determinations and to estimate design ranges for channel morphology in restoration projects. Designers should carefully consider the natural variability demonstrated in these datasets. Based on field measurements from 18 reference streams with drainage areas ranging from 0.04 to 117 square miles, bankfull channel cross-section area, width, mean depth, and estimated discharge were found to be strongly correlated to watershed drainage area. The resulting hydraulic geometry regional curve relationships are shown below with drainage area in square miles, area in square feet, width and depth in feet, and discharge in cubic feet per second: A bkf = 18.8 DA 0.684 R 2 = 0.935 W bkf = 16.2 DA 0.370 R 2 = 0.897 d bkf = 1.16 DA 0.315 R 2 = 0.886 Q bkf = 58.7 DA 0.728 R 2 = 0.883 Based on field measurements from selected reference streams with drainage areas ranging from 0.33 to 2.6 square miles, the riffle and pool lengths and pool spacing distances were generally not found to correlate with watershed drainage area. Additionally, riffle slopes were generally independent of drainage area. The ratio of riffle lengths to bankfull width ranged from 1.1 to 2.7, with a median of 1.2. Pool length ratios ranged from 1.4 to 2.7, with a median of 1.8. Pool spacing ratios ranged from 1.5 to 4.1, with a median of 3.5. The ratios of riffle slopes to channel slopes ranged from 1.4 to 2.7, with a median of 2.5. Stream morphological measurements and analysis Stream morphology data were collected at 18 reference streams in the Ridge and Valley ecoregion of Tennessee (Level III Ecoregion 67), with drainage areas ranging from 0.04 to 117 square miles (Figure 1, Table 1). Five of these streams were at United States Geological Survey (USGS) gage stations.
Transcript of Morphological Stream Design and Assessment Tools for … · Morphological Stream Design and...
Morphological Stream Design and Assessment Tools for the Ridge and Valley (Ecoregion 67) of Tennessee January 2017
1
Morphological Stream Design and Assessment Tools for the Ridge and Valley (Ecoregion 67) of Tennessee
Executive Summary Reference stream morphology measurements represent tools that may be used to verify field bankfull determinations and to estimate design ranges for channel morphology in restoration projects. Designers should carefully consider the natural variability demonstrated in these datasets. Based on field measurements from 18 reference streams with drainage areas ranging from 0.04 to 117 square miles, bankfull channel cross-section area, width, mean depth, and estimated discharge were found to be strongly correlated to watershed drainage area. The resulting hydraulic geometry regional curve relationships are shown below with drainage area in square miles, area in square feet, width and depth in feet, and discharge in cubic feet per second: Abkf = 18.8 DA0.684 R2 = 0.935 Wbkf = 16.2 DA0.370 R2 = 0.897 dbkf = 1.16 DA0.315 R2 = 0.886 Qbkf = 58.7 DA0.728 R2 = 0.883 Based on field measurements from selected reference streams with drainage areas ranging from 0.33 to 2.6 square miles, the riffle and pool lengths and pool spacing distances were generally not found to correlate with watershed drainage area. Additionally, riffle slopes were generally independent of drainage area. The ratio of riffle lengths to bankfull width ranged from 1.1 to 2.7, with a median of 1.2. Pool length ratios ranged from 1.4 to 2.7, with a median of 1.8. Pool spacing ratios ranged from 1.5 to 4.1, with a median of 3.5. The ratios of riffle slopes to channel slopes ranged from 1.4 to 2.7, with a median of 2.5. Stream morphological measurements and analysis Stream morphology data were collected at 18 reference streams in the Ridge and Valley ecoregion of Tennessee (Level III Ecoregion 67), with drainage areas ranging from 0.04 to 117 square miles (Figure 1, Table 1). Five of these streams were at United States Geological Survey (USGS) gage stations.
Morphological Stream Design and Assessment Tools for the Ridge and Valley (Ecoregion 67) of Tennessee January 2017
2
Figure 1. Level III Ecoregions of Tennessee (USEPA, 2013). Reference stream sites were selected based on the following guidelines:
1. Channels were well-connected to alluvial floodplains with little evidence of incision; 2. Channels had freely-formed meander patterns and discernable bedform features
including riffles and pools; 3. Streambanks and floodplains were well-vegetated with little evidence of erosion; 4. Upstream watersheds were rural with mostly forest and agricultural land uses; 5. Reference reaches were stable and unconfined for a longitudinal length of at least 20
times bankfull width. Reference streams were surveyed using total station and laser level survey equipment to measure longitudinal profiles and riffle cross-sections. Streams were classified using the Rosgen stream classification system (Rosgen, 1994). The study included 3 B, 12 C, and 3 E Rosgen type streams based on the measured entrenchment ratios, width/depth ratios, and slopes listed in Table 2. The entrenchment ratios, calculated as the width of the floodprone area divided by the bankfull channel width, ranged from 1.4 for the narrow-valley B streams to greater than 5 for some of the alluvial C and E streams. Width/depth ratios, calculated as the bankfull riffle channel width divided by the mean riffle bankfull depth, ranged from just under 10 for some E streams to 40 for a wide and shallow B channel. Reach channel slopes, measured using water surface elevation differences from the first riffle to the last riffle surveyed, ranged from 0.0010 ft/ft for the largest river to 0.0331 ft/ft for the steepest stream channel. The streambed substrate was characterized through pebble counts and observations of dominant channel material. Of the 18 reference streams, the median streambed particle size (d50) was classified as sand at 1 site, gravel at 15 sites, cobble at 1 site, and bedrock at 1 site. The appendix contains detailed information about each of the 18 reference streams, including: photographs, longitudinal profile plots, and cross-section plots.
Morphological Stream Design and Assessment Tools for the Ridge and Valley (Ecoregion 67) of Tennessee January 2017
3
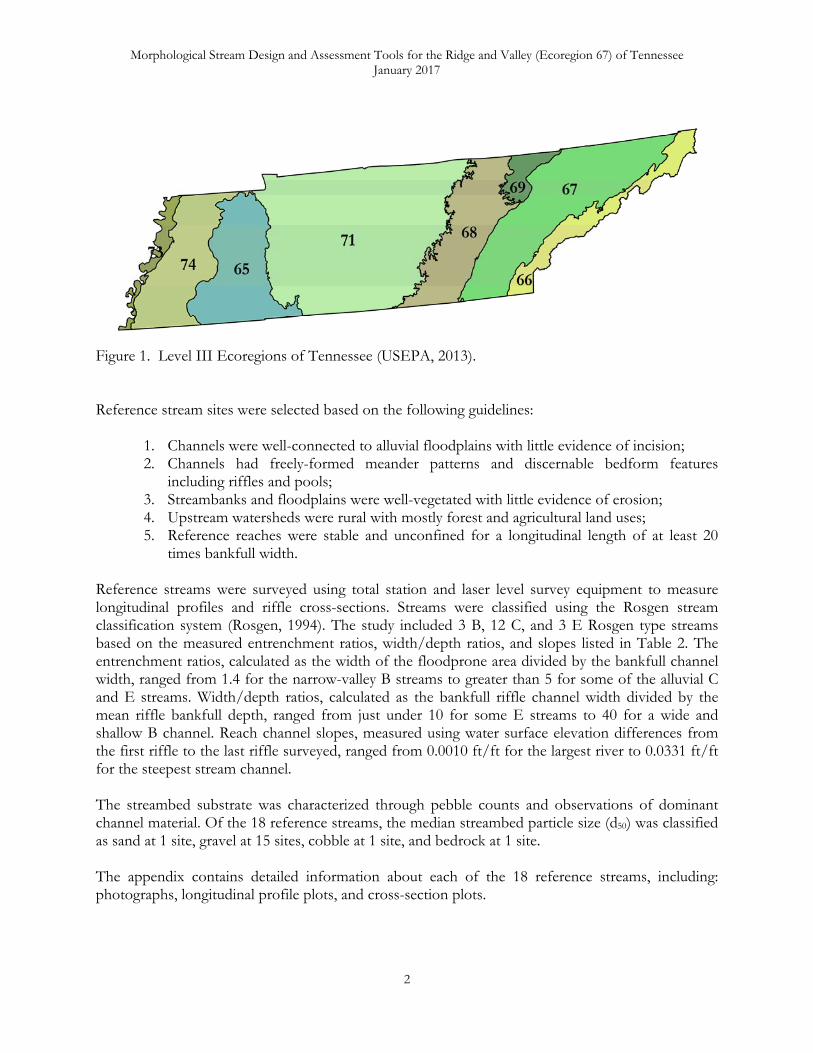
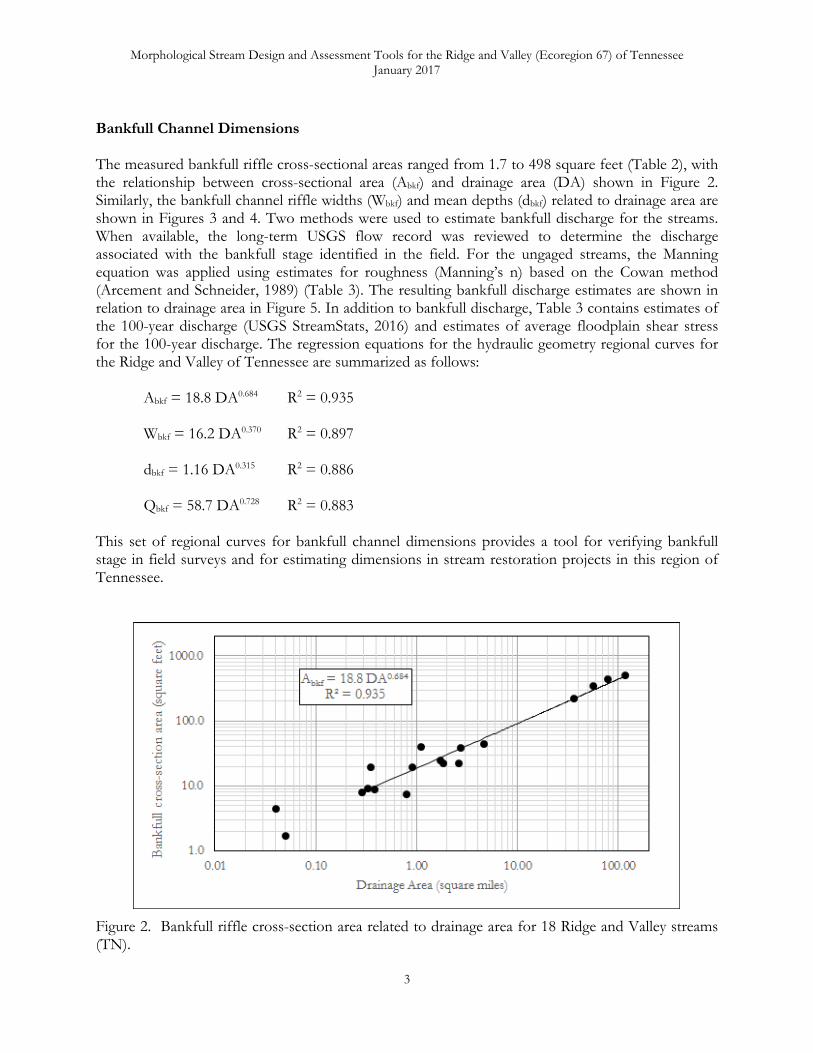
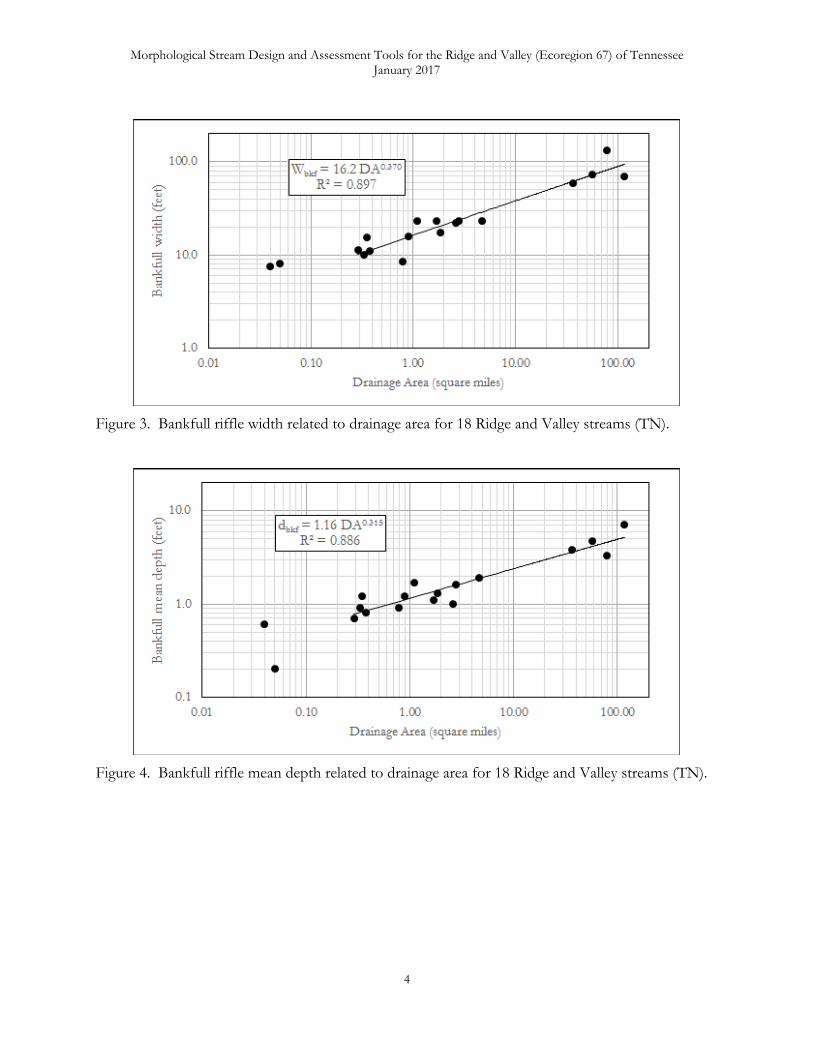
Bankfull Channel Dimensions The measured bankfull riffle cross-sectional areas ranged from 1.7 to 498 square feet (Table 2), with the relationship between cross-sectional area (Abkf) and drainage area (DA) shown in Figure 2. Similarly, the bankfull channel riffle widths (Wbkf) and mean depths (dbkf) related to drainage area are shown in Figures 3 and 4. Two methods were used to estimate bankfull discharge for the streams. When available, the long-term USGS flow record was reviewed to determine the discharge associated with the bankfull stage identified in the field. For the ungaged streams, the Manning equation was applied using estimates for roughness (Manning’s n) based on the Cowan method (Arcement and Schneider, 1989) (Table 3). The resulting bankfull discharge estimates are shown in relation to drainage area in Figure 5. In addition to bankfull discharge, Table 3 contains estimates of the 100-year discharge (USGS StreamStats, 2016) and estimates of average floodplain shear stress for the 100-year discharge. The regression equations for the hydraulic geometry regional curves for the Ridge and Valley of Tennessee are summarized as follows: Abkf = 18.8 DA0.684 R2 = 0.935 Wbkf = 16.2 DA0.370 R2 = 0.897 dbkf = 1.16 DA0.315 R2 = 0.886 Qbkf = 58.7 DA0.728 R2 = 0.883 This set of regional curves for bankfull channel dimensions provides a tool for verifying bankfull stage in field surveys and for estimating dimensions in stream restoration projects in this region of Tennessee.
Figure 2. Bankfull riffle cross-section area related to drainage area for 18 Ridge and Valley streams (TN).
Morphological Stream Design and Assessment Tools for the Ridge and Valley (Ecoregion 67) of Tennessee January 2017
4
Figure 3. Bankfull riffle width related to drainage area for 18 Ridge and Valley streams (TN).
Figure 4. Bankfull riffle mean depth related to drainage area for 18 Ridge and Valley streams (TN).

Morphological Stream Design and Assessment Tools for the Ridge and Valley (Ecoregion 67) of Tennessee January 2017
5
Figure 5. Estimated bankfull discharge related to drainage area for 18 Ridge and Valley streams (TN). The following four Level IV Ecoregions are found within the Ridge and Valley of Tennessee (Figure 6): 67f: Southern Limestone/Dolomite Valleys and Low Rolling Hills 67g: Southern Shale Valleys 67h: Southern Sandstone Ridges 67i: Southern Dissected Ridges and Knobs

Morphological Stream Design and Assessment Tools for the Ridge and Valley (Ecoregion 67) of Tennessee January 2017
6
Figure 6. Level IV Ecoregions within the Ridge and Valley of Tennessee (USEPA, 2013), with reference stream sites marked. Bedform Dimensions Table 4 lists measured dimensions and slopes for bedform features (i.e., riffles, pools) for the reference streams that contained these features. The mean riffle and pool lengths listed in Table 4 represent the means of the measured longitudinal lengths of all the riffles and pools existing in each reference reach. These bedform lengths are shown in relation to drainage area in Figure 7. Pool and riffle bedforms within the Ridge and Valley ecoregion generally do not correlate with drainage area, suggesting that, for the selected streams, pool and riffle lengths are not dependent on drainage area. These same values are shown in relation to bankfull channel width in Figure 8. The power function exponents shown on these figures indicate the degree of non-linearity in these relationships. These graphs represent design tools that may be used to estimate ranges of bedform dimensions in restoration projects. Designers should carefully consider the natural variability demonstrated in these datasets.

Morphological Stream Design and Assessment Tools for the Ridge and Valley (Ecoregion 67) of Tennessee January 2017
7
Figure 7. Mean riffle and pool length related to drainage area for Ridge and Valley streams (TN).
Figure 8. Mean riffle and pool length related to bankfull channel width for Ridge and Valley streams (TN).

Morphological Stream Design and Assessment Tools for the Ridge and Valley (Ecoregion 67) of Tennessee January 2017
8
Table 4 lists the ratios of riffle and pool length to bankfull width for each stream. Riffle length ratios ranged from 1.1 to 2.7, with a median of 1.2. Pool length ratios ranged from 1.4 to 2.7, with a median of 1.8. Table 4 also lists the mean spacing of pools found in each reference stream and the ratios of pool spacing to bankfull channel width. Values of pool spacing ratio ranged from 1.5 to 4.1, with a median of 3.5. Pool spacing values are shown in relation to bankfull channel width in Figure 9.
Figure 9. Mean pool spacing ratio related to bankfull channel width for Ridge and Valley streams (TN). Bedform Slopes Table 4 lists the mean measured riffle slopes and ratios of riffle slope to overall reach slope. The values of riffle slope ratios ranged from 1.4 to 2.7, with a median of 2.5. The measured riffle slopes and overall reach slopes are shown in relation to drainage area in Figure 10. The regression lines are generally parallel for the two slopes, indicating that riffle slopes are steeper than channel slopes by a consistent factor. These graphs represent design tools that may be used to estimate ranges of bedform dimensions in restoration projects. Designers should carefully consider the natural variability demonstrated in these datasets.

Morphological Stream Design and Assessment Tools for the Ridge and Valley (Ecoregion 67) of Tennessee January 2017
9
Figure 10. Reach channel slope and mean riffle slope related to drainage area for Ridge and Valley streams (TN). Pattern Pattern measurements (i.e., meander lengths, beltwidths, and radii of curvature) are reported in Table 5 for sites in unconfined valleys with sinuosity greater than 1.10. These measurements were collected in the field for those sites with drainage area less than 10 square miles. Aerial photography was used for sites with drainage area greater than 10 square miles. Reported measurements for these larger rivers should be carefully evaluated, as anthropomorphic impacts to pattern (e.g., straightening, channel realignment) have likely occurred. For the sites with drainage area less than 10 square miles, meander length ratios (meander length divided by bankfull width) range from 4.0 to 6.3, with a median of 4.8. Beltwidth ratios range from 1.4 to 2.0, with a median of 1.7. Radius of curvature ratios range from 1.2 to 1.8, with a median of 1.6.

Morphological Stream Design and Assessment Tools for the Ridge and Valley (Ecoregion 67) of Tennessee January 2017
10
Table 1. Morphology Reference Stream Summary, Ridge and Valley Ecoregion (TN).
Site Stream name Source/Location Latitude Longitude Level IV Ecoregion
Drainage area
(mile2)
1 Forks Creek (3) Forks of the River WMA 35.937514 -83.848191 67f 0.04
2 Ijams Creek Ijams Nature Center 35.956553 -83.868685 67g 0.05
3 Forks Creek (2) Forks of the River WMA 35.949691 -83.853727 67f 0.29
4 UT White Creek Chuck Swan State Forest 36.349005 -83.899726 67f 0.33
5 Forks Creek (1) Forks of the River WMA 35.936921 -83.849549 67f 0.35
6 Big Ridge Creek Big Ridge State Park 36.246175 -83.921839 67i 0.38
7 Big Spring Creek Chuck Swan State Forest 36.303581 -83.944898 67f 0.79
8 White Creek TDEC ECO67F13 36.348095 -83.901602 67f 0.90
9 Mill Creek TDEC FECO67I12 35.988330 -84.288880 67i 1.10
10 Toll Creek Ijams Nature Center 35.952161 -83.864656 67f 1.71
11 Forks Creek (4) Forks of the River WMA 35.937082 -83.848372 67f 1.84
12 Clear Creek (1) Chuck Swan State Forest 36.322751 -83.913806 67f 2.62
13 Clear Creek (2) TDEC ECO67F06 36.213589 -84.059333 67f 2.77
14 Crockett Creek USGS Gage 3491544 36.379817 -83.046554 67f 4.67
15 Beaver Creek USGS Gage 3535187 36.059269 -83.972218 67f 36.4
16 Oostanaula Creek USGS Gage 3565500 35.327517 -84.705082 67f 57.0
17 Big Limestone Creek USGS Gage 3466208 36.205938 -82.650427 67f 79.0
18 Sewee Creek USGS Gage 3543500 35.577894 -84.749564 67f 117

Morphological Stream Design and Assessment Tools for the Ridge and Valley (Ecoregion 67) of Tennessee January 2017
11
Table 2. Morphology Dimensions for Reference Streams, Ridge and Valley Ecoregion (TN).
Site Drainage area
Channel slope
Cross-section
area
Bankfull width
Bankfull mean depth
Width/depth ratio
Entrenchment ratio
Sinuosity Stream classification
(mile2) (ft/ft) (ft2) (ft) (ft)
1 0.04 0.0071 4.4 7.6 0.6 13.1 10.9 1.06 C4
2 0.05 0.0085 1.7 8.0 0.2 37.3 1.6 1.02 B5c
3 0.29 0.0041 7.9 11.4 0.7 16.5 6.4 1.01 C4
4 0.33 0.0253 9.0 9.9 0.9 10.9 5.6 1.05 E4b
5 0.35 0.0121 19.1 15.5 1.2 12.6 2.3 1.05 C3
6 0.38 0.0119 8.8 11.0 0.8 13.7 5.3 1.10 C4
7 0.79 0.0331 7.3 8.4 0.9 9.6 2.5 1.02 E4b
8 0.90 0.0187 19.5 15.9 1.2 13.0 3.6 1.05 C4
9 1.10 0.0039 40.3 23.3 1.7 13.4 3.4 1.06 C4
10 1.71 0.0174 24.5 23.3 1.1 22.1 3.9 1.06 C4
11 1.84 0.0018 22.4 17.2 1.3 13.2 4.0 1.03 C4
12 2.62 0.0133 22.3 21.8 1.0 21.2 2.3 1.02 C4
13 2.77 0.0048 37.9 23.3 1.6 14.3 3.1 1.14 C4
14 4.67 0.0025 44.6 23.2 1.9 12.1 2.0 1.02 B4c
15 36.4 0.0010 220.9 58.9 3.8 15.7 3.7 1.32 C3
16 57.0 0.0015 344.9 73.3 4.7 15.6 3.0 1.28 C4
17 79.0 0.0023 431.5 131.7 3.3 40.2 1.4 1.21 B1c
18 117 0.0010 497.5 69.8 7.1 9.8 2.9 1.55 E4

Morphological Stream Design and Assessment Tools for the Ridge and Valley (Ecoregion 67) of Tennessee January 2017
12
Table 3. Discharge Estimates for Reference Streams, Ridge and Valley Ecoregion (TN).
Site Drainage area
Channel slope
Cross-section area
Manning’s n
Bankfull mean
velocity
Bankfull discharge
100-year discharge
100-year floodplain shear stress
(mile2) (ft/ft) (ft2) (ft/sec) (cfs) (cfs) (lbs/ft2)
1 0.04 0.0071 4.4 0.045 1.75 7.7 46.7 0.3
2 0.05 0.0085 1.7 0.035 1.35 2.3 59.2 1.1
3 0.29 0.0041 7.9 0.045 1.53 12.0 175 0.4
4 0.33 0.0253 9.0 0.045 4.41 39.7 219 2.2
5 0.35 0.0121 19.1 0.048 3.55 67.9 209 1.7
6 0.38 0.0119 8.8 0.040 3.19 28.1 239 1.4
7 0.79 0.0331 7.3 0.050 4.32 31.6 410 6.9
8 0.90 0.0187 19.5 0.050 4.24 82.6 455 2.8
9 1.10 0.0039 40.3 0.035 3.51 141.3 510 0.8
10 1.71 0.0174 24.5 0.050 3.82 93.6 635 2.4
11 1.84 0.0018 22.4 0.045 1.51 33.8 689 0.6
12 2.62 0.0133 22.3 0.045 3.64 81.3 957 3.6
13 2.77 0.0048 37.9 0.048 2.71 103 992 1.5
14 4.67 0.0025 44.6 -- 3.21 143 1280 1.4
15 36.4 0.0010 220.9 0.052 2.04 451 5390 0.8
16 57.0 0.0015 344.9 -- 3.52 1215 7870 1.3
17 79.0 0.0023 431.5 -- 5.92 2556 9070 2.1
18 117 0.0010 497.5 -- 4.66 2317 14200 1.7
Note: Absence of Manning’s n in table indicates that bankfull discharge was derived from the long-term flow record at a USGS gage station.

Morphological Stream Design and Assessment Tools for the Ridge and Valley (Ecoregion 67) of Tennessee January 2017
13
Table 4. Stream Morphology Bedform Measurements for Reference Streams, Ridge and Valley Ecoregion (TN).
Site Drainage area Mean riffle
length [ratio to bankfull width]
Mean pool length [ratio to bankfull width]
Mean pool spacing [ratio to bankfull width]
Mean riffle slope [ratio to channel slope]
(mile2) (ft [none]) (ft [none]) (ft [none]) (ft/ft [none])
4 0.33 26.4 [2.7] 14.4 [1.5] 34.0 [3.4] 0.0351 [1.4]
5 0.35 17.7 [1.1] 41.3 [2.7] 62.9 [4.1] 0.0331 [2.7]
6 0.38 13.5 [1.2] 22.7 [2.1] 39.8 [3.6] 0.0268 [2.3]
12 2.62 25.2 [1.2] 29.5 [1.4] 33.0 [1.5] 0.0353 [2.7]

Morphological Stream Design and Assessment Tools for the Ridge and Valley (Ecoregion 67) of Tennessee January 2017
14
Table 5. Stream Morphology Pattern Measurements for Reference Streams, Ridge and Valley Ecoregion (TN).
Site Drainage area Mean meander length [ratio to bankfull width]
Mean beltwidth [ratio to
bankfull width]
Mean radius of curvature [ratio to
bankfull width]
(mile2) (ft [none]) (ft [none]) (ft [none])
4 0.33 62 [6.3] 20 [2.0] 13 [1.3]
5 0.35 62 [4.0] 25 [1.6] 28 [1.8]
6 0.38 50 [4.5] 19 [1.7] 20 [1.8]
12 2.62 110 [5.0] 31 [1.4] 27 [1.2]
15* 36.4 526 [8.9] 299 [5.1] 167 [2.8]
16* 57.0 1031 [14.1] 664 [9.1] 203 [2.8]
17* 79.0 1575 [12.0] 837 [6.4] 577 [4.4]
18* 117 2729 [39.1] 1372 [19.7] 383 [5.5]
Note: * after site name indicates that pattern measurements were obtained from aerial photography due to the size of the river. Anthropomorphic impacts to pattern (e.g., straightening, channel realignment) have likely occurred within these larger rivers.
Morphological Stream Design and Assessment Tools for the Ridge and Valley (Ecoregion 67) of Tennessee January 2017
15
Literature Cited Arcement, G.J. Jr., V.R. Schneider, 1989. Guide for selecting Manning’s roughness coefficients for natural channels and flood plains. United States Geological Survey Water Supply Paper 2339. United States Geological Survey, Washington, DC. Rosgen, D.L., 1994. A classification of natural rivers. Catena 22, 169-199. USEPA, 2013. Level III ecoregions of the continental United States. Corvallis, Oregon, USEPA National Health and Environmental Effects Research Laboratory, map scale 1:7,500,000, http://www.epa.gov/wed/pages/ecoregions/level_iii_iv.htm USGS StreamStats, 2016. http://water.usgs.gov/osw/streamstats

APPENDIX

Latitude: 35.937514Longitude: -83.848191Drainage area: 0.04 square milesMedian particle size: 35 millimetersLongitudinal slope: 0.0071 feet/footStream classification: C4
X1
Area (square feet) = 4.4
Width (feet) = 7.6
Mean depth = 0.6
Max depth = 0.8
Width/depth ratio = 13.1
Entrenchment ratio = 10.9
1. Forks Creek (3)Ecoregion 67, Tennessee
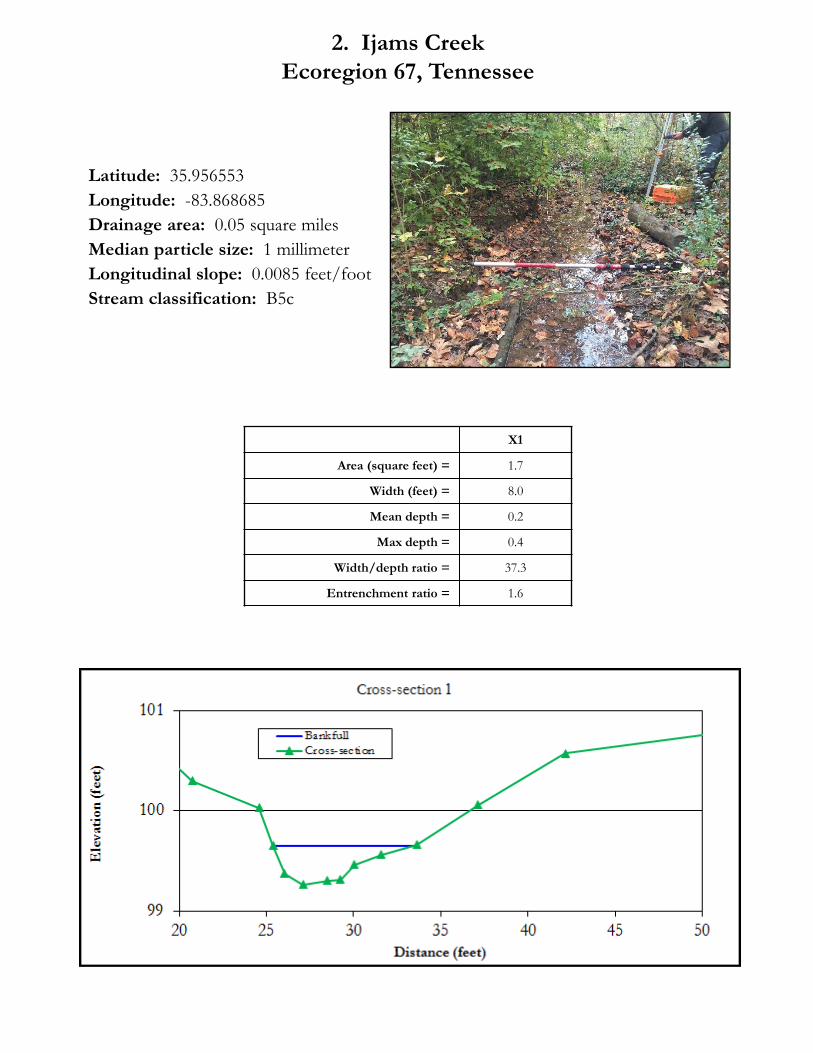
Latitude: 35.956553Longitude: -83.868685Drainage area: 0.05 square milesMedian particle size: 1 millimeterLongitudinal slope: 0.0085 feet/footStream classification: B5c
X1
Area (square feet) = 1.7
Width (feet) = 8.0
Mean depth = 0.2
Max depth = 0.4
Width/depth ratio = 37.3
Entrenchment ratio = 1.6
2. Ijams CreekEcoregion 67, Tennessee

Latitude: 35.949691Longitude: -83.853727Drainage area: 0.29 square milesMedian particle size: 20 millimetersLongitudinal slope: 0.0041 feet/footStream classification: C4
X1
Area (square feet) = 7.9
Width (feet) = 11.4
Mean depth = 0.7
Max depth = 1.2
Width/depth ratio = 16.5
Entrenchment ratio = 6.4
3. Forks Creek (2)Ecoregion 67, Tennessee

Latitude: 36.349005Longitude: -83.899726Drainage area: 0.33 square milesMedian particle size: 25 millimetersLongitudinal slope: 0.0253 feet/footStream classification: E4b
X1
Area (square feet) = 9.0
Width (feet) = 9.9
Mean depth = 0.9
Max depth = 1.5
Width/depth ratio = 10.9
Entrenchment ratio = 5.6
4. UT White CreekEcoregion 67, Tennessee
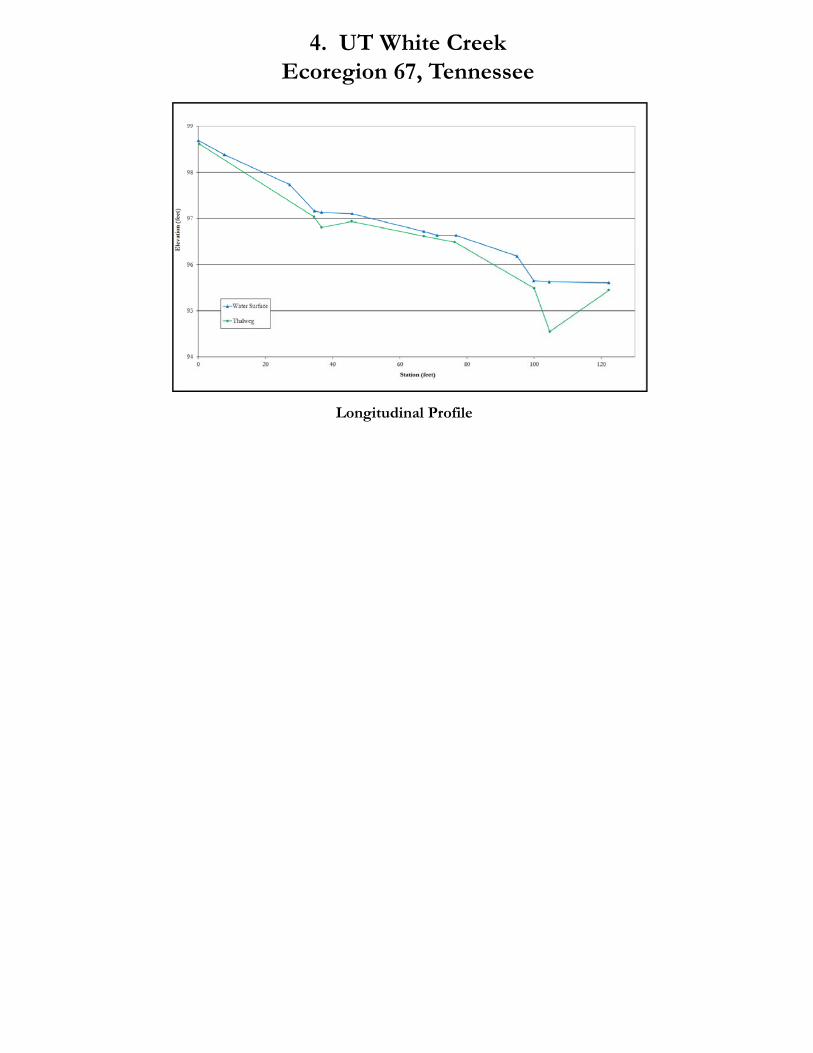
4. UT White CreekEcoregion 67, Tennessee
Longitudinal Profile
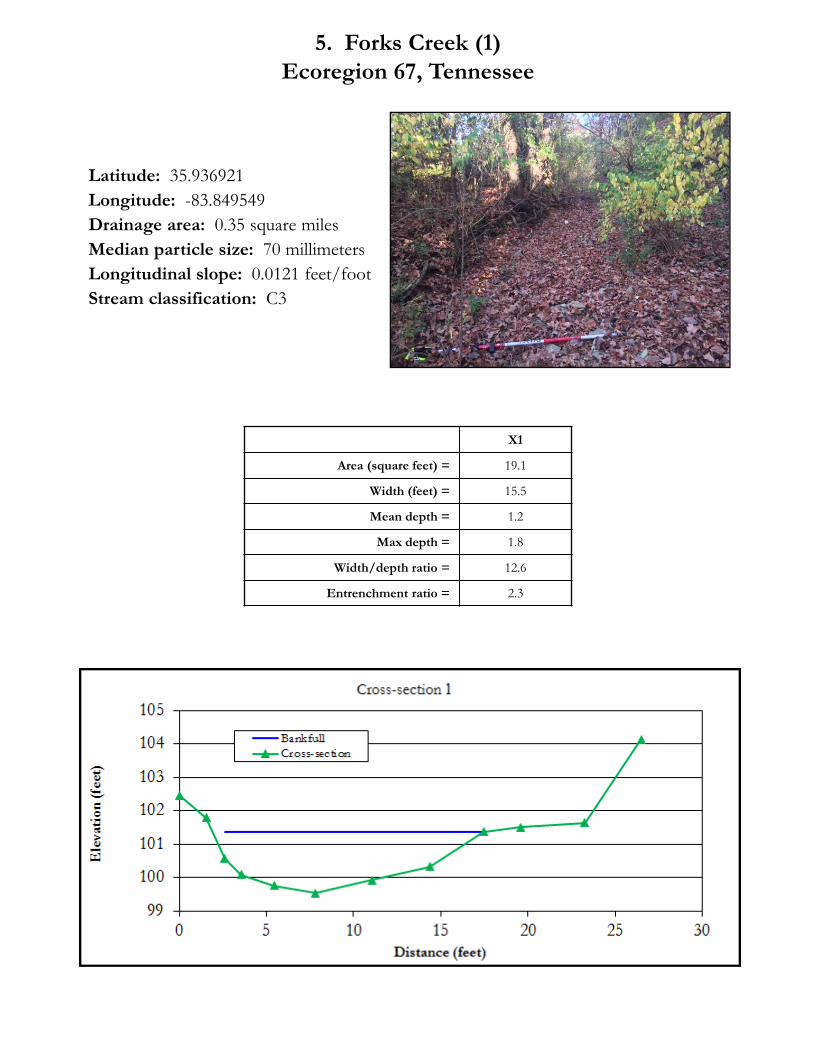
Latitude: 35.936921Longitude: -83.849549Drainage area: 0.35 square milesMedian particle size: 70 millimetersLongitudinal slope: 0.0121 feet/footStream classification: C3
X1
Area (square feet) = 19.1
Width (feet) = 15.5
Mean depth = 1.2
Max depth = 1.8
Width/depth ratio = 12.6
Entrenchment ratio = 2.3
5. Forks Creek (1)Ecoregion 67, Tennessee
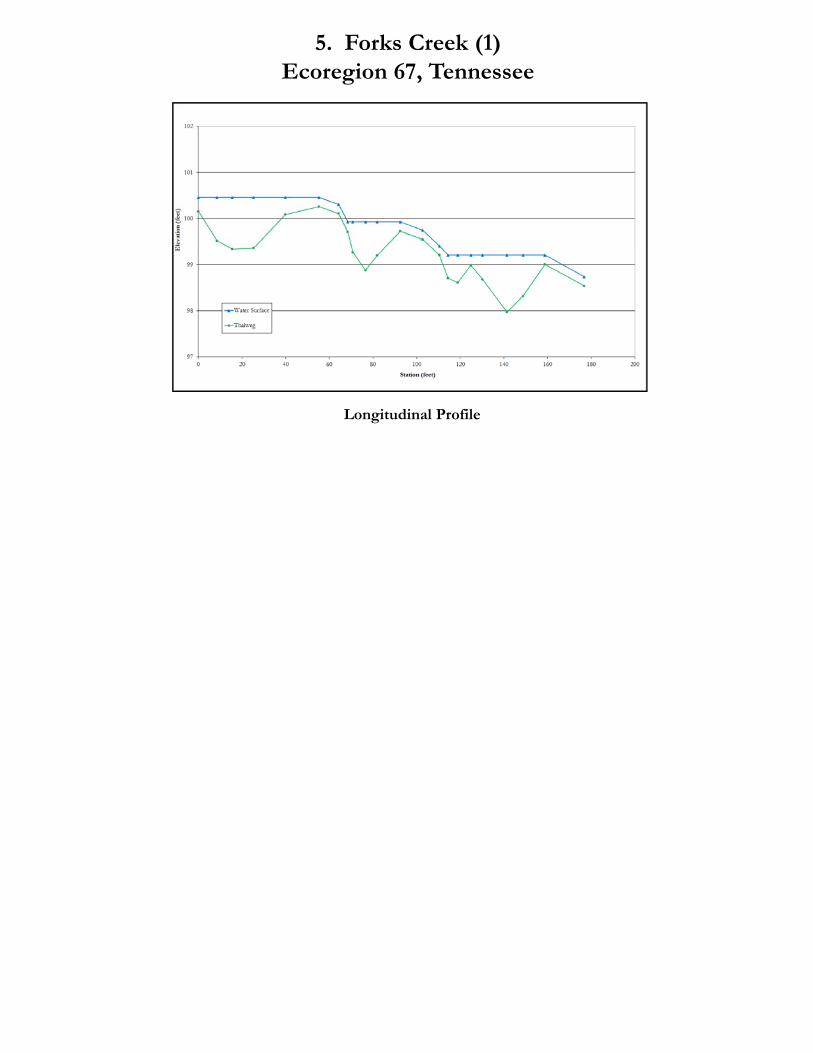
5. Forks Creek (1)Ecoregion 67, Tennessee
Longitudinal Profile
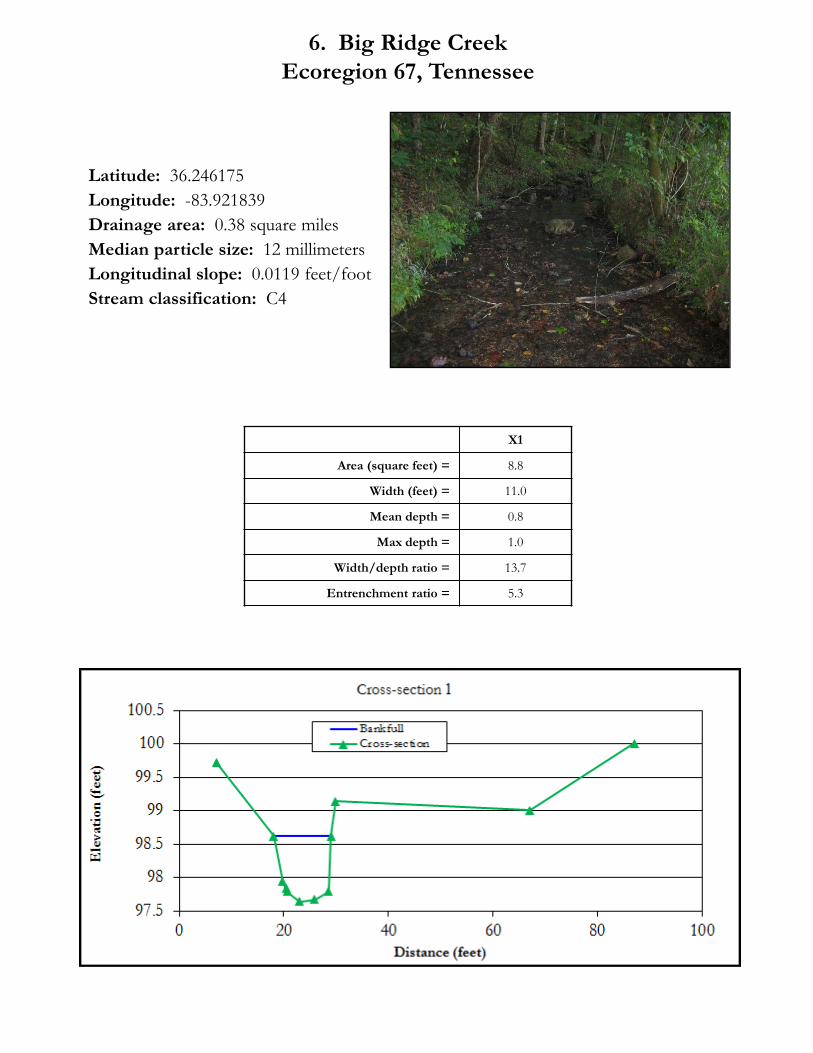
Latitude: 36.246175Longitude: -83.921839Drainage area: 0.38 square milesMedian particle size: 12 millimetersLongitudinal slope: 0.0119 feet/footStream classification: C4
X1
Area (square feet) = 8.8
Width (feet) = 11.0
Mean depth = 0.8
Max depth = 1.0
Width/depth ratio = 13.7
Entrenchment ratio = 5.3
6. Big Ridge CreekEcoregion 67, Tennessee

6. Big Ridge CreekEcoregion 67, Tennessee
Longitudinal Profile
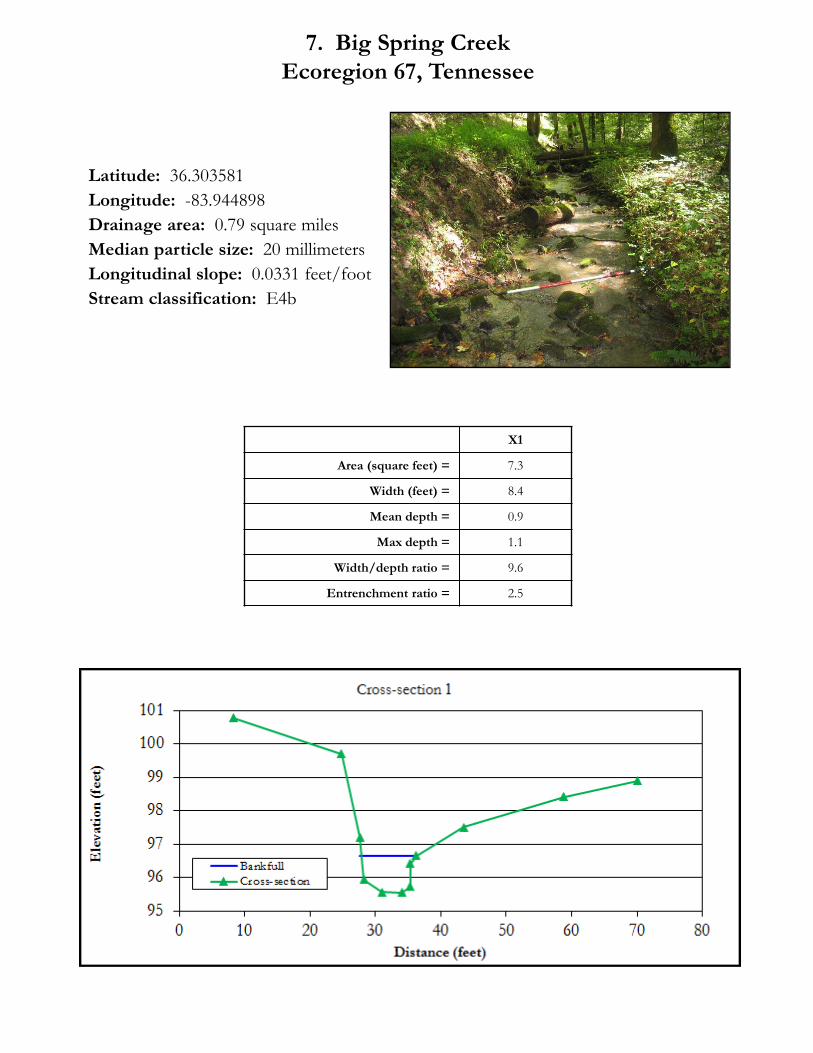
Latitude: 36.303581Longitude: -83.944898Drainage area: 0.79 square milesMedian particle size: 20 millimetersLongitudinal slope: 0.0331 feet/footStream classification: E4b
X1
Area (square feet) = 7.3
Width (feet) = 8.4
Mean depth = 0.9
Max depth = 1.1
Width/depth ratio = 9.6
Entrenchment ratio = 2.5
7. Big Spring CreekEcoregion 67, Tennessee

Latitude: 36.348095Longitude: -83.901602Drainage area: 0.90 square milesMedian particle size: 25 millimetersLongitudinal slope: 0.0187 feet/footStream classification: C4
X1
Area (square feet) = 19.5
Width (feet) = 15.9
Mean depth = 1.2
Max depth = 1.6
Width/depth ratio = 13.0
Entrenchment ratio = 3.6
8. White CreekEcoregion 67, Tennessee

Latitude: 35.988330Longitude: -84.288880Drainage area: 1.10 square milesMedian particle size: 15 millimetersLongitudinal slope: 0.0039 feet/footStream classification: C4
X1
Area (square feet) = 40.3
Width (feet) = 23.3
Mean depth = 1.7
Max depth = 2.7
Width/depth ratio = 13.4
Entrenchment ratio = 3.4
9. Mill CreekEcoregion 67, Tennessee
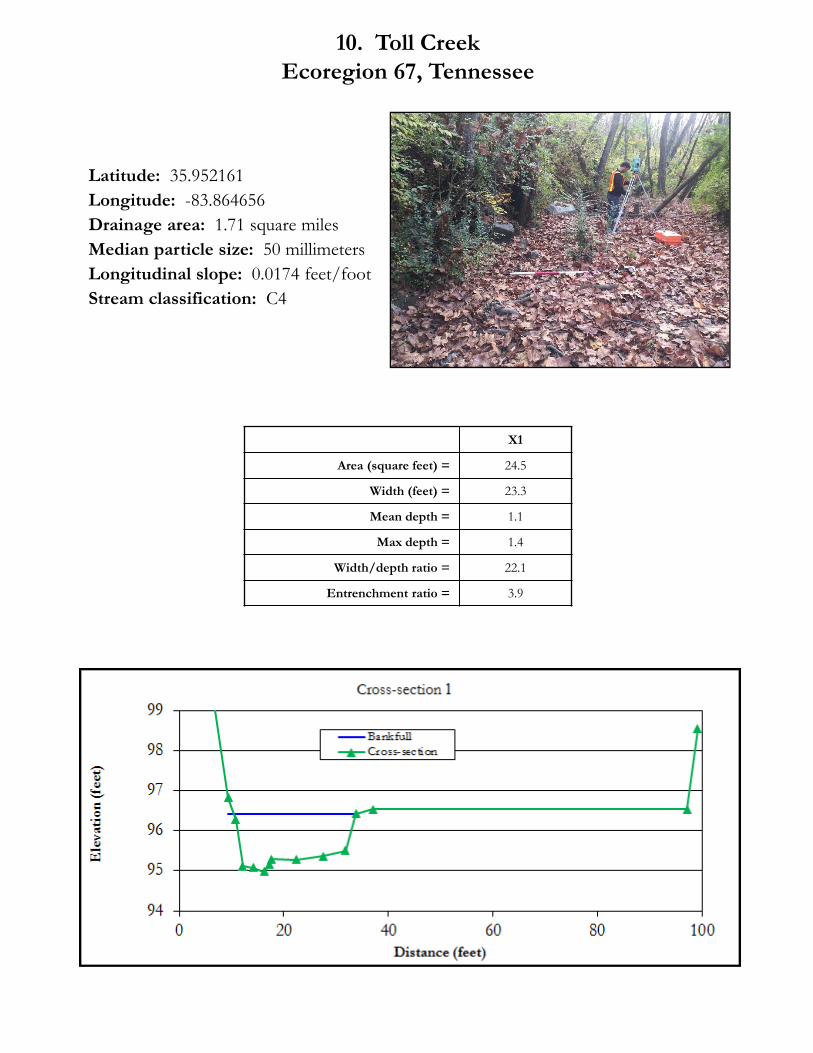
Latitude: 35.952161Longitude: -83.864656Drainage area: 1.71 square milesMedian particle size: 50 millimetersLongitudinal slope: 0.0174 feet/footStream classification: C4
X1
Area (square feet) = 24.5
Width (feet) = 23.3
Mean depth = 1.1
Max depth = 1.4
Width/depth ratio = 22.1
Entrenchment ratio = 3.9
10. Toll CreekEcoregion 67, Tennessee
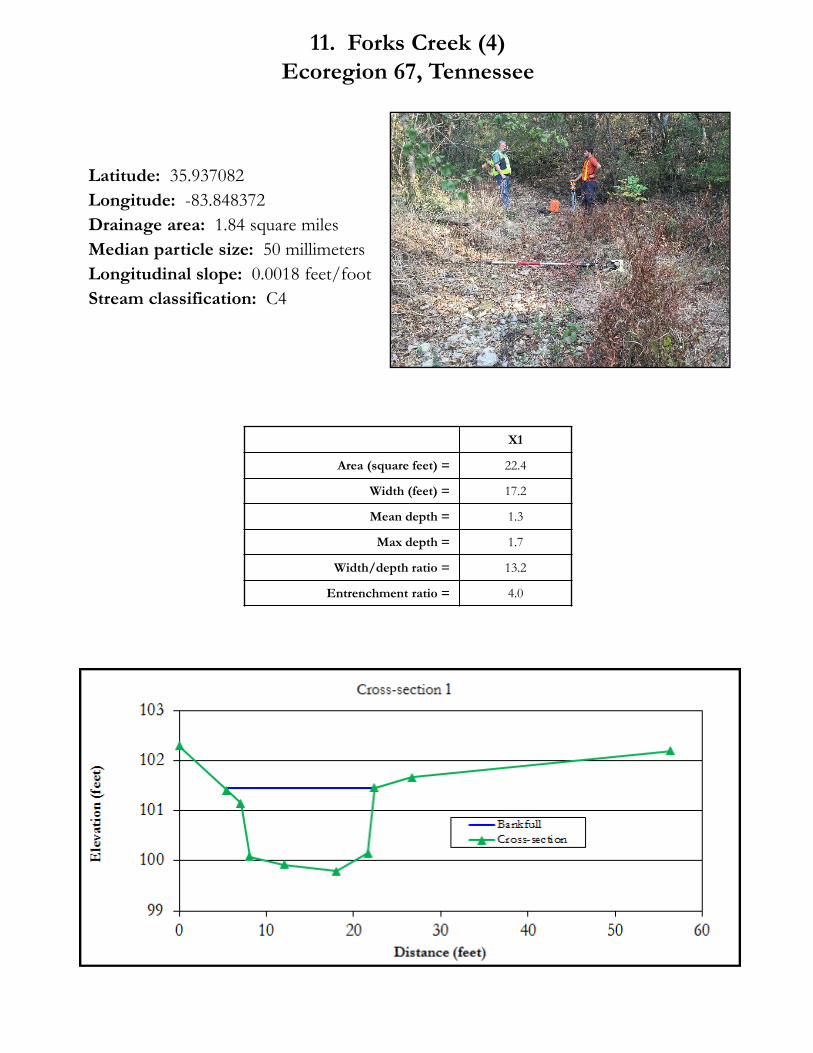
Latitude: 35.937082Longitude: -83.848372Drainage area: 1.84 square milesMedian particle size: 50 millimetersLongitudinal slope: 0.0018 feet/footStream classification: C4
X1
Area (square feet) = 22.4
Width (feet) = 17.2
Mean depth = 1.3
Max depth = 1.7
Width/depth ratio = 13.2
Entrenchment ratio = 4.0
11. Forks Creek (4)Ecoregion 67, Tennessee

Latitude: 36.322751Longitude: -83.913806Drainage area: 2.62 square milesMedian particle size: 30 millimetersLongitudinal slope: 0.0133 feet/footStream classification: C4
X1
Area (square feet) = 22.3
Width (feet) = 21.8
Mean depth = 1.0
Max depth = 1.4
Width/depth ratio = 21.2
Entrenchment ratio = 2.3
12. Clear Creek (1)Ecoregion 67, Tennessee

12. Clear Creek (1)Ecoregion 67, Tennessee
Longitudinal Profile

Latitude: 36.213589Longitude: -84.059333Drainage area: 2.77 square milesMedian particle size: 8 millimetersLongitudinal slope: 0.0048 feet/footStream classification: C4
X1
Area (square feet) = 37.9
Width (feet) = 23.3
Mean depth = 1.6
Max depth = 2.1
Width/depth ratio = 14.3
Entrenchment ratio = 3.1
13. Clear Creek (2)Ecoregion 67, Tennessee

Latitude: 36.379817Longitude: -83.046554Drainage area: 4.67 square milesMedian particle size: 25 millimetersLongitudinal slope: 0.0025 feet/footStream classification: B4c
X1
Area (square feet) = 44.6
Width (feet) = 23.2
Mean depth = 1.9
Max depth = 2.4
Width/depth ratio = 12.1
Entrenchment ratio = 2.0
14. Crockett CreekEcoregion 67, Tennessee
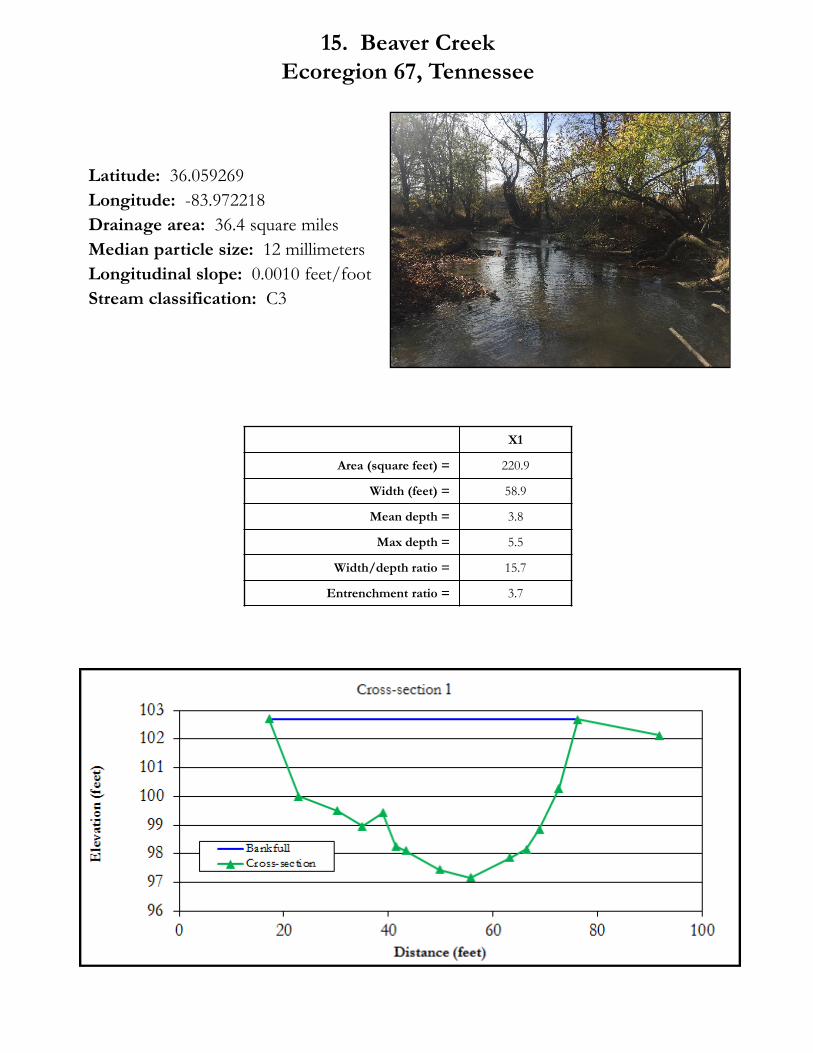
Latitude: 36.059269Longitude: -83.972218Drainage area: 36.4 square milesMedian particle size: 12 millimetersLongitudinal slope: 0.0010 feet/footStream classification: C3
X1
Area (square feet) = 220.9
Width (feet) = 58.9
Mean depth = 3.8
Max depth = 5.5
Width/depth ratio = 15.7
Entrenchment ratio = 3.7
15. Beaver CreekEcoregion 67, Tennessee
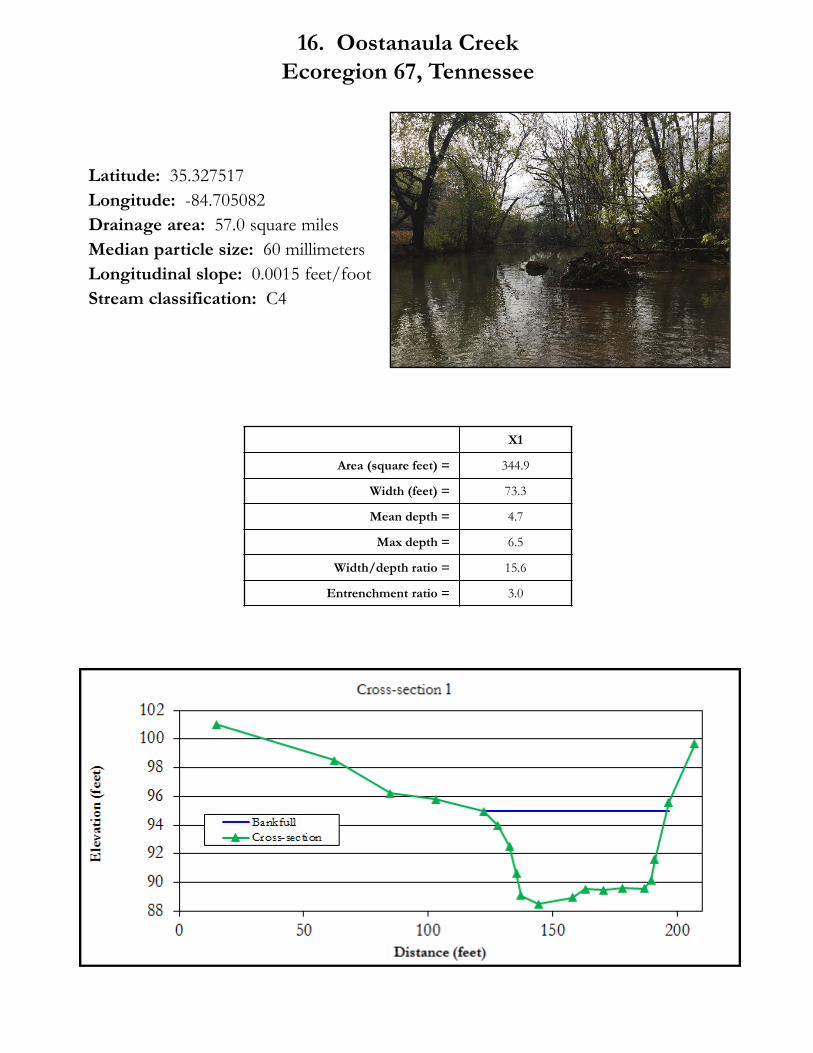
Latitude: 35.327517Longitude: -84.705082Drainage area: 57.0 square milesMedian particle size: 60 millimetersLongitudinal slope: 0.0015 feet/footStream classification: C4
X1
Area (square feet) = 344.9
Width (feet) = 73.3
Mean depth = 4.7
Max depth = 6.5
Width/depth ratio = 15.6
Entrenchment ratio = 3.0
16. Oostanaula CreekEcoregion 67, Tennessee
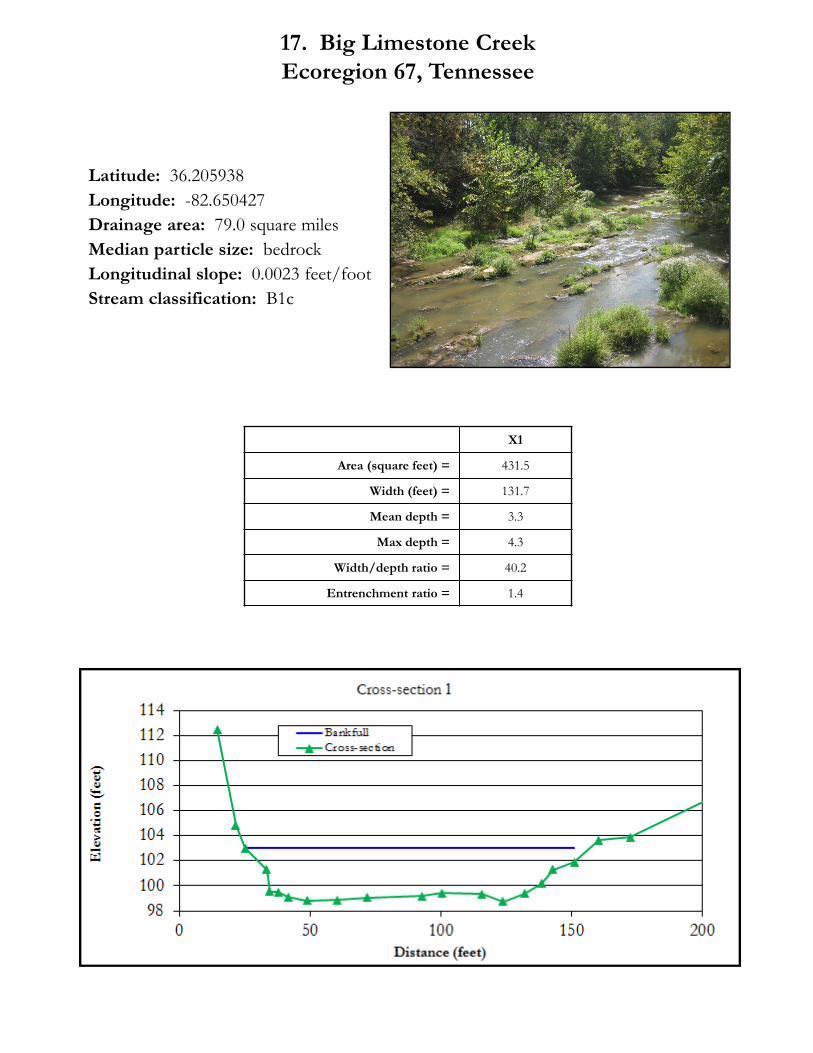
Latitude: 36.205938Longitude: -82.650427Drainage area: 79.0 square milesMedian particle size: bedrockLongitudinal slope: 0.0023 feet/footStream classification: B1c
X1
Area (square feet) = 431.5
Width (feet) = 131.7
Mean depth = 3.3
Max depth = 4.3
Width/depth ratio = 40.2
Entrenchment ratio = 1.4
17. Big Limestone CreekEcoregion 67, Tennessee
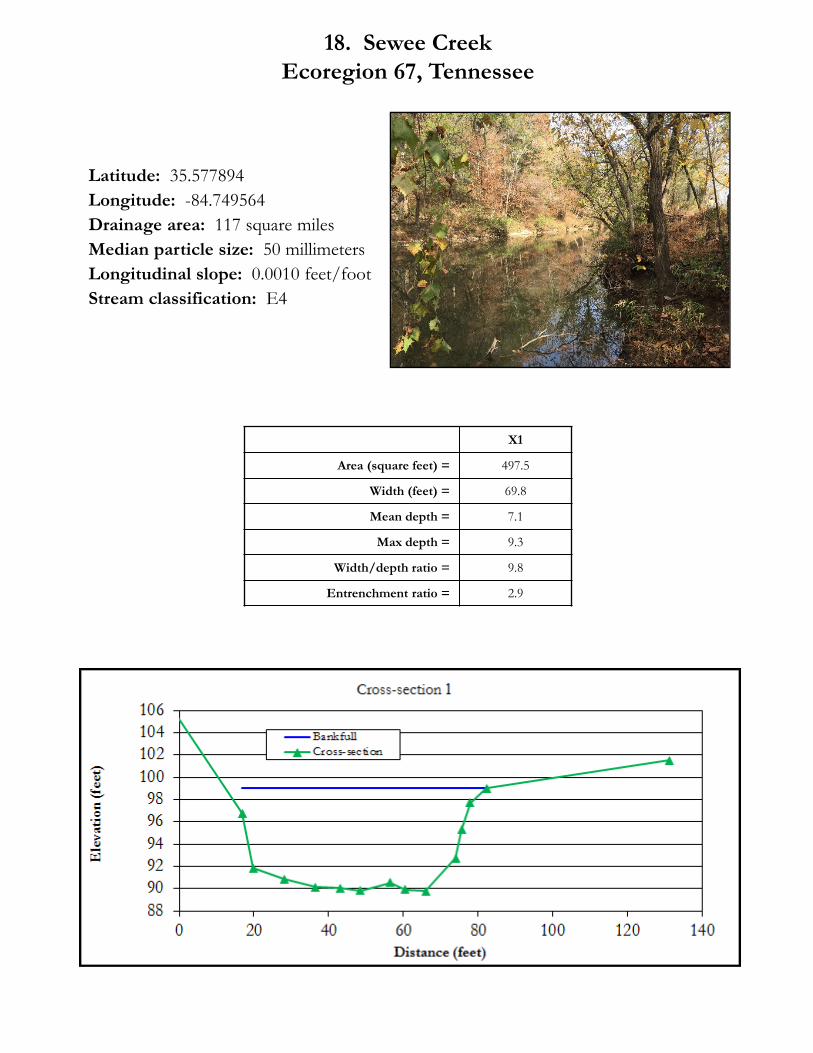
Latitude: 35.577894Longitude: -84.749564Drainage area: 117 square milesMedian particle size: 50 millimetersLongitudinal slope: 0.0010 feet/footStream classification: E4
X1
Area (square feet) = 497.5
Width (feet) = 69.8
Mean depth = 7.1
Max depth = 9.3
Width/depth ratio = 9.8
Entrenchment ratio = 2.9
18. Sewee CreekEcoregion 67, Tennessee