Morocco Exporter Guide 2017 - USDA GAIN Publications/Exporter Guide... · Exporters should avoid...
14
THIS REPORT CONTAINS ASSESSMENTS OF COMMODITY AND TRADE ISSUES MADE BY USDA STAFF AND NOT NECESSARILY STATEMENTS OF OFFICIAL U.S. GOVERNMENT POLICY Date: GAIN Report Number: Approved By: Prepared By: Report Highlights: Morocco, a U.S. Free Trade Agreement partner, is primarily a bulk commodity market for U.S. wheat, corn, and soybean products, and exports of consumer-oriented goods have been declining steadily since the signing of the EU-Morocco FTA. Nevertheless, significant opportunities remain for U.S. beef, poultry, and processed eggs, pending the resolution of long-standing market access restrictions. Mohamed Fardaoussi Morgan Haas 2017 Exporter Guide Morocco MO1717 12/31/2017 Required Report - public distribution
-
Upload
truongduong -
Category
Documents
-
view
217 -
download
0
Transcript of Morocco Exporter Guide 2017 - USDA GAIN Publications/Exporter Guide... · Exporters should avoid...

THIS REPORT CONTAINS ASSESSMENTS OF COMMODITY AND TRADE ISSUES MADE BY
USDA STAFF AND NOT NECESSARILY STATEMENTS OF OFFICIAL U.S. GOVERNMENT
POLICY
Date:
GAIN Report Number:
Approved By:
Prepared By:
Report Highlights:
Morocco, a U.S. Free Trade Agreement partner, is primarily a bulk commodity market for U.S. wheat,
corn, and soybean products, and exports of consumer-oriented goods have been declining steadily since
the signing of the EU-Morocco FTA. Nevertheless, significant opportunities remain for U.S. beef,
poultry, and processed eggs, pending the resolution of long-standing market access restrictions.
Mohamed Fardaoussi
Morgan Haas
2017
Exporter Guide
Morocco
MO1717
12/31/2017
Required Report - public distribution

2017 Exporter Guide 2 | P a g e
Table of Contents
SECTION I: MARKET OVERVIEW ........................................................................................... 3
Key Demographic Development................................................................................................. 3
Consumer Spending .................................................................................................................... 4
SECTION II: EXPORTER BUSINESS TIPS ............................................................................... 5
SECTION III: MARKET SECTOR STRUCTURE AND TRENDS ............................................ 7
Retail Products Sector: ................................................................................................................ 7
Food Processing Ingredients Sector: ........................................................................................... 7
Hotels, Restaurants, and Institutional (HRI): .............................................................................. 7
SECTION IV: AGRICULTURAL and FOOD IMPORTS ........................................................... 8
Agricultural & Food Import Statistics ........................................................................................ 8
Best Product Prospects Categories.............................................................................................. 8
SECTION V: KEY CONTACTS AND FURTHER INFORMATION ........................................ 9
2017 Exporter Guide 3 | P a g e
SECTION I: MARKET OVERVIEW
Morocco has positioned itself to become a regional hub for international companies active in Africa, the
Middle East, and Europe thanks in part to its economic and political stability, openness to trade and
investment, and strategic location. Unlike its regional neighbors, Morocco’s economy and food sector
are largely market driven. Since 2008, Morocco’s Plan Maroc Vert (the “Green Morocco Plan”) has
attracted significant investment and development of Morocco’s agriculture and value-added sector and
ultimately strengthened Morocco’s position as a market for bulk commodities and associated
agricultural inputs, equipment, and services. Nevertheless, Morocco’s agricultural import demand and
U.S. exports remain largely determinant on Moroccan agricultural production, which is highly volatile
one year to the next.
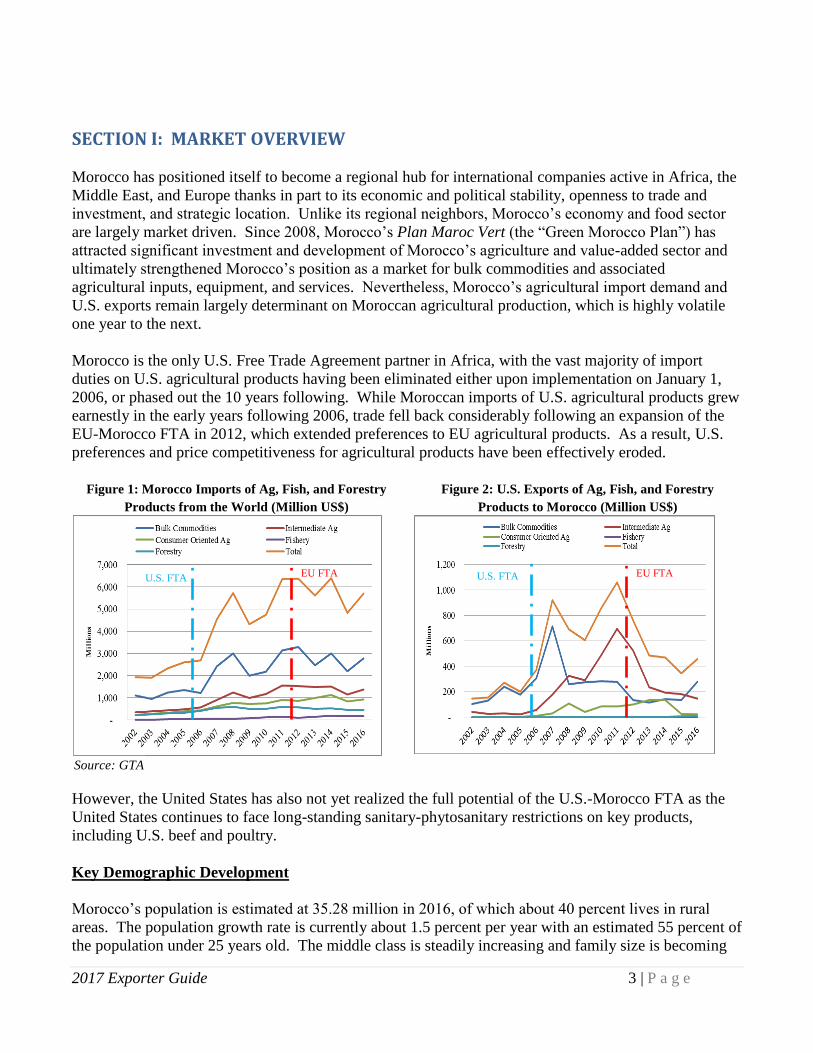
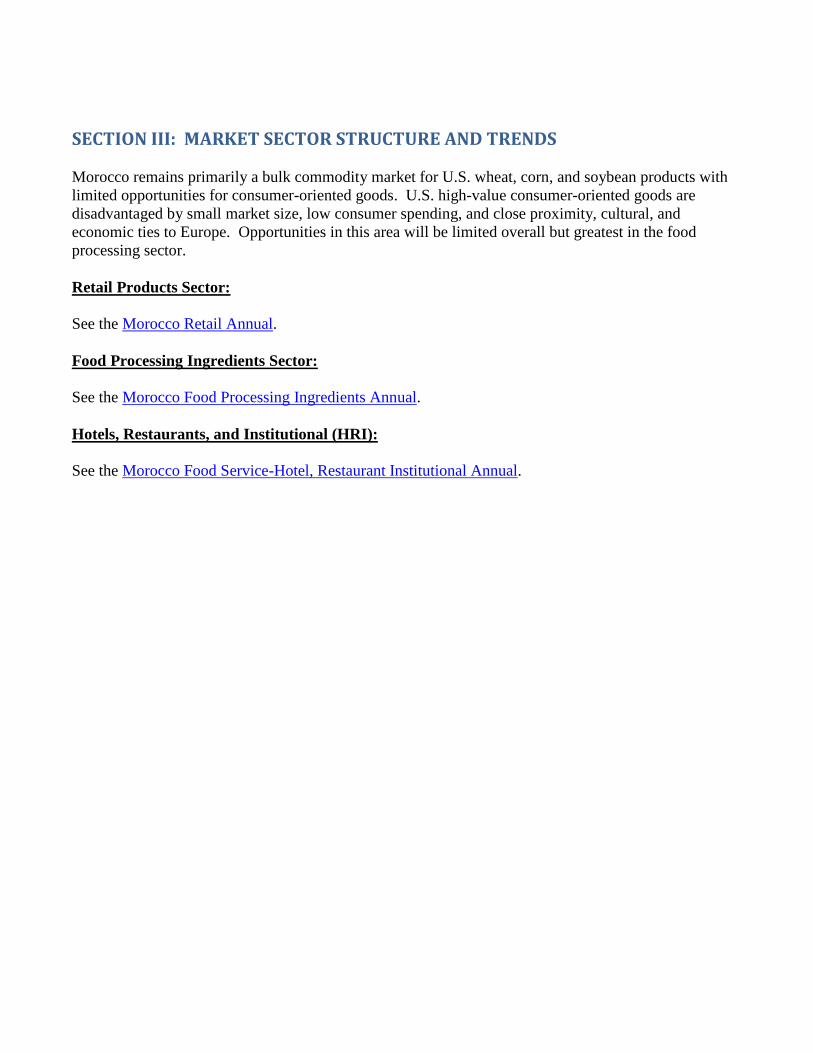
Morocco is the only U.S. Free Trade Agreement partner in Africa, with the vast majority of import
duties on U.S. agricultural products having been eliminated either upon implementation on January 1,
2006, or phased out the 10 years following. While Moroccan imports of U.S. agricultural products grew
earnestly in the early years following 2006, trade fell back considerably following an expansion of the
EU-Morocco FTA in 2012, which extended preferences to EU agricultural products. As a result, U.S.
preferences and price competitiveness for agricultural products have been effectively eroded.
Figure 1: Morocco Imports of Ag, Fish, and Forestry
Products from the World (Million US$)
Source: GTA
Figure 2: U.S. Exports of Ag, Fish, and Forestry
Products to Morocco (Million US$)
However, the United States has also not yet realized the full potential of the U.S.-Morocco FTA as the
United States continues to face long-standing sanitary-phytosanitary restrictions on key products,
including U.S. beef and poultry.
Key Demographic Development
Morocco’s population is estimated at 35.28 million in 2016, of which about 40 percent lives in rural
areas. The population growth rate is currently about 1.5 percent per year with an estimated 55 percent of
the population under 25 years old. The middle class is steadily increasing and family size is becoming
U.S. FTA EU FTA U.S. FTA EU FTA

smaller, with an average of 3-4 children. The illiteracy rate is about 32 percent, although much higher in
rural areas. Islam is the prevailing religion (over 97 percent) and Arabic the dominant language. While
Moroccans understand classical Arabic, they typically speak the local dialect (Darija) which classical
Arabic speakers may find hard to understand. French is the language most widely used in business.
English is not widely used.
For the most part, Moroccan home cooking remains traditional, but change is coming, especially in large
cities where there is a tendency for young families to adopt a western lifestyle. The number of women
working outside the home is steadily increasing, leading to higher income for the family, but also
forcing members, when they can afford it, to turn to ready to eat or semi-processed products instead of
traditional, time-consuming, homemade dishes. This is especially true in large cities like Casablanca,
Rabat, Marrakech, Fes, Agadir, and Tangier, where distribution channels have significantly developed in
recent years. Today, local producers and importers of consumer oriented food products are able to
deliver many new quality products to consumers in modern supermarkets.
Consumer Spending
Most demand for consumer
oriented food products comes from
large cities where the
population with higher income and
more modern lifestyle lives. An
estimated 10 percent of the
population (3.5 million) can afford
to buy imported products and spend
nearly 11 times more than the 10
percent of the population with the
lowest income.
Table 1: Advantages and Challenges
Advantages Challenges Mostly duty-free import regime for U.S.
products.
Market Access: Morocco’s FTAs with the EU, Turkey, and Arab states
has greatly undermined U.S. preferences while Morocco restricts U.S.
beef, poultry, and processed eggs.
Modern society Proximity: U.S. shipping lanes are limited, expensive, and infrequent
compared to Europe with many US containers transshipping Europe.
Morocco is a regional leader and possible
future hub to reach a larger, developing
African marketplace.
Language: French (and to a lesser extent Arabic) is the predominant
language of commerce. Moroccan importers traditionally do business
through European brokers and traders.
Market Size: 35 million people, 40% of which are urban and 10% of
which can afford imported products.
Culture: Morocco follows the EU, especially France
Figure 3: Household Final Consumption Expenditure in %
Source: World Bank

SECTION II: EXPORTER BUSINESS TIPS
Most importers are located in Casablanca and imports by container are mostly done through the
port of Casablanca.
In all major ports and airports, the Ministry of Agriculture has one stop shops for importers to
clear all types of imported agricultural products. The entity in charge is the DCQ (Quality
Control Division) which is a regional representative of the National Office for Food Safety
(ONSSA). To clear Customs, importers must present a sanitary certificate for all fresh fruits,
and animal or vegetable products they import. A local laboratory analysis done by official
laboratories may also be required to clear customs, especially for new and unfamiliar imported
products.
Often Moroccan importers are not familiar with products that are common in the United States.
Also, many importers are not used to U.S. grades, standards and appellations. Exporters are
advised to provide pictures, brochures, or even samples to Moroccan importers. Many local
importers require samples before making purchase commitments.
Moroccans use only the metric system for measurement.
French is still the predominant language of Moroccan commerce. Exporters with French
capabilities or French promotional materials will have a strong advantage.
Importation and distribution of food and beverage products in Morocco are handled by both
regular importers and importers who operate on an opportunity basis. Regular importers market
their products through their own sales force (typically to hotels, supermarkets, wholesalers) and
independent well-established wholesalers (in the case of small shops, restaurants). U.S.
exporters interested in selling consumer-ready food or beverages should find a local importer to
access the retail market. Importers normally have in-depth knowledge of specific importing
procedures.
Exporters should avoid visits during Ramadan, but if travel is unavoidable during this period,
exporters should hold their meetings in the morning. The holy month of Ramadan is not a
holiday but business slows down significantly because Muslims fast during the day. Most
restaurants close during this month; alcohol is not served and people are not allowed to smoke
during the day. In 2018, Ramadan will begin on Tuesday, May 15 and last for 30 days until
Thursday, June 14.
Goods transshipped through a third country port should be accompanied by:
o A bill of lading showing Morocco as the final destination of the goods and the United
States as a point of origin
o Invoices issued by the U.S. Company, addressed to the Moroccan importer
o A “certificate of non-manipulation” is also required by Moroccan customs

Close working relationships are often critical to concluding deals in Morocco. As in many
markets, Moroccans base business on trust and mutual respect built over time. U.S. exporters
should strongly consider travel to the country to develop and strengthen relationships. In
addition, working with a locally based agent or distributor typically enables U.S. firms to sustain
relationships, and to develop essential knowledge of key contacts, customs regulations, and
niche opportunities. U.S. firms should also fully understand the regulatory environment and
procedures before jumping into the market to avoid unexpected hurdles.
Business practices in Morocco differ significantly from those in the United States. For example,
bureaucratic procedures often require significantly more time to complete than in America and
often require multiple copies of documents, stamped, and signed. Moroccans have rapidly
adapted to cell phone technology and generally reply to text messages or phone calls more
quickly than email communications. Email correspondence delays should not immediately be
interpreted as lack of interest. If delays occur, U.S. firms should consider communicating by
phone or texting.
Most Moroccan importers like to buy on samples.
SECTION III: MARKET SECTOR STRUCTURE AND TRENDS
Morocco remains primarily a bulk commodity market for U.S. wheat, corn, and soybean products with
limited opportunities for consumer-oriented goods. U.S. high-value consumer-oriented goods are
disadvantaged by small market size, low consumer spending, and close proximity, cultural, and
economic ties to Europe. Opportunities in this area will be limited overall but greatest in the food
processing sector.
Retail Products Sector:
See the Morocco Retail Annual.
Food Processing Ingredients Sector:
See the Morocco Food Processing Ingredients Annual.
Hotels, Restaurants, and Institutional (HRI):
See the Morocco Food Service-Hotel, Restaurant Institutional Annual.
SECTION IV: AGRICULTURAL and FOOD IMPORTS
Agricultural & Food Import Statistics
The USDA Foreign Agricultural Service's Global Agricultural Trade System includes international
agricultural, fish, forest and textile products trade statistics dating from the inception of the Harmonized
coding system in 1989 to present.
Best Product Prospects Categories
Products present in the market that have good sales potential:
Wheat
Fats and Oils
Food Processing Ingredients (dairy, nuts, etc.)
Feed Ingredients
Products not present in significant quantities but which have good sales potential:
Food Service
Retail Products
Products not present because they face significant barriers:
Beef – no market access
Poultry – no market access
Processed Eggs – no market access

SECTION V: KEY CONTACTS AND FURTHER INFORMATION
Office of Agricultural Affairs U.S. Embassy Rabat
Address: American Embassy, km 5.7 Avenue Mohamed VI, Souissi-Rabat 10170
Phone: (212) 537 668 024
Fax: (212) 537 765 493
Email: [email protected]
Web: https://www.fas.usda.gov/regions/morocco
The Morocco Country Commercial Guide presents a comprehensive look at Morocco’s commercial
environment using economic, political and market analysis.
The Morocco Food and Agricultural Import Regulations and Standards (FAIRS) report provides an
overview of the food laws and regulatory environment in Morocco as it relates to U.S. food and
agricultural exports.
The Office of the US Trade Representative provides the final text of the US-Morocco FTA.
Table 3: Key Trade & Demographic Information for Morocco Agricultural Imports From All Countries (million $) / U.S. Market Share (%) 5,076 9
Consumer Food Imports From All Countries (million $).)/US Market Share (%) 933 2.4
Edible Fishery Imports From All Countries (million $) US Market Share (%) 164 <1
Total Population (Millions) / Annual Growth Rate (%) 35 1%
Urban Population (Millions) / Annual Growth Rate (%) 60.2% 2.26%
Number of Major Metropolitan Areas 12
Per Capita Gross Domestic Products ($U.S.) $3,004
Unemployment Rate (%) 10%
Per Capita Food Expenditures ($U.S.) $1,176
Percent of Female Population Employed (%) 26.1
Indicative Exchange Rate (Average for Calendar Year 2016) 9.8 dirham’s
Source: GATS, Morocco office de change, and High planning commission office, World Bank

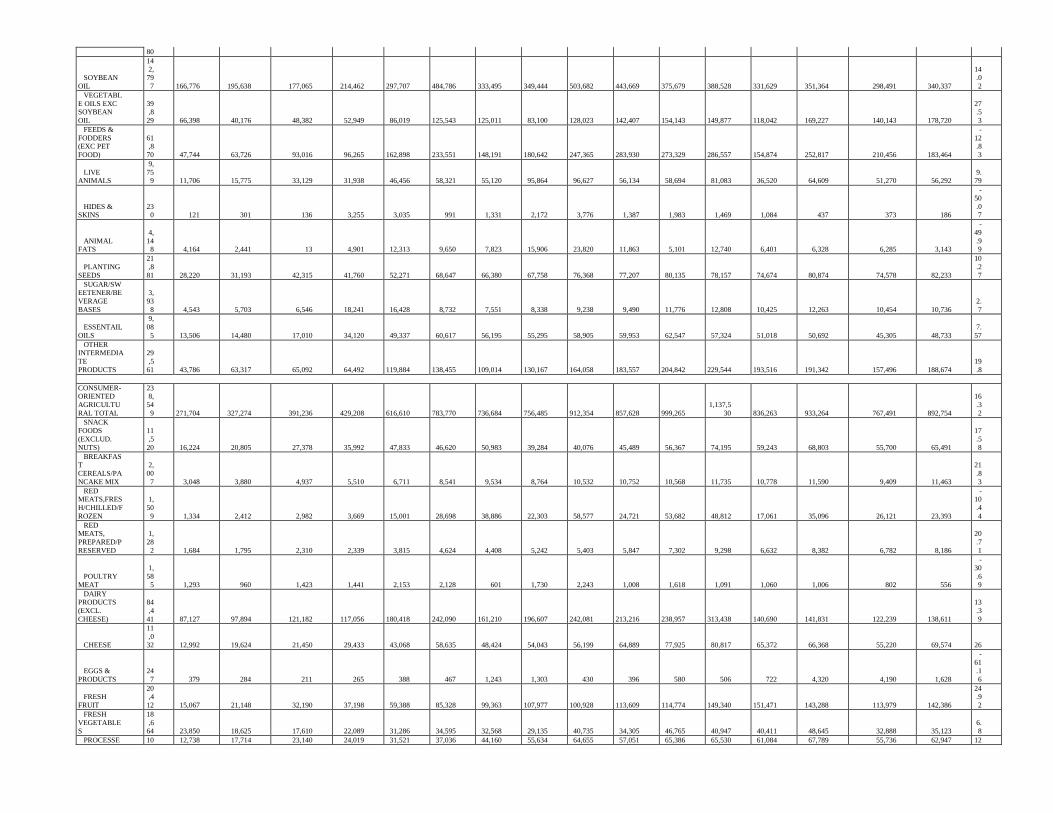
MOROCCO IMPORTS OF AGRICULTURAL, FISH & FORESTRY PRODUCTS FROM WORLD CY 2002 - 2016 AND YEAR-TO-DATE COMPARISON
(IN THOUSANDS OF DOLLARS)
IMPORTS MARKET: WORLD
CALENDAR YEARS (JAN-DEC) JANUARY - OCTOBER
COMPARISONS %
PRODUCT
20
02 2003 2004 2005 2006 2007 2008 2009 2010 2011 2012 2013 2014 2015 2016 2016 2017
CH
A
NG
E
BULK
AGRICULTU
RAL TOTAL
1,
107,
05
8 955,080 1,235,617 1,351,342 1,214,122
2,420,0
10
3,009,3
09
2,003,7
76
2,178,6
97
3,141,1
13
3,302,7
04
2,456,8
49
2,999,6
30
2,193,6
68 2,769,576 2,258,792 1,985,331
-12
.1
1
WHEAT
52
5,
93
5 380,063 553,142 464,804 346,431
1,115,8
49
1,554,4
93 658,405 833,544
1,331,5
67
1,390,4
03 960,852
1,508,2
60 867,584 1,293,688 1,043,070 702,041
-
32
.6
9
COARSE
GRAINS
20
3,
12
5 173,304 229,321 349,563 251,198 584,206 627,255 394,974 486,273 666,791 784,099 522,245 607,196 500,374 567,799 496,881 423,778
-
14
.7
1
RICE
1,
00
5 1,100 1,740 1,514 1,423 5,874 5,280 12,259 9,655 1,905 18,036 11,592 1,736 2,843 3,274 2,819 5,910
10
9.
61
SOYBEANS
78
,3
56 117,225 124,401 159,282 105,481 202,831 188,466 134,649 93,907 29,668 58,981 38,328 79,772 55,584 37,561 37,440 26,176
-30
.0
9
OTHER
OILSEEDS
5,47
0 5,951 29,226 20,485 37,760 17,450 29,614 41,216 37,940 58,409 26,432 38,083 29,350 33,668 27,923 21,587 21,865
1.
29
COTTON
37
,701 44,422 45,519 40,830 47,196 49,533 74,158 45,965 71,230 116,123 77,249 70,624 72,456 38,439 15,227 12,372 15,329
23.9
TOBACCO
14
,208 14,901 14,698 14,800 11,075 16,177 25,595 53,068 55,790 60,009 66,101 68,569 53,215 42,716 21,294 16,808 14,267
-
15
.12
RUBBER &
ALLIED
GUMS
3,
75
2 4,952 6,280 4,485 5,435 9,026 9,153 4,881 2,199 3,959 3,384 2,585 2,309 1,884 1,754 1,429 1,660
16
.1
3
RAW
COFFEE
22,7
55 26,357 25,802 31,419 44,685 62,831 71,973 68,621 58,679 84,606 101,224 94,581 83,361 84,064 80,459 70,264 78,173
11.2
6
COCOA BEANS
730 1,193 1,171 595 1,329 1,140 186 7 14 34 22 15 3 19 21 19 18
-
4.98
TEA (INCL.
HERB TEA)
57
,8
59 63,475 72,393 84,132 87,675 96,093 100,491 111,813 110,377 172,809 166,369 188,024 189,101 196,039 198,441 169,362 190,586
12
.5
3
RAW BEET
& CANE SUGARS
14
0,
895 110,448 119,106 144,806 243,475 225,323 282,303 415,044 384,896 587,934 582,294 434,647 337,160 340,676 465,512 351,054 438,750
24
.98
PULSES
11
,4
14 8,612 8,468 23,146 15,475 27,013 30,961 48,707 28,159 17,280 19,267 17,836 25,148 17,440 41,332 22,784 56,387
14
7.
48
PEANUTS
1,57
2 129 513 2,332 848 571 2,381 5,572 224 2,015 156 328 68 324 596 540 1,106
104.
75
OTHER
BULK COMMODITI
ES
2,28
3 2,950 3,835 9,149 14,634 6,093 6,997 8,594 5,809 8,005 8,688 8,541 10,495 12,014 14,693 12,362 9,285
-
24.8
9
INTERMEDIATE
AGRICULTU
RAL TOTAL
345,
38
0 389,507 442,033 488,686 581,895 901,763
1,250,5
88 986,582
1,165,1
95
1,555,3
24
1,536,1
63
1,491,2
90
1,516,4
29
1,157,0
20 1,373,029 1,155,924 1,255,793
8.
64
WHEAT
FLOUR 1 0 11 2 18 21 46 63 39 56 35 102 102 115 137 108 125
15.7
1
SOYBEAN
MEAL
22
,2 2,542 9,272 5,980 19,494 55,396 61,249 76,410 176,469 243,405 266,532 262,961 218,240 178,722 192,938 160,965 163,150
1.
36
80
SOYBEAN
OIL
14
2,79
7 166,776 195,638 177,065 214,462 297,707 484,786 333,495 349,444 503,682 443,669 375,679 388,528 331,629 351,364 298,491 340,337
14.0
2
VEGETABL
E OILS EXC SOYBEAN
OIL
39,8
29 66,398 40,176 48,382 52,949 86,019 125,543 125,011 83,100 128,023 142,407 154,143 149,877 118,042 169,227 140,143 178,720
27.5
3
FEEDS &
FODDERS (EXC PET
FOOD)
61,8
70 47,744 63,726 93,016 96,265 162,898 233,551 148,191 180,642 247,365 283,930 273,329 286,557 154,874 252,817 210,456 183,464
-
12.8
3
LIVE ANIMALS
9,
759 11,706 15,775 33,129 31,938 46,456 58,321 55,120 95,864 96,627 56,134 58,694 81,083 36,520 64,609 51,270 56,292
9.79
HIDES & SKINS
230 121 301 136 3,255 3,035 991 1,331 2,172 3,776 1,387 1,983 1,469 1,084 437 373 186
-
50
.07
ANIMAL FATS
4,
148 4,164 2,441 13 4,901 12,313 9,650 7,823 15,906 23,820 11,863 5,101 12,740 6,401 6,328 6,285 3,143
-
49
.99
PLANTING
SEEDS
21
,8
81 28,220 31,193 42,315 41,760 52,271 68,647 66,380 67,758 76,368 77,207 80,135 78,157 74,674 80,874 74,578 82,233
10
.2
7
SUGAR/SWEETENER/BE
VERAGE
BASES
3,
93
8 4,543 5,703 6,546 18,241 16,428 8,732 7,551 8,338 9,238 9,490 11,776 12,808 10,425 12,263 10,454 10,736
2.
7
ESSENTAIL
OILS
9,
08
5 13,506 14,480 17,010 34,120 49,337 60,617 56,195 55,295 58,905 59,953 62,547 57,324 51,018 50,692 45,305 48,733
7.
57
OTHER INTERMEDIA
TE
PRODUCTS
29
,5
61 43,786 63,317 65,092 64,492 119,884 138,455 109,014 130,167 164,058 183,557 204,842 229,544 193,516 191,342 157,496 188,674
19
.8
CONSUMER-ORIENTED
AGRICULTU
RAL TOTAL
238,
54
9 271,704 327,274 391,236 429,208 616,610 783,770 736,684 756,485 912,354 857,628 999,265
1,137,5
30 836,263 933,264 767,491 892,754
16
.3
2
SNACK FOODS
(EXCLUD.
NUTS)
11
,5
20 16,224 20,805 27,378 35,992 47,833 46,620 50,983 39,284 40,076 45,489 56,367 74,195 59,243 68,803 55,700 65,491
17
.5
8
BREAKFAST
CEREALS/PA
NCAKE MIX
2,
00
7 3,048 3,880 4,937 5,510 6,711 8,541 9,534 8,764 10,532 10,752 10,568 11,735 10,778 11,590 9,409 11,463
21
.8
3
RED MEATS,FRES
H/CHILLED/F
ROZEN
1,
50
9 1,334 2,412 2,982 3,669 15,001 28,698 38,886 22,303 58,577 24,721 53,682 48,812 17,061 35,096 26,121 23,393
-10
.4
4
RED MEATS,
PREPARED/P
RESERVED
1,
28
2 1,684 1,795 2,310 2,339 3,815 4,624 4,408 5,242 5,403 5,847 7,302 9,298 6,632 8,382 6,782 8,186
20
.7
1
POULTRY
MEAT
1,
58
5 1,293 960 1,423 1,441 2,153 2,128 601 1,730 2,243 1,008 1,618 1,091 1,060 1,006 802 556
-30
.6
9
DAIRY PRODUCTS
(EXCL.
CHEESE)
84
,4
41 87,127 97,894 121,182 117,056 180,418 242,090 161,210 196,607 242,081 213,216 238,957 313,438 140,690 141,831 122,239 138,611
13
.3
9
CHEESE
11
,0
32 12,992 19,624 21,450 29,433 43,068 58,635 48,424 54,043 56,199 64,889 77,925 80,817 65,372 66,368 55,220 69,574 26
EGGS &
PRODUCTS
24
7 379 284 211 265 388 467 1,243 1,303 430 396 580 506 722 4,320 4,190 1,628
-61
.1
6
FRESH
FRUIT
20,4
12 15,067 21,148 32,190 37,198 59,388 85,328 99,363 107,977 100,928 113,609 114,774 149,340 151,471 143,288 113,979 142,386
24.9
2
FRESH
VEGETABLES
18
,664 23,850 18,625 17,610 22,089 31,286 34,595 32,568 29,135 40,735 34,305 46,765 40,947 40,411 48,645 32,888 35,123
6.8
PROCESSE 10 12,738 17,714 23,140 24,019 31,521 37,036 44,160 55,634 64,655 57,051 65,386 65,530 61,084 67,789 55,736 62,947 12

D FRUIT &
VEGETABLE
S
,6
02
.9
4
FRUIT &
VEGETABLE
JUICES
3,
66
2 4,174 6,187 5,218 5,987 10,036 12,139 7,931 14,619 17,416 14,173 16,756 11,340 7,875 11,680 10,513 11,832
12
.5
4
TREE NUTS
2,04
5 4,269 1,877 3,975 4,788 5,948 6,868 10,951 9,112 13,348 9,448 12,641 13,609 9,444 15,349 11,463 23,547
105.
42
WINE & BEER
5,
308 8,805 7,486 10,323 8,088 13,564 20,336 25,563 16,107 17,039 16,590 19,725 18,605 14,197 18,972 15,801 20,192
27
.79
NURSERY
PRODUCTS &
CUT FLOWERS
11
,412 15,984 20,433 20,623 23,881 31,412 37,265 33,705 32,419 40,483 43,727 46,778 49,771 43,536 53,458 47,514 59,819
25.9
PET FOODS
(DOG & CAT
FOOD)
1,
09
9 1,307 1,792 1,865 2,121 2,271 4,297 3,314 3,351 4,079 4,374 4,517 6,015 5,834 6,860 5,624 7,522
33
.7
3
OTHER CONSUMER
ORIENTED
PRODUC
51
,7
23 61,429 84,358 94,418 105,330 131,797 154,102 163,840 158,853 198,131 198,034 224,924 242,483 200,853 229,827 193,510 210,484
8.
77
FOREST
PRODUCTS
TOTAL
22
1,
84
1 268,543 308,030 335,457 418,219 551,146 605,880 509,121 515,193 588,705 569,135 496,961 534,627 465,932 472,443 390,691 189,871
-
51
.4
LOGS & CHIPS
25
,960 25,666 31,275 33,564 65,272 38,988 65,637 24,901 56,353 72,851 36,063 14,515 13,412 13,992 10,610 8,147 1,213
-
85
.11
HARDWOO
D LUMBER
40
,9
24 46,371 69,721 58,548 59,951 92,083 86,357 66,522 51,423 44,630 42,191 44,010 47,704 42,786 43,976 37,356 36,572
-
2.
1
SOFTWOOD AND
TREATED
LUMBER
122,
89
8 153,175 158,450 183,503 216,769 305,619 313,572 258,839 266,714 298,060 292,224 265,221 282,140 231,456 217,597 180,753 0
-
10
0
PANEL PRODUCTS
(INC.
PLYWOOD)
19
,4
64 26,073 27,481 41,224 45,753 61,963 75,967 91,152 83,388 102,353 99,766 108,430 115,036 103,881 127,118 102,779 110,458
7.
47
OTHER VALUE-
ADDED
WOOD PRODUCT
12
,595 17,258 21,103 18,618 30,473 52,492 64,346 67,708 57,315 70,811 98,891 64,784 76,334 73,816 73,142 61,657 41,628
-
32
.48
FISH AND
SEAFOOD
PRODUCTS TOTAL
11
,579 19,019 30,846 34,208 54,694 56,528 67,392 91,667 117,545 147,994 113,695 158,948 199,099 174,757 163,793 138,185 99,459
-
28
.03
SALMON
25
7 462 1,083 1,647 2,050 2,222 2,592 3,874 4,937 6,508 6,173 7,826 8,833 7,586 9,518 7,716 9,302
20
.5
5
SURIMI 16 35 15 36 57 1,014 14 64 2,426 2,981 3,777 7,216 5,635 0 0 0 0
n/
a
CRUSTACE
ANS
2,51
4 3,788 3,383 3,924 10,048 19,586 27,719 40,552 69,185 90,386 68,915 95,826 102,010 92,419 81,547 68,413 31,508
-
53.9
4
GROUNDFI
SH & FLATFISH
1,
607 1,789 2,226 2,403 4,111 4,780 3,880 4,646 8,991 10,330 7,688 12,715 15,288 8,967 4,960 4,202 6,366
51
.49
MOLLUSCS 19
1 788 954 1,069 1,845 2,515 4,717 5,888 7,452 12,008 12,616 13,191 16,861 15,524 17,998 14,936 1,534
-
89
.73
OTHER
FISHERY
PRODUCTS
6,
99
5 12,157 23,185 25,129 36,582 26,411 28,471 36,644 24,553 25,781 14,526 22,174 50,472 50,261 49,769 42,918 50,749
18
.2
5
AGRICULTU
RAL PRODUCT
TOTAL
1,
69
0,98
7
1,616,2
91 2,004,924 2,231,265 2,225,224
3,938,3
84
5,043,6
68
3,727,0
42
4,100,3
76
5,608,7
91
5,696,4
94
4,947,4
04
5,653,5
89
4,186,9
51 5,075,869 4,182,208 4,133,877
-1.
16
AGRICULTU
RAL, FISH & FORESTRY
1,
924,
1,903,853 2,343,800 2,600,930 2,698,137
4,546,058
5,716,940
4,327,830
4,733,114
6,345,490
6,379,324
5,603,312
6,387,315
4,827,640 5,712,104 4,711,085 4,423,207
-
6.11

TOTAL 40
7
MOROCCO IMPORTS OF AGRICULTURAL, FISH & FORESTRY PRODUCTS FROM UNITED STATES CY 2002 - 2016 AND YEAR-TO-DATE COMPARISON
(IN THOUSANDS OF DOLLARS)
IMPORTS MARKET: UNITED STATES
CALENDAR YEARS (JAN-DEC) JANUARY - OCTOBER
COMPARISONS %
PRODUCT 2002 2003
20
04 2005 2006 2007 2008 2009 2010 2011 2012 2013 2014 2015 2016
201
6 2017 CHANGE
BULK AGRICULTURAL
TOTAL 104,850
129,49
2
238,
30
3
177,76
3 307,032 715,452 257,650 276,255 282,763 277,812 135,551 113,806 140,594 132,848
280,10
6
166,
481
218,91
2 31.49
WHEAT 9,834 33,073
80,7
37 1,908 51,010 349,324 51,573 42,078 112,373 91,819 23 35,306 2,820 26
106,40
8
8,65
2 78,640 808.96
COARSE GRAINS 50,987 44,222
12
0,39
9
110,41
5 178,335 222,729 141,761 166,452 75,507 94,971 12,919 2 60,773 58,180
143,04
7
127,
762
110,80
8 -13.27
RICE 1 0 14 3 3 4 42 17 20 33 9,522 134 0 75 62 44 176 301.17
SOYBEANS 43,381 50,642
36,6
64 64,242 76,555 140,740 54,969 45,590 59,104 29,510 58,874 31,156 27,338 47,772 28,145
28,1
45 23,268 -17.33
OTHER OILSEEDS 626 340
45
6 871 589 929 1,149 831 1,438 2,017 1,888 1,967 1,771 1,075 1,153 744 2,723 265.82
COTTON 0 556 1 0 0 1,098 7,492 19,412 33,418 58,560 51,902 44,287 45,010 24,844 0 0 1,217 n/a
TOBACCO 0 0 0 0 0 0 0 0 0 0 0 0 601 0 337 337 750 122.21
RUBBER & ALLIED GUMS 0 4 7 18 8 0 35 33 0 26 3 6 17 6 2 0 5 168,432.06
RAW COFFEE 0 0 0 0 0 103 0 0 0 0 0 0 0 0 2 2 1 -55.11
COCOA BEANS 0 0 0 0 0 0 0 0 0 0 0 0 0 0 0 0 0 n/a
TEA (INCL. HERB TEA) 0 16 0 0 0 0 0 0 0 248 14 42 40 119 47 28 15 -46.46
RAW BEET & CANE SUGARS 0 0 0 0 0 0 0 0 0 0 0 0 0 0 0 0 0 -100
PULSES 20 638 24 289 532 525 629 1,840 897 622 402 901 2,223 751 875 738 1,308 77.17
PEANUTS 0 0 0 9 0 0 0 0 0 0 0 0 0 0 29 29 0 -100
OTHER BULK
COMMODITIES 1 0 2 8 0 0 0 3 6 7 3 5 0 0 0 0 1 n/a
INTERMEDIATE
AGRICULTURAL TOTAL 40,340 23,942
29,0
81 20,260 57,029 178,997 325,639 288,683 486,250 694,193 523,518 235,245 192,319 182,538
148,40
4
132,
138
152,18
0 15.17
WHEAT FLOUR 0 0 0 0 0 0 0 0 0 0 0 0 0 0 0 0 0 n/a
SOYBEAN MEAL 11,993 0 0 0 19,494 55,396 59,848 76,410 176,469 243,405 266,532 120,196 69,875 55,882 52,901 50,7
54 54,202 6.79
SOYBEAN OIL 15,318 12,080
12
,3
64 88 11,315 61,313 158,354 153,719 218,500 327,370 154,157 21,789 38,308 66,083 13,941
13,9
41 24,703 77.19
VEGETABLE OILS EXC
SOYBEAN OIL 1,447 2,194
1,37
6 96 721 1,960 735 3,732 6,193 3,150 82 76 715 2,406 439 302 184 -39.22
FEEDS & FODDERS (EXC PET FOOD) 5,672 2,142
10
,065 16,092 16,541 38,951 81,895 40,312 59,399 83,712 81,003 77,445 61,847 45,173 66,882
54,186 59,554 9.91
LIVE ANIMALS 39 0 0 0 57 4,406 7,993 704 1,016 1,233 1,456 1,731 2,477 1,115 2,209
1,88
4 1,947 3.36
HIDES & SKINS 0 0 0 0 0 0 0 0 0 0 0 0 7 0 0 0 0 n/a
ANIMAL FATS 3,948 3,809
2,08
2 0 4,888 12,303 9,647 7,805 15,897 23,811 11,862 5,099 12,635 5,598 5,252
5,25
2 3,020 -42.49
PLANTING SEEDS 1,253 2,001
2,
175 3,115 2,550 2,794 2,955 3,165 4,711 7,318 4,476 5,501 4,630 4,270 5,653
4,852 3,756 -22.59
SUGAR/SWEETENER/BEVE
RAGE BASES 2 2 3 4 8 1 761 159 44 93 29 41 135 71 5 4 7 57.17
ESSENTAIL OILS 470 1,014 630 525 515 656 1,325 1,406 1,853 1,731 1,417 1,570 566 611 276 236 268 13.38
OTHER INTERMEDIATE
PRODUCTS 198 700
38
6 339 938 1,217 2,126 1,269 2,168 2,370 2,505 1,797 1,123 1,329 846 726 4,539 524.81
CONSUMER-ORIENTED
AGRICULTURAL TOTAL 1,235 2,162
2,76
2 3,758 10,352 27,619 107,663 39,706 83,799 84,925 97,664 132,757 132,527 26,461 23,373
18,2
29 29,990 64.52
SNACK FOODS (EXCLUD.
NUTS) 0 0 8 2 0 4 2 10 13 11 14 101 197 163 147 72 152 112.29
BREAKFAST 40 0 5 4 0 0 11 0 0 5 4 0 5 15 12 6 18 185.25

CEREALS/PANCAKE MIX
RED
MEATS,FRESH/CHILLED/FROZEN 6 0 0 0 12 0 560 0 0 0 0 0 39 0 0 0 0 n/a
RED MEATS,
PREPARED/PRESERVED 0 0 0 0 0 0 0 0 0 6 2 1 261 1 0 0 0 n/a
POULTRY MEAT 24 0 0 0 0 0 0 0 0 0 0 0 0 0 0 0 0 n/a
DAIRY PRODUCTS (EXCL. CHEESE) 72 0
552 231 4,199 18,400 82,611 23,446 61,370 51,683 62,394 88,901 91,166 7,421 1,542
1,542 5,408 250.72
CHEESE 38 57 65 0 583 2,610 11,449 2,129 8,349 12,753 14,646 20,043 13,621 2,205 1,449
1,44
9 1,660 14.53
EGGS & PRODUCTS 0 0 0 0 2 0 1 0 0 1 0 0 0 0 442 442 461 4.11
FRESH FRUIT 29 43 55 84 233 577 1,700 2,042 888 454 391 538 385 55 1 1 2 89.94
FRESH VEGETABLES 0 0 0 0 0 0 0 0 0 0 0 31 77 12 12 12 23 99.36
PROCESSED FRUIT & VEGETABLES 136 78
307 438 85 75 174 250 1,747 857 1,454 2,931 2,479 1,060 1,502
1,453 921 -36.59
FRUIT & VEGETABLE
JUICES 33 0 0 0 0 0 265 0 0 561 59 897 2,113 412 138 136 136 -0.45
TREE NUTS 100 1,202 394 447 2,055 1,761 3,114 5,734 5,270 9,328 6,716 8,516 10,973 5,716 8,838
5,240 9,788 86.81
WINE & BEER 1 8 4 5 0 6 1 30 10 119 523 583 866 1,122 1,409
1,24
1 1,459 17.6
NURSERY PRODUCTS &
CUT FLOWERS 110 178
17
5 128 60 125 581 121 266 608 1,016 1,130 467 828 2,172
2,17
2 4,318 98.83
PET FOODS (DOG & CAT
FOOD) 28 11 24 7 0 0 100 51 108 187 175 219 310 312 172 172 72 -58.33
OTHER CONSUMER ORIENTED PRODUC 616 584
1,
172 2,413 3,123 4,062 7,096 5,892 5,778 8,353 10,269 8,867 9,569 7,140 5,536
4,291 5,572 29.85
FOREST PRODUCTS
AGRICULTURAL TOTAL 306 323
40
1 332 298 1,026 1,126 1,514 1,483 3,589 2,856 2,948 4,291 5,015 4,788
4,34
7 2,978 -31.5
LOGS & CHIPS 18 0 0 0 9 0 103 114 129 0 0 0 0 0 0 0 0 n/a
HARDWOOD LUMBER 189 245 319 239 125 584 469 667 1,182 1,595 1,723 2,186 2,672 3,983 3,789
3,550 2,837 -20.06
SOFTWOOD AND
TREATED LUMBER 0 0 10 9 0 294 178 53 114 1,889 1,082 587 1,176 598 843 653 0 -100
PANEL PRODUCTS (INC. PLYWOOD) 94 0 0 26 24 0 77 121 23 0 2 0 88 8 62 59 131 123.46
OTHER VALUE-ADDED
WOOD PRODUCT 6 78 72 57 141 148 299 558 35 105 48 174 356 426 94 86 9 -89.19
FISH AND SEAFOOD PRODUCTS AGRICULTURAL
TOTAL 25 87 71 5 31 64 156 159 258 287 438 843 438 499 1,063 762 286 -62.46
SALMON 0 13 6 0 0 0 0 0 0 0 0 29 18 0 0 0 0 n/a
SURIMI 0 0 1 0 0 0 0 0 2 2 91 165 0 0 0 0 0 n/a
CRUSTACEANS 0 0 0 0 17 8 90 66 72 18 24 37 29 0 0 0 0 n/a
GROUNDFISH & FLATFISH 0 0 0 0 0 1 0 0 0 5 1 146 41 0 9 6 43 590.2
MOLLUSCS 0 0 63 0 8 43 58 84 174 245 308 461 227 417 772 474 0 -100
OTHER FISHERY
PRODUCTS 25 74 0 5 6 12 8 10 9 17 14 5 123 83 283 281 243 -13.65
AGRICULTURAL PRODUCT
TOTAL 146,425
155,59
6
27
0,14
6
201,78
1 374,412 922,068 690,952 604,643 852,812
1,056,9
30 756,733 481,808 465,439 341,848
451,88
4
316,
848
401,08
3 26.59
AGRICULTURAL, FISH &
FORESTRY TOTAL 146,756
156,00
5
270,
61
8
202,11
8 374,742 923,157 692,235 606,316 854,553
1,060,8
07 760,027 485,599 470,168 347,362
457,73
5
321,
956
404,34
6 25.59