
MORICHES BAY HARD CLAM GROWTH RATE STUDY REPORT · The growth rate of adult hard clams slows with...
37
ATLANTIC COAST OF LONG ISLAND, FIRE ISLAND INLET TO MONTAUK POINT, NY SHORE PROTECTION AND STORM DAMAGE REDUCTION REFORMULATION STUDY MORICHES BAY HARD CLAM GROWTH RATE STUDY REPORT March 2001 Prepared by: U.S. Army Corps of Engineers New York District Planning Division 26 Federal Plaza New York, New York 10278-0090
Transcript of MORICHES BAY HARD CLAM GROWTH RATE STUDY REPORT · The growth rate of adult hard clams slows with...

ATLANTIC COAST OF LONG ISLAND, FIRE ISLAND INLET TO MONTAUK POINT, NYSHORE PROTECTION AND STORM DAMAGE REDUCTION REFORMULATION STUDY
MORICHES BAY HARD CLAM GROWTH RATE STUDY REPORT
March 2001
Prepared by: U.S. Army Corps of Engineers New York District Planning Division 26 Federal Plaza New York, New York 10278-0090
TABLE OF CONTENTS SECTION PAGE 1.0 INTRODUCTION............................................................................................................... 1
2.0 METHODS .......................................................................................................................... 2
2.1 SITE DESCRIPTION ............................................................................................................ 2
2.2 WATER QUALITY .............................................................................................................. 2
2.3 GROWTH RATES................................................................................................................ 4
2.3.1 Background ................................................................................................................4
2.3.2 Study Design...............................................................................................................5
2.4 DATA ANALYSIS AND PRESENTATION .............................................................................. 8
2.4.1 Water Quality Data....................................................................................................8
2.4.2 Growth Rates..............................................................................................................8
3.0 RESULTS .......................................................................................................................... 10
3.1 WATER QUALITY ............................................................................................................ 10
3.2 OBSERVED GROWTH RATES........................................................................................... 10
3.2.1 May 31/June 3 – July 13 ..........................................................................................10
3.2.2 July 15 – October 11 ................................................................................................14
3.3 GROWTH RATE MODELS ................................................................................................ 21
4.0 CONCLUSIONS ............................................................................................................... 30
5.0 LITERATURE CITED .................................................................................................... 31
SHORE PROTECTION AND STORM DAMAGE REDUCTION REFORMULATION STUDY
Hard Clam Growth Rate Study Report – Revised Draft -i- March, 2001
ATLANTIC COAST OF LONG ISLAND, FIRE ISLAND INLET TO MONTAUK POINT, NEW YORK
LIST OF FIGURES FIGURES PAGE FIGURE 1. SITE LOCATION MAP....................................................................................................3
FIGURE 2. COASTAL AQUACULTURE SHELLFISH GROWOUT CAGES...........................................6
FIGURE 3. LENGTH, WIDTH, AND DEPTH MEASUREMENTS OF HARD CLAMS, MERCENARIA MERCENARIA. ..............................................................................................................7
FIGURE 4. MEAN TEMPERATURE AND SALINITY RECORDED AT THREE GROW-OUT SITES, JUNE 30 – OCTOBER 9, 2000. ............................................................................................11
FIGURE 5. LENGTH FREQUENCIES OF LIVE AND DEAD CLAMS MEASURED AT ALL THREE SITES DURING THE FIRST PHASE I OF THE STUDY..............................................................13
FIGURE 6. LENGTH FREQUENCIES OF LIVE AND DEAD CLAMS MEASURED AT MORICHES INLET DURING THE SECOND PHASE OF THE STUDY.............................................................18
FIGURE 7. LENGTH FREQUENCIES OF LIVE AND DEAD CLAMS MEASURED AT FORGE RIVER DURING THE SECOND PHASE OF THE STUDY.............................................................19
FIGURE 8. LENGTH FREQUENCIES OF LIVE AND DEAD CLAMS MEASURED AT SMITHS POINT DURING THE SECOND PHASE OF THE STUDY.............................................................20
FIGURE 9. LINEAR REGRESSIONS FIT TO MEAN SIZE OF LENGTH (TOP), WIDTH (MIDDLE) AND DEPTH (BOTTOM) AT ALL THREE SITES, JULY – SEPTEMBER, 2000. ......................23
FIGURE 10. LINEAR REGRESSIONS FIT TO MEAN SIZE OF LENGTH (TOP), WIDTH (MIDDLE) AND DEPTH (BOTTOM) AT ALL THREE SITES, JULY – OCTOBER, 2000. .........................24
FIGURE 11. LINEAR REGRESSIONS FIT TO MEAN SIZE AND DRY WEIGHT ESTIMATES AT ALL THREE SITES, JULY – SEPTEMBER, 2000. ................................................................25
SHORE PROTECTION AND STORM DAMAGE REDUCTION REFORMULATION STUDY
Hard Clam Growth Rate Study Report – Revised Draft -ii- March, 2001
ATLANTIC COAST OF LONG ISLAND, FIRE ISLAND INLET TO MONTAUK POINT, NEW YORK

LIST OF TABLES TABLES PAGE TABLE 1. MEAN LENGTHS, WIDTHS, AND DEPTHS FOR CLAMS MEASURED FROM ALL CAGES
AND SITES ON MAY 31/JUNE 3 AND JULY 13, 2000..................................................12
TABLE 2. MEAN LENGTHS, WIDTHS, AND DEPTHS FOR CLAMS MEASURED FROM ALL CAGES AND SITES ON JULY 15, AUGUST 10, SEPTEMBER 11, AND OCTOBER 11, 2000......15
TABLE 3. RESULTS OF ONE-WAY ANALYSIS OF VARIANCE TEST (F TEST) FOR EQUAL MEAN LENGTHS AMONG CAGES (INCLUDING CONTROLS) AT EACH GROW-OUT SITE AND SAMPLING DATE........................................................................................................17
TABLE 4. DRY WEIGHT MEASUREMENTS FOR INDIVIDUAL CLAMS SAMPLED DURING AUGUST, SEPTEMBER, AND OCTOBER, 2000. .........................................................................22
TABLE 5. REGRESSION COEFFICIENTS AND ESTIMATED MONTHLY SHELL GROWTH RATES (MM) FOR CLAMS AT THREE GROW-OUT SITES IN MORICHES BAY, JULY 15 – SEPTEMBER 11, 2000................................................................................................26
TABLE 6. REGRESSION COEFFICIENTS AND ESTIMATED MONTHLY SHELL GROWTH RATES FOR CLAMS AT THREE GROW-OUT SITES IN MORICHES BAY, JULY 15 – OCTOBER 11, 2000. .........................................................................................................................27
TABLE 7. REGRESSION COEFFICIENTS FOR CLAM DRY WEIGHTS AT THREE GROW OUT SITES IN MORICHES BAY, AUGUST 9 – OCTOBER 11, 2000. .................................................28
SHORE PROTECTION AND STORM DAMAGE REDUCTION REFORMULATION STUDY
Hard Clam Growth Rate Study Report – Revised Draft -iii- March, 2001
ATLANTIC COAST OF LONG ISLAND, FIRE ISLAND INLET TO MONTAUK POINT, NEW YORK
1.0 INTRODUCTION The Army Corps of Engineers, NY District (District) is conducting a reformulation of the shore protection and storm damage reduction project for the south shore of Long Island, New York, from Fire Island Inlet to Montauk Point. The project area includes the barrier islands, the Atlantic Ocean shorelines and adjacent back-bay areas of the Great South Bay, Moriches Bay, and Shinnecock Bay. Historically documented breaches resulting from major storm events have occurred along the project shoreline (USACE 1995). The Hurricane of 1938 created several openings to Moriches and Shinnecock Bays. During January 1980, a breach formed about 1,000 feet east of the eastern jetty of Moriches Inlet. Other locations along the study area have experienced breaching, overwash, or shoreline/dune recession sufficient to suggest that future storms could result in severe overwash or breach formation (USACE 1995). The purpose of this study was to simulate the change in water parameters in the bay that could occur if the barrier island separating Great South Bay from the ocean were breached and the effect the resulting increase in salinity would have on the growth rate of the hard clam (Mercenaria mercenaria). The hard clam is harvested recreationally and is the most extensively distributed commercial clam in the United States (Ritchie 1977). According to Stanley (1983), the absence of hard clam populations is an ecological indicator of disturbance; changes in the population and recruitment of this species can be an indicator of the overall viability of coastal ecosystems. Adult clams do not move, and re-population of depleted hard clam beds requires larval settlement and several years of growth.
SHORE PROTECTION AND STORM DAMAGE REDUCTION REFORMULATION STUDY
Hard Clam Growth Rate Study Report – Revised Draft -1- March, 2001
ATLANTIC COAST OF LONG ISLAND, FIRE ISLAND INLET TO MONTAUK POINT, NEW YORK

2.0 METHODS This study had two major components:
• To establish three hard clam grow-out stations with different mean salinities and monitor monthly growth rates of clams at each station.
• To monitor water parameters (salinity, temperature, dissolved oxygen, pH, specific conductivity and turbidity) in the grow-out area of the bay on a bimonthly basis during the course of the study.
2.1 SITE DESCRIPTION The study area was located on the south shore of Long Island in Suffolk County, New York, in the townships of Brookhaven and South Hampton and within the waters of Moriches Bay (the bay). The bay is connected to the Atlantic Ocean through Moriches Inlet (MI) and by narrow channels to Great South Bay in the west and Shinnocock Bay to the east. Moriches Bay is a shallow coastal lagoon, nearly 13 kilometers (km) long, and 1.5 – 4 km wide and has a depth at mean low water of 0.5 – 1.2 meter (m) with a mean tidal range of 0.2 m (Turner 1983). Open ocean water entering the bay through MI has a major influence on the hydrography of the bay. The inlet effectively divides the bay into eastern (Moriches Bay) and western (Narrow Bay) halves. 2.2 WATER QUALITY Bi-monthly monitoring was conducted during eight sampling periods from late June to early October at each grow-out location and at four additional locations in the bay using Hydrolab Datasonde units (Figure 1). The units were secured in place with 15-pound (lb) mushroom anchors and suspended in the water column with 9-inch round buoy markers. They were programmed to take readings every 20 minutes and were left in the water for 24 – 48 hour intervals. Upon retrieval, data were downloaded onto a laptop computer and entered into spreadsheet data files.
SHORE PROTECTION AND STORM DAMAGE REDUCTION REFORMULATION STUDY
Hard Clam Growth Rate Study Report – Revised Draft -2- March, 2001
ATLANTIC COAST OF LONG ISLAND, FIRE ISLAND INLET TO MONTAUK POINT, NEW YORK
Figure 1. Site Location Map.
SHORE PROTECTION AND STORM DAMAGE REDUCTION REFORMULATION STUDY
Hard Clam Growth Rate Study Report – Revised Draft -3- March, 2001
ATLANTIC COAST OF LONG ISLAND, FIRE ISLAND INLET TO MONTAUK POINT, NEW YORK
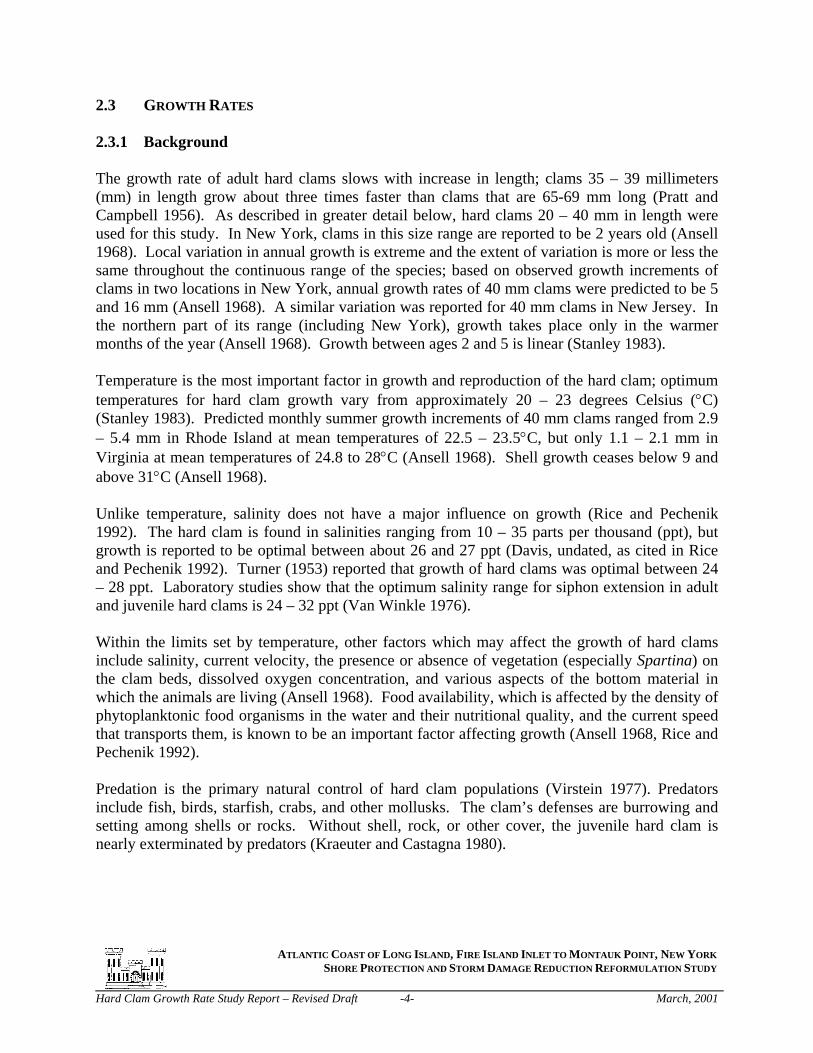
2.3 GROWTH RATES 2.3.1 Background The growth rate of adult hard clams slows with increase in length; clams 35 – 39 millimeters (mm) in length grow about three times faster than clams that are 65-69 mm long (Pratt and Campbell 1956). As described in greater detail below, hard clams 20 – 40 mm in length were used for this study. In New York, clams in this size range are reported to be 2 years old (Ansell 1968). Local variation in annual growth is extreme and the extent of variation is more or less the same throughout the continuous range of the species; based on observed growth increments of clams in two locations in New York, annual growth rates of 40 mm clams were predicted to be 5 and 16 mm (Ansell 1968). A similar variation was reported for 40 mm clams in New Jersey. In the northern part of its range (including New York), growth takes place only in the warmer months of the year (Ansell 1968). Growth between ages 2 and 5 is linear (Stanley 1983). Temperature is the most important factor in growth and reproduction of the hard clam; optimum temperatures for hard clam growth vary from approximately 20 – 23 degrees Celsius (°C) (Stanley 1983). Predicted monthly summer growth increments of 40 mm clams ranged from 2.9 – 5.4 mm in Rhode Island at mean temperatures of 22.5 – 23.5°C, but only 1.1 – 2.1 mm in Virginia at mean temperatures of 24.8 to 28°C (Ansell 1968). Shell growth ceases below 9 and above 31°C (Ansell 1968). Unlike temperature, salinity does not have a major influence on growth (Rice and Pechenik 1992). The hard clam is found in salinities ranging from 10 – 35 parts per thousand (ppt), but growth is reported to be optimal between about 26 and 27 ppt (Davis, undated, as cited in Rice and Pechenik 1992). Turner (1953) reported that growth of hard clams was optimal between 24 – 28 ppt. Laboratory studies show that the optimum salinity range for siphon extension in adult and juvenile hard clams is 24 – 32 ppt (Van Winkle 1976). Within the limits set by temperature, other factors which may affect the growth of hard clams include salinity, current velocity, the presence or absence of vegetation (especially Spartina) on the clam beds, dissolved oxygen concentration, and various aspects of the bottom material in which the animals are living (Ansell 1968). Food availability, which is affected by the density of phytoplanktonic food organisms in the water and their nutritional quality, and the current speed that transports them, is known to be an important factor affecting growth (Ansell 1968, Rice and Pechenik 1992). Predation is the primary natural control of hard clam populations (Virstein 1977). Predators include fish, birds, starfish, crabs, and other mollusks. The clam’s defenses are burrowing and setting among shells or rocks. Without shell, rock, or other cover, the juvenile hard clam is nearly exterminated by predators (Kraeuter and Castagna 1980).
SHORE PROTECTION AND STORM DAMAGE REDUCTION REFORMULATION STUDY
Hard Clam Growth Rate Study Report – Revised Draft -4- March, 2001
ATLANTIC COAST OF LONG ISLAND, FIRE ISLAND INLET TO MONTAUK POINT, NEW YORK

2.3.2 Study Design Three grow-out sites were chosen based on salinity data collected in May using a corded Hydrolab Datasonde H2O probe unit that was deployed at a number of locations at varying distances from the inlet. These locations were in MI, east of the mouth of the Forge River (FR) and north of Masury Point, and east of MI (Figure 1). Clams used for the study were acquired from the Cornell Cooperative hatchery in Southhold and were put into bottom culture grow-out cages in order to control predation and provide access for monthly measurements (Figure 2). The growth study was conducted from early June to mid-October, 2000. Because a number of cages were either destroyed or lost during June and July, the experiment was started over in mid-July with additional clams that were added to those remaining at the end of the first six weeks of the study. One of the grow-out locations was moved during the second part of the study. Due to the addition of new clams to the grow-out cages in mid-July, data from the first and second study periods were treated separately. All clams were measured by length, width and depth (Figure 3) at the start and end of the first and second growth periods. All measurements were made using calipers that measured to the nearest 0.1 mm. Sub-samples from each cage at each site were measured on two sampling occasions during the second growth period. Growth Period I (June 3 - July 12) The original experimental design consisted of five replicate cages of 50 clams each and two control cages, one with 50 clams and one with 32 clams, deployed at each of the three grow-out locations. The control cages of 50 and 32 were established to test for differences in growth that could be caused by clam density. The five sample cages were set in line and secured to each other with a 5-ft length of rope with a 15 lb mushroom anchor at each end. The two control cages were set up in the same manner and set parallel to the sample cages. The cages used were Coastal Aquaculture (CA) model OBC-3 cages with a 5/8 inch square mesh. The three original grow-out sites were the original MI site (high salinity), FR (medium salinity), and a low salinity site located approximately 1 mile east of the inlet (Figure 1). Cages at the original MI site were lost or destroyed in June, presumably as a result of heavy recreational boating in the area. In addition, the site east of the inlet (EI) was disturbed in July when cages were dislodged from the bottom during an extreme weather event. At this time (July 12, 2000) the study was terminated and clams were collected, consolidated by site, and measured. The shells of the clams that died were also measured. The clams that survived were then combined with additional clams provided by Cornell Cooperative to restart the study. Growth Period II (July 15 – October 11, 2000) The sampling design was modified during the second part of the study. Three sample cages and one control cage, each containing 50 clams, were deployed at each grow-out location (MI, FR, and a new low salinity site located near Smith Point (SP), just east of the Fire Island bridge, (Figure 1).
SHORE PROTECTION AND STORM DAMAGE REDUCTION REFORMULATION STUDY
Hard Clam Growth Rate Study Report – Revised Draft -5- March, 2001
ATLANTIC COAST OF LONG ISLAND, FIRE ISLAND INLET TO MONTAUK POINT, NEW YORK

Figure 2. Coastal Aquaculture Shellfish Growout Cages.
SHORE PROTECTION AND STORM DAMAGE REDUCTION REFORMULATION STUDY
Hard Clam Growth Rate Study Report – Revised Draft -6- March, 2001
ATLANTIC COAST OF LONG ISLAND, FIRE ISLAND INLET TO MONTAUK POINT, NEW YORK
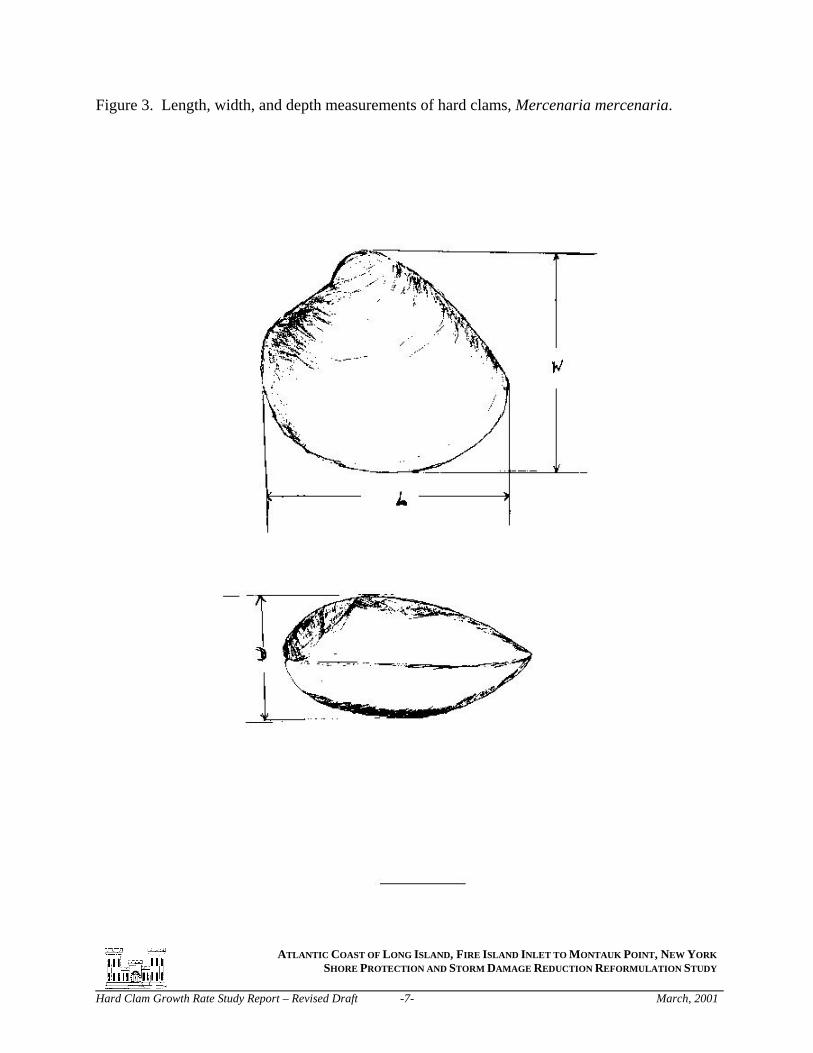
Figure 3. Length, width, and depth measurements of hard clams, Mercenaria mercenaria.
SHORE PROTECTION AND STORM DAMAGE REDUCTION REFORMULATION STUDY
Hard Clam Growth Rate Study Report – Revised Draft -7- March, 2001
ATLANTIC COAST OF LONG ISLAND, FIRE ISLAND INLET TO MONTAUK POINT, NEW YORK
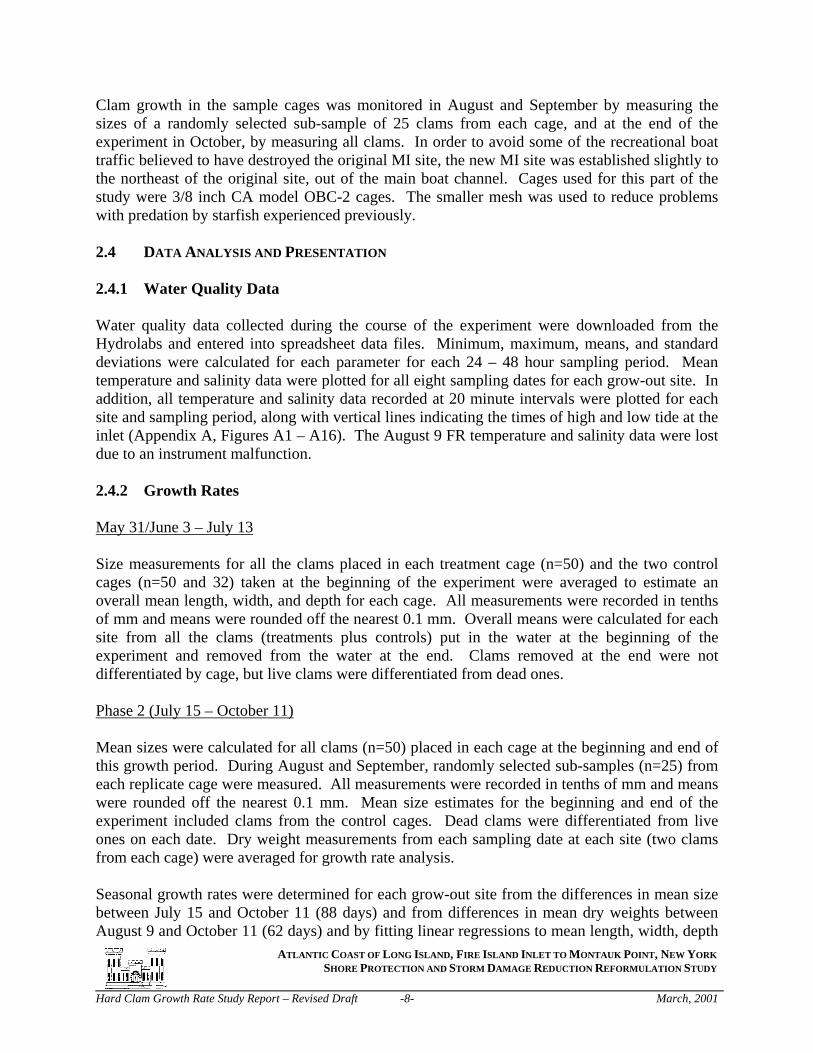
Clam growth in the sample cages was monitored in August and September by measuring the sizes of a randomly selected sub-sample of 25 clams from each cage, and at the end of the experiment in October, by measuring all clams. In order to avoid some of the recreational boat traffic believed to have destroyed the original MI site, the new MI site was established slightly to the northeast of the original site, out of the main boat channel. Cages used for this part of the study were 3/8 inch CA model OBC-2 cages. The smaller mesh was used to reduce problems with predation by starfish experienced previously. 2.4 DATA ANALYSIS AND PRESENTATION 2.4.1 Water Quality Data Water quality data collected during the course of the experiment were downloaded from the Hydrolabs and entered into spreadsheet data files. Minimum, maximum, means, and standard deviations were calculated for each parameter for each 24 – 48 hour sampling period. Mean temperature and salinity data were plotted for all eight sampling dates for each grow-out site. In addition, all temperature and salinity data recorded at 20 minute intervals were plotted for each site and sampling period, along with vertical lines indicating the times of high and low tide at the inlet (Appendix A, Figures A1 – A16). The August 9 FR temperature and salinity data were lost due to an instrument malfunction. 2.4.2 Growth Rates May 31/June 3 – July 13 Size measurements for all the clams placed in each treatment cage (n=50) and the two control cages (n=50 and 32) taken at the beginning of the experiment were averaged to estimate an overall mean length, width, and depth for each cage. All measurements were recorded in tenths of mm and means were rounded off the nearest 0.1 mm. Overall means were calculated for each site from all the clams (treatments plus controls) put in the water at the beginning of the experiment and removed from the water at the end. Clams removed at the end were not differentiated by cage, but live clams were differentiated from dead ones. Phase 2 (July 15 – October 11) Mean sizes were calculated for all clams (n=50) placed in each cage at the beginning and end of this growth period. During August and September, randomly selected sub-samples (n=25) from each replicate cage were measured. All measurements were recorded in tenths of mm and means were rounded off the nearest 0.1 mm. Mean size estimates for the beginning and end of the experiment included clams from the control cages. Dead clams were differentiated from live ones on each date. Dry weight measurements from each sampling date at each site (two clams from each cage) were averaged for growth rate analysis. Seasonal growth rates were determined for each grow-out site from the differences in mean size between July 15 and October 11 (88 days) and from differences in mean dry weights between August 9 and October 11 (62 days) and by fitting linear regressions to mean length, width, depth
SHORE PROTECTION AND STORM DAMAGE REDUCTION REFORMULATION STUDY
Hard Clam Growth Rate Study Report – Revised Draft -8- March, 2001
ATLANTIC COAST OF LONG ISLAND, FIRE ISLAND INLET TO MONTAUK POINT, NEW YORK

and dry weight estimates for each grow-out site on each sampling date. Separate regression analyses were performed with July – September and July – October data. Only those regression equations with statistically significant slopes (i.e., slopes that were not equal to zero) were used to estimate growth and to compare growth between sites. Mean monthly summer growth rates were calculated for all three sites using both methods. Differences in non-zero slopes between sites were tested for each size measurement using analysis of covariance (ANCOVA) to determine if there were statistically significant differences in growth rate between sites.
SHORE PROTECTION AND STORM DAMAGE REDUCTION REFORMULATION STUDY
Hard Clam Growth Rate Study Report – Revised Draft -9- March, 2001
ATLANTIC COAST OF LONG ISLAND, FIRE ISLAND INLET TO MONTAUK POINT, NEW YORK

3.0 RESULTS 3.1 WATER QUALITY Average temperatures varied by as much as 5.3°C between grow-out sites in the summer and by as little as 1.2°C in the fall (Figure 4). As expected, the mean temperature began to drop as the seasons progressed from late summer to early fall. Mean temperatures peaked at 26.8°C during August 9 at SP, at 23.9°C on July 14 at FR, and 21.4 and 21.7°C on August 9 and September 13 at MI. The highest summer temperatures were consistently recorded at SP throughout the summer and the lowest at MI. During late September and early October, the lowest mean temperatures were recorded at SP. Average salinities were highest thoughout the entire monitoring period at the MI site, ranging from 30.1 ppt in August to 33.2 ppt in early October. Mean salinities at SP were consistently the lowest, ranging from 23.8 ppt on August 9 to 27.3 ppt on August 2 and 27.5 ppt in late September. Mean salinities at FR were intermediate, ranging from 27.6 ppt in mid-July and early August to 31.3 ppt in October. 3.2 OBSERVED GROWTH RATES Results presented in the following two sections were based on observed changes in mean size and dry weight recorded at the three grow-out sites between the initial deployments of clams on May 31/June 3 and July 15 and their removal on July 13 and October 11. 3.2.1 May 31/June 3 – July 13 The mean sizes (length, width, and depth) of clams initially deployed in each of five cages at the three sites between May 31 and June 3, plus the controls, are shown in Table 1. Also shown are the mean sizes of the surviving clams at each site on July 13. Length frequency distributions of clams that were put in the water initially and the live and dead clams that were taken out of the water six weeks later are shown in Figure 5. In general, length frequencies were skewed to the right at the beginning and end of this first growth period (i.e., there was a higher proportion of larger clams with modal lengths of about 35 mm). Small increases in mean size (<1 mm) were noted at MI and EI, but mean length, width, and depth actually decreased at FR during the six week period. The heavy losses of clams (13% at EI, 44% at FR, and 75% at MI) caused severe reductions in the number of clams that were re-measured on July 13. For this reason, differences in mean size at the beginning and the end of this growth period did not produce reliable growth data.
SHORE PROTECTION AND STORM DAMAGE REDUCTION REFORMULATION STUDY
Hard Clam Growth Rate Study Report – Revised Draft -10- March, 2001
ATLANTIC COAST OF LONG ISLAND, FIRE ISLAND INLET TO MONTAUK POINT, NEW YORK
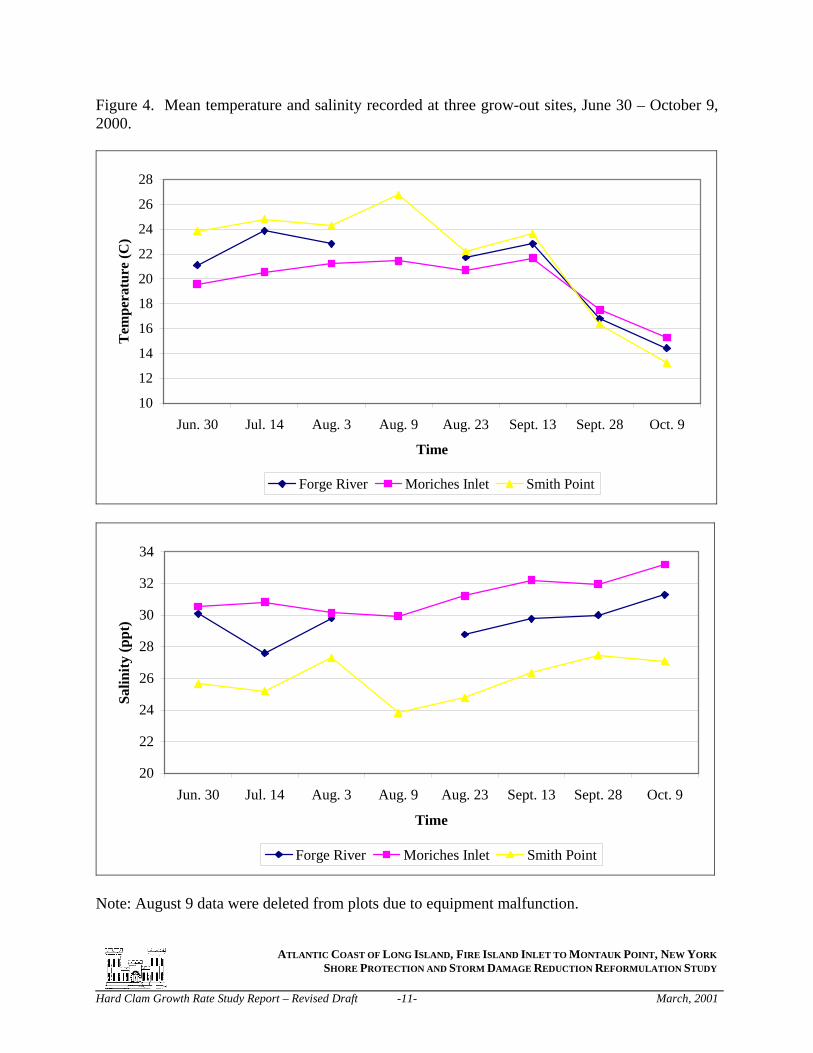
Figure 4. Mean temperature and salinity recorded at three grow-out sites, June 30 – October 9, 2000.
10
12
14
16
18
20
22
24
26
28
Jun. 30 Jul. 14 Aug. 3 Aug. 9 Aug. 23 Sept. 13 Sept. 28 Oct. 9
Time
Tem
pera
ture
(C)
Forge River Moriches Inlet Smith Point
20
22
24
26
28
30
32
34
Jun. 30 Jul. 14 Aug. 3 Aug. 9 Aug. 23 Sept. 13 Sept. 28 Oct. 9
Time
Salin
ity (p
pt)
Forge River Moriches Inlet Smith Point
Note: August 9 data were deleted from plots due to equipment malfunction.
SHORE PROTECTION AND STORM DAMAGE REDUCTION REFORMULATION STUDY
Hard Clam Growth Rate Study Report – Revised Draft -11- March, 2001
ATLANTIC COAST OF LONG ISLAND, FIRE ISLAND INLET TO MONTAUK POINT, NEW YORK
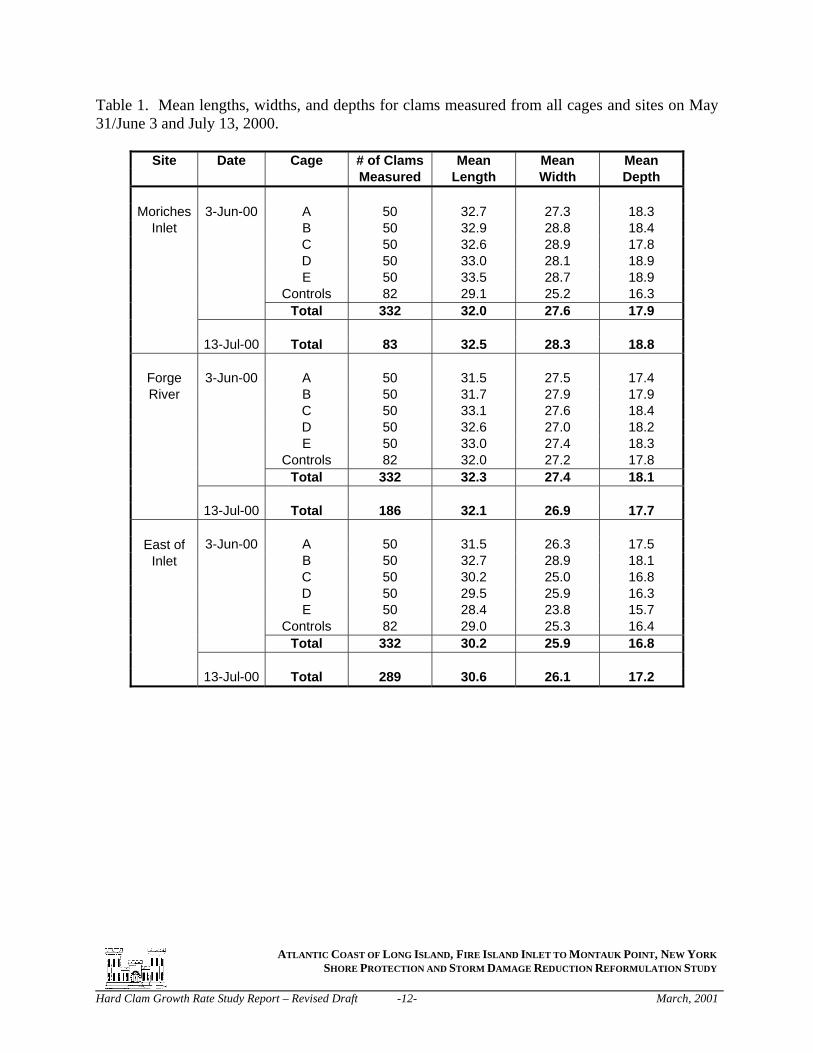
Table 1. Mean lengths, widths, and depths for clams measured from all cages and sites on May 31/June 3 and July 13, 2000.
Site Date Cage # of Clams Mean Mean Mean Measured Length Width Depth
Moriches 3-Jun-00 A 50 32.7 27.3 18.3 Inlet B 50 32.9 28.8 18.4
C 50 32.6 28.9 17.8 D 50 33.0 28.1 18.9 E 50 33.5 28.7 18.9 Controls 82 29.1 25.2 16.3 Total 332 32.0 27.6 17.9 13-Jul-00 Total 83 32.5 28.3 18.8
Forge 3-Jun-00 A 50 31.5 27.5 17.4 River B 50 31.7 27.9 17.9
C 50 33.1 27.6 18.4 D 50 32.6 27.0 18.2 E 50 33.0 27.4 18.3 Controls 82 32.0 27.2 17.8 Total 332 32.3 27.4 18.1 13-Jul-00 Total 186 32.1 26.9 17.7
East of 3-Jun-00 A 50 31.5 26.3 17.5 Inlet B 50 32.7 28.9 18.1
C 50 30.2 25.0 16.8 D 50 29.5 25.9 16.3 E 50 28.4 23.8 15.7 Controls 82 29.0 25.3 16.4 Total 332 30.2 25.9 16.8 13-Jul-00 Total 289 30.6 26.1 17.2
SHORE PROTECTION AND STORM DAMAGE REDUCTION REFORMULATION STUDY
Hard Clam Growth Rate Study Report – Revised Draft -12- March, 2001
ATLANTIC COAST OF LONG ISLAND, FIRE ISLAND INLET TO MONTAUK POINT, NEW YORK

Figure 5. Length frequencies of live and dead clams measured at three grow-out sites in Moriches Bay, June 3 and July 13, 2000. Live Clams, Moriches Inlet, June 3
N=332, Mean=32.0
0
20
40
60
80
100
20 22.5 25 27.5 30 32.5 35 37.5 40 42.5 45
Live Clams, Forge River, June 3N=332, Mean=32.3
0
20
40
60
80
100
20 22.5 25 27.5 30 32.5 35 37.5 40 42.5 45
Live Clams, East of Inlet, June 3N=322, Mean=32.2
010203040506070
20 22.5 25 27.5 30 32.5 35 37.5 40 42.5 45
Live Clams, Moriches Inlet, July 13N=83, Mean=32.1
0
5
10
15
20
25
20 22.5 25 27.5 30 32.5 35 37.5 40 42.5 45
Live Clams, Forge River, July 13N=186, Mean=32.1
0
10
20
30
40
50
20 22.5 25 27.5 30 32.5 35 37.5 40 42.5 45
Live Clams, East of Inlet, July 13N=289, Mean=32.6
0
10
20
30
40
50
60
20 22.5 25 27.5 30 32.5 35 37.5 40 42.5 45
Dead Clams, Moriches Inlet
N=14, Mean=33.0
0
1
2
3
4
20 22.5 25 27.5 30 32.5 35 37.5 40 42.5 45
Dead Clams, Forge RiverN=34, Mean=31.5
0
2
4
6
8
10
20 22.5 25 27.5 30 32.5 35 37.5 40 42.5 45
Dead Clams, East of InletN=8, Mean=31.90
00.5
11.5
22.5
33.5
44.5
20 22.5 25 27.5 30 32.5 35 37.5 40 42.5 45
ATLANTIC COAST OF LONG ISLAND, FIRE ISLAND INLET TO MONTAUK POINT, NEW YORK SHORE PROTECTION AND STORM DAMAGE REDUCTION REFORMULATION STUDY
Hard Clam Growth Rate Study Report – Revised Draft -13- March, 2001

3.2.2 July 15 – October 11 The mean sizes of all clams deployed in each cage at the three grow-out sites on July 15 (including controls) are shown in Table 2 along with the mean sizes of sub-samples (n=25) on the three subsequent occasions when clams were removed from the water for measurement. Length frequency distributions of clams that were put in the water on July 15 and live and dead clams that were removed from the water on August 10, September 11, and October 11 are shown in Figures 6-8. Length distributions were slightly bi-modal with one mode at 25 – 27.5 mm and a second one at 32.5 – 35 mm. Length distributions were bi-modal at MI at each re-measurement and at FR in September and October, but not at SP. A higher percentage of smaller clams were put in the water at MI in July than at the other two sites, causing the mean sizes at this site on July 15 to be notably lower than at the other two sites (Table 2). The loss of one cage at MI in September and of two more cages (one replicate and the control cage) at this site in October severely reduced sample sizes. One-way analysis of variance (ANOVA) revealed no significant (P=0.05) differences between mean lengths in replicate cages at either MI or SP, but the clams in cage A at FR were significantly smaller on three of the four dates (Table 3). Based on these results, size measurements from all cages were combined at MI and SP, but the measurements from cage A at FR were excluded from the overall mean size calculations for each sampling date. With this exception, clams in the control cage were not significantly different in size from the clams in the experimental cages at any site and were therefore included in the overall mean size estimates for each site at the beginning and end of the experiment. The absence of any difference in the mean size of clams in the control cages in October at FR and SP indicates that there was no effect of handling and removal from the water on the growth of clams that were measured over the course of the study. Shell growth at MI was about twice as fast as at the two interior sites. Growth in length between July 15 and October 11 was 3.0 mm at MI, 1.6 mm at FR, and 1.7 mm at SP, producing average monthly growth rates of 1.0, 0.53 and 0.57 mm, respectively. Growth in width was 3.1, 1.0, and 1.4 mm at the same three sites and averaged 1.03, 0.33, and 0.47 mm per month. Growth in depth was 2.4, 1.7, and 1.2 mm and averaged 0.80, 0.57, and 0.40 mm per month. Monthly summer length increments of 0.5 – 1.0 mm are low compared to growth data reported for most other North American sites by Ansell (1968). The mean lengths of the dead clams were consistently 2.5 – 3.5 mm smaller than the mean lengths of the survivors, indicating that the mortality rate was higher for smaller clams. Of the original 200 clams deployed at each site, 15% died at FR during the experiment and 20% died at SP. Mortality over the course of the study could not be calculated at the inlet because of the lost cages, but mortality rates between July 15 and August 10 were similar at all three sites (12 – 15% of the 150 clams in the three experimental cages). Because differences in the mean sizes of the survivors were used to estimate growth rates and the smaller clams suffered higher mortality rates than the larger ones, the growth rates reported in this study are slightly over-estimated. However, as long as the mortality rates were about the same at each site over the summer (i.e., 15 – 20%), the differences in growth between sites were not affected.
SHORE PROTECTION AND STORM DAMAGE REDUCTION REFORMULATION STUDY
Hard Clam Growth Rate Study Report – Revised Draft -14- March, 2001
ATLANTIC COAST OF LONG ISLAND, FIRE ISLAND INLET TO MONTAUK POINT, NEW YORK

Table 2. Mean lengths, widths, and depths for clams measured from all cages and sites on July 15, August 10, September 11, and October 11, 2000.
Site Date Cage # of Clams Mean Mean Mean Measured Length Width Depth
Moriches 15-Jul-00 A 50 28.0 24.2 15.7 Inlet B 50 27.7 24.1 15.4
C 50 28.2 24.2 15.7 Controls 50 29.4 26.1 16.3 Mean 200 28.4 24.6 15.8 10-Aug-00 A 25 30.0 26.3 17.5 B 25 27.6 24.6 15.8 C 25 29.8 26.2 16.8 Mean 75 29.1 25.7 16.7 11-Sep-00 A 25 30.6 27.9 17.5 B 25 30.4 27.2 17.2 C Cage destroyed Mean 50 30.5 27.6 17.3 11-Oct-00 A 25 31.4 27.7 18.2 B Cage destroyed 11-Oct-00 C Cage destroyed 11-Sept-00 Controls Cage destroyed 11-Oct-00 Mean 25 31.4 27.7 18.2
Forge 15-Jul-00 A 50 27.3 24.6 15.5 River B 50 30.3 26.7 17.0
C 50 30.9 27.3 17.2 Controls 50 30.2 27.3 16.7 Mean 150 30.5 27.1 16.9 10-Aug-00 A 25 29.5 25.9 16.6 B 25 30.6 26.6 17.4 C 25 30.9 26.6 17.7 Mean 50 30.7 26.6 17.6 11-Sep-00 A 25 28.8 25.9 16.5 B 25 32.0 29.0 18.1 C 25 32.5 29.3 18.5 Mean 50 32.2 29.2 18.3 11-Oct-00 A 25 28.7 25.2 16.5 B 25 32.2 28.4 18.5 C 25 31.7 28.1 18.7 Controls 25 32.5 28.5 18.6 Mean 75 32.1 28.3 18.6
SHORE PROTECTION AND STORM DAMAGE REDUCTION REFORMULATION STUDY
Hard Clam Growth Rate Study Report – Revised Draft -15- March, 2001
ATLANTIC COAST OF LONG ISLAND, FIRE ISLAND INLET TO MONTAUK POINT, NEW YORK
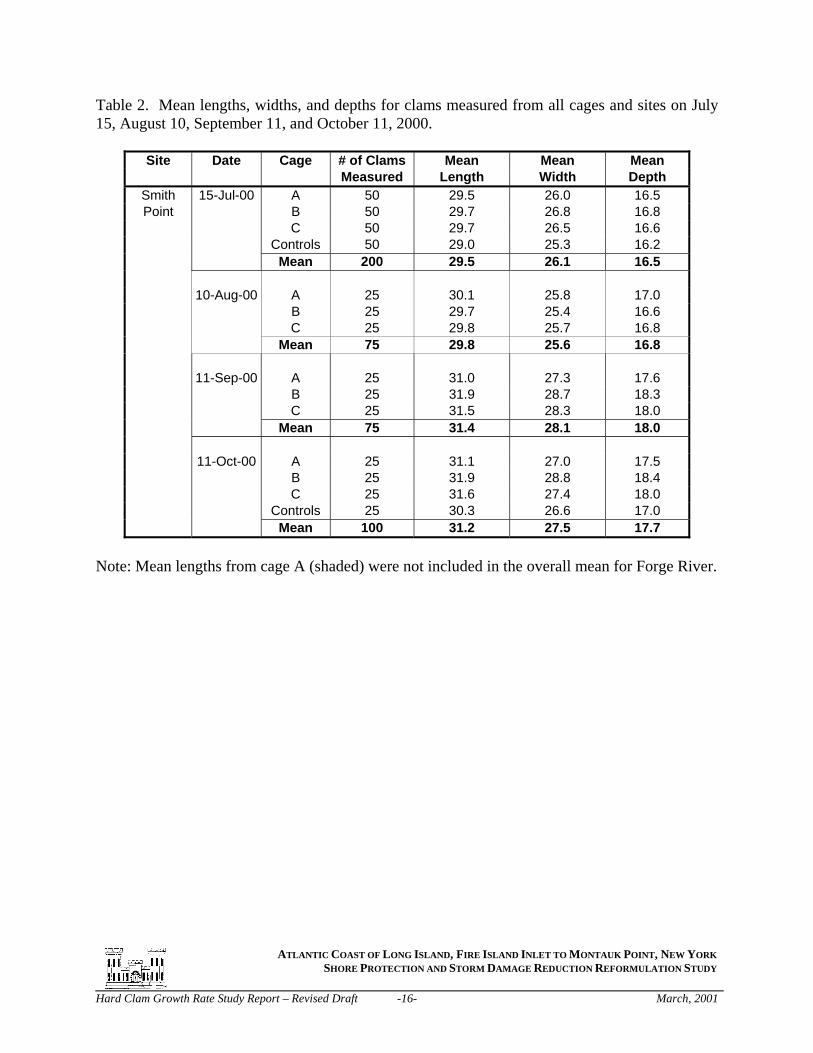
Table 2. Mean lengths, widths, and depths for clams measured from all cages and sites on July 15, August 10, September 11, and October 11, 2000.
Site Date Cage # of Clams Mean Mean Mean Measured Length Width Depth
Smith 15-Jul-00 A 50 29.5 26.0 16.5 Point B 50 29.7 26.8 16.8
C 50 29.7 26.5 16.6 Controls 50 29.0 25.3 16.2 Mean 200 29.5 26.1 16.5 10-Aug-00 A 25 30.1 25.8 17.0 B 25 29.7 25.4 16.6 C 25 29.8 25.7 16.8 Mean 75 29.8 25.6 16.8 11-Sep-00 A 25 31.0 27.3 17.6 B 25 31.9 28.7 18.3 C 25 31.5 28.3 18.0 Mean 75 31.4 28.1 18.0 11-Oct-00 A 25 31.1 27.0 17.5 B 25 31.9 28.8 18.4 C 25 31.6 27.4 18.0 Controls 25 30.3 26.6 17.0 Mean 100 31.2 27.5 17.7
Note: Mean lengths from cage A (shaded) were not included in the overall mean for Forge River.
SHORE PROTECTION AND STORM DAMAGE REDUCTION REFORMULATION STUDY
Hard Clam Growth Rate Study Report – Revised Draft -16- March, 2001
ATLANTIC COAST OF LONG ISLAND, FIRE ISLAND INLET TO MONTAUK POINT, NEW YORK

Table 3. Results of one-way analysis of variance test (F test) for equal mean lengths among cages (including controls) at each grow-out site and sampling date. 7/15 8/10 9/11 10/11 Moriches Inlet 1.39 1.93 0.03 - - Forge River 6.26* 0.62 4.15* 3.30* Smith Point 0.29 0.06 0.26 0.61 Note: * indicates significant differences between cages at P = 0.05. Only two cages remained at Moriches Inlet on 9/11, and one on 10/11.
SHORE PROTECTION AND STORM DAMAGE REDUCTION REFORMULATION STUDY
Hard Clam Growth Rate Study Report – Revised Draft -17- March, 2001
ATLANTIC COAST OF LONG ISLAND, FIRE ISLAND INLET TO MONTAUK POINT, NEW YORK

Figure 6. Length frequencies of live clams (left) and dead clams (right) at Moriches Inlet, July 15 – October 11, 2000.
Moriches Inlet, July 15N=201, Mean=28.4
0
10
20
30
40
50
60
20 22.5 25 27.5 30 32.5 35 37.5 40 42.5 45
Length (mm)
Freq
uenc
y
Moriches Inlet, August 10N=75, Mean=29.1
0
5
10
15
20
20 22.5 25 27.5 30 32.5 35 37.5 40 42.5 45
Length (mm)
Freq
uenc
y
Moriches Inlet, July 15 - August 10N=22, Mean=26.4
02468
1012
20 22.5 25 27.5 30 32.5 35 37.5 40 42.5 45
Length (mm)
Freq
uenc
y
Moriches Inlet, September 11N=50, Mean=30.5
02468
101214
20 22.5 25 27.5 30 32.5 35 37.5 40 42.5 45
Length (mm)
Freq
uenc
y
Moriches Inlet, August 10 - September 11N=6, Mean=27.4
0
1
2
3
20 22.5 25 27.5 30 32.5 35 37.5 40 42.5 45
Length (mm)
Freq
uenc
y
Moriches Inlet, October 11N=25, Mean=31.4
0
2
4
6
8
10
12
20 22.5 25 27.5 30 32.5 35 37.5 40 42.5 45
Length (mm)
Freq
uenc
y
ATLANTIC COAST OF LONG ISLAND, FIRE ISLAND INLET TO MONTAUK POINT, NEW YORK SHORE PROTECTION AND STORM DAMAGE REDUCTION REFORMULATION STUDY
Hard Clam Growth Rate Study Report – Revised Draft -18- March, 2001

Figure 7. Length frequencies of live clams (left) and dead clams (right) at Forge River, July 15 – October 11, 2000.
Forge River, July 15N=199, Mean=29.6
05
10152025303540
20 22.5 25 27.5 30 32.5 35 37.5 40 42.5 45
Length (mm)
Freq
uenc
y
Forge River, August 10N=75, Mean=30.3
02468
10121416
20 22.5 25 27.5 30 32.5 35 37.5 40 42.5 45
Length (mm)
Freq
uenc
y
Forge River, July 15 - August 10N=22, Mean=27.1
012345678
20 22.5 25 27.5 30 32.5 35 37.5 40 42.5 45
Length (mm)
Freq
uenc
y
Forge River, September 11N=75, Mean=31.1
02468
10121416
20 22.5 25 27.5 30 32.5 35 37.5 40 42.5 45
Length (mm)
Freq
uenc
y
Forge River, August 10 - September 11N=8, Mean=28.0
0
1
2
3
4
5
20 22.5 25 27.5 30 32.5 35 37.5 40 42.5 45
Length (mm)
Freq
uenc
y
Forge River, October 11N=100, Mean=31.3
0
5
10
15
20
20 22.5 25 27.5 30 32.5 35 37.5 40 42.5 45
Length (mm)
Freq
uenc
y
ATLANTIC COAST OF LONG ISLAND, FIRE ISLAND INLET TO MONTAUK POINT, NEW YORK SHORE PROTECTION AND STORM DAMAGE REDUCTION REFORMULATION STUDY
Hard Clam Growth Rate Study Report – Revised Draft -19- March, 2001
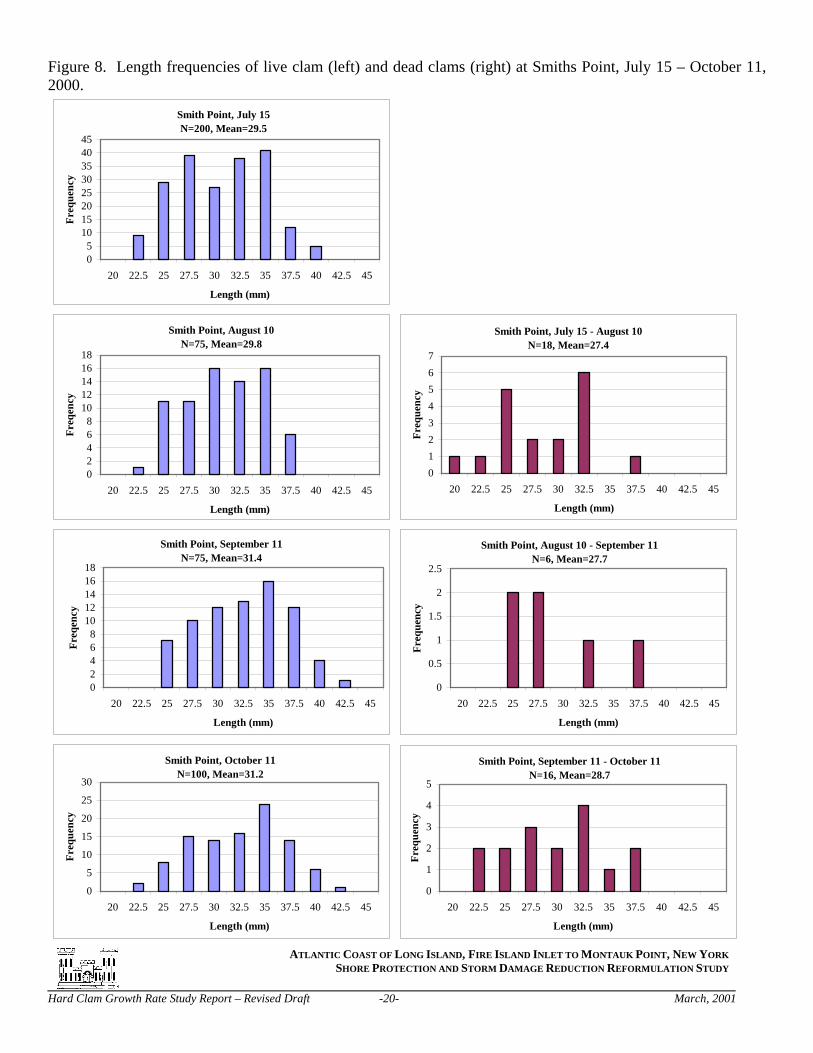
Figure 8. Length frequencies of live clam (left) and dead clams (right) at Smiths Point, July 15 – October 11, 2000.
Smith Point, July 15N=200, Mean=29.5
05
1015202530354045
20 22.5 25 27.5 30 32.5 35 37.5 40 42.5 45
Length (mm)
Freq
uenc
y
Smith Point, August 10N=75, Mean=29.8
02468
1012141618
20 22.5 25 27.5 30 32.5 35 37.5 40 42.5 45
Length (mm)
Freq
ency
Smith Point, July 15 - August 10N=18, Mean=27.4
01234567
20 22.5 25 27.5 30 32.5 35 37.5 40 42.5 45
Length (mm)
Freq
uenc
y
Smith Point, September 11N=75, Mean=31.4
02468
1012141618
20 22.5 25 27.5 30 32.5 35 37.5 40 42.5 45
Length (mm)
Freq
ency
Smith Point, August 10 - September 11N=6, Mean=27.7
0
0.5
1
1.5
2
2.5
20 22.5 25 27.5 30 32.5 35 37.5 40 42.5 45
Length (mm)
Freq
uenc
y
Smith Point, October 11N=100, Mean=31.2
0
5
10
15
20
25
30
20 22.5 25 27.5 30 32.5 35 37.5 40 42.5 45
Length (mm)
Freq
uenc
y
ATLANTIC COAST OF LONG ISLAND, FIRE ISLAND INLET TO MONTAUK POINT, NEW YORK SHORE PROTECTION AND STORM DAMAGE REDUCTION REFORMULATION STUDY
Hard Clam Growth Rate Study Report – Revised Draft -20- March, 2001
Smith Point, September 11 - October 11N=16, Mean=28.7
0
1
2
3
4
5
20 22.5 25 27.5 30 32.5 35 37.5 40 42.5 45
Length (mm)
Freq
uenc
y
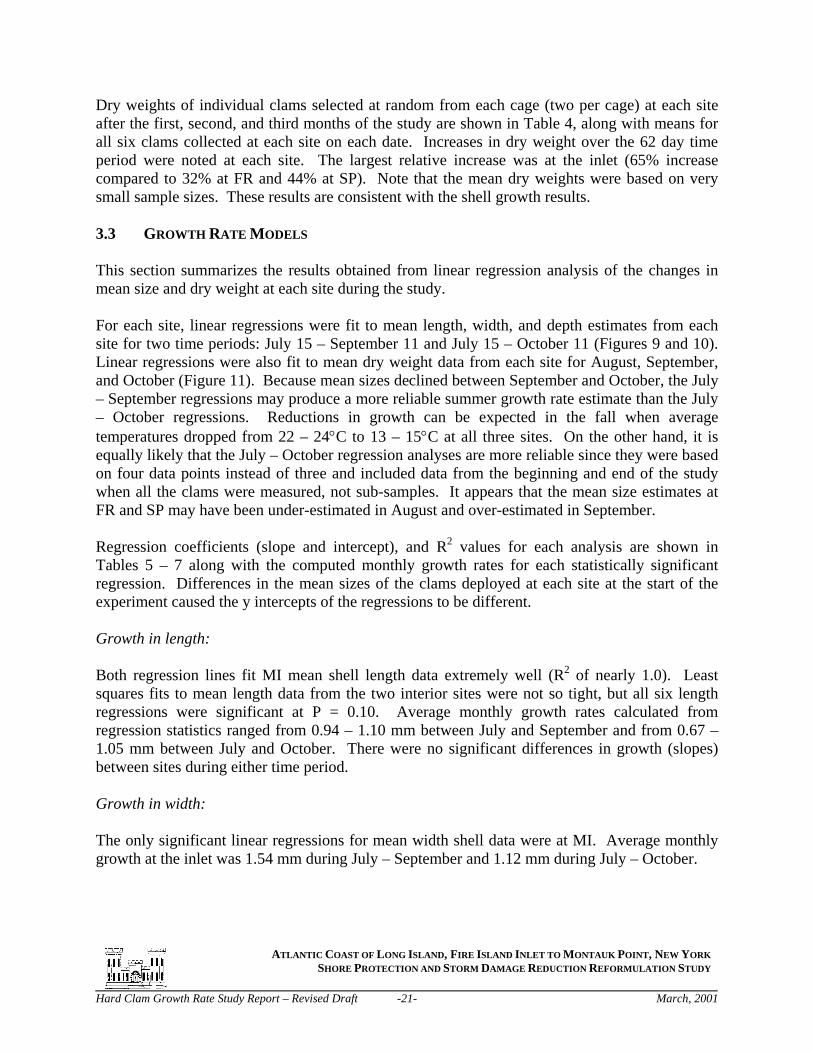
Dry weights of individual clams selected at random from each cage (two per cage) at each site after the first, second, and third months of the study are shown in Table 4, along with means for all six clams collected at each site on each date. Increases in dry weight over the 62 day time period were noted at each site. The largest relative increase was at the inlet (65% increase compared to 32% at FR and 44% at SP). Note that the mean dry weights were based on very small sample sizes. These results are consistent with the shell growth results. 3.3 GROWTH RATE MODELS This section summarizes the results obtained from linear regression analysis of the changes in mean size and dry weight at each site during the study. For each site, linear regressions were fit to mean length, width, and depth estimates from each site for two time periods: July 15 – September 11 and July 15 – October 11 (Figures 9 and 10). Linear regressions were also fit to mean dry weight data from each site for August, September, and October (Figure 11). Because mean sizes declined between September and October, the July – September regressions may produce a more reliable summer growth rate estimate than the July – October regressions. Reductions in growth can be expected in the fall when average temperatures dropped from 22 – 24°C to 13 – 15°C at all three sites. On the other hand, it is equally likely that the July – October regression analyses are more reliable since they were based on four data points instead of three and included data from the beginning and end of the study when all the clams were measured, not sub-samples. It appears that the mean size estimates at FR and SP may have been under-estimated in August and over-estimated in September. Regression coefficients (slope and intercept), and R2 values for each analysis are shown in Tables 5 – 7 along with the computed monthly growth rates for each statistically significant regression. Differences in the mean sizes of the clams deployed at each site at the start of the experiment caused the y intercepts of the regressions to be different. Growth in length: Both regression lines fit MI mean shell length data extremely well (R2 of nearly 1.0). Least squares fits to mean length data from the two interior sites were not so tight, but all six length regressions were significant at P = 0.10. Average monthly growth rates calculated from regression statistics ranged from 0.94 – 1.10 mm between July and September and from 0.67 – 1.05 mm between July and October. There were no significant differences in growth (slopes) between sites during either time period. Growth in width: The only significant linear regressions for mean width shell data were at MI. Average monthly growth at the inlet was 1.54 mm during July – September and 1.12 mm during July – October.
SHORE PROTECTION AND STORM DAMAGE REDUCTION REFORMULATION STUDY
Hard Clam Growth Rate Study Report – Revised Draft -21- March, 2001
ATLANTIC COAST OF LONG ISLAND, FIRE ISLAND INLET TO MONTAUK POINT, NEW YORK

Table 4. Dry weight measurements for individual clams sampled during August, September, and October, 2000.
Site Date Clam Dry Wt. Site Date Clam Dry Wt. Site Date Clam Dry Wt. (g) (g) (g)
Forge River 1 0.43 Moriches 1 0.56 Smith Pt. 1 0.43A 2 0.24 A 2 0.40 A 2 0.30
Forge River 1 0.57 Moriches 1 0.56 Smith Pt. 1 0.43B 9-Aug-00 2 0.61 B 9-Aug-00 2 0.22 B 9-Aug-00 2 0.32
Forge River 1 0.53 Moriches 1 0.72 Smith Pt. 1 0.35C 2 0.62 C 2 0.46 C 2 0.34 Mean 0.50 Mean 0.49 Mean 0.36
Forge River 1 0.91 Moriches 1 0.62 Smith Pt. 1 0.35A 2 0.57 A 2 0.58 A 2 0.70
Forge River 1 0.50 Moriches 1 0.34 Smith Pt. 1 0.61B 11-Sep-00 2 0.61 B 11-Sep-00 2 0.50 B 11-Sep-00 2 0.17
Forge River 1 0.44 Moriches 1 cage destroyed Smith Pt. 1 0.29 C 2 0.79 C 2 C 2 0.13
Mean 0.63 Mean 0.51 Mean 0.38Forge River 1 0.80 Moriches 1 0.78 Smith Pt. 1 0.42
A 2 0.64 A 2 0.84 A 2 0.48Forge River 1 0.82 Moriches 1 cage destroyed Smith Pt. 1 0.45
B 11-Oct-00 2 0.89 B 11-Oct-00 2 B 11-Oct-00 2 0.67Forge River 1 0.38 Moriches 1 cage destroyed Smith Pt. 1 0.40
C 2 0.43 C 2 C 2 0.72 Mean 0.66 Mean 0.81 Mean 0.52
ATLANTIC COAST OF LONG ISLAND, FIRE ISLAND INLET TO MONTAUK POINT, NEW YORK SHORE PROTECTION AND STORM DAMAGE REDUCTION REFORMULATION STUDY
Hard Clam Growth Rate Study Report – Revised Draft -22- March, 2001

Figure 9. Linear regression analysis of mean shell length (top), width (middle) and depth (bottom) at three grow-out sites in Moriches Bay, July – September, 2000.
28.0
29.0
30.0
31.0
32.0
33.0
0 10 20 30 40 50 60 7
Time (days)
Mea
n le
ngth
(mm
)
0
Inlet Forge R Smith Pt
24.0
25.0
26.0
27.0
28.0
29.0
30.0
0 10 20 30 40 50 60 7
Time (days)
Mea
n w
idth
(mm
)
0
Inlet Forge R Smith Pt
15.5
16.0
16.5
17.0
17.5
18.0
18.5
0 10 20 30 40 50 60 70
Time (days)
Mea
n de
pth
(mm
)
Inlet Forge R Smith Pt
ATLANTIC COAST OF LONG ISLAND, FIRE ISLAND INLET TO MONTAUK POINT, NEW YORK SHORE PROTECTION AND STORM DAMAGE REDUCTION REFORMULATION STUDY
Hard Clam Growth Rate Study Report – Revised Draft -23- March 2001
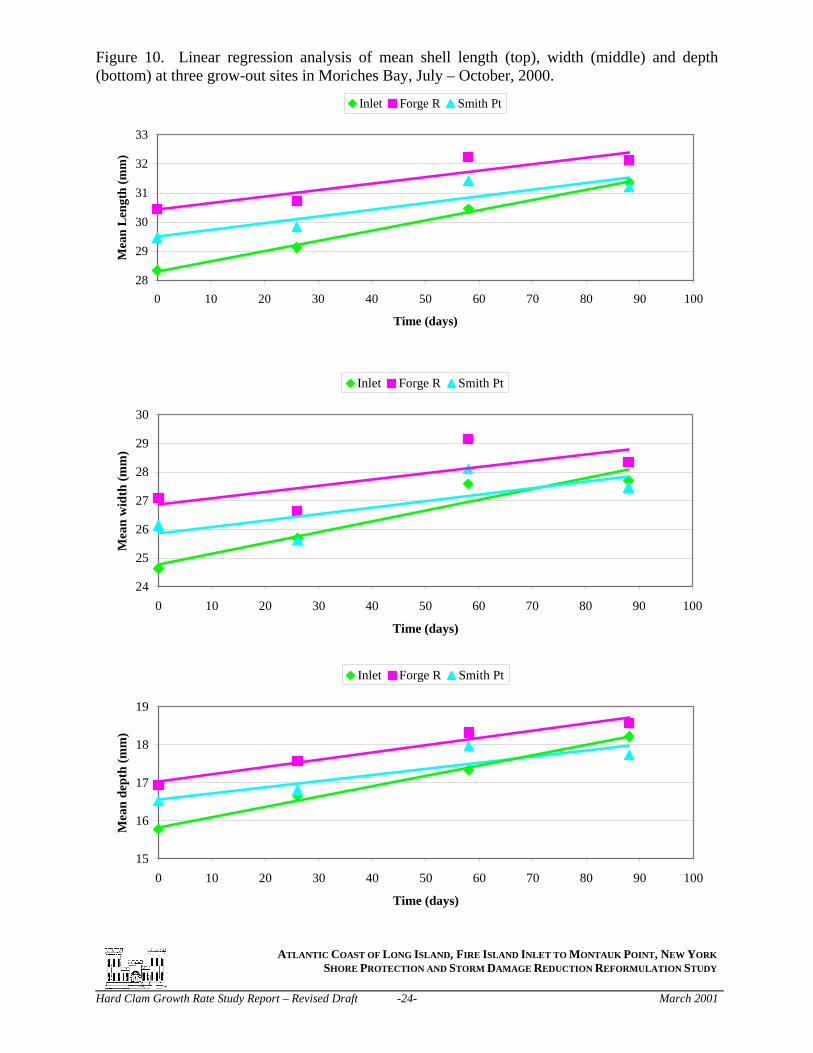
Figure 10. Linear regression analysis of mean shell length (top), width (middle) and depth (bottom) at three grow-out sites in Moriches Bay, July – October, 2000.
28
29
30
31
32
33
0 10 20 30 40 50 60 70 80 90 100
Time (days)
Mea
n L
engt
h (m
m)
Inlet Forge R Smith Pt
24
25
26
27
28
29
30
0 10 20 30 40 50 60 70 80 90 100
Time (days)
Mea
n w
idth
(mm
)
Inlet Forge R Smith Pt
15
16
17
18
19
0 10 20 30 40 50 60 70 80 90 100
Time (days)
Mea
n de
pth
(mm
)
Inlet Forge R Smith Pt
ATLANTIC COAST OF LONG ISLAND, FIRE ISLAND INLET TO MONTAUK POINT, NEW YORK SHORE PROTECTION AND STORM DAMAGE REDUCTION REFORMULATION STUDY
Hard Clam Growth Rate Study Report – Revised Draft -24- March 2001
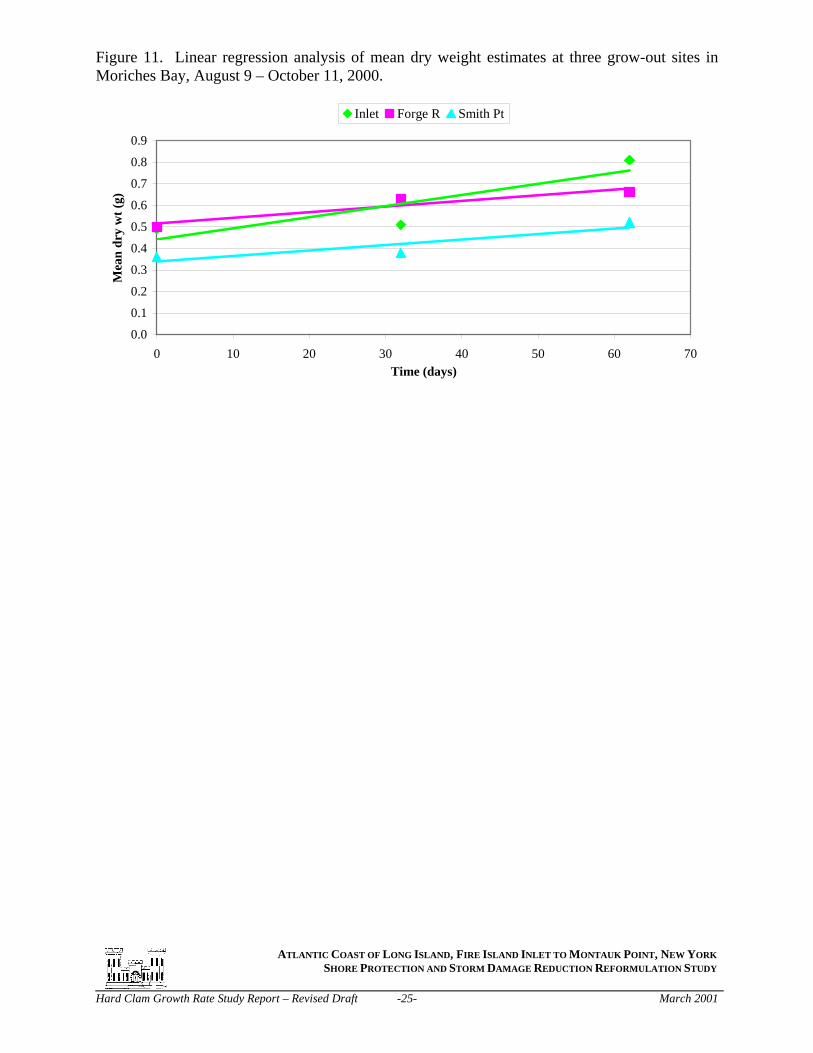
Figure 11. Linear regression analysis of mean dry weight estimates at three grow-out sites in Moriches Bay, August 9 – October 11, 2000.
0.0
0.1
0.2
0.3
0.4
0.5
0.6
0.7
0.8
0.9
0 10 20 30 40 50 60 7Time (days)
Mea
n dr
y w
t (g)
0
Inlet Forge R Smith Pt
ATLANTIC COAST OF LONG ISLAND, FIRE ISLAND INLET TO MONTAUK POINT, NEW YORK SHORE PROTECTION AND STORM DAMAGE REDUCTION REFORMULATION STUDY
Hard Clam Growth Rate Study Report – Revised Draft -25- March 2001
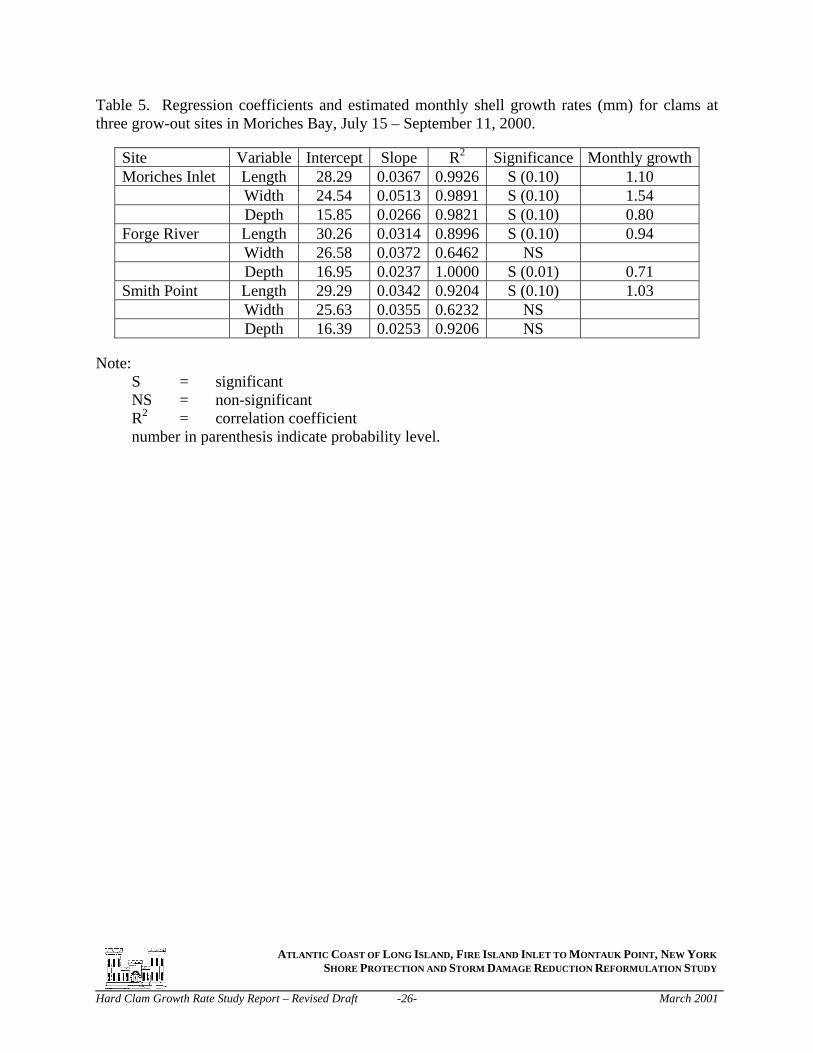
Table 5. Regression coefficients and estimated monthly shell growth rates (mm) for clams at three grow-out sites in Moriches Bay, July 15 – September 11, 2000.
Site Variable Intercept Slope R2 Significance Monthly growthMoriches Inlet Length 28.29 0.0367 0.9926 S (0.10) 1.10 Width 24.54 0.0513 0.9891 S (0.10) 1.54 Depth 15.85 0.0266 0.9821 S (0.10) 0.80 Forge River Length 30.26 0.0314 0.8996 S (0.10) 0.94 Width 26.58 0.0372 0.6462 NS Depth 16.95 0.0237 1.0000 S (0.01) 0.71 Smith Point Length 29.29 0.0342 0.9204 S (0.10) 1.03 Width 25.63 0.0355 0.6232 NS Depth 16.39 0.0253 0.9206 NS
Note:
S = significant NS = non-significant R2 = correlation coefficient number in parenthesis indicate probability level.
SHORE PROTECTION AND STORM DAMAGE REDUCTION REFORMULATION STUDY
Hard Clam Growth Rate Study Report – Revised Draft -26- March 2001
ATLANTIC COAST OF LONG ISLAND, FIRE ISLAND INLET TO MONTAUK POINT, NEW YORK

Table 6. Regression coefficients and estimated monthly shell growth rates for clams at three grow-out sites in Moriches Bay, July 15 – October 11, 2000.
Site Variable Intercept Slope R2 Significance Monthly growthMoriches Inlet Length 28.32 0.0351 0.995 S (0.01) 1.05 Width 24.79 0.0375 0.916 S (0.05) 1.12 Depth 15.90 0.0290 0.950 S (0.05) 0.87 Forge River Length 30.43 0.0223 0.842 S (0.10) 0.67 Width 26.87 0.0217 0.514 NS Depth 17.11 0.0183 0.935 S (0.05) 0.55 Smith Point Length 29.49 0.0232 0.823 S (0.10) 0.70 Width 25.87 0.0223 0.551 NS Depth 16.71 0.0151 0.721 NS
Note:
S = significant NS = non-significant R2 = correlation coefficient number in parenthesis indicate probability level.
SHORE PROTECTION AND STORM DAMAGE REDUCTION REFORMULATION STUDY
Hard Clam Growth Rate Study Report – Revised Draft -27- March 2001
ATLANTIC COAST OF LONG ISLAND, FIRE ISLAND INLET TO MONTAUK POINT, NEW YORK
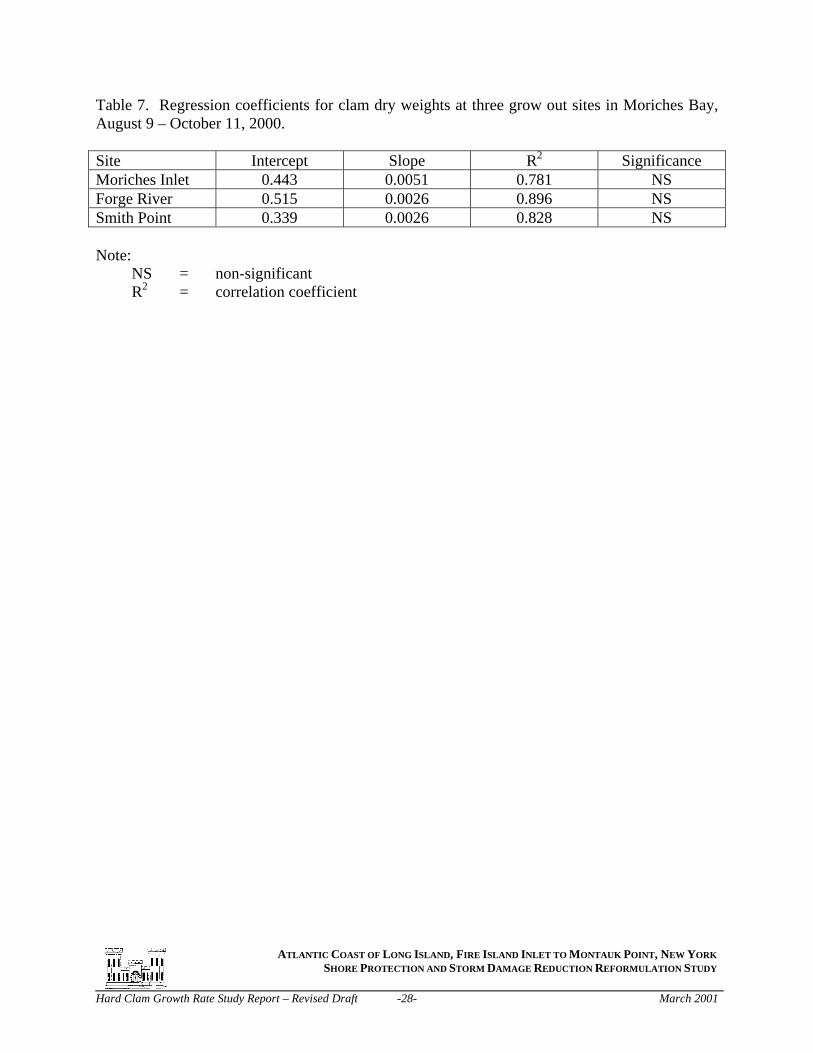
Table 7. Regression coefficients for clam dry weights at three grow out sites in Moriches Bay, August 9 – October 11, 2000. Site Intercept Slope R2 Significance Moriches Inlet 0.443 0.0051 0.781 NS Forge River 0.515 0.0026 0.896 NS Smith Point 0.339 0.0026 0.828 NS Note:
NS = non-significant R2 = correlation coefficient
SHORE PROTECTION AND STORM DAMAGE REDUCTION REFORMULATION STUDY
Hard Clam Growth Rate Study Report – Revised Draft -28- March 2001
ATLANTIC COAST OF LONG ISLAND, FIRE ISLAND INLET TO MONTAUK POINT, NEW YORK
Growth in depth: Fits to mean shell depth data were significant at MI and FR between July and September and between July and October. Average monthly growth rates calculated from regression statistics were 0.80 mm at MI between July and September and 0.87 mm between July and October, and 0.55 mm at FR between July and October. There were no significant differences in growth (slopes) between sites during either time period. Growth in shell depth at FR averaged 0.71 mm a month between July and September and 0.55 between July and October. Growth in dry weight: None of the linear regression analyses of average mean weight data were statistically significant.
SHORE PROTECTION AND STORM DAMAGE REDUCTION REFORMULATION STUDY
Hard Clam Growth Rate Study Report – Revised Draft -29- March 2001
ATLANTIC COAST OF LONG ISLAND, FIRE ISLAND INLET TO MONTAUK POINT, NEW YORK

4.0 CONCLUSIONS • Growth rates could not be determined during June and the first two weeks of July because
too many clams were lost. • Summer growth rates of 25-40 mm hard clams based on differences in mean shell length,
width, and depth and on differences in dry weight were consistently about two times higher at Moriches Inlet than at either of the two sites inside the bay.
• Average monthly growth in shell length was low at all sites (approximately 0.5 – 1.0 mm per
month), lower than most published estimates for slightly larger (40 mm) hard clams at other U.S. Atlantic coast locations (Ansell 1968).
• It is not clear whether temperature affected clam growth. Average temperatures remained
within the 20 – 23°C optimum growth range at the inlet between late June and mid-September and also at Forge River on most sampling dates. Lower growth increments at FR may have been temperature-related since average temperatures there were 1 – 4°C higher than at MI. However, water temperatures at FR only exceeded 23°C for extended periods of time on July 14 (Appendix A, Figure A_), suggesting that other factors (possibly brown tide) may affect growth in this location. Water temperatures at Smith Point were considerably higher: averages exceeded 23°C on 5 out of 6 occasions between late June and mid-September. Growth rates at FR and SP were similar, however.
• Salinity did not seem to be a factor affecting hard clam growth rates in Moriches Bay. The
higher growth rates at the inlet were associated with average salinities that remained above 30 ppt on all eight sampling occasions, well above the reported upper limit for optimum growth of 28 ppt. Mean salinities at FR also remained above 28 ppt most of the time. The salinity regime at SP was much more favorable for clam growth and may have compensated for the high temperatures that prevailed at that site.
• In summary, higher shell growth at the inlet appears to be related to a lower, more favorable,
temperature regime and prevailed despite the fact that salinities exceeded 28 ppt. Faster shell growth at the inlet may be related to a more available food supply. Strong tidal currents at the inlet may increase the supply of phytoplankton that is removed from the water by the clams.
• Despite the larger increases in shell size observed at the inlet, linear regression growth
models failed to show any statistically significant differences in growth rates between sites when applied to mean length and depth estimates for either the July – September or July – October growth periods. In fact, the slopes of many of the linear regressions that were applied to shell size and dry weight data were not significantly different from zero, indicating that there were not enough mean size estimates available (i.e., not enough sampling dates) to compensate for the variances associated with each mean size estimate.
SHORE PROTECTION AND STORM DAMAGE REDUCTION REFORMULATION STUDY
Hard Clam Growth Rate Study Report – Revised Draft -30- March 2001
ATLANTIC COAST OF LONG ISLAND, FIRE ISLAND INLET TO MONTAUK POINT, NEW YORK

5.0 LITERATURE CITED Ansell, A.D. 1968. The rate of growth of the hard clam Mercenaria mercenaria (L.) throughout
the geographical range. J. Cons. Int. Explor. Mer 31:364-409. Davis, H.C. (undated leaflet). The effects of different salinities and temperatures on oysters and
clams. Appendix F, U.S. Fish and Wildlife Service, 15 pp. (Cited in: J.L. McHugh, M.W. Summer, P.J. Flagg, D.W. Lipton, and W.J. Behrens. 1982. Annotated Bibliography of the Hard Clam, Mercenaria mercenaria. NOAA Tec. Rep. NMFS-SSRF-756. 845 pp.).
Kraeuter, J.N., and M. Castagna. 1980. Effects of large predators on the field culture of the hard
clam, Mercenaria mercenaria. U.S. National Marine Fisheries Service, Fisheries Bulletin 78(2):538-541.
Pratt, D.M. and D.A. Campbell. 1956. Environmental factors affecting growth in Venus
mercenaria. Limnology and Oceanography 1(1): 2-17. Rice, M.A. and J.A. Pechenik. 1992. A review of the factors influencing the growth of the
northern quahog, Mercenaria mercenaria (Linnaeus, 1758). J. Shellfish Res. 11(2):279-287.
Ritchie, T.P. 1977. A Comprehensive Review of the Commercial Clam Industries in the United
States, U.S. Natl. Mar. Fish. Serv., Delaware Sea Grant Program, College Marine Studies, Univ. Del., Newark and Lewes, Del. DEL-SG-26-76. 106 pp.
Stanley, Jon G. 1983. Species Profiles: Life Histories and Environmental Requirements of
Coastal Fishes and Invertebrates (North Atlantic) Hard Clam, U.S. Fish and Wildlife Service Report Number FWS/OBS-82/11.18. 19 pp.
Turner, H.J. 1953. A review of the biology of some commercial mollusks of the east coast of
North America. Sixth Rep. Invest. Shellfish Mass., Mass. Dept. Nat. Res. Div. Mar. Fish: 39-74.
Turner, E.J. 1983. Effects of a storm-induced breach on Mercenaria mercenaria in Moriches
Bay, Thesis- Marine Science Research Center, State University of New York, Stony Brook. 71pp.
U.S. Army Corps of Engineers. 1995. Fire Island to Montauk Point Long Island, New York.
Draft Breach Contingency Plan, Executive Summary and Draft Environmental Assessment, USACOE, NY District, North Atlantic Division. 32pp.
Van Winkle, W., S.Y. Feng, and H.H. Haskin. 1976. Effect of temperature and salinity on
extension of siphons by Mercenaria mercenaria. J. Fish. Res. Bd. Can. 33(7): 1540-1546.
SHORE PROTECTION AND STORM DAMAGE REDUCTION REFORMULATION STUDY
Hard Clam Growth Rate Study Report – Revised Draft -31- March 2001
ATLANTIC COAST OF LONG ISLAND, FIRE ISLAND INLET TO MONTAUK POINT, NEW YORK

Virstein, R.W. 1977. The importance of predation by crabs and fishes on benthic infauna in Chesapeake Bay. Ecology 58(6): 1199-1217.
SHORE PROTECTION AND STORM DAMAGE REDUCTION REFORMULATION STUDY
Hard Clam Growth Rate Study Report – Revised Draft -32- March 2001
ATLANTIC COAST OF LONG ISLAND, FIRE ISLAND INLET TO MONTAUK POINT, NEW YORK

Appendix A:
Temperature and Salinity Plots