Morgans Investor Conference
13
RIGHT SOLUTIONS | RIGHT PARTNER Morgans Investor Conference Investor Presentation October 2014 Greg Kilmister – CEO
Transcript of Morgans Investor Conference
RIGHT S O L U T I O N S | RIGHT PARTNER
Morgans Investor Conference
Investor Presentation
October 2014
Greg Kilmister – CEO

• This presentation has been prepared by ALS Limited, (ALS or the Company). It contains general information
about the Company’s activities as at the date of the presentation. It is information given in summary form and
does not purport to be complete. The distribution of this presentation in jurisdictions outside Australia may be
restricted by law, and you should observe any such restrictions.
• This presentation is not, and nothing in it should be construed as, an offer, invitation or recommendation in
respect of securities, or an offer, invitation or recommendation to sell, or a solicitation of an offer to buy,
securities in any jurisdiction. Neither this document nor anything in it shall form the basis of any contract or
commitment. This presentation is not intended to be relied upon as advice to investors or potential investors
and does not take into account the investment objectives, financial situation or needs of any investor. All
investors should consider such factors in consultation with a professional advisor of their choosing when
deciding if an investment is appropriate.
• The Company has prepared this presentation based on information available to it, including information
derived from public sources that have not been independently verified. No representation or warranty, express
or implied, is provided in relation to the fairness, accuracy, correctness, completeness or reliability of the
information, opinions or conclusions expressed herein.
• This presentation includes forward-looking statements within the meaning of securities laws. Any forward-
looking statements involve known and unknown risks and uncertainties, many of which are outside the control
of the Company and its representatives. Forward-looking statements may also be based on estimates and
assumptions with respect to future business decisions, which are subject to change. Any statements,
assumptions, opinions or conclusions as to future matters may prove to be incorrect, and actual results,
performance or achievement may vary materially from any projections and forward-looking statements.
• Due care and attention should be undertaken when considering and analysing the financial performance of the
Company.
• All references to dollars are to Australian currency unless otherwise stated.
IMPORTANT NOTICE AND DISCLAIMER
2RIGHT SOLUTIONS | RIGHT PARTNER

Company Profile
ALS Limited (ASX:ALQ) is an ASX 100 company that provides professional technical services to
the global Metals & Mining, Life Sciences, Oil & Gas, and Industrial sectors throughout the
world. The Reward business is an Australian distributer of non-perishable hospitality supplies.
Energy Division
Industrial Division
Life Sciences Division
Minerals Division
Reward Distribution
Environmental
Food - Pharma
Electronics
Consumer Products
Geochemistry
Metallurgy
Inspection
Mine Site Services
Asset Care
Tribology
Coal
Oil & Gas
Market Capitalisation
$2.1 bn
People
12,000
Revenue
$1.5 bn
Countries
+60
Operating Sites
+300
3RIGHT SOLUTIONS | RIGHT PARTNER

FY15 YTD – Revenue by Region by Division
7RIGHT SOLUTIONS | RIGHT PARTNER

Global Location Map
7RIGHT SOLUTIONS | RIGHT PARTNER

0
200
400
600
800
1,000
1,200
1,400
1,600
0
200
400
600
800
1,000
1,200
1,400
1,600
FY04 FY05 FY06 FY07 FY08 FY09 FY10 FY11 FY12 FY13 FY14
Cum
ulative N
et M
&A
Spend $
million
PealStreet Ltd.
Dec-09
Ecowise
Environmental
Pty Ltd..
Nov-09
Campbell
Brothers Ltd.,
Major Laundry
& Detergent
Brands
Oct-04
QCC
Hospitality
Aug-04
Ecochem
Jan-06
ETL Group
Jan-06
Caterworld
Jan-06
QCC
Hospitality
Jun-05
McCarthys
Feb-07
Campbell
Brothers Ltd.,
Pest Control &
Washroom
Services
Jan-07
Consulchem
Nov-06
Abilab
Nov-06
Pandee
Services
Sep-06
Analytica AB
Jul-06
Witlab
Nov-07
ACIRL Pty Ltd
Oct-07
eLab
Analytical Inc.
Aug-07
JK Tech
Mineralogy
Aug-07
DataChem
Oct-08
IQA
May-08
Stavely
Services
May-08
Microtech
Technical
Services Ltd.
Apr-08
Analytical
Laboratory
Services Inc.
Dec-10
Ammtec Ltd.
Nov-10
Campbell
Brothers
Limited
Cleantec
Business
Nov-10
LabMark
Environmental
Laboratories
May-10
Columbia
Analytical
Services
Nov-11
Austpower
Engineering.
Oct-11
PearlStreet
Energy
Services
Jul-11
Stewart Group
Jul-11
PMS Micro
Jun-11
Severn Trent
Laboratories
Feb-13
Corplab
Laboratories.
Dec-12
Panamex
Pacific
Oct-12
Deltrex
Chemicals
Sep-12
Artek
Laboratories
Aug-12
Milana A.S.
Jul-12
Eclipse
Scientific
Group
Apr-12
BMP
Enterprises
Feb-14
ALS Taiwan
Jan-14
OilCheck Pty
Ltd.
Oct-13
AIT
Oct-13
Reservoir
Group Ltd.
Aug-13
PSI Inc.
Aug-13
EarthData Pty
Ltd.
Jul-13
Reliance
May-13
Environmental Food/Pharma Consumer Products Geochemistry Metallurgy Inspection Engineering Oil & Gas
Coal Asset Care Tribology Reward Distribution Chemical Campbell Brothers Services
FY2005
revenue
$448m
FY2009
revenue
$951m
FY2014
revenue
$1,503m
Revenue $
million
Acquisition
Divestment
ALS journey over the last decade
15RIGHT SOLUTIONS | RIGHT PARTNER

Foreign Currency Revenues
47%
21%
15%
5%
3%
3%3%3%
AUD
42%
USD
22%
CAD
14%
EURO
6%
GBP
7%
Krona
3%
ZAR
2%
Asia
4%
FY2014 revenue
AUD $1.503 billion
Average Exchange Rate
FY2014 FY2013 Change
USD 0.9235 1.0323 -10.5%
CAD 0.9776 1.0354 -5.6%
EURO 0.6880 0.8016 -14.2%
GBP 0.5796 0.6536 -11.3%
SEK 6.0287 6.8819 -12.4%
ZAR 9.3955 8.8238 +6.5%
SGD 1.1639 1.2806 -9.1%
Note: Krona includes SEK, NOK, DKK & FMM
Asia includes HKD, SGD, THB, MYR, IDR, CYN & TWD
Outer annulus FY14, Inner annulus FY13
7RIGHT SOLUTIONS | RIGHT PARTNER

0
5
10
15
20
25
Q1
FY1
3 C
AP
EX
Q1
FY1
3 D
& A
Q2
FY13
CA
PEX
Q2
FY1
3 D
& A
Q3
FY1
3 C
AP
EX
Q3
FY1
3 D
& A
Q4
FY1
3 C
AP
EX
Q4
FY1
3 D
& A
Q1
FY14
CA
PEX
Q1
FY1
4 D
& A
Q2
FY1
4 C
AP
EX
Q2
FY1
4 D
& A
Q3
FY1
4 C
AP
EX
Q3
FY1
4 D
& A
Q4
FY14
CA
PEX
Q4
FY1
4 D
& A
Q1
FY1
5 C
AP
EX
Q1
FY1
5 D
& A
Q2
FY1
5 C
AP
EX
Q2
FY1
5 D
& A
AU
D$
mill
ion
Minerals Life Sciences Energy Industrial
CAPEX (excluding business acquisitions and land & building purchases)
versus Amortization & Depreciation
8
1Amortisation does not include amortisation of goodwill – chart represents the quarter in which the CAPEX was approved
Reservoir Group acquired--
RIGHT SOLUTIONS | RIGHT PARTNER

Underlying EBIT Margin – peer comparison
14.7% 15.0%15.8%
14.9%
9.7%
31.5%
0%
5%
10%
15%
20%
25%
30%
35%
ALS SGS B.V. Intertek Eurofins Core Labs
Note: June 2014 Half Year for all companies excluding ALS which is estimated for September 2014 Half Year
ALS estimate includes full Corporate Costs (i.e. Group Result excluding Reward operating revenue and profit)
Data from company reports
14RIGHT SOLUTIONS | RIGHT PARTNER
• Bottom of the minerals cycle• Coal industry depressed• Pricing pressure in environmental• Oil & Gas operations underperforming

Exploration has not stopped !
Note: SNL data showing reported significant drill intersections by commodity and location for the six month period
October 2013 to March 2014
14RIGHT SOLUTIONS | RIGHT PARTNER
Reported significant drill intersections – October 2013 to March 2014
22%
2%
47%
13%5%
11%

Where are we in the cycle? A reflection of the market and market share
14RIGHT SOLUTIONS | RIGHT PARTNER
-70%
-60%
-50%
-40%
-30%
-20%
-10%
0%
10%
20%
30%
40%
50%
60%
70%
80%
90%
100%
Jan
-06
Ap
r-0
6
Jul-
06
Oct
-06
Jan
-07
Ap
r-0
7
Jul-
07
Oct
-07
Jan
-08
Ap
r-0
8
Jul-
08
Oct
-08
Jan
-09
Ap
r-0
9
Jul-
09
Oct
-09
Jan
-10
Ap
r-1
0
Jul-
10
Oct
-10
Jan
-11
Ap
r-1
1
Jul-
11
Oct
-11
Jan
-12
Ap
r-1
2
Jul-
12
Oct
-12
Jan
-13
Ap
r-1
3
Jul-
13
Oct
-13
Jan
-14
Ap
r-1
4
Jul-
14
Oct
-14
DEL
TA (
last
2 w
ee
ks s
amp
le f
low
Ve
rsu
s sa
me
2 w
ee
ks la
st y
ear
)
Week
ALS Global Mineral Sample Flow (growth trend)
20092006 2007 20102008 2011 2012 2013 2014
7-Jan 7-Mar 7-May 7-Jul 7-Sep 7-Nov
Geochemical Sample Flow (2 week running average)
Traditional Field Season
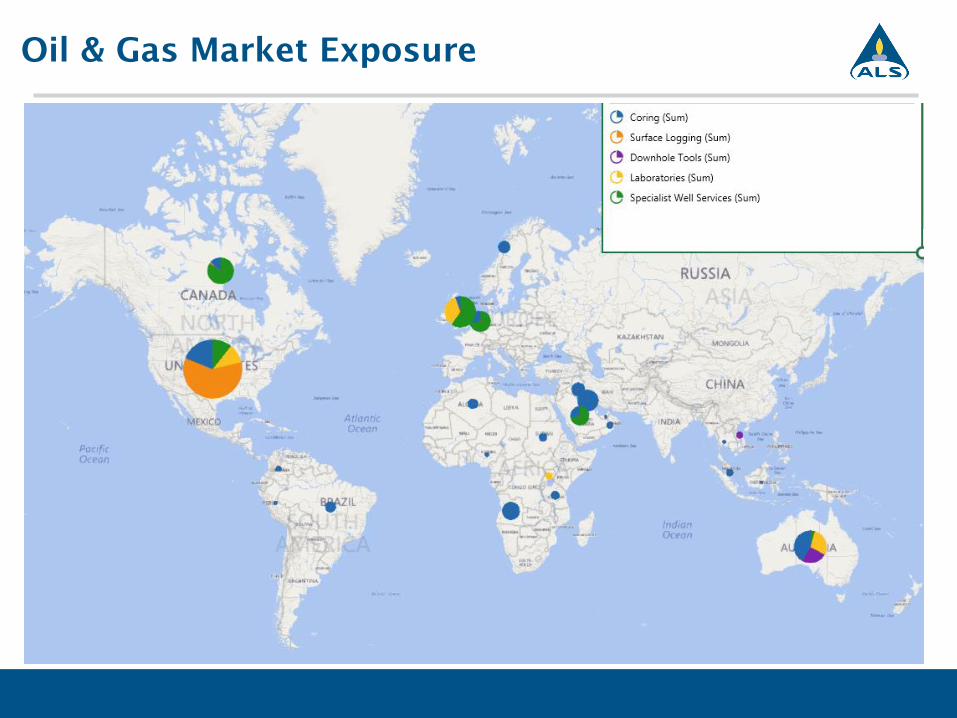
Oil & Gas Market Exposure

ALS Market Proposition pre 2012
• Value Proposition – “we are not the cheapest but
we provide the very best value”
• Focus on
• Quality
• Service
• Turnaround Time
• Technology
• Innovation – unique services
• Capacity
• Location
ALS Market Proposition Today
• Holistic Service Proposition – “how can we bring
value and reduce the total cost of our clients”
• Focus on
• Ancillary & complementary services
• Supply chain management
• Data presentation & analytics
• Total reliability
• Being a SOLUTION PROVIDER
• Capacity
• Location
but still with the laboratory at the core of what we do
“White
Coat
Syndrome”
How we see ourselves today – what has changed & why
RIGHT SOLUTIONS | RIGHT PARTNER