Morgan Stanley Industrials and Natural Resources … Stanley Industrials and Natural Resources...
32
www.thalesgroup.com Morgan Stanley Industrials and Natural Resources Summit London 10 September 2015
Transcript of Morgan Stanley Industrials and Natural Resources … Stanley Industrials and Natural Resources...

www.thalesgroup.com
Morgan Stanley Industrials and Natural Resources Summit London
10 September 2015

2
Thales at a glance
(*) Non-GAAP measure - Income from operations; plus the share of net income or loss of equity affiliates less: amortisation of intangible assets acquired (PPA) (**) Excluding the impact of the 35% share of net esult of DCNS (***) Based on foreign exchange rates as of February 2015
Aerospace
39%
Transport
11%
Defence & Security
50%
FY 2014 sales by segment
FY 2014 sales by geography
North America
11%
France
26%
United Kingdom
10%
Other Europe 23%
Australia 5%
Emerging Markets
23%
FY 2014 EBIT(*)
1.1
Employees
61,000
Global presence
56 countries
FY 2014 sales
13.0 billion euros
billion euros (**)
2015 objectives
Order
intake
Growing, beyond the high level
reached in 2014
Higher emerging markets
contribution
Sales Low single digit growth
EBIT(*) €1,130-1,150m (***)
2017/18 objectives
Sales Moderate growth
EBIT(*)
margin 9.5-10%

3
▌Aerospace
Avionics: continued positive dynamics for cockpit avionics
and IFEC
Space: telecom market remains highly competitive
▌ Transport
Strong demand in both emerging markets and Europe
▌Defence & Security
Elevated geopolitical tensions
Improved outlook in mature markets despite ongoing budget
pressures
Opportunities in emerging markets
H1 2015 business environment

4
▌Strong order intake
driven by emerging markets
▌Return to top line growth
▌ Further EBIT improvement
H1 2015 highlights
Continued focus on profitable growth

5
5,695
6,347
H1 2014 H1 2015
Sales
5,220
6,224
H1 2014 H1 2015
Order intake
402
473
H1 2014 (b) H1 2015
EBIT (a)
€m
(a) Non-GAAP measure: see definition in appendix
(b) In this presentation, H1 2014 EBIT has been restated to take into account the introduction of IFRIC 21
€m
€m €m
H1 2015 key figures
-535
-304
H1 2014 H1 2015
Free Operating Cash Flow
+19% +11%
+18%
6
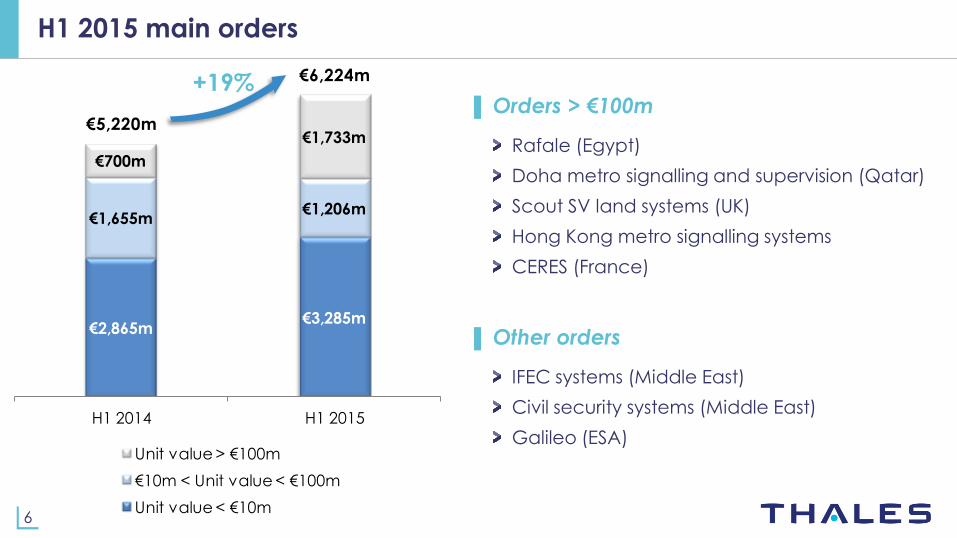
€2,865m€3,285m
€1,655m€1,206m
€700m
€1,733m€5,220m
€6,224m
H1 2014 H1 2015
Unit value > €100m
€10m < Unit value < €100m
Unit value < €10m
H1 2015 main orders
▌ Orders > €100m
Rafale (Egypt)
Doha metro signalling and supervision (Qatar)
Scout SV land systems (UK)
Hong Kong metro signalling systems
CERES (France)
▌ Other orders
IFEC systems (Middle East)
Civil security systems (Middle East)
Galileo (ESA)
+19%
7
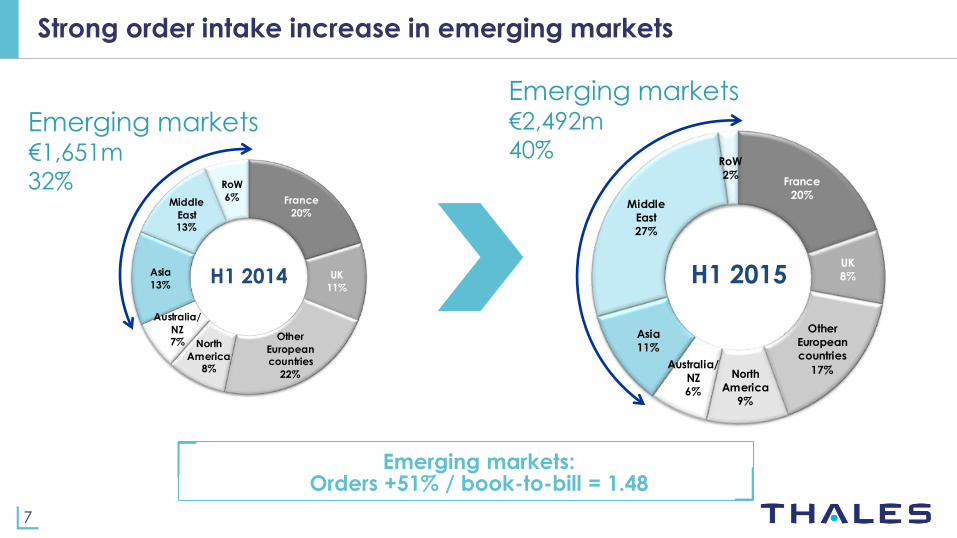
France
20%
UK
11%
Other
Europeancountries
22%
North
America8%
Australia/
NZ7%
Asia
13%
Middle
East13%
RoW
6%
H1 2014
France
20%
UK
8%
Other
European
countries
17%North
America
9%
Australia/
NZ
6%
Asia
11%
Middle
East
27%
RoW
2%
H1 2015
Strong order intake increase in emerging markets
Emerging markets €1,651m
32%
Emerging markets €2,492m
40%
Emerging markets: Orders +51% / book-to-bill = 1.48

8
Summary P&L: from sales to EBIT
(a) In this presentation, "organic" means "at constant scope and exchange rates"
(b) Non-GAAP measure: see definition in appendix.
Return to organic sales growth
Continued
EBIT improvement
€m
total organic
Sales 6,347 5,695 +11% +6%
Gross margin 1,520 1,399 +9% +4%
in % of sales 23.9% 24.6%
Indirect costs (1,064) (998) +7% +2%
in % of sales 16.8% 17.5%
o/w R&D expenses (310) (286) +9% +4%in % of sales 4.9% 5.0%
o/w M&S expenses (495) (456) +8% +4%in % of sales 7.8% 8.0%
o/w G&A expenses (259) (256) +1% -5%in % of sales 4.1% 4.5%
Restructuring costs (43) (53) -19% -19%
in % of sales 0.7% 0.9%
Share of net result of equity-accounted affiliates excl. DCNS 50 42 +19% -5%
EBIT (a)
excl. DCNS 463 391 +18% +11%
in % of sales 7.3% 6.9%
Share of net result of DCNS 10 10
EBIT (a) 473 402 +18% +10%
in % of sales 7.5% 7.1%
changeH1 2015 H1 2014

9
402
+29
+74+10
-10-13
-19
473
H1 2014
EBIT (a)
Scope
and FX
Organic
operationalperformance
Restructuring
charges
Pension
servicecosts
Add'l
expensedR&D
Add'l
expensedM&S
H1 2015
EBIT (a)
€m
(a) Non-GAAP measure: see definition in appendix.
+18%
EBIT bridge
Top line growth and efficiency measures drive EBIT increase
10
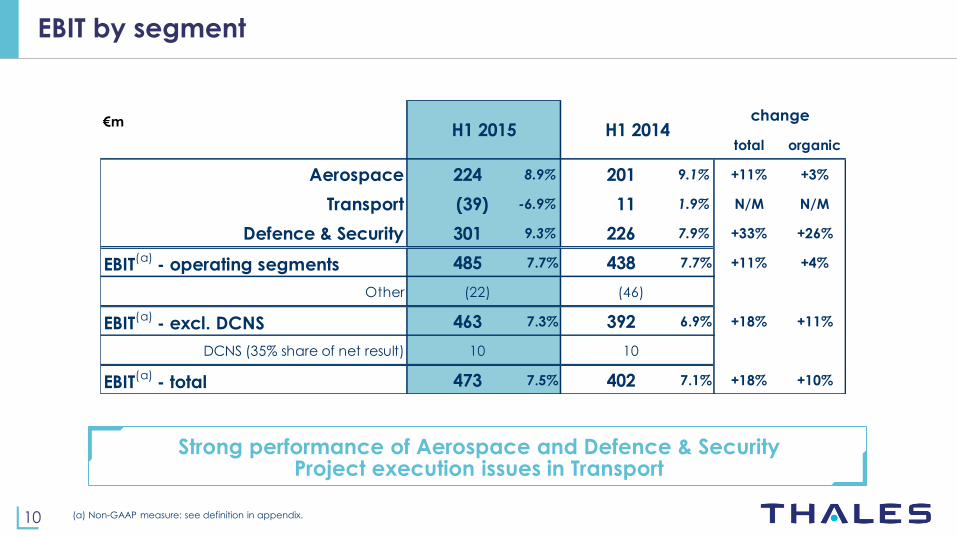
EBIT by segment
Strong performance of Aerospace and Defence & Security Project execution issues in Transport
(a) Non-GAAP measure: see definition in appendix.
€m
total organic
Aerospace 224 8.9% 201 9.1% +11% +3%
Transport (39) -6.9% 11 1.9% N/M N/M
Defence & Security 301 9.3% 226 7.9% +33% +26%
EBIT(a)
- operating segments 485 7.7% 438 7.7% +11% +4%
Other (22) (46)
EBIT(a)
- excl. DCNS 463 7.3% 392 6.9% +18% +11%
DCNS (35% share of net result) 10 10
EBIT(a)
- total 473 7.5% 402 7.1% +18% +10%
changeH1 2015 H1 2014
11
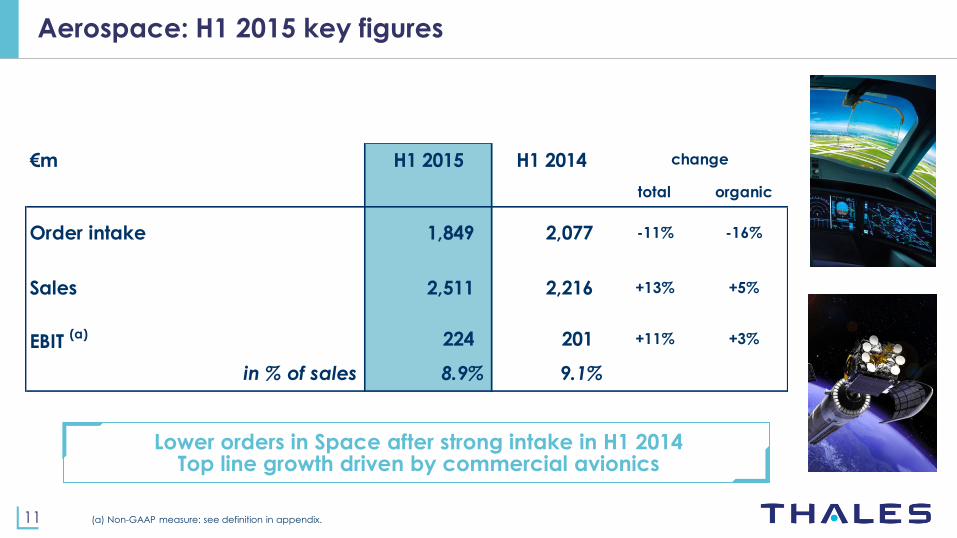
Aerospace: H1 2015 key figures
Lower orders in Space after strong intake in H1 2014 Top line growth driven by commercial avionics
€m H1 2015 H1 2014
total organic
Order intake 1,849 2,077 -11% -16%
Sales 2,511 2,216 +13% +5%
EBIT (a) 224 201 +11% +3%
in % of sales 8.9% 9.1%
change
(a) Non-GAAP measure: see definition in appendix.

12
Transport: H1 2015 key figures
Strong order intake momentum Project execution weighs on profitability, action plan underway
€m H1 2015 H1 2014
total organic
Order intake 1,197 637 +88% +80%
Sales 569 571 0% -6%
EBIT (a) (39) 11 N/M N/M
in % of sales -6.9% 1.9%
change
(a) Non-GAAP measure: see definition in appendix.

13
Defence & Security: H1 2015 key figures
Growing order intake (Rafale/Egypt) Higher profitability driven by top line growth and good project execution
€m H1 2015 H1 2014
total organic
Order intake 3,152 2,485 +27% +22%
Sales 3,229 2,873 +12% +9%
EBIT (a) 301 226 +33% +26%
in % of sales 9.3% 7.9%
change
(a) Non-GAAP measure: see definition in appendix.
14
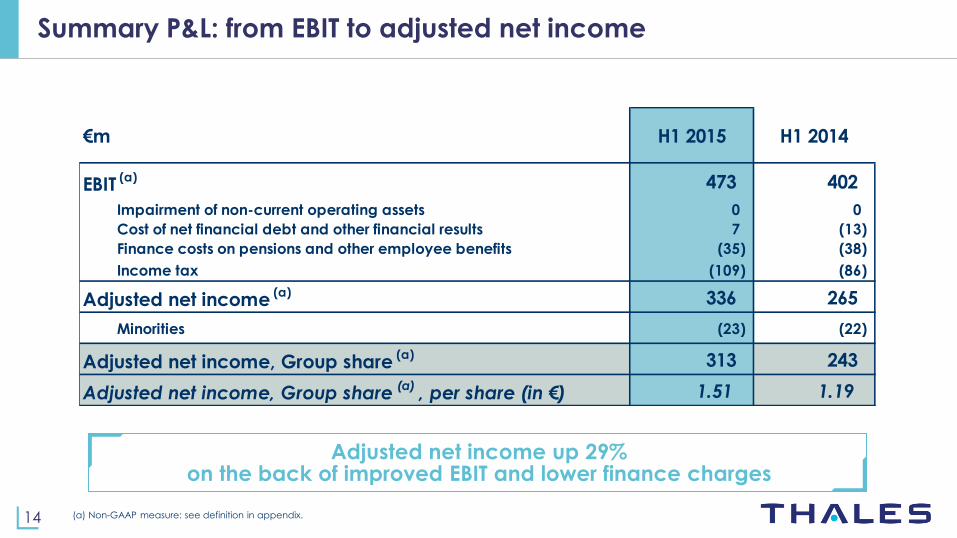
Adjusted net income up 29% on the back of improved EBIT and lower finance charges
Summary P&L: from EBIT to adjusted net income
(a) Non-GAAP measure: see definition in appendix.
€m H1 2015 H1 2014
EBIT (a) 473 402
Impairment of non-current operating assets 0 0
Cost of net financial debt and other financial results 7 (13)
Finance costs on pensions and other employee benefits (35) (38)
Income tax (109) (86)
Adjusted net income (a) 336 265
Minorities (23) (22)
Adjusted net income, Group share (a) 313 243
Adjusted net income, Group share(a)
, per share (in €) 1.51 1.19

15
Cash flow
Positive impact of downpayments on export contracts
(a) Non-GAAP measure: see definition in appendix.
€m H1 2015 H1 2014
683 582
Change in WCR & contingency reserves (697) (824)
Payment of contributions / pension benefits (60) (56)
Financial interest paid 10 (4)
Income tax paid (42) (44)
(106) (347)
Net operating investments (198) (188)
Free operating cash flow (a) (304) (535)
Net cash flows from operating activities
Operating cash flows before WCR changes

16
€m
Movement in net cash
Improved FOCF, strong net cash position
53
+1 036
-304
-81
-88
-231
+102
+104 +23 614
Net cash
30.06.2014
Free operating
cash flowH2 2014
Free operating
cash flowH1 2015
Deficit
paymentUK pensions
Disposals/
acquisitions
Dividends FX Stock options Other Net cash
30.06.2015

17
2015 priorities: a mid-year review
▌ What we said in February
Ambition Boost actions across all businesses and countries
Fixing issues in Transport
Monitoring and supporting DCNS
recovery
Deliver top line growth
Accelerate our globalisation
▌ Status
Ambition Boost delivers: EBIT(a) up 18% while keeping sustained R&D and commercial efforts
Comprehensive contract portfolio review by new management team
Recovery plan underway, drawing on resources from Aerospace and Defence & Security
DCNS on track to deliver breakeven
performance in 2015
Sales up 11% vs. H1 2014
EM orders up 51%, EM sales up 26%
vs. H1 2014
(a) Non-GAAP measure: see definition in appendix.

18
(a) Non-GAAP measure: see definition in appendix
(b) Based on foreign exchange rates as of February 2015
Order intake Growing – beyond the high level reached in 2014
Higher emerging markets contribution
Sales Low single digit growth
EBIT(a)
€1,130-1,150 m (b)
2015 objectives
Objectives confirmed

Appendix

20
▌Q3 and 9m 2015 sales 21 October 2015
▌2015 annual results 24 February 2016
Upcoming events

21
H1 2015 sales by destination
total organic
France 1,569 1,610 -3% -3%
United Kingdom 638 621 +3% -8%
Other European countries 1,263 1,232 +2% +1%
Europe 3,470 3,463 +0% -2%
North America 759 536 +42% +15%
Australia/NZ 365 327 +12% +7%
Asia 842 784 +7% +2%
Middle East 647 377 +71% +61%
Rest of the world 265 208 +27% +24%
Emerging markets 1,753 1,369 +28% +21%
Total 6,347 5,695 +11% +6%
€m H1 2015 H1 2014change
France
25%
UK
10%
Other
European
countries
20%
N America
12%
Australia/
NZ
6%
Asia
13%
Middle
East
10%
RoW
4%
H1 2015

22
H1 2015 adjusted net result
Sales 6,347 6,347 Cost of sales (4,827) (4,827)
R&D (310) (310)
SG&A costs (754) (754)
Restructuring costs (43) (43)
Amortisation of intangible assets (PPA) (53) 53 0
Income from operations 360 Impairment of non-current operating assets 0 --- (*)
Disposal of assets, change in scope and others (3) 3 0
Share in net income (loss) of equity affiliates 47 13 60
Income of operating activities
incl. share in net income of equity affiliates 404
EBIT 473 Impairment of non-current operating assets --- (*) 0
Cost of net financial debt 5 5
Other financial income (expense) (13) 15 2
Finance costs on pensions
and other employee benefits (25) (10) (35)
Income tax (88) (18) (1) (5) 3 (109)
Net income (loss) 282 48 2 10 7 335 Minorities (16) (6) (1) 1 (23)
Net income (loss), Group share 266 42 2 9 8 313
(*) included within "Income of operating activities incl. share in net income of equity affiliates" in the consolidated P&L and within "Net income" in the adjusted P&L
Adjusted
P&L
H1 2015
€m
Consolidated
P&L H1 2015
Amortisation of
intangible assets
(PPA)
Disposal of
assets and
others
Change in fair
value of
derivative FX
instruments
Actuarial
gains/losses
on other long
term benefits
23
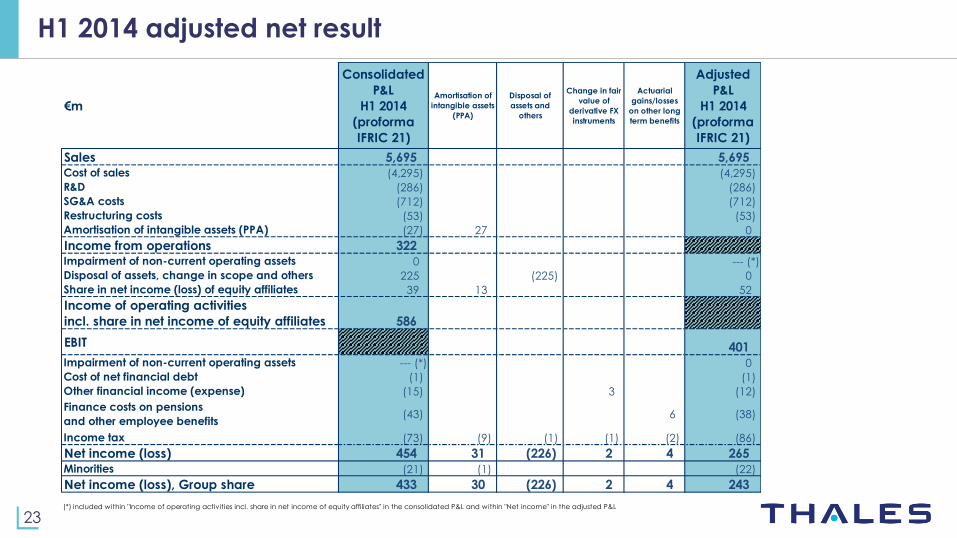
H1 2014 adjusted net result
Sales 5,695 5,695Cost of sales (4,295) (4,295)
R&D (286) (286)
SG&A costs (712) (712)
Restructuring costs (53) (53)
Amortisation of intangible assets (PPA) (27) 27 0
Income from operations 322Impairment of non-current operating assets 0 --- (*)
Disposal of assets, change in scope and others 225 (225) 0
Share in net income (loss) of equity affiliates 39 13 52
Income of operating activities
incl. share in net income of equity affiliates 586
EBIT 401Impairment of non-current operating assets --- (*) 0
Cost of net financial debt (1) (1)
Other financial income (expense) (15) 3 (12)
Finance costs on pensions
and other employee benefits(43) 6 (38)
Income tax (73) (9) (1) (1) (2) (86)
Net income (loss) 454 31 (226) 2 4 265Minorities (21) (1) (22)
Net income (loss), Group share 433 30 (226) 2 4 243
(*) included within "Income of operating activities incl. share in net income of equity affiliates" in the consolidated P&L and within "Net income" in the adjusted P&L
Actuarial
gains/losses
on other long
term benefits
Adjusted
P&L
H1 2014
(proforma
IFRIC 21)
€m
Consolidated
P&L
H1 2014
(proforma
IFRIC 21)
Amortisation of
intangible assets
(PPA)
Disposal of
assets and
others
Change in fair
value of
derivative FX
instruments
24
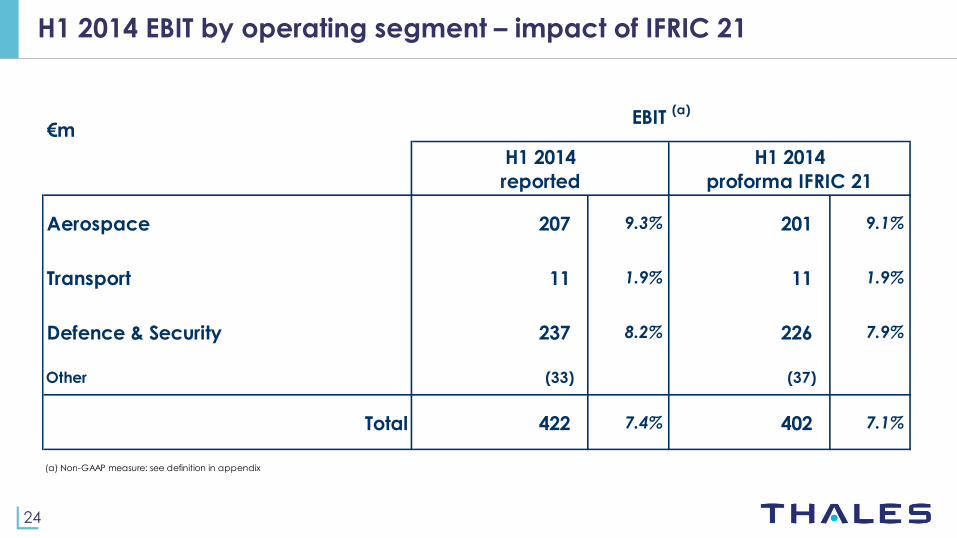
H1 2014 EBIT by operating segment – impact of IFRIC 21
€m
Aerospace 207 9.3% 201 9.1%
Transport 11 1.9% 11 1.9%
Defence & Security 237 8.2% 226 7.9%
Other (33) (37)
Total 422 7.4% 402 7.1%
(a) Non-GAAP measure: see definition in appendix
H1 2014
proforma IFRIC 21
EBIT (a)
H1 2014
reported
25
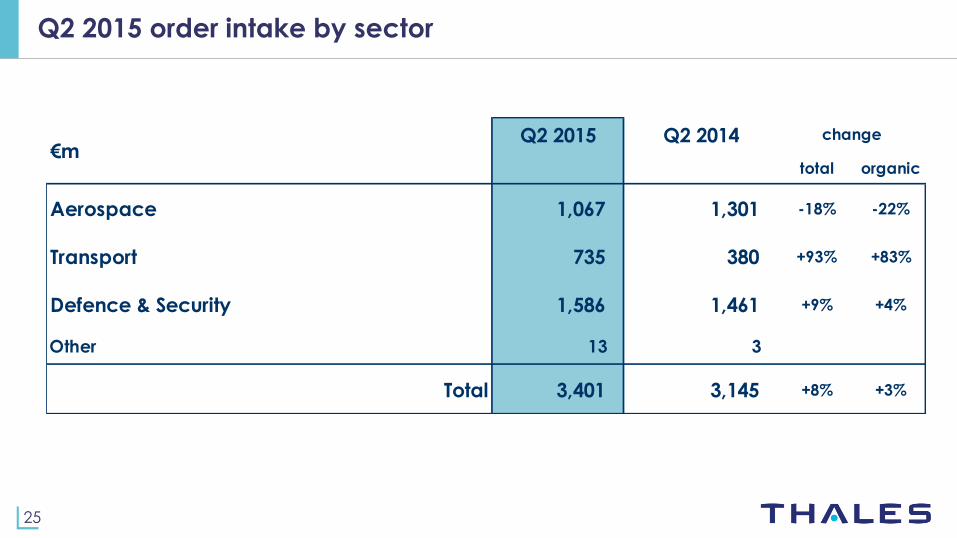
Q2 2015 order intake by sector
Q2 2015 Q2 2014
total organic
Aerospace 1,067 1,301 -18% -22%
Transport 735 380 +93% +83%
Defence & Security 1,586 1,461 +9% +4%
Other 13 3
Total 3,401 3,145 +8% +3%
change€m
26
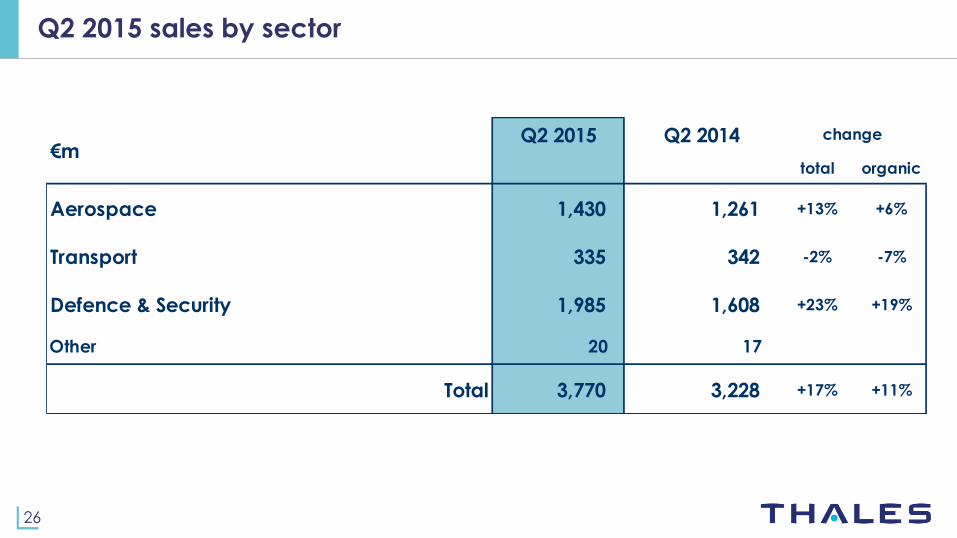
Q2 2015 sales by sector
Q2 2015 Q2 2014
total organic
Aerospace 1,430 1,261 +13% +6%
Transport 335 342 -2% -7%
Defence & Security 1,985 1,608 +23% +19%
Other 20 17
Total 3,770 3,228 +17% +11%
change€m

27
Thales on board Rafale
Thales =
about 25% of total aircraft value
28
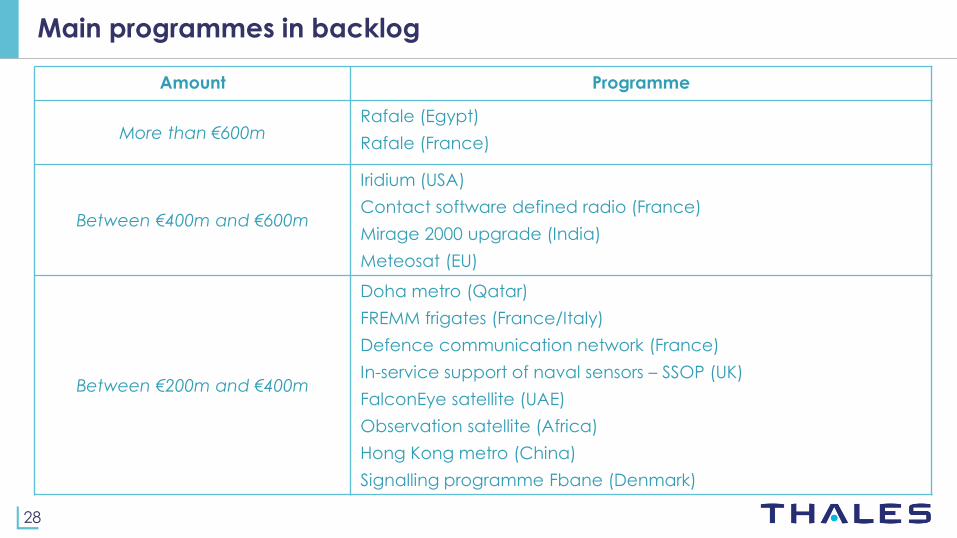
Amount Programme
More than €600m Rafale (Egypt)
Rafale (France)
Between €400m and €600m
Iridium (USA)
Contact software defined radio (France)
Mirage 2000 upgrade (India)
Meteosat (EU)
Between €200m and €400m
Doha metro (Qatar)
FREMM frigates (France/Italy)
Defence communication network (France)
In-service support of naval sensors – SSOP (UK)
FalconEye satellite (UAE)
Observation satellite (Africa)
Hong Kong metro (China)
Signalling programme Fbane (Denmark)
Main programmes in backlog

29 (a) French State shares are held directly and indirectly through TSA, a 100% state-owned holding company
Thales shareholding structure – June 2015
French
State (a)
26.1%
Dassault
Aviation
25.0%
Free float
48.9%
o/w
Employees
1.9%
Total share count as of 30 June:
210,162,630
30
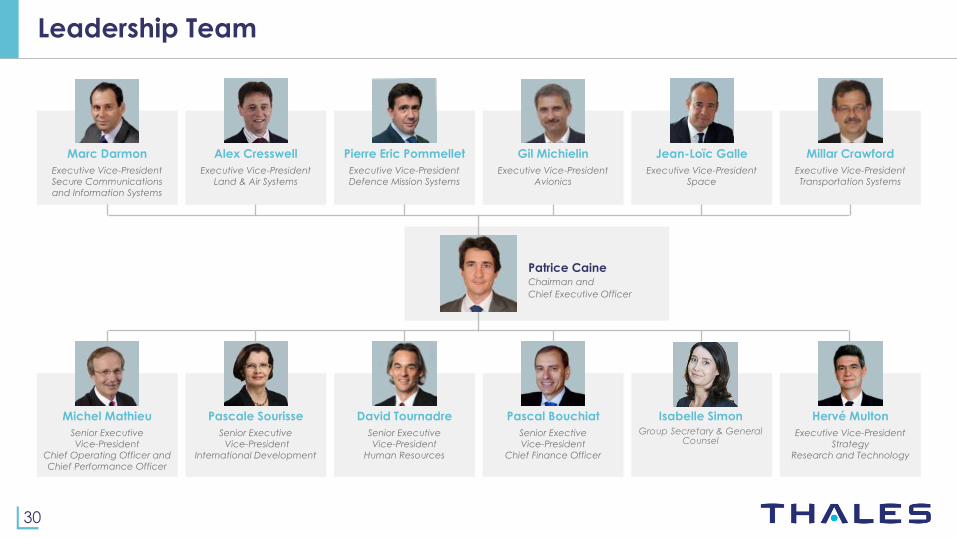
Leadership Team
Alex Cresswell
Executive Vice-President
Land & Air Systems
Marc Darmon
Executive Vice-President
Secure Communications
and Information Systems
Pierre Eric Pommellet
Executive Vice-President
Defence Mission Systems
Gil Michielin
Executive Vice-President
Avionics
Jean-Loïc Galle
Executive Vice-President
Space
Millar Crawford
Executive Vice-President
Transportation Systems
Pascale Sourisse
Senior Executive
Vice-President
International Development
Michel Mathieu
Senior Executive
Vice-President
Chief Operating Officer and
Chief Performance Officer
David Tournadre
Senior Executive
Vice-President
Human Resources
Pascal Bouchiat
Senior Exective
Vice-President
Chief Finance Officer
Hervé Multon
Executive Vice-President
Strategy
Research and Technology
Patrice Caine Chairman and
Chief Executive Officer
Isabelle Simon Group Secretary & General
Counsel

31
This presentation contains non-Generally Accepted Accounting Principles (GAAP) financial measures. Thales regards such non-GAAP
financial measures as relevant operating and financial performance indicators for the Group, as they allow non-operating and non-
recurring items to be excluded. Thales definitions for such measures may differ from similarly titled measures used by other companies or
analysts.
▌Organic: at constant scope and exchange rates.
▌Book-to-Bill ratio: ratio of orders received to sales.
▌EBIT: income from operations; plus the share of net income or loss of equity affiliates less: amortisation of intangible assets acquired (PPA)
▌Emerging Markets: All countries in Middle East, Asia, Latin America and Africa
▌Adjusted net income: net income, less the following elements, net of the corresponding tax effects: (i) amortisation of intangible assets
acquired, (ii) disposal of assets, change in scope of consolidation and other, (iii) change in fair value of derivative foreign exchange
instruments (recorded in "other financial results" in the consolidated accounts), (iv) actuarial gains or losses on long-term benefits
(accounted within the "finance costs on pensions and employee benefits" in the consolidated accounts).
▌Adjusted EPS: ratio of adjusted net income (as defined above) to average number of shares outstanding.
▌Free Operating Cash Flow: net cash flow from operating activities, less: capital expenditures, less: deficit payments on pensions in the
United Kingdom.
Definition of non-GAAP measures

Thales – Tour Carpe Diem – 31 Place des Corolles – 92098 Paris La Défense – France www.thalesgroup.com
This presentation may contain forward-looking statements. Such forward-looking statements are trends or objectives, as the case may be, and shall not be construed as constituting forecasts regarding the Company’s results or any other performance indicator. These statements are by nature subject to risks and uncertainties as described in the Company’s registration document ("Document de référence") filed with Autorité des Marchés Financiers. These statements do not therefore reflect future performance of the Company, which may be materially different.