Morgan Stanley Global Consumer and Retail Conference ...
24
Morgan Stanley Global Consumer and Retail Conference November 18, 2015 Scott Maw, Starbucks cfo
Transcript of Morgan Stanley Global Consumer and Retail Conference ...

Morgan Stanley Global Consumer and Retail Conference November 18, 2015
Scott Maw, Starbucks cfo

Forward Looking Statements
© 2015 Starbucks Coffee Company . All Rights Reserved.
This presentation contains forward‐looking statements. Forward‐looking statements are subject to various risks and uncertainties that could cause our actual results to differ materially from these statements and should be considered in conjunction with cautionary statements and risk factor discussions in our filings with the SEC, including our last annual report on Form 10K. Starbucks assumes no obligation to update any of these forward‐looking statements or information. Please refer to the footnote within a particular slide or to the table at the end of this presentation to find reconciliations of non‐GAAP financial measures noted in this presentation with their corresponding GAAP measures.

Investing in
Growth

$2.0
$2.5
$3.1
$3.7
FY12 FY13 FY14 FY15
15.0% 16.5%
18.6% 19.1%
FY12 FY13 FY14 FY15
$13.3 $14.9
$16.4
$19.2
FY12 FY13 FY14 FY15
13% CAGR
Profitable GROWTH
Consolidated Operating Margin* (%) Consolidated Revenue (in billions)
Consolidated Operating Income* (in billions)
* FY13, FY14 and FY15 operating margin, operating income and earnings per share figures are Non-GAAP; operating margin, operating income and earnings per share growth rates are based on Non-GAAP figures; a reconciliation of GAAP to non-GAAP measures can be found at the end of this presentation.
$0.90
$1.10
$1.33
$1.58
FY12 FY13 FY14 FY15
Earnings Per Share*
23% CAGR 21% CAGR
410 BPS
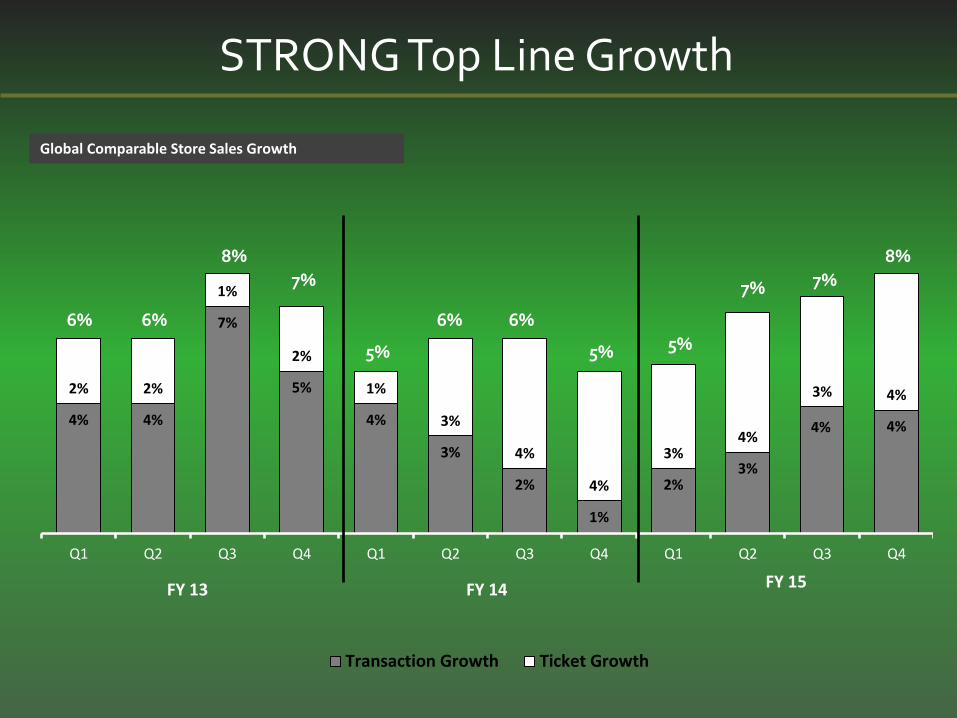
4% 4%
7%
5%
4%
3%
2%
1%
2% 3%
4% 4%
2% 2%
1%
2%
1%
3%
4%
4%
3% 4%
3% 4%
Q1 Q2 Q3 Q4 Q1 Q2 Q3 Q4 Q1 Q2 Q3 Q4
Transaction Growth Ticket Growth
FY 13 FY 14 FY 15
7%
6% 6%
8%
5%
6% 6%
5% 5%
7% 7%
8%
STRONG Top Line Growth
Global Comparable Store Sales Growth
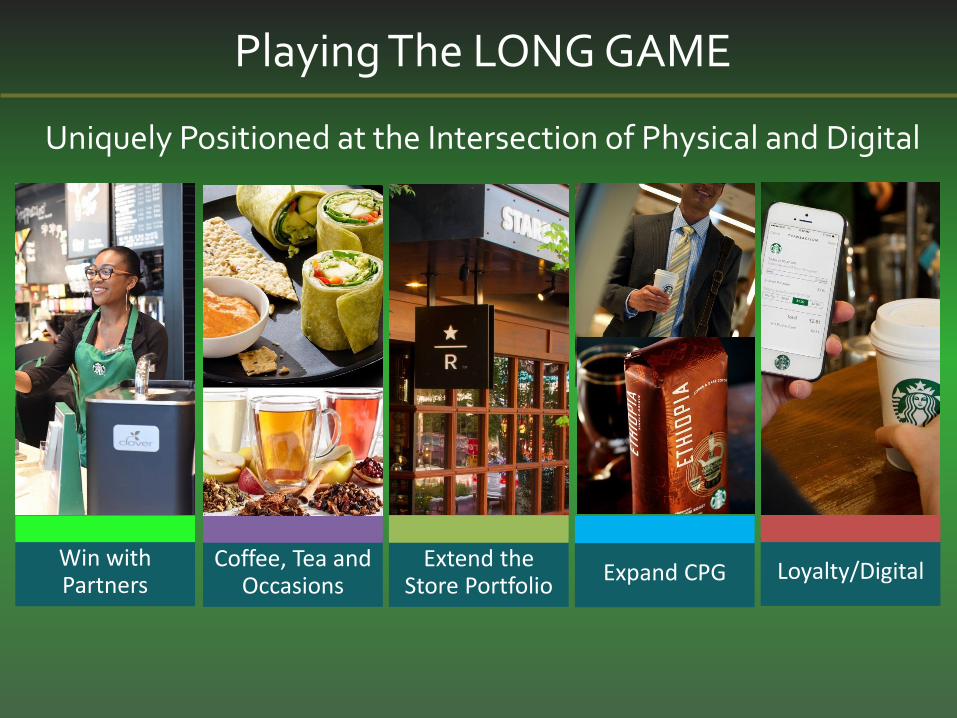
Playing The LONG GAME
Win with Partners
Uniquely Positioned at the Intersection of Physical and Digital
Coffee, Tea and Occasions
Extend the Store Portfolio
Loyalty/Digital Expand CPG

Win with Partners - Investing for Growth
FY15
YOY Incremental Investment ~$145M
FY16
~$100M - $125M
Competitive Pay
Health Care
2 Years of College
On-shift Beverage
Stock Compensation
Pre-FY15
Partner Benefits
Partner / Digital
Partner Benefits
Enhanced Pay
Food Benefit
Four Years of College
Additional Pay Expanded College
Partner / Digital
International Markets

Coffee, Tea and Occasions
Unparalleled
super- premium tea expertise
Bringing premiumization to the coffee category
Creating and fulfilling
new occasions in our stores

Coffee Leadership
Agronomy
Starbucks Reserve ®
Innovation
Starbucks Reserve®

Teavana – Elevating the Tea Category
Driving
REVENUE growth
Contributing to
COMP growth
Increasing ATTACH

Occasions – Growth Through INNOVATION
U.S.
AFTERNOON LUNCH EVENINGS
OWN THE MORNING GO BIG ON LUNCH REFRESHMENTS AND SNACKS EXTEND THE 3RD PLACE OWN THE MORNING
MORNING
Lunch/Mid-day +30% Morning +22% Afternoon/Evening +19%
Average transaction growth in the last 5 years*:
* Average transactions per store per day, U.S. company operated , growth from FY10-FY15

New Stores - Growth Through Global Expansion
In FY07,
70% of 2,500+ net new stores
were INSIDE the U.S.

Company Operated Market
JV/ Licensed Market
FY15 Equity Ownership:
New Stores - Growth Through Global Expansion
In FY16,
70% of 1,800 net new stores
will be OUTSIDE the U.S.

New Stores - Growth Through Global Expansion
In FY16,
70% of 1,800 net new stores
will be OUTSIDE the U.S.
SIGNIFICANT opportunity
in China & Japan

New Stores – Growth Through Store Formats
Starbucks Reserve ®
Drive Thru Only
Mobile Trucks
Express Store

Extend CPG Globally
U.S.
INNOVATION OPPORTUNITY UNIQUE ASSETS INTERNATIONAL RTD
$6B China Coffee & Energy Market
Partnership with Tingyi
$4B Latin America Coffee & Energy Market
Partnership with PepsiCo
Share leader in premium
Roast & Ground and
K-Cups®
80% of U.S. Coffee occasions occur outside
of coffee shops
~500 Signature Aisles in grocery stores
+21M stars earned by My
Starbucks Rewards® members down the aisle

Convenience
Service
Frequency
Broad Store and Customer Network
35% of transactions (pre-paid)
1 in 7 adults in the U.S. received a Starbucks Card in Holiday 2015
$5+ Billion in Card Loads in FY15
Robust Card Program
10M active members in the U.S.
High Value, Efficient Cost
Unparalleled Loyalty Program
A UNIQUE and POWERFUL Digital Ecosystem…

21% of transactions as of October
Store Locator, Menu, Messages
Mobile Speed, Relevance, Convenience
Opportunity
Stars Everywhere
Engaged Customers & Partners
Speed, Convenience
…And We Are Just GETTING STARTED
Stores
Card
Loyalty
Mobile Order & Pay
Delivery

$1.8
$2.9
$3.4
$3.7
FY12 FY13 FY14 FY15
INCREASING Operating Cash Flow
* Non-GAAP measure; FY14 GAAP operating cash flows of $608 million have been adjusted to exclude the $2.8 billion cash payment elated to the Kraft arbitration matter.
Operating Cash Flow (in billions)
*
29% CAGR

INCREASING Cash Returned to Shareholders
$0.6 $0.5 $0.8
$1.4 $0.5 $0.6
$0.8
$1.0
FY12 FY13 FY14 FY15
DIVIDENDS
SHAREREPURCHASES
$1.1 $1.2
$1.6
Cash Returns (in billions)
Dividends paid in FY15 +22%
$2.4
TSR FY11 to FY15: +380%

Coffee Cost Trend – 3 Years
Monthly SBUX Rate C Price + SBUX Differential SBUX Average P&L Rate
FY 14 FY 15 FY 16

Mid-Single Digits
COMP GROWTH
Consistent High Growth Over the Long Term
*Based on Non-GAAP EPS. A reconciliation of GAAP to Non-GAAP measures can be found at the end of this presentation. ** ROIC defined as NOPAT/Average Invested Capital. NOPAT adjusted for implied lease interest expense; average invested capital includes present value of minimum lease obligations and excludes cash, cash equivalents and short- and long-term investments.
10%+
REVENUE GROWTH
>25%
Increasing
50-100 bps
per year
ROIC**
Growth of
15-20%
Non-GAAP EPS*
FY16 Somewhat above Mid-Single Digits
10%
53rd week will add an incremental ~2%
$1.87 to $1.89 Including 53rd week
Up 50-100 BPS

© 2015 Starbucks Coffee Company . All Rights Reserved.
Q&A

GAAP/Non-GAAP Reconciliation
Non-GAAP OPERATING INCOME RECONCILIATION FY13 FY14 FY15
GAAP (325.4)$
Litigation charge resulting from Kraft Arbitration 2,784.1
Non-GAAP 2,458.7$
GAAP 3,081.1$
Litigation credit resulting from Kraft Arbitration (20.2)
Costs from transactions in Q4 2014 (1) 2.4
Non-GAAP 3,063.3$
GAAP 3,601.0$
Starbucks Japan acquisition-related items - other (2) 54.6
Non-GAAP 3,655.6$
(1) Includes a portion of the transaction costs incurred in Q4 FY14 related to the acquisition of
Starbucks Japan and costs related to the sale of our Australia retail operations in Q4 FY14. The
remaining majority of the impact from these transactions is included in net interest income and other.
(2) Includes ongoing amortization expense of acquired intangible assets and transaction and
integration costs.
Non-GAAP OPERATING MARGIN % RECONCILIATION FY13 FY14 FY15
GAAP (2.2)%
Litigation charge resulting from Kraft Arbitration 18.7%
Non-GAAP 16.5%
GAAP 18.7%
Litigation credit resulting from Kraft Arbitration (0.1)%
Costs from transactions in Q4 2014 (1) 0.0%
Non-GAAP 18.6%
GAAP 18.8%
Starbucks Japan acquisition-related items - other (2) 0.3%
Non-GAAP 19.1%
(1) Includes a portion of the transaction costs incurred in Q4 FY14 related to the acquisition of
Starbucks Japan and costs related to the sale of our Australia retail operations in Q4 FY14. The remaining
majority of the impact from these transactions is included in net interest income and other.
(2) Includes ongoing amortization expense of acquired intangible assets and transaction and integration costs.
Non-GAAP EPS RECONCILIATION FY13 FY14 FY15FY16
Projected
GAAP 0.01$ (1) The net benefit from transactions in Q4 2014 relates primarily to a $0.02 gain
Litigation charge resulting from Kraft Arbitration 1.12 on the sale of our Malaysia equity method investment, partially offset by a loss on
Gain on sale of equity in Mexico joint venture (0.02) the sale of our Australia retail operations and transaction costs incurred in Q4 FY14
Gain on sale of equity in Chile and Argentina joint ventures (0.02) related to the acquisition of Starbucks Japan.
Non-GAAP 1.10$ (2) Gain represents the fair value adjustment of Starbucks preexisting 39.5%
GAAP 1.35$ ownership interest in Starbucks Japan upon acquisition.
Litigation credit resulting from Kraft Arbitration (0.01) (3) Includes ongoing amortization expense of acquired intangible assets and transaction and integration
Net benefit from transactions in Q4 2014 (1) (0.02) costs, such as incremental IT and compensation-related costs associated with the acquisition.
Non-GAAP 1.33$ (4) Represents the loss on extinguishment of debt ($61.1M), which is comprised of the cost
GAAP $1.82 of the optional redemption provision, unamortized debt issuance costs, and unamortized
Starbucks Japan acquisition-related items - gain (2) (0.26) discount associated with the $550 mill ion of 6.250% 2017 Senior Notes redeemed in Q4 FY15,
Starbucks Japan acquisition-related items - other (3) 0.03 as well as the related unamortized interest rate hedge loss ($2.0M), which was recorded in
Debt extinguishment-related items (4) 0.03 interest expense.
Tax benefit from domestic manufacturing deduction (5) (0.04) (5) Represents the incremental benefit related to additional domestic manufacturing
Non-GAAP 1.58 deductions to be claimed in our U.S. consolidated tax returns for FY10 through FY14 and
GAAP $1.84 - $1.86 through Q3 FY15.
Starbucks Japan acquisition-related items - other (3) 0.03
Non-GAAP $1.87 - $1.89