Morgan Stanley Financials Conference - UBS · Morgan Stanley Financials Conference March 29, 2012...
18
Morgan Stanley Financials Conference March 29, 2012 Tom Naratil Group Chief Financial Officer
Transcript of Morgan Stanley Financials Conference - UBS · Morgan Stanley Financials Conference March 29, 2012...
Morgan Stanley Financials Conference
March 29, 2012
Tom NaratilGroup Chief Financial Officer

1
schmidgr [printed: ____] [saved: August 24, 2011 1:18 PM] Z:\4 Presentations\2011\20111003_BoAML\20110822_BoAML_V1.ppt
Cautionary statement regarding forward-looking statements
This presentation contains statements that constitute “forward-looking statements”, including statements relating to UBS’s financial performance and
statements relating to the anticipated effect of strategic initiatives on UBS’s business and future development. Factors that could cause actual
developments and results to differ materially from UBS’s expectations include, but are not limited to: whether UBS will be successful in effecting
organizational changes and implementing strategic plans, and whether those changes and plans will have the effects intended; developments in the
markets in which UBS operates or to which it is exposed; changes in the availability of capital and funding; UBS's ability to reduce its Basel III risk-weighted
assets in order to comply with Swiss capital requirements without adversely affecting its business; changes in financial regulation in Switzerland, the United
States, the United Kingdom and other major financial centers; possible constraints that regulatory authorities may impose directly or indirectly on UBS’s
business activities, whether as a consequence of the unauthorized trading announced in September 2011 or for other reasons; changes in UBS’s
competitive position, including whether differences in regulatory requirements applicable to UBS will adversely affect its ability to compete in certain lines
of business; the liability to which UBS may be exposed due to litigation, contractual claims and regulatory investigations; the effects on UBS’s cross-border
banking business of tax treaties recently negotiated by Switzerland or to be concluded in the future; UBS’s ability to retain and attract the employees
necessary to generate revenues and to manage, support and control its businesses; limitations on the effectiveness of UBS’s internal processes for risk
management, risk control, measurement and modeling; changes in accounting standards and policies and future accounting determinations relating to
goodwill and other items; whether UBS will be successful in keeping pace with competitors in updating its technology, particularly in trading businesses;
and the occurrence of operational failures, such as fraud, unauthorized trading and systems failures. Our business and financial performance could be
affected by other factors identified in our past and future filings and reports, including those filed with the SEC. More detailed information about those
factors is set forth in documents furnished by UBS and filings made by UBS with the SEC, including UBS’s Annual Report on Form 20-F for the year ended 31
December 2011. UBS is not under any obligation to (and expressly disclaims any obligation to) update or alter its forward-looking statements, whether as a
result of new information, future events, or otherwise.
Disclaimer: This presentation and the information contained herein are provided solely for information purposes, and are not to be construed as a
solicitation of an offer to buy or sell any securities or other financial instruments in Switzerland, the United States or any other jurisdiction. No investment
decision relating to securities of or relating to UBS AG or its affiliates should be made on the basis of this document. No representation or warranty is made
or implied concerning, and UBS assumes no responsibility for, the accuracy, completeness, reliability or comparability of the information contained herein
relating to third parties, which is based solely on publicly available information. UBS undertakes no obligation to update the information contained herein.
© UBS 2012. The key symbol and UBS are among the registered and unregistered trademarks of UBS. All rights reserved.

2
schmidgr [printed: ____] [saved: August 24, 2011 1:18 PM] Z:\4 Presentations\2011\20111003_BoAML\20110822_BoAML_V1.ppt
2
Key messagesKey messages
Capital strength is the foundation of our success and we are targeting a common equity tier 1 ratio of 13% under Basel 3
We remain vigilant on costs as we strive to improve returns to our shareholders
We are on track to achieve the targeted Basel 3 risk-weighted assets of no more than CHF 150 billion in our core Investment Bank
Our strategy is centered on our pre-eminent wealth management businesses and our universal bank in Switzerland. It builds on the strengths of all of our businesses, supported by our industry-leading capital position
We continue to grow our wealth management businesses and see strength inkey geographies and business lines elsewhere across the Group
We have every reason to be confident in our future

3
schmidgr [printed: ____] [saved: August 24, 2011 1:18 PM] Z:\4 Presentations\2011\20111003_BoAML\20110822_BoAML_V1.ppt
World leading HNW and UHNW wealth manager, unrivaled in scope, reach and client mix with a strong footprint in all major financial centers
3
651 720
Our wealth management businesses are unrivaled
1 Excluding restructuring charges, gains from the sale of the strategic investment portfolio in 3Q11 (WM) and 3Q10 provision related to an arbitration matter (WMA); 2009 includes restructuring charges for WM&SB of CHF 322 million
UBS Wealth Management
Invested assets 31.12.11CHF 1,459 billion
3
Our footprint: >11,000 advisors in ~550 offices in more than 40 countries
UBS WM Americas709 750
(CH
F m
illio
n)
(CH
F b
illio
n)
Pre-tax profit1 (WM+WMA) Net new money (WM+WMA)
Quarterly average Quarterly average
578 602717
2009 2010 2011
(24.7)
8.9
(4.6)
2009 2010 2011

4
schmidgr [printed: ____] [saved: August 24, 2011 1:18 PM] Z:\4 Presentations\2011\20111003_BoAML\20110822_BoAML_V1.ppt
4
Our clients turn to us for advice to address their concerns
4
Our clients’ positioning is a reflection of market uncertainties
Size of US national debt
Oil prices
European debt crisis
Americas
Large cash holdings
con
cern
European debt crisis
Middle East unrest
Size of US national debt
Emerging Markets
Large cash holdings
con
cern
European debt crisis
Strength of the Swiss franc
Real estate prices
Switzerland
Large cash holdingsFocus on capital preservation
con
cern
European debt crisis
Macro concerns on growth/GDP
Taxation policy
Europe
Large cash holdings
con
cern
European debt crisis
European economy
Oil prices
APAC
Large cash holdings
con
cern

5
schmidgr [printed: ____] [saved: August 24, 2011 1:18 PM] Z:\4 Presentations\2011\20111003_BoAML\20110822_BoAML_V1.ppt
Why clients value UBS Investment Bank
Geographic footprint
M&A / Corporate Finance
Research
Execution / risk capabilities
Product development
Sovereigns, institutional and corporate clients Wealth management clients
• Leading structuring capabilities across asset classes, products and markets
• Thought-leading, customised development
• Creative, innovative products suitable to WM investors
• Bespoke solutions for top tier clients
• Thought leadership and insights provided by global advisory coverage teams
• Efficient access to large institutional and private investor base as well as other service offerings
• Access to advisory skills, and ECM / DCM platform for entrepreneur clients
• Access to capital markets and institutional investor base
• Strength and presence in each region and particular strength in APAC
• Dedicated Investment Bank coverage for UHNW and onshore presence in wealth management growth markets
• Deep insights into economic, market and geopolitical environments through presence and relationships throughout the globe
• Strong equities presence in all major markets
• Top tier research offering: single stock, sector and macroeconomic
• Effective aggregation of research content into actionable ideas
• Global market reach• Leading low latency execution platforms • Top 3 Futures Clearing platform• Market maker/major liquidity provider
• Impeccable and cost effective execution and market making for listed and OTC products
• Access to Prime Brokerage platform for semi-institutional clients
What clients need from our Investment Bank

6
schmidgr [printed: ____] [saved: August 24, 2011 1:18 PM] Z:\4 Presentations\2011\20111003_BoAML\20110822_BoAML_V1.ppt
Our strategy builds on the strengths of all of our businesses
WM• Delivered stronger FY11 profits
• #1 in Europe, APAC, EM, CH and UNHW by invested assets
• Access to growth through unique client base and global footprint
WMA
• Industry-leading productivity per FA: #1 vs. US peers1 in invested assets, revenue and NNM
• Cost / income ratio in line with our largest scale peer1
• Focus on HNW & UHNW segments has resulted in significant increases in credit line balances and NNM since 2009
R&C
• Leading retail and corporate business in Switzerland – inherently stable
• Contributes to growth in Wealth Management, Global Asset Management and the Investment Bank
• Continued to attract deposit inflows
Global AM• Well-diversified across investment capabilities, regions and distribution channels
• Very successful alternatives platform, including our real estate and fund of hedge funds businesses both ranked top 3 globally2
IB
• Consistently top-ranked research house3, top 3 Global Equities House4
• Top 3 overall FX market share5 consistently since 2005, #1 FX House 20116
• Strong global footprint: consistently top 3 in APAC IBD7, #1 Pan-European brokerage firm8
and leading Australian franchise
We are centered on our pre-eminent wealth management businesses and our Swiss universal bank, building on the strengths of all of our businesses
61 Based on public sources of BoA, MSSB, WFC2 InvestHedge March 2012, Pensions & Investments October 20113 Institutional Investor 20114 UBS estimates based on companies reporting FY2011 revenues
5 Euromoney FX Poll (2005 – 2011)6 Risk Magazine, September 20117 Dealogic8 Thomson Extel surveys 2011

7
schmidgr [printed: ____] [saved: August 24, 2011 1:18 PM] Z:\4 Presentations\2011\20111003_BoAML\20110822_BoAML_V1.ppt
Wealth ManagementWe have a strong presence in APAC and in the highest growth markets…..
Cost / income ratio
• Disciplined approach to investment in growth areas
• Benefit from 20% of the CHF 2 billion cost reduction program announced in July 2011 by the end of 2013
• Strong positive operating leverage from strengthening revenue
Net new money growth
• FY11 inflows of CHF 23.5 billion (3.1% NNM growth)
• Our focus is attracting quality invested assets; our strong liquidity position means we do not need to compete aggressively for deposits
• Benefits from a positive capital markets cycle
Gross margin
• Continued progress: FY11 96bps1 up from 92bps in FY10
• Growth drivers: Lombard lending, brokerage, pricing and mandates
• Clients held ~27% of invested assets in cash and cash equivalents at the end of 4Q11
… and should see improvements as client confidence increases7
bp
s %
%
91 92 96
95-105
FY09 FY10 FY11 Target
69.9 68.7
65.1 60-70
FY09 FY10 FY11 Target
1 Adjusted for the gain on the sale of the strategic investment portfolio (CHF 433 million)
1
(10.4)
3.1
(1.5)
3-5
FY09 FY10 FY11 Target

8
schmidgr [printed: ____] [saved: August 24, 2011 1:18 PM] Z:\4 Presentations\2011\20111003_BoAML\20110822_BoAML_V1.ppt
Wealth Management AmericasStrong profit performance for FY11 and …
Cost / income ratio
• Improved cost / income ratio ~90% for FY11 and narrowed the gap with our largest peers
• Retaining high-performing FAs is key; attrition rates remain at all time lows
• Drive advisor productivity through increased training, teaming and platform enhancements
Net new money growth
• Net inflows of CHF 12.1 billion after outflows of CHF 6.1 billion in FY10
• Industry-leading net new money growth rates; NNM including dividends and interest were CHF 30.4 billion in FY11
• Future growth driven by same store advisors
Gross margin
• Gross margin was within our target range of 75-85 basis points
• Continuous pressure from low interest rate environment partially offset by pricing initiatives
• Capturing banking and lending opportunities with clients will support our margins
bp
s %
…we are confident we can deliver USD 1 billion pre-tax profit in the future 8
% 1.8
(1.8) (0.9)
2-4%
FY09 FY10 FY11 Target
99.5 102.3
89.8
FY09 FY10 FY11 Target
80-90
81 80 79
75-85
FY09 FY10 FY11 Target

9
schmidgr [printed: ____] [saved: August 24, 2011 1:18 PM] Z:\4 Presentations\2011\20111003_BoAML\20110822_BoAML_V1.ppt
4.0%3.5% 1-4%
FY09 FY10 FY11 Target
Retail and CorporateLeading retail and corporate business in Switzerland…
Cost / income ratio
• Cost/income ratio of ~52% well within its target range
• Continued tight cost discipline
• Strong revenue generator, providing opportunities and revenues to other business divisions
Net new business volume growth
• Volume growth in client deposits of 6% in 2011
• Seizing growth opportunities in advisory and execution services
• Targeting growth in mature markets by capitalizing on our universal business model
Net interest margin
• Disciplined interest rates on deposits
• Interest on loans: enforcing risk adjusted pricing
• Significant upside potential in a normalized interest rate environment
%
NA
… with resilient underlying performance9
55.9 53.2
51.7
50-60
FY09 FY10 FY11 Target
%b
ps
196.0179.0
171.0
FY09 FY10 FY11 Target
140-180
10
schmidgr [printed: ____] [saved: August 24, 2011 1:18 PM] Z:\4 Presentations\2011\20111003_BoAML\20110822_BoAML_V1.ppt
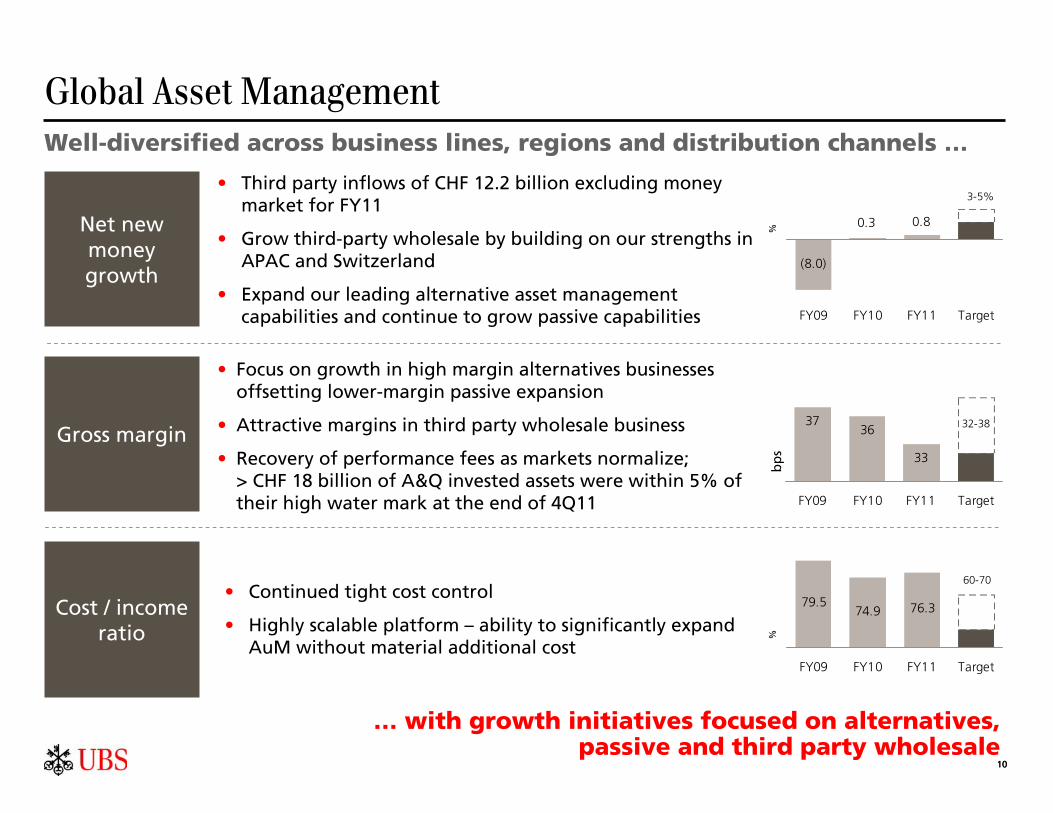
Global Asset ManagementWell-diversified across business lines, regions and distribution channels …
• Continued tight cost control
• Highly scalable platform – ability to significantly expand AuM without material additional cost
• Third party inflows of CHF 12.2 billion excluding money market for FY11
• Grow third-party wholesale by building on our strengths in APAC and Switzerland
• Expand our leading alternative asset management capabilities and continue to grow passive capabilities
• Focus on growth in high margin alternatives businesses offsetting lower-margin passive expansion
• Attractive margins in third party wholesale business
• Recovery of performance fees as markets normalize; > CHF 18 billion of A&Q invested assets were within 5% of their high water mark at the end of 4Q11
10
Cost / income ratio
Gross margin
Net new money growth
bp
s %
%
79.5 74.9 76.3
FY09 FY10 FY11 Target
60-70
3736
33
32-38
FY09 FY10 FY11 Target
(8.0)
0.8 0.3
FY09 FY10 FY11 Target
3-5%
… with growth initiatives focused on alternatives, passive and third party wholesale

11
schmidgr [printed: ____] [saved: August 24, 2011 1:18 PM] Z:\4 Presentations\2011\20111003_BoAML\20110822_BoAML_V1.ppt
<150
~212~220
30.9.11 31.12.11 Target
Investment BankOur efforts are focused on prudent risk reduction
%C
HF
bill
ion
NA
%
11
Pre-tax return on attributed
equity
Risk-weighted
assets reduction (Basel 3)
Cost / income ratio
• Targeting CHF 190 billion RWAs by 31.12.12; good progress in market risk RWA reduction in 4Q11
• Optimize capital allocation while actively reducing risk
• Substantial RWA reduction through business realignment and right-sizing, particularly in FICC
• Balanced business mix will support lower and less volatile cost / income ratios
• Discretionary spending focused on client revenue generating activities
• CHF 1 billion benefit of the CHF 2 billion cost reduction program announced in July 2011 by the end of 2013
• Expected reduction of attributed equity in future from CHF 27.5 billion at 31.12.11 to closer to CHF 20 billion in future
• Attributed equity reflects the size of the business in terms of RWAs, risks, assets and full allocation of goodwill
• Focusing on businesses which are relevant to our clients, maximize our market standing, have attractive growth prospects and together meet our RoE requirements
… as we strive to achieve attractive returns in the future
Basel 3
3.2
10.9
12-17
FY09 FY10 FY11 Target
NA
92.4 90.9
82.4
FY09 FY10 FY11 Target
70-80

12
schmidgr [printed: ____] [saved: August 24, 2011 1:18 PM] Z:\4 Presentations\2011\20111003_BoAML\20110822_BoAML_V1.ppt
12
We remain vigilant on costsWe are managing scarce resources by driving tactical and strategic efficiency initiatives …
… while continuing to invest in key growth areas
Tactical actions Optimization Process industrialization
• CHF 2 billion cost elimination program announced in July 2011
• Embed cost discipline in the culture of the bank
• Pre tax profit targets and cost / income targets rather than revenue as primary bonus relevant KPIs
• Continuously increasing efficiency by reducing unit cost year on year
• These measures should increase adaptability in changing market conditions
Cost savings distributionpro-forma 2013
8%
20%
50% 11%
12%
Investment Bank
Wealth Management
Retail & Corporate
Wealth Management Americas
Global Asset Management
> CHF 1 billion cost savings expected to be achieved in 2012

13
schmidgr [printed: ____] [saved: August 24, 2011 1:18 PM] Z:\4 Presentations\2011\20111003_BoAML\20110822_BoAML_V1.ppt
Our capital, liquidity and funding positions are strong
Liquidity & funding1
• Provisional Basel 3 liquidity coverage ratio2 in line with Basel 3 requirements
• With 23% available liquidity of funded assets among the industry-leading banks
• Sound funding sources: diversified by market, product, tenor and currency
• Customer deposits and long-term debt > 50% of funded balance sheet
Capital position1
• Industry-leading Basel 2.5 tier 1 capital ratio: 15.9%, core tier 1 ratio 14.1%
• 48% increase in tangible book value per share (TBVPS) to CHF 11.68 since 31.12.095 through earnings accretion
• Highest TBVPS CAGR-growth among our peers since 2009 at 17%
Balancesheet1
• Funded balance sheet reduced by 58% to CHF 932 billion from peak3
• Liquidity substantially improved: ~81% decrease in the trading portfolio from peak3 and a relative increase of highly liquid assets4
Capital strength is the foundation for our success
1 On 31.12.112 Estimated on 31.12.113 Refers to 30.6.07 balance sheet (excluding positive replacement values)4 Refers to cash and balances with central banks and financial investments available-for-sale5 For 2009 and earlier, calculation adjusted to include shares related to mandatory convertible notes

14
schmidgr [printed: ____] [saved: August 24, 2011 1:18 PM] Z:\4 Presentations\2011\20111003_BoAML\20110822_BoAML_V1.ppt
30.9.11estimated pro-forma
~21
~2204
~804
Risk-weighted assets—Basel 31
1 Our pro-forma Basel 3 RWA are based on estimates and will be refined as we progress with our implementation of new models and associated systems2 30.9.11 pro-forma RWAs of CHF ~400 billion already factored in the 4Q11 reversal of CHF 17 billion of stress VaR related to the unauthorized trading incident3 SNB StabFund option or underlying assets; assumed constant for future periods (CHF ~20 billion)4 Final composition of the legacy portfolio as of 30.9.11. Original 30.9.11 disclosure was CHF ~70 billion in Legacy and ~CHF 230 billion in Core Investment Bank5 Target assumes constant FX rates
31.12.16target5
We have reduced RWAs swiftly and we are ahead of our plan
~270
31.12.12target5
~340
~190
~45
31.12.13target5
~290
<150
~30
31.12.11estimated pro-forma
~380~20
~212
~62
We will continue our disciplined approach to RWA reduction
Legacy: CHF ~18 billion reduction• CHF 11 billion of reduction driven by restructuring of a
student loan auction rate securities portfolio
SNB StabFund3
<150
Group
Core Investment Bank: CHF ~8 billion reduction• Significant decrease in market risk RWAs partly offset
by higher estimated Basel 3 CVA charge following downgrades of major counterparties in 4Q11
• CHF (145) billion net reduction of IB RWAs
• CHF 15 billion RWA growth in other businesses
~4002
14

15
schmidgr [printed: ____] [saved: August 24, 2011 1:18 PM] Z:\4 Presentations\2011\20111003_BoAML\20110822_BoAML_V1.ppt
1.3%0.7%
1.7%
1.7%
6.0%
2.9%3.0%
3.2%
3.6%
1.1% 1.1%
1.1%
0.7%
10.1% 10.8%
14.2%
18.7%
6.2% 6.7%
9.7%
14.0%
19%
30.9.11 31.12.11 31.12.12 31.12.13 30.9.11 31.12.11 31.12.12 31.12.13 Target
capital ratios
25.3
We are targeting a common equity tier 1 ratio of 13%
CET1 capital
RWAs
(CHF billion)
Basel 3phased-in scenario1,2
Basel 32019 rules fully applied1
1 Our pro-forma Basel 3 RWA and CET1 capital are based on estimates as presented at the Investor Day 2011 and will be refined as we progress with our implementation of new models and associated systems
2 Deferred tax assets on net operating losses of CHF 8.0 billion on 31.12.11: net decrease due to amortization of CHF 0.5 billion in 2012 and 2013. Deferred pension expenses of CHF 3.3 billion on 31.12.11 (current accounting rules applied). Other deduction items not taken into account. Deduction for exposures in financial industry excluded as rules need further clarification
3 Goodwill and intangible assets will be deducted from CET1 capital under Basel 3. In the transition period, there will be a phase-in during which they will be deductedfrom tier 1 capital and not from CET1 capital up to the amount of outstanding phased-in hybrid tier 1 capital
4 UBS is eligible for a capital rebate on a portion of the capital requirement subject to measures taken to improve resolvability
Loss-absorbing capital
Goodwill / intangible assets31
Capital deduction items2
We intend to issue loss-absorbing capital on a global basis
+0.7
(~20)
40.4
~400
1
2
41.0
~380
+0.6
24.6
~400 ~380
(~20)
13%
Target loss-absorbing
capital
Target common
equity capital
Common equity
4
Target capital structure
10.1% 10.8% 13.5% 16.9% 6.2% 6.7% 9.0% 12.2% 13.0%
CET1 ratio
30.5 35.5 ~3549.145.8
~340 ~290 ~270~290~340
15

16
schmidgr [printed: ____] [saved: August 24, 2011 1:18 PM] Z:\4 Presentations\2011\20111003_BoAML\20110822_BoAML_V1.ppt
We are confident about our future
Long term franchise value with Group return on equity of 12-17%
Our actions should enhance our ability to delivera progressive capital return policy
16
Our actions Upside potential
Continue to strengthen our leading capital position and sound liquidity and funding
On track for the CHF 340 billion RWA target by end 2012
Achievement of phased-in Basel 3 CET1 of 13% targeted by the end of 2012
Cost savings of CHF 2 billion in progress
- > CHF 1 billion to be achieved by end 2012
Dividend of CHF 0.10 proposed - Progressive returns program to
be implemented as we successfully execute on our strategy
Our business
Unrivalled wealth management franchise
- Well positioned in largest and fastest growth markets
- CHF 1.5 trillion AuM; CHF 2.9 billion pre-tax profit1
Leading retail and corporate business
- Inherently stable business with strong earnings generation
- Pre-tax profit of CHF 1.9 billion
Focused Investment Bank - Top 3 position in equities and FX- Thought leadership by global
advisory coverage teams
Well-diversified asset management business
- Successful alternatives platform- Consistently profitable, low
capital intensity business
• 27% of WM clients AuM in cash earning very low margins
• USD 28 billion of money market funds in WMA waiving > USD 100 million p.a.
• Significant upside potential in WM, WMA and R&C from increased market rates
• > CHF 18 billion of Global AM A&Q funds within 5% of high water marks
• Cost industrialization process initiated
- material savings expected from multi-year program
• Strongly geared towards a more positive capital markets cycle in the medium and long term
1 Excluding restructuring charges and the gain on the sale of the strategic investment portfolio

17
schmidgr [printed: ____] [saved: August 24, 2011 1:18 PM] Z:\4 Presentations\2011\20111003_BoAML\20110822_BoAML_V1.ppt
17
Key messagesKey messages
Capital strength is the foundation of our success and we are targeting a common equity tier 1 ratio of 13% under Basel 3
We remain vigilant on costs as we strive to improve returns to our shareholders
We are on track to achieve the targeted Basel 3 risk-weighted assets of no more than CHF 150 billion in our core Investment Bank
Our strategy is centered on our pre-eminent wealth management businesses and our universal bank in Switzerland. It builds on the strengths of all of our businesses, supported by our industry-leading capital position
We continue to grow our wealth management businesses and see strength in key geographies and products across the Group
We have every reason to be confident in our future