Morgan Stanley Asia Pacific Summit - CommBank · Morgan Stanley Asia Pacific Summit Stuart Grimshaw...
46
Morgan Stanley Asia Pacific Summit Stuart Grimshaw Group Executive, Financial & Risk Management Commonwealth Bank of Australia 23 October 2002
Transcript of Morgan Stanley Asia Pacific Summit - CommBank · Morgan Stanley Asia Pacific Summit Stuart Grimshaw...
Morgan Stanley Asia Pacific Summit
Stuart Grimshaw
Group Executive, Financial & Risk Management
Commonwealth Bank of Australia
23 October 2002

The material that follows is a presentation of general
background information about the Bank‟s activities
current at the date of the presentation, 23 October
2002. It is information given in summary form and
does not purport to be complete. It is not intended to
be relied upon as advice to investors or potential
investors and does not take into account the
investment objectives, financial situation or needs of
any particular investor. These should be considered,
with or without professional advice when deciding if
an investment is appropriate.
Disclaimer

Speaker’s Notes
Speaker‟s notes for this presentation are
attached below each slide.
To access them, you may need to save
the slides in PowerPoint and view/print
in “notes view.”

Agenda
The Australian Economy
Why Invest in Commonwealth Bank?
How is Commonwealth Bank Positioned Against the
Current Outlook?

The Australian Economy
Performance & Outlook
Interest Rates & Credit Outlook
Housing Market

Australia’s Economy has been Resilient
%%
%
Source: Commonwealth Research
V A L U E O F R E T A I LT R A D E
0
5
1 0
1 5
J u l -9 5 J u l -9 7 J u l -9 9 J u l -0 1
0
5
1 0
1 5
% p a% p a
R E L A T IV E G D P G R O W T H
(a n n u a l % c h a n g e )
-3
0
3
6
9
S e p - 8 7 S e p - 9 0 S e p - 9 3 S e p - 9 6 S e p - 9 9 S e p - 0 2
%
U S
A u s t ra l ia
G D P
(a n n u a l % ch a n g e )
-2
0
2
4
6
S e p -8 8 S e p -9 1 S e p -9 4 S e p -9 7 S e p -0 0
%
L o n g -ru n
a ve ra g e
P R O F I T S( % o f G D P )
8
1 2
1 6
2 0
S e p -9 0 S e p -9 3 S e p -9 6 S e p -9 9 S e p -0 2
C o rp o ra te
p ro fi ts *
(p r i v n o n - fa rm )
S m a l l b u s in e s s
in c o m e * * % G D P ( fc )
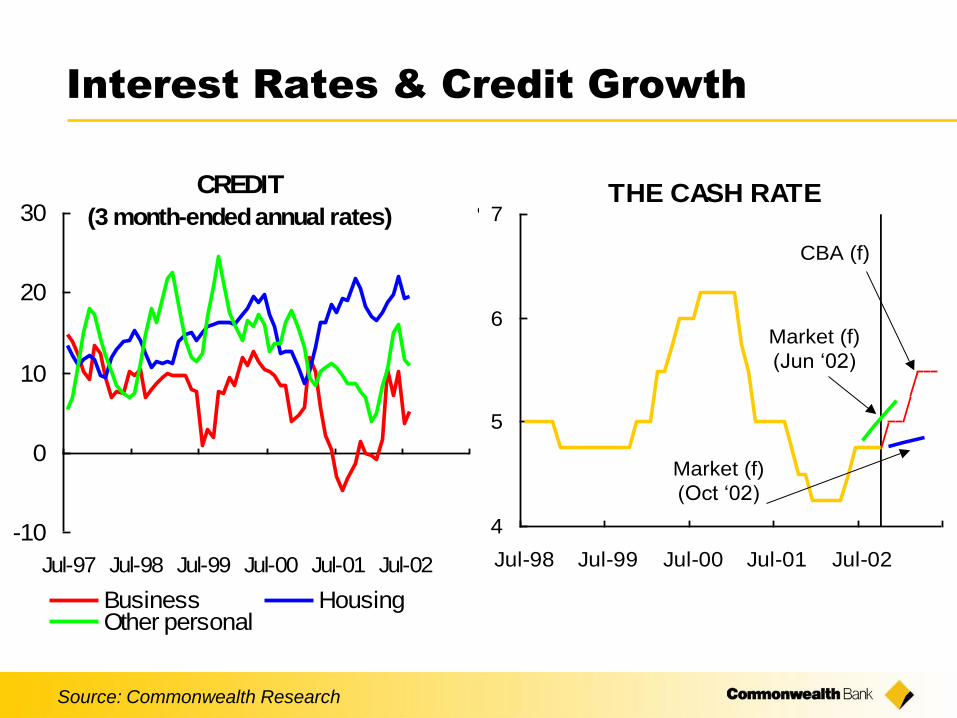
Interest Rates & Credit Growth
Source: Commonwealth Research
CREDIT
(3 month-ended annual rates)
-10
0
10
20
30
Jul-97 Jul-98 Jul-99 Jul-00 Jul-01 Jul-02
Business HousingOther personal
%THE CASH RATE
4
5
6
7
Jul-98 Jul-99 Jul-00 Jul-01 Jul-02
CBA (f)
Market (f)
(Jun „02)
Market (f)
(Oct „02)

Housing Market
Source: Commonwealth Research
%Index
*CBA Est. House Price Index
EQUITIES AND HOUSE PRICES
(RELATIVE PERFORMANCE)HOUSING LOAN
APPROVALS
Compound Annual Growth Rate: 1986-2002 2000-2002
All Ordinaries Index: 6.2% -3.5%
House Prices: 10.1% 20.5%
0
2
4
6
Jul-86 Jul-89 Jul-92 Jul-95 Jul-98 Jul-01
0
15
30
45
$bn '000
Owner-occupied
(ex refinance)
(rhs)
Investor
(lhs)
50
100
150
200
250
Sep-86 Sep-90 Sep-94 Sep-98 Sep-02
4
6
8
10
12
14
16
18
Mortgage rate (rhs)
All Ords (lhs)
House Prices* (lhs)

Housing Market
Source: Commonwealth Research
$‟0
00 %
pa
%pa
Source: Residex
*assumes principal repayment ratio fixed at 1997/98 level
5
10
15
20
<30 31-50 51-70 71-100 >1005
10
15
20
% %
Income ($'000pa)
DEBT REPAYMENT LEVELS(% of h/hold income, Mar'02)
H O U S E P R I C E S
0
1 0 0
2 0 0
3 0 0
4 0 0
M a r - 6 0 M a r - 6 8 M a r - 7 6 M a r - 8 4 M a r - 9 2 M a r - 0 0
- 2 0
0
2 0
4 0
6 0
R e a l
g r o w t h
( r h s )
L e v e l
( lh s )
S Y D N E Y H O U S E P R I C E S( d e f la t e d b y t h e C P I)
- 4 0
- 2 0
0
2 0
4 0
6 0
1 9 0 0 1 9 1 2 1 9 2 4 1 9 3 6 1 9 4 8 1 9 6 0 1 9 7 2 1 9 8 4 1 9 9 6
Q I- Q III 2 0 0 2
a t a n n u a l r a te
9 0 th
p e r c e n t ile
P R IN C IP A L R E P A Y M E N T S
0
10
2 0
3 0
S e p - 9 7 S e p - 9 9 S e p - 0 1
0
4
8
1 2
C u m u la t iv e
o v e r p a y m e n t
o f p r in c ip a l*
( r h s )
Pr in c ip a l
( % o f m o tg a g e
p a y m e n t)
( lh s )

Why invest in Commonwealth Bank?
Our Track Record
Our Differentiators and Growth Drivers

Recent Result Highlights
Solid Earnings Growth
Reported Profit up 10.7% to $2,655m
Cash Profit up 10.6% to $2,501m
Cash EPS up 10.1% to $1.97
Costs steady year on year
Improved productivity and cost to income ratio
High dividend payout ratio relative to peers
Capital position remains strong
Credit Quality and Provisioning remains strong

Net Profit*
* Net Profit after tax and outside equity interest - cash basis.
Excludes appraisal value uplift and goodwill amortisation.
1,109 1,153 1,1921,309
Full Year = 2,262 Full Year = 2,501
875 918 9751092
156164
12197
7871 96
120
0
200
400
600
800
1,000
1,200
1,400
Dec 2000 Jun 2001 Dec 2001 Jun-02
Banking Life & Super Funds M anagement

ROE and EPS
Dec 00 Jun 01 Dec 01 Jun 02
9488
91
103
12.46%13.10% 13.14%
14.61%
0
10
20
30
40
50
60
70
80
90
100
110
EPS
0%
5%
10%
15%
20%
25%
ROE
Earnings per share - cash bas is ROE - cash bas is

Dividend Growth
20 2024
36 3845 46 49
58 6168
20 22
36
4652
57 58
66
75
82
72
0
25
50
75
100
125
150
1992 1993 1994 1995 1996 1997 1998 1999 2000 2001 2002
Cen
ts
0
10
20
30
40
50
60
70
80
90
100
%
First Half Second Half Payout Ratio

Asset Quality Overview
First Half Second Half
Charge for Bad & Doubtful Debts (6 months) $290m $159m
Charge for Bad & Doubtful Debts to RWA(annualised)
0.42% 0.23%
Impaired Assets (net of interest reserved) $983m $884m
Specific Provisions $309m $270m
General Provision $1,334m $1,356m
General Provision to RWA 0.96% 0.96%

Segmentation: Aligned Domestic
Structure with Customer Needs
Retail BankingServices
PremiumFinancialServices
Investment &InsuranceServices
Institutional &BusinessServices
CustomerGroup
Personalbankingcustomers,Small businessbankingcustomers
Premium clientsincludingprofessionalsand business
Agents, Brokers,Financial Advisers
Institutional,Corporate,Commercialbusinesscustomers
Channels Branch, Ezy-Banking, ATM,EFTPOS,Phone, On-line,Mortgagebrokers
Relationshipmanagers,Premiuminvestmentcentres, phone,on-line.
Agents, Branches,Brokers, FinancialAdvisers, Premiuminvestment centres,DirectDealerships,Institutional Clients
Relationshipmanagers,Business centres
Support Finance, Risk Management, Human Resources, Strategy, Technology, Legal, Secretariat

Jun 2001 Dec 2001 Jun 2002
Home Loans^ 20.4% 20.1% 20.1%
(Residentially Secured)
Credit Cards 21.4% 21.4% 21.6%
Retail Deposits^ 24.0% 24.1% 24.2%
Retail FUM (Plan for Life) 16.1% 16.1% 15.7%
Superannuation/Annuities 16.3% 16.4% 16.4%
Retail Broking 9.0% 8.5% 9.2%
Inforce Premiums 14.4% 14.5% 14.4%
^ Due to delays in implementing new APRA reporting methodology,
no market share data has been available since March 2002.
Australian Market Share
Scale : Strong Market Share Positioning
Rank
1
1
1
1
1
2
2
*
*
* March 2002 data
*
*

Australia’s Most Accessible Bank
Over 146m DirectBanking calls
Almost 2m registered NetBank users
Around 126,000 EFTPOS terminals
Over 10,000 third party advisers,
brokers and agents
Around 4,000 ATMs
Nearly 4,000 postal and private
agencies
Over 1,000 branches
Over 700 EzyBanking store locations
Around 700 personal lenders
Over 700 financial planners
Around 200 mobile bankers
Over 70 business banking centres
13 premium banking centres
Customer
ChoiceBusiness
Banking
Financial
Planners

Brand: We Have More Relationships
Than Any Other Financial Institution
Source: Research International, April 2002
Popularity of Australian Financial Institutions….
* Customers under 25 years of age
^ Excludes Youth customers
39 40
21
14
27
22
42
53
0
10
20
30
40
50
60
Overall Youth* Premium Retail^
%
NAB Group ANZ Group CBA Group Westpac Group St George Group

Brand: We Achieve Consistently High
Ratings from Retail Customers
Source: Research International Brand Monitor
Average across all brand attributes for CBA
Vs average of ANZ, NAB and Westpac%
• In touch with its
customers
• Is leading the way
• Is doing new and
different things
• Has knowledgable
and competent staff
• Has friendly and
reliable staff
0
5
1 0
1 5
2 0
2 5
3 0
3 5
4 0
J a n
'0 1
M a r M a y J u l S e p N o v J a n
'0 2
M a r M a y J u l
C B A O t h e r M a jo r B a n k s
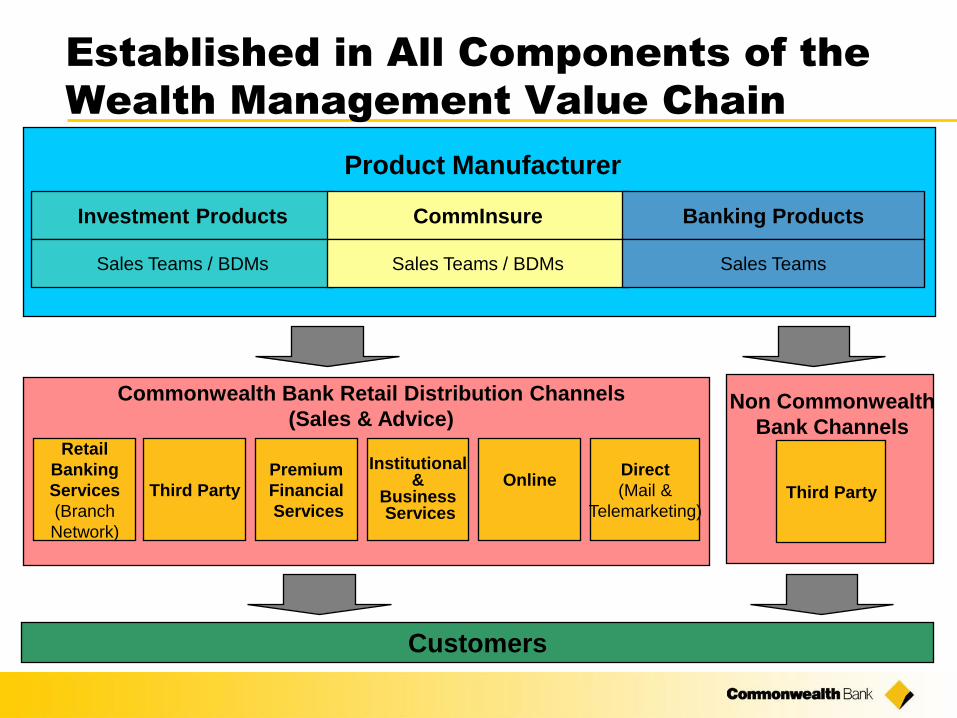
Established in All Components of the
Wealth Management Value Chain
Investment Products
Sales Teams / BDMs
CommInsure
Sales Teams / BDMs
Retail
Banking
Services
(Branch
Network)
Third Party
Premium
Financial
Services
Institutional&
BusinessServices
OnlineDirect
(Mail &
Telemarketing)
Customers
Commonwealth Bank Retail Distribution Channels
(Sales & Advice)
Product Manufacturer
Banking Products
Sales Teams
Third Party
Non Commonwealth
Bank Channels

0%
5%
10%
15%
20%
25%
7.30
7.45
7.60
7.75
7.90
8.05
8.20
8.35
0%
20%
40%
60%
80%
100%
34%
36%
38%
40%
42%
44%
Brand - Colonial First State
AMP
AMP
AMP
BTColonial
or
Colonial
First
State
Colonial
First
State
AXA
Colonial
First
State
ING
Consumer Brand Awareness - Unaided
3
Consumer Brand Awareness - Total
Consumer Purchase Intention
2
2
Adviser Brand Awareness - Overall
Opinion of Organisation
Platinum
1
Perpetual
Source: Consumer Charts - Newspoll June 2002; Adviser Chart - ASSIRT Service Level Survey 2002
Colonial
First
State

Funds Under Management
$103bn
29 28
2731 33 33
1723
24 26 25
2722
181921
0
20
40
60
80
100
120
Dec 2000 Jun 2001 Dec 2001 Jun 2002
$bill
ions
Australian Retail Funds Australian Wholesale Funds
International Funds Internal Life Assets
Average FUM

Innovation through
FirstChoice Masterfund Product
You and your
Financial
Adviser
Colonial First
State FirstChoice
Your financial
future
Structure
Value
Simplicity
Service
Investments PensionEmployer
Super
Personal
Super

Premium and Business Opportunity
Business (Middle Market)
Premium Customers
Source : Commonwealth Bank illustration
Current market share
Natural market share
Current number of premium customers
Potential number of premium customers

Premium: A Differentiated Business
Model
Banking
Platform
Broking
Platform
Borrowing Services
Lending Services
Transactional Banking
Advisory Services
Direct Investment
Indirect Investment
Debt Products
Equity Products
Personal
Banker
Commercial
Banker
Investment/
Equities
Expert
Event Based
Adviser
Insurance
Expert
Client
Primary Relationship ManagerSecondary Relationship Manager & specialised advice

Business: Increasing Cross-sell
Corporate Segment Example Bundled Products Example
26%
Working
Capital
Services
26% of corporate clients use
products from all three areas
Financial
Markets
Corporate
Finance
Business Banking
Financial
Markets
Working
Capital
Services
Interest rate risk
management
FX products
Investments
Bill financing
Cash funded loans
Overdrafts
Transaction services

Productivity: Focus on Efficiency
Remove all remaining back-office
functions from branches
Streamline home loan processes
Streamline Business Banking
processes
Rationalise investment products
& systems
Organisational design
...to achieve:
• A better service
experience for
customers, through
greatly improved
turnaround times
• Elimination of
duplication and
inefficiencies
• Annual benefits from
FY 2004, following an
incremental net cost
of ~$120m in FY2003
Five productivity initiatives...
How is Commonwealth Bank Positioned
Against the Current Outlook?
Credit Quality
Capital Position
Investment Market Volatility
Productivity Focus

Commonwealth Bank Group:
Low Credit Risk Profile
Housing Loans
53% of total loan book*
Loan loss rate of < 3bps in 17 of last 20 years
55% average loan to valuation ratio
Extensive stress testing of loan portfolio undertaken
Asset Quality
Impaired assets to risk weighted assets of less than 1%
in line with domestic peers
Relatively low bad debt expense
Well provisioned
* Excluding securitisation (or 57% including securitisation)

Total Individually Rated* Exposures
Credit Risk
61%
Investment
Grade
* Corporate and business lending
0%
20%
40%
60%
80%
100%
Dec 2000 Jun 2001 Dec 2001 Jun 2002
Other BBB A AAA/AA

Offshore* Loans & Advances by Industry
Other
Commercial
Government Agriculture
Finance
Construction
Personal
Leasing
* Excludes New Zealand (ASB )

Aggregate Provisions
* Includes Colonial
$m
illio
ns
0
200
400
600
800
1,000
1,200
1,400
1,600
1,800
2,000
Jun
94
Jun
95
Jun
96
Jun
97
Jun
98
Jun
99
Jun
00*
Jun
01*
Jun
02
0
50
100
150
200
250
300
%
General Provision
Specific Prov ision
Total Provisions/Gross Impaired Assets (axis on right)

Jun-01 Jun-02 APRA
Requirement
1,399
+449 -495
+3
1,356
1007
Surplus 349
(ie 35% above
the APRA
requirement)
500
700
1500
1700
1900
2100
900
1100
1300
$mCharged
to P&L
Used for
Specific
Provisions
Other
General Provision

0
500
1000
1500
2000
2500
Jun
1994
Jun
1995
Jun
1996
Jun
1997
Jun
1998
Jun
1999
Jun
2000
Jun
2001
Jun
2002
0
6
12
18
24
30
36
%
Commowealth Bank Group (Other Countries)*
Commonwealth Bank Group (Australia)*
Net Impaired assets as % of Total Shareholder Equity* (axis on right)
Net Impaired Assets
* Excluding Colonial prior to 30 June 2000
Asian Crisis
Acquisition
of Colonial
Two
Accounts
%

Non-Accrual Loans by Size
$5m<$10m $50m<$100m
$20m<$50m$10m<$20m
>=$100m<$5m
1
Customer
2
Customers4
Customers4
Customers
12
Customers
As at 30 June 2002

Non Accruals by Industry
Mining
Manufacturing
Agriculture
Property &
Business ServicesFinance
Transport
Government
Other
As at 30 June 2002
Accommodation,
Cafes & Restaurants

Balances $m % Portfolio % Troublesome % Impaired
Industry Exposures
Exposure to selected industries
$b $b $b
$b $b
$b
Insurance
-
0.8
1.6
2.4
3.2
Jun-00 Jun-01 Jun-02
0%
1%
2%
3%
Services to Agriculture, Forestry,
Fishing & Mining
-0.20.40.60.81.0
Jun-00 Jun-01 Jun-02
0%
2%
4%
6%
8%
Agriculture
-
1.0
2.0
3.0
4.0
5.0
Jun-00 Jun-01 Jun-02
0%
2%
4%
6%
Transport and Storage
-
2.0
4.0
6.0
Jun-00 Jun-01 Jun-02
0%
2%
4%
6%
Metal Mining & Manufacturing
-
1.0
2.0
3.0
Jun-00 Jun-01 Jun-02
0%
5%
10%
15%
Accommodation, Cafes and
Restaurants
-
0.5
1.0
1.5
2.0
2.5
3.0
Jun-00 Jun-01 Jun-02
0%
5%
10%

Strong Capital Position
2H01 1H02 2H02 2H01 1H02 2H02
TotalTier 1
CBA Target Range
Strong credit ratings
Shareholders equity
up $637m
Strong regulatory
capital ratios
Payments to
shareholders of $1,622m0.00%
4.00%
8.00%
12.00%
Tier 1 Capital Total Capital

Economic Equity
Regulatory capital ratios can be misleading:
Risk weights are not risk aligned
Capital required for residential mortgages is overstated
No operational risk charge
No value placed on earnings and risk diversification
Internal models show the Group is strongly capitalised
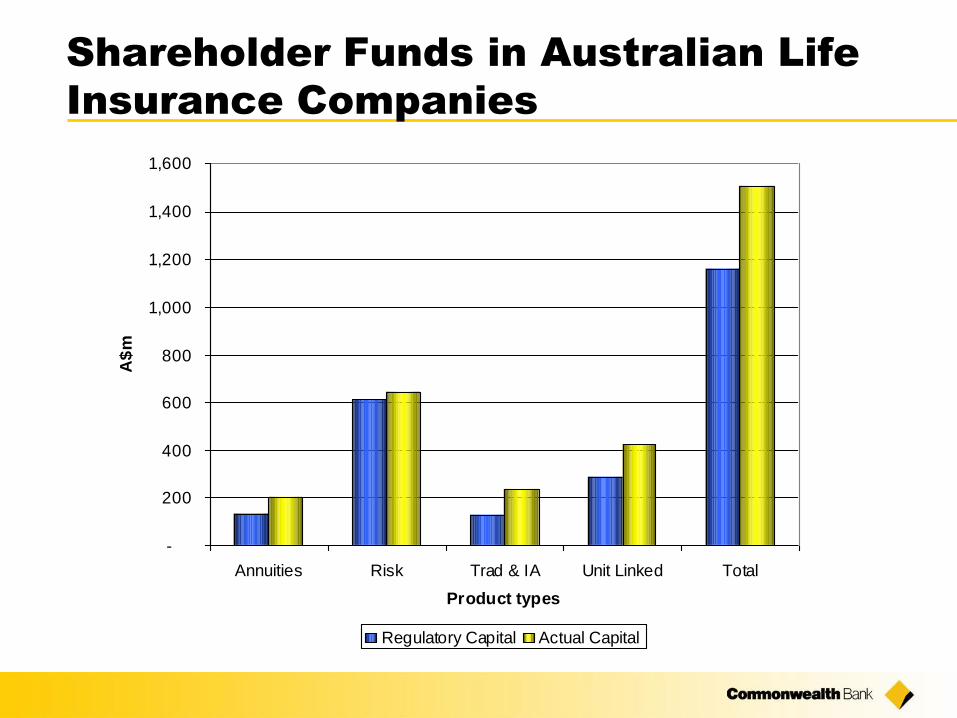
Shareholder Funds in Australian Life
Insurance Companies
-
200
400
600
800
1,000
1,200
1,400
1,600
Annuities Risk Trad & IA Unit Linked Total
Product types
A$
m
Regulatory Capital Actual Capital

Australian life companies: Future capital
requirements can be met by profit growth
-120
-70
-20
30
80
2003 2004 2005 2006 2007
Years
Ca
pit
al R
ele
as
ed
(A
$m
)
AnnuitiesRiskTrad & IAUnit Linked

Risk* GroupUnit Linked
Shareholder Funds in Life Insurance Companies
Income
$0.5 billion$2.1 billion
53%47%
Growth
$2.6 billion
67% 33% 50% 50%
*Risk includes traditional, investment account, annuities, personal risk and group risk.

Greater Cost Control & Targeted
Investment in Priority Areas
Upgrading infrastructure to
improve service
Developing and managing
relationships with all customers
Product simplification &
rationalisation; packaging
products for premium customers,
and manufacture innovative new
products
%
Focus on achieving further
productivity improvements...
...by reducing costs and spending
to improve service quality and
drive revenue growth
53
54
55
56
57
58
59
60
31-D
ec-0
0
30-J
un-0
1
31-D
ec-0
1
30-J
un-0
2
Group Cost to Income Ratio (Normalised)
Summary
The Australian Economy
Has been resilient
Outlook remains positive in global context
Why Invest in Commonwealth Bank?
Our track record
Our differentiators
Our growth drivers
How is Commonwealth Bank Positioned Against
the Current Outlook?
Low credit risk profile
Strong capital position
Productivity focus

Morgan Stanley Asia Pacific Summit
Stuart Grimshaw
Group Executive, Financial & Risk Management
Commonwealth Bank of Australia
23 October 2002