Pengaruh Model Pembelajaran Take and Give terhadap Hasil ...
more give, less take
2
Key points
•
The NAB Rural Commodities Index, which covers 28 agricultural commodities, gained 2.1% (AUD) and 0.5% (USD) in February on the back of higher fruit, dairy, fibre and pulses prices, which offset mixed performance across grains and protein.
•
We have made minor adjustments to our 2014-15 price forecasts this month. Wheat prices have been revised down on ongoing ample supply, while beef, lamb and dairy have been moderately revised upwards. We continue
to expect a falling AUD to provide a partial offset to falling international grain prices.
•
Rainfall was below average in many parts of Australia in February, although the Bureau of Meteorology's latest medium term forecast shows a return to more neutral conditions in the coming three months, with average
rainfall forecast across much of the east coast and above average rainfall forecast in South Australia and Western Australia. If the forecast rainfall eventuates,
many areas could enjoy a decent autumn break.
NAB Rural Commodities Index 3
Production and Price Outlook 3
Climatic Conditions 4
Economic Update 5
Exchange Rates 6
Farm Input Prices and Feed Grain Prices 7
Crops 8
Protein 9
Fruit and Vegetables 10
Dairy 10
Fibres 11
Industrial Crops 11
Contents
Front page: Grain augers at the Wimmera Field Days, March 2015. Photo: Phin
Ziebell
Photo: Phin
Ziebell
3
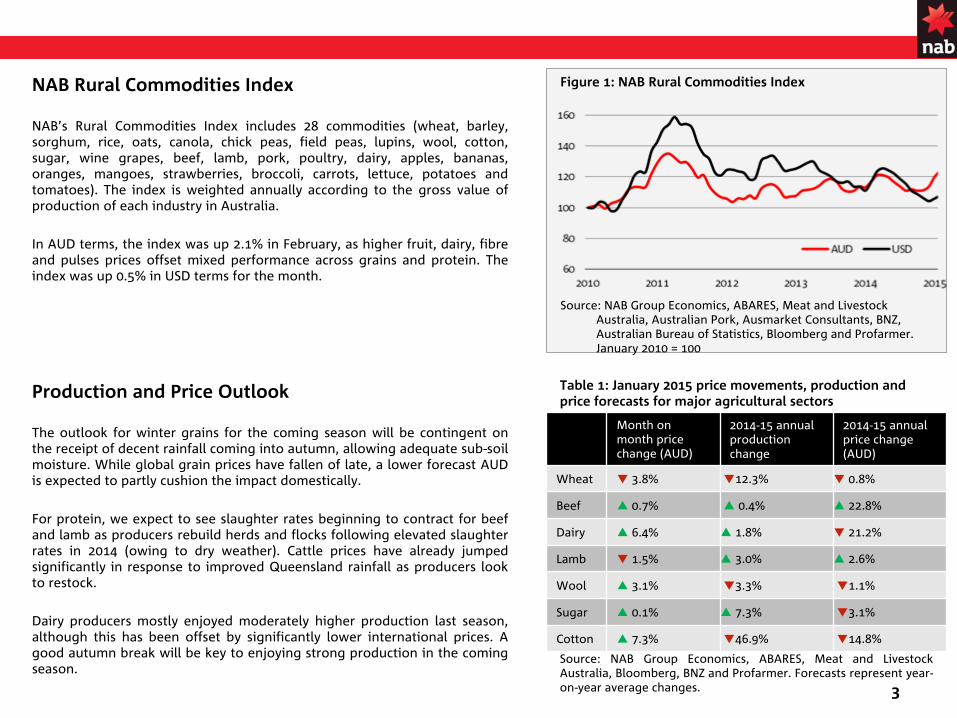
Figure 1: NAB Rural Commodities Index
Source: NAB Group Economics, ABARES, Meat and Livestock Australia, Australian Pork, Ausmarket
Consultants, BNZ, Australian Bureau of Statistics, Bloomberg and Profarmer. January 2010 = 100
NAB Rural Commodities Index
NAB’s
Rural Commodities Index includes 28 commodities (wheat, barley,
sorghum, rice, oats, canola, chick peas, field peas, lupins, wool, cotton, sugar, wine grapes, beef, lamb, pork, poultry, dairy, apples, bananas, oranges, mangoes, strawberries, broccoli, carrots, lettuce, potatoes and
tomatoes). The index is weighted annually according to the gross
value of production of each industry in Australia.
In AUD terms, the index was up 2.1% in February, as higher fruit, dairy, fibre and pulses prices offset mixed performance across grains and protein. The index was up 0.5% in USD terms for the month.
Production and Price Outlook
The outlook for winter grains for the coming season will be contingent on the receipt of decent rainfall coming into autumn, allowing adequate sub-soil moisture. While global grain prices have fallen of late, a lower
forecast AUD is expected to partly cushion the impact domestically.
For protein, we expect to see slaughter rates beginning to contract for beef and lamb as producers rebuild herds and flocks following elevated slaughter rates in 2014 (owing to dry weather). Cattle prices have already
jumped significantly in response to improved Queensland rainfall as producers look to restock.
Dairy producers mostly enjoyed moderately higher production last
season, although this has been offset by significantly lower international prices. A good autumn break will be key to enjoying strong production in the coming season.
Table 1: January 2015 price movements, production and price forecasts for major agricultural sectors
Source: NAB Group Economics, ABARES, Meat and Livestock Australia, Bloomberg, BNZ and Profarmer. Forecasts represent year-
on-year average changes.
Month on month price change (AUD)
2014-15 annual production change
2014-15 annual price change (AUD)
Wheat ▼ 3.8% ▼12.3% ▼ 0.8%
Beef ▲ 0.7% ▲ 0.4% ▲ 22.8%
Dairy ▲ 6.4% ▲ 1.8% ▼ 21.2%
Lamb ▼ 1.5% ▲ 3.0% ▲ 2.6%
Wool ▲ 3.1% ▼3.3% ▼1.1%
Sugar ▲ 0.1% ▲ 7.3% ▼3.1%
Cotton ▲ 7.3% ▼46.9% ▼14.8%
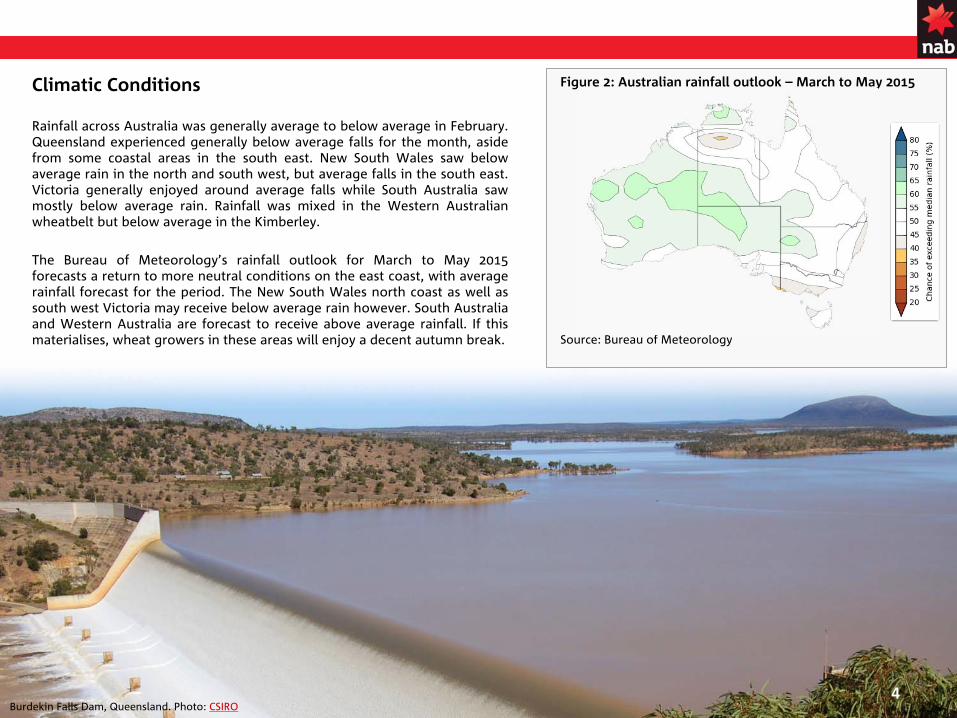
Figure 2: Australian rainfall outlook –
March to May 2015
Source: Bureau of Meteorology
4
Climatic Conditions
Rainfall across Australia was generally average to below average
in February. Queensland experienced generally below average falls for the month, aside from some coastal areas in the south east. New South Wales saw below average rain in the north and south west, but average falls in the south east. Victoria generally enjoyed around average falls while South Australia saw mostly below average rain. Rainfall was mixed in the Western Australian wheatbelt but below average in the Kimberley.
The Bureau of Meteorology’s rainfall outlook for March to May 2015
forecasts a return to more neutral conditions on the east coast,
with average rainfall forecast for the period. The New South Wales north coast as well as south west Victoria may receive below average rain however. South Australia and Western Australia are forecast to receive above average rainfall. If this materialises, wheat growers in these areas will enjoy a decent autumn break.
Burdekin Falls Dam, Queensland. Photo: CSIRO
5
Table 2: NAB Global Economic Forecasts
Source: NAB Group Economics
Table 3: NAB Australian Economic Forecast
Source: NAB Group Economics
Table 4: NAB Interest Rate Forecast (end of quarter)
Source: NAB
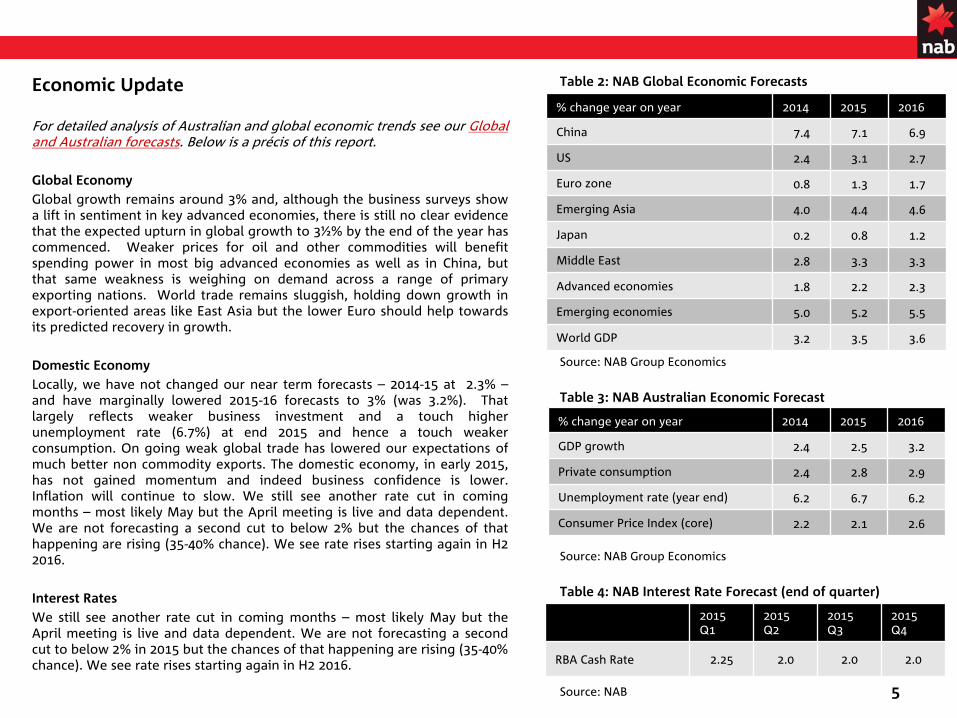
Economic Update
For detailed analysis of Australian and global economic trends see our Global and Australian forecasts. Below is a précis of this report.
Global EconomyGlobal growth remains around 3% and, although the business surveys show a lift in sentiment in key advanced economies, there is still no
clear evidence that the expected upturn in global growth to 3½% by the end of the year has commenced. Weaker prices for oil and other commodities will benefit spending power in most big advanced economies as well as in China, but that same weakness is weighing on demand across a range of primary
exporting nations. World trade remains sluggish, holding down growth in export-oriented areas like East Asia but the lower Euro should help towards its predicted recovery in growth.
Domestic EconomyLocally, we have not changed our near term forecasts –
2014-15 at 2.3% –
and have marginally lowered 2015-16 forecasts to 3% (was 3.2%). That largely reflects weaker business investment and a touch higher unemployment rate (6.7%) at end 2015 and hence a touch weaker consumption. On going weak global trade has lowered our expectations of much better non commodity exports. The domestic economy, in early 2015, has not gained momentum and indeed business confidence is lower.
Inflation will continue to slow. We still see another rate cut in coming
months –
most likely May but the April meeting is live and data dependent. We are not forecasting a second cut to below 2% but the chances of that happening are rising (35-40% chance). We see rate rises starting again in H2 2016.
Interest RatesWe still see another rate cut in coming months –
most likely May but the April meeting is live and data dependent. We are not forecasting
a second cut to below 2% in 2015 but the chances of that happening are rising (35-40% chance). We see rate rises starting again in H2 2016.
% change year on year 2014 2015 2016
GDP growth 2.4 2.5 3.2
Private consumption 2.4 2.8 2.9
Unemployment rate (year end) 6.2 6.7 6.2
Consumer Price Index (core) 2.2 2.1 2.6
% change year on year 2014 2015 2016
China 7.4 7.1 6.9
US 2.4 3.1 2.7
Euro zone 0.8 1.3 1.7
Emerging Asia 4.0 4.4 4.6
Japan 0.2 0.8 1.2
Middle East 2.8 3.3 3.3
Advanced economies 1.8 2.2 2.3
Emerging economies 5.0 5.2 5.5
World GDP 3.2 3.5 3.6
2015 Q1
2015 Q2
2015 Q3
2015 Q4
RBA Cash Rate 2.25 2.0 2.0 2.0
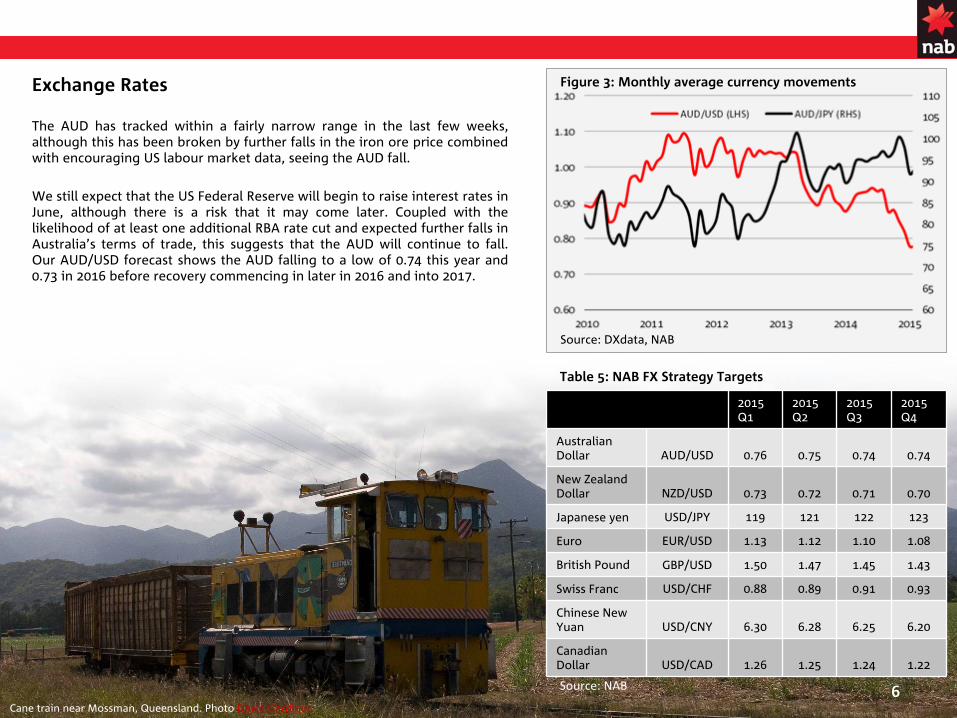
Table 5: NAB FX Strategy Targets
Source: NAB 6
Figure 3: Monthly average currency movements
Source: DXdata, NAB
2015 Q1
2015
Q22015
Q32015
Q4
Australian Dollar AUD/USD 0.76 0.75 0.74 0.74
New Zealand Dollar NZD/USD 0.73 0.72 0.71 0.70
Japanese yen USD/JPY 119 121 122 123
Euro EUR/USD 1.13 1.12 1.10 1.08
British Pound GBP/USD 1.50 1.47 1.45 1.43
Swiss Franc USD/CHF 0.88 0.89 0.91 0.93
Chinese New Yuan USD/CNY 6.30 6.28 6.25 6.20
Canadian Dollar USD/CAD 1.26 1.25 1.24 1.22
Exchange Rates
The AUD has tracked within a fairly narrow range in the last few
weeks, although this has been broken by further falls in the iron ore price combined with encouraging US labour market data, seeing the AUD fall.
We still expect that the US Federal Reserve will begin to raise interest rates in June, although there is a risk that it may come later. Coupled with the likelihood of at least one additional RBA rate cut and expected further falls in Australia’s terms of trade, this suggests that the AUD will continue to fall. Our AUD/USD forecast shows the AUD falling to a low of 0.74 this
year and 0.73 in 2016 before recovery commencing in later in 2016 and into 2017.
Cane train near Mossman, Queensland. Photo David Gardiner
7
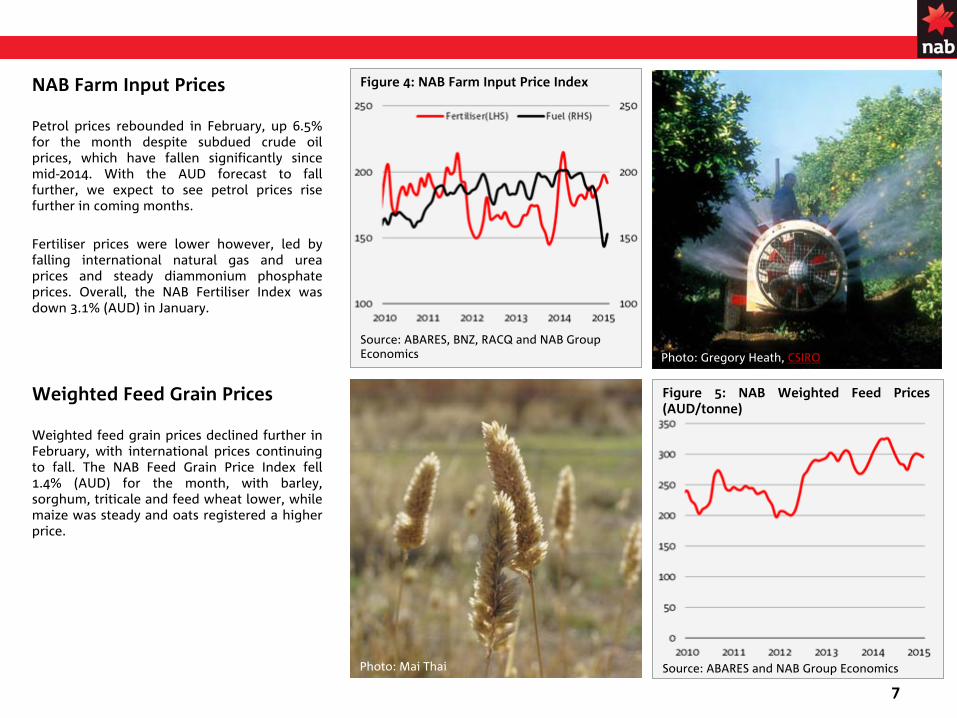
NAB Farm Input Prices
Petrol prices rebounded in February, up 6.5% for the month despite subdued crude oil prices, which have fallen significantly since
mid-2014. With the AUD forecast to fall further, we expect to see petrol prices rise further in coming months.
Fertiliser prices were lower however, led by falling international natural gas and urea prices and steady diammonium phosphate prices. Overall, the NAB Fertiliser Index was down 3.1% (AUD) in January.
Figure 4: NAB Farm Input Price Index
Source: ABARES, BNZ, RACQ and NAB Group Economics
Figure 5: NAB Weighted Feed Prices
(AUD/tonne)
Source: ABARES and NAB Group Economics
Weighted Feed Grain Prices
Weighted feed grain prices declined further in February, with international prices continuing to fall. The NAB Feed Grain Price Index fell
1.4% (AUD) for the month, with barley, sorghum, triticale and feed wheat lower, while maize was steady and oats registered a higher price.
Photo: Mai Thai
Photo: Gregory Heath, CSIRO
8
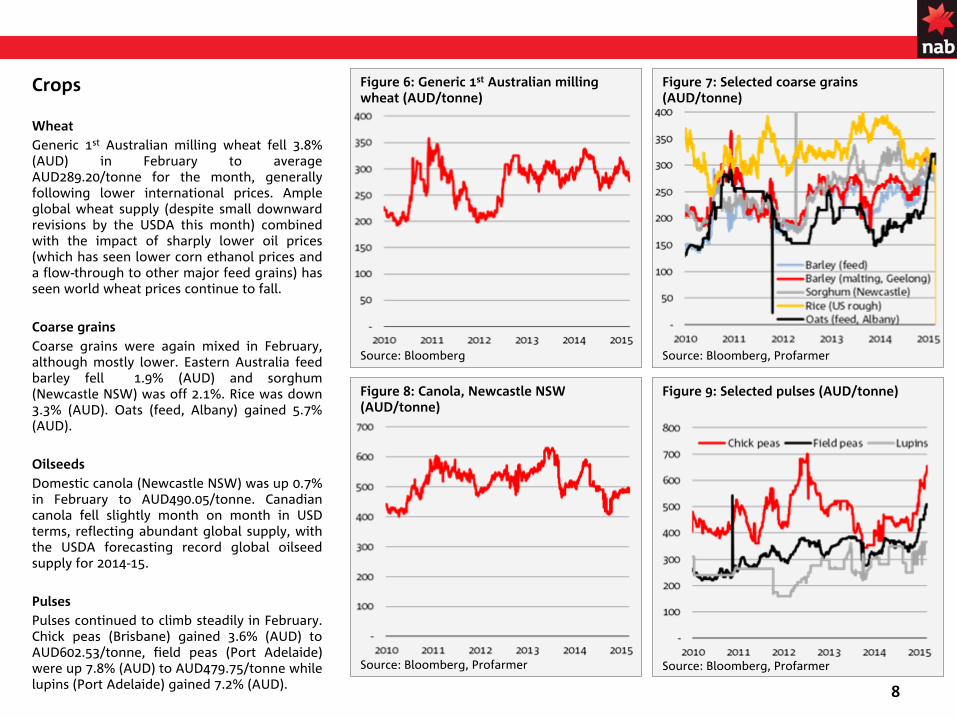
Crops
WheatGeneric 1st
Australian milling wheat fell 3.8% (AUD) in February to average AUD289.20/tonne for the month, generally following lower international prices. Ample
global wheat supply (despite small downward revisions by the USDA this month) combined with the impact of sharply lower oil prices (which has seen lower corn ethanol prices and a flow-through to other major feed grains) has seen world wheat prices continue to fall.
Coarse grainsCoarse grains were again mixed in February, although mostly lower. Eastern Australia feed barley fell 1.9% (AUD) and sorghum (Newcastle NSW) was off 2.1%. Rice was down 3.3% (AUD). Oats (feed, Albany) gained 5.7% (AUD).
OilseedsDomestic canola (Newcastle NSW) was up 0.7% in February to AUD490.05/tonne. Canadian
canola fell slightly month on month in USD terms, reflecting abundant global supply, with the USDA forecasting record global oilseed supply for 2014-15.
PulsesPulses continued to climb steadily in February. Chick peas (Brisbane) gained 3.6% (AUD) to
AUD602.53/tonne, field peas (Port Adelaide)
were up 7.8% (AUD) to AUD479.75/tonne while lupins (Port Adelaide) gained 7.2% (AUD).
Figure 7: Selected coarse grains (AUD/tonne)
Source: Bloomberg, Profarmer
Figure 9: Selected pulses (AUD/tonne)
Source: Bloomberg, Profarmer
Figure 6: Generic 1st
Australian milling wheat (AUD/tonne)
Source: Bloomberg
Figure 8: Canola, Newcastle NSW (AUD/tonne)
Source: Bloomberg, Profarmer
9
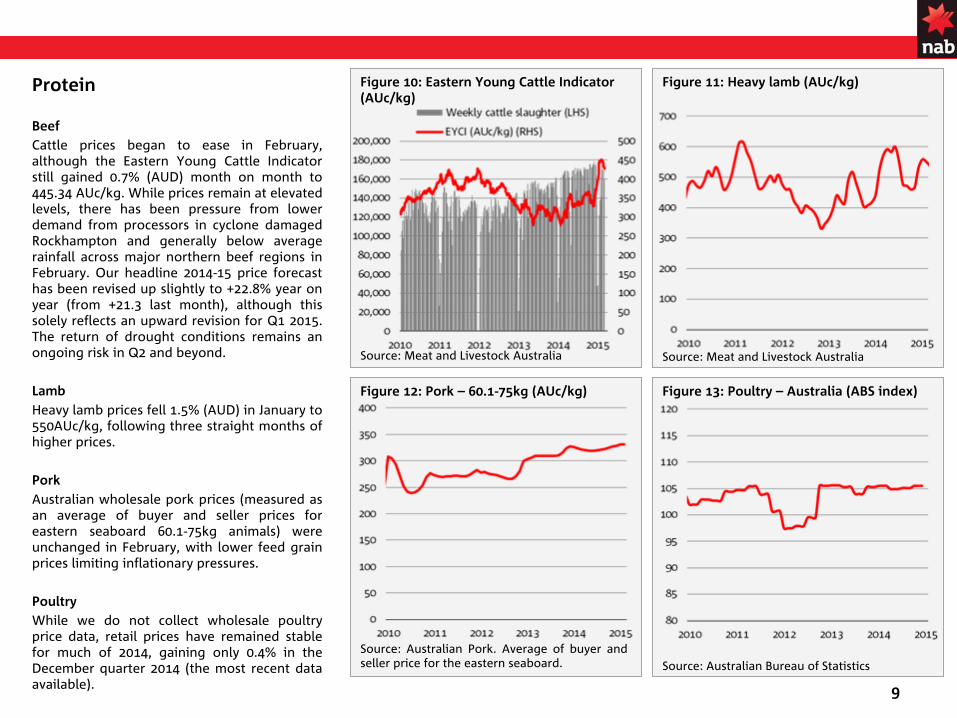
Protein
BeefCattle prices began to ease in February,
although the Eastern Young Cattle Indicator
still gained 0.7% (AUD) month on month to
445.34 AUc/kg. While prices remain at elevated levels, there has been pressure from lower
demand from processors in cyclone damaged Rockhampton and generally below average rainfall across major northern beef regions in February. Our headline 2014-15 price forecast has been revised up slightly to +22.8% year on year (from +21.3 last month), although this
solely reflects an upward revision for Q1 2015. The return of drought conditions remains an ongoing risk in Q2 and beyond.
LambHeavy lamb prices fell 1.5% (AUD) in January to 550AUc/kg, following three straight months of higher prices.
PorkAustralian wholesale pork prices (measured as an average of buyer and seller prices for
eastern seaboard 60.1-75kg animals) were
unchanged in February, with lower feed grain prices limiting inflationary pressures.
PoultryWhile we do not collect wholesale poultry price data, retail prices have remained stable for much of 2014, gaining only 0.4% in the December quarter 2014 (the most recent data available).
Figure 11: Heavy lamb (AUc/kg)
Source: Meat and Livestock Australia
Figure 13: Poultry –
Australia (ABS index)
Source: Australian Bureau of Statistics
Figure 10: Eastern Young Cattle Indicator (AUc/kg)
Source: Meat and Livestock Australia
Figure 12: Pork –
60.1-75kg (AUc/kg)
Source: Australian Pork. Average of buyer and seller price for the eastern seaboard.
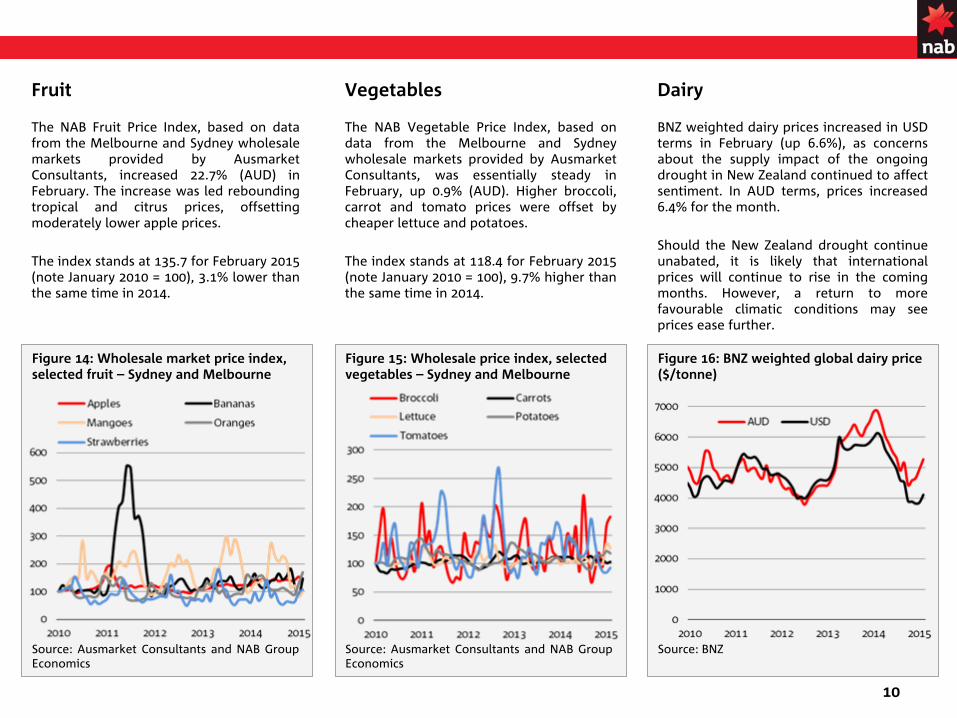
Figure 16: BNZ weighted global dairy price ($/tonne)
Source: BNZ
Figure 15: Wholesale price index, selected vegetables –
Sydney and Melbourne
Source: Ausmarket Consultants and NAB Group Economics
10
Vegetables
The NAB Vegetable Price Index, based on data from the Melbourne and Sydney
wholesale markets provided by Ausmarket Consultants, was essentially steady in February, up 0.9% (AUD). Higher broccoli, carrot and tomato prices were offset by
cheaper lettuce and potatoes.
The index stands at 118.4 for February 2015 (note January 2010 = 100), 9.7% higher than the same time in 2014.
Dairy
BNZ weighted dairy prices increased in USD terms in February (up 6.6%), as concerns about the supply impact of the ongoing drought in New Zealand continued to affect sentiment. In AUD terms, prices increased 6.4% for the month.
Should the New Zealand drought continue unabated, it is likely that international prices will continue to rise in the coming months. However, a return to more
favourable climatic conditions may see prices ease further.
Figure 14: Wholesale market price index, selected fruit –
Sydney and Melbourne
Source: Ausmarket Consultants and NAB Group Economics
Fruit
The NAB Fruit Price Index, based on data from the Melbourne and Sydney wholesale markets provided by Ausmarket Consultants, increased 22.7% (AUD) in
February. The increase was led rebounding tropical and citrus prices, offsetting moderately lower apple prices.
The index stands at 135.7 for February 2015 (note January 2010 = 100), 3.1% lower than the same time in 2014.
11
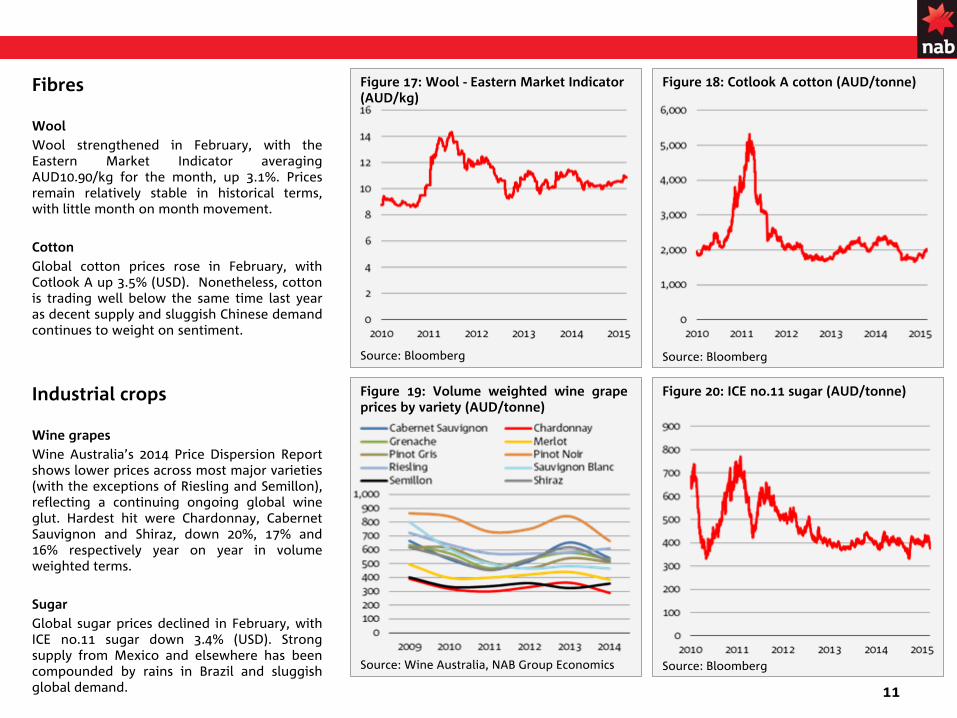
Fibres
WoolWool strengthened in February, with the Eastern Market Indicator averaging AUD10.90/kg for the month, up 3.1%. Prices remain relatively stable in historical terms, with little month on month movement.
CottonGlobal cotton prices rose in February, with
Cotlook A up 3.5% (USD). Nonetheless, cotton is trading well below the same time last year as decent supply and sluggish Chinese demand continues to weight on sentiment.
Figure 18: Cotlook A cotton (AUD/tonne)
Source: Bloomberg
Figure 20: ICE no.11 sugar (AUD/tonne)
Source: Bloomberg
Figure 17: Wool -
Eastern Market Indicator (AUD/kg)
Source: Bloomberg
Figure 19: Volume weighted wine grape prices by variety (AUD/tonne)
Source: Wine Australia, NAB Group Economics
Industrial crops
Wine grapesWine Australia’s 2014 Price Dispersion Report shows lower prices across most major varieties (with the exceptions of Riesling and Semillon), reflecting a continuing ongoing global wine
glut. Hardest hit were Chardonnay, Cabernet Sauvignon and Shiraz, down 20%, 17% and
16% respectively year on year in volume
weighted terms.
SugarGlobal sugar prices declined in February, with ICE no.11 sugar down 3.4% (USD). Strong supply from Mexico and elsewhere has been compounded by rains in Brazil and sluggish
global demand.
12
Contact details
Risk Management Services
Corporate CommunicationsGreg Noonan
Head of Agribusiness & Health –
Business Markets
Specialised Sales +61 477 717 607
Alan OsterChief Economist+61 3 8634 2927
Phin ZiebellEconomist -
Agribusiness+61 (0) 475 940 662
Agribusiness
Economic Research
Khan HorneGeneral Manager –Agribusiness
Zaklina KukeskiSenior Consultant+61 (0) 439 255 981
Chris OwensSenior Manager Corporate Communications+61 (0) 409 945 476
13
DisclaimerThis document has been prepared by National Australia Bank Limited ABN 12 004 044 937
AFSL 230686 ("NAB"). Any advice contained in this document has been prepared without taking into account your objectives, financial situation or needs. Before acting on any advice in this document, NAB recommends that you consider whether the advice is appropriate for your circumstances. NAB recommends that you obtain and consider the relevant Product Disclosure Statement or other disclosure document, before making any decision about a product including whether to acquire or to continue to hold it. Products are issued by NAB unless otherwise specified.So far as laws and regulatory requirements permit, NAB, its related companies, associated entities and any officer, employee, agent, adviser or contractor thereof (the "NAB Group") does not warrant or represent that the information, recommendations, opinions or conclusions contained in this document ("Information") is accurate, reliable, complete or current. The Information is indicative and prepared for information purposes only and does not purport to contain all matters relevant to any particular investment or financial instrument. The Information is not intended to be relied upon and in all cases anyone proposing to use the Information should independently verify and check its accuracy, completeness, reliability and suitability obtain appropriate professional advice. The Information is not intended to create any legal or fiduciary relationship and nothing contained in this document will be considered an invitation to engage in business, a recommendation, guidance, invitation, inducement, proposal, advice or solicitation to provide investment, financial or banking services or an invitation to engage in business or invest, buy, sell or deal in any securities or other financial instruments. The Information is subject to change without notice, but the NAB
Group shall not be under any duty to update or correct it. All statements as to future matters are not guaranteed to be accurate and any statements as to past performance do not represent future performance. The NAB Group takes various positions and/or roles in relation to financial products and services, and (subject to NAB policies)
may hold a position or act as a price-maker in the financial instruments of any company or issuer discussed within this document, or act and receive fees as an underwriter, placement agent, adviser, broker or lender to such company or issuer. The NAB Group may transact, for its own account or for the account of any client(s), the securities of or other financial instruments relating to any company or issuer described in the Information, including in a manner that is inconsistent with or contrary to the Information. Subject to any terms implied by law and which cannot be excluded, the NAB Group shall not be liable for any errors, omissions, defects or misrepresentations in the Information (including by reasons of negligence, negligent misstatement or otherwise) or for any loss or damage (whether direct or indirect)
suffered by persons who use or rely on the Information. If any law prohibits the exclusion of such liability, the NAB Group limits its liability to the re-supply of the Information, provided that such limitation is permitted by law and is fair and reasonable. This document is intended for clients of the NAB Group only and may not be reproduced or distributed without the consent of NAB.
The Information is governed by, and is to be construed in accordance with, the laws in force in the State of Victoria, Australia.Analyst Disclaimer: The Information accurately reflects the personal views of the author(s) about the securities, issuers and other subject matters discussed, and is based upon sources reasonably believed to be reliable and accurate. The views of the author(s) do not necessarily reflect the views of the NAB Group. No part of the compensation of the author(s) was, is, or will be, directly or indirectly, related to any specific recommendations or views expressed. Research analysts responsible for this report receive compensation based upon, among other factors, the overall profitability of the Global Markets Division of NAB. United Kingdom: If this document is distributed in the United Kingdom, such distribution is by National Australia Bank Limited, 88 Wood Street, London EC2V 7QQ. Registered in England BR1924. Head Office: 800 Bourke Street, Docklands, Victoria, 3008. Incorporated with limited liability in the State of Victoria, Australia. Authorised and regulated by the Australian Prudential Regulation Authority. Authorised in the UK
by the Prudential Regulation Authority. Subject to regulation by the Financial Conduct Authority and limited regulation by the Prudential Regulation Authority. Details about
the extent of our regulation by the Prudential Regulation Authority are available from us on request. US Disclaimer:
If this document is distributed in the United States, such distribution is by nabSecurities, LLC. This document is not intended
as an offer or solicitation for the purchase or sale of any securities, financial instrument or product or to provide financial services. It is not the intention of
nabSecurities to create legal relations on the basis of information provided herein.Hong Kong: In Hong Kong this document is for distribution only to "professional investors" within the meaning of Schedule 1 to the Securities and Futures Ordinance (Cap. 571, Laws of Hong Kong) ("SFO") and any rules made
thereunder and may not be redistributed in whole or in part in Hong Kong to any person. Issued by National Australia Bank Limited, a licensed bank under the Banking Ordinance (Cap. 155, Laws of Hong Kong) and a registered institution under the
SFO (central entity number: AAO169).New Zealand:
This publication has been provided for general information only. Although every effort has been made to ensure this publication
is accurate the contents should not be relied upon or used as a basis for entering into any products
described in this publication. To the extent that any information or recommendations in this publication constitute financial advice, they do not take into account any person’s particular financial situation or goals. Bank of New Zealand strongly recommends readers seek independent legal/financial advice prior to acting in relation to any of the
matters discussed in this publication. Neither Bank of New Zealand nor any person involved in this publication accepts any liability for any loss or damage whatsoever may directly or indirectly result from any advice, opinion, information, representation or omission, whether negligent or otherwise, contained in this publication. National Australia Bank Limited is not a registered bank in New Zealand.Japan: National Australia Bank Ltd. has no license of securities-related business in Japan. Therefore, this document is only for your information purpose and is not intended as an offer or solicitation for the purchase or sale of the securities
described herein or for any other action.

Photo: Mai Thai