Morbidity and Mortality Weekly Report - Centers …231 — 1 6 63 48 Missouri N 0 0 N N — 535 623...
14
Morbidity and Mortality Weekly Report ND-508 MMWR / September 19, 2014 / Vol. 63 / No. 37 TABLE I. Provisional cases of infrequently reported notifiable diseases (<1,000 cases reported during the preceding year) — United States, week ending September 13, 2014 (37th week)* (Export data) Disease Current week Cum 2014 5-year weekly average † Total cases reported for previous years States reporting cases during current week (No.) 2013 2012 2011 2010 2009 Anthrax — — 0 — — 1 — 1 Arboviral diseases § , ¶ : California serogroup virus disease — 23 5 95 81 137 75 55 Eastern equine encephalitis virus disease — 4 0 8 15 4 10 4 Powassan virus disease — 3 0 12 7 16 8 6 St. Louis encephalitis virus disease — 2 0 1 3 6 10 12 Western equine encephalitis virus disease — — — — — — — — Botulism, total — 97 3 152 168 153 112 118 foodborne — 12 0 4 27 24 7 10 infant — 70 2 136 123 97 80 83 other (wound and unspecified) — 15 0 12 18 32 25 25 Brucellosis 1 52 2 99 114 79 115 115 MI (1) Chancroid — 14 0 10 15 8 24 28 Cholera — — 0 14 17 40 13 10 Cyclosporiasis § 2 336 4 784 123 151 179 141 NY (1), NYC (1) Diphtheria — 1 — — 1 — — — Haemophilus influenzae,** invasive disease (age <5 yrs): serotype b — 17 1 31 30 14 23 35 nonserotype b — 118 2 222 205 145 200 236 unknown serotype 1 168 3 185 210 226 223 178 GA (1) Hansen disease § — 41 2 81 82 82 98 103 Hantavirus pulmonary syndrome § — 17 0 21 30 23 20 20 Hemolytic uremic syndrome, postdiarrheal § 5 130 8 329 274 290 266 242 OH (2), MD (1), FL (1), AR (1) Hepatitis B, virus infection perinatal 1 27 2 48 40 U U U TN (1) Influenza-associated pediatric mortality § , †† 1 102 2 161 52 118 61 358 TX (1) Leptospirosis — 9 0 NN NN NN NN NN Listeriosis 16 420 24 735 727 870 821 851 RI (2), NYC (1), PA (2), OH (5), VA (3), FL (1), CO (1), WA (1) Measles §§ 1 593 2 187 55 220 63 71 TX (1) Meningococcal disease, invasive ¶¶ : A, C, Y, and W-135 — 77 2 142 161 257 280 301 serogroup B — 40 1 99 110 159 135 174 other serogroup — 18 0 17 20 20 12 23 unknown serogroup 2 159 5 298 260 323 406 482 FL (1), TN (1) Novel influenza A virus infections*** — 2 159 21 313 14 4 43,774 Plague — 4 0 4 4 3 2 8 Poliomyelitis, paralytic — — — 1 — — — 1 Polio virus Infection, nonparalytic § — — — — — — — — Psittacosis § — — 0 6 2 2 4 9 Q fever, total § — 90 3 170 135 134 131 113 acute — 70 2 137 113 110 106 93 chronic — 20 1 33 22 24 25 20 Rabies, human — — 0 2 1 6 2 4 Rubella ††† — 8 — 9 9 4 5 3 Rubella, congenital syndrome — — 0 1 3 — — 2 SARS-CoV § — — — — — — — — Smallpox § — — — — — — — — Streptococcal toxic-shock syndrome § 1 140 2 224 194 168 142 161 KY (1) Syphilis, congenital (age <1 yr) §§§ — 163 8 348 322 360 377 423 Tetanus — 19 1 26 37 36 26 18 Toxic-shock syndrome (staphylococcal) § — 34 2 71 65 78 82 74 Trichinellosis — 10 0 22 18 15 7 13 Tularemia — 99 3 203 149 166 124 93 Typhoid fever 4 211 10 338 354 390 467 397 NY (1), MD (1), MT (2) Vancomycin-intermediate Staphylococcus aureus § 2 124 2 248 134 82 91 78 NY (1), FL (1) Vancomycin-resistant Staphylococcus aureus § — — — — 2 — 2 1 Vibriosis (noncholera Vibrio species infections) § 22 684 33 1,299 1,111 832 846 789 NY (5), NYC (3), OH (1), MD (2), VA (2), FL (6), WA (2), AK (1) Viral hemorrhagic fever ¶¶¶ — — — — — — 1 NN Yellow fever — — — — — — — — See Table 1 footnotes on next page. Notifiable Diseases and Mortality Tables
Transcript of Morbidity and Mortality Weekly Report - Centers …231 — 1 6 63 48 Missouri N 0 0 N N — 535 623...

Morbidity and Mortality Weekly Report
ND-508 MMWR / September 19, 2014 / Vol. 63 / No. 37
TABLE I. Provisional cases of infrequently reported notifiable diseases (<1,000 cases reported during the preceding year) — United States, week ending September 13, 2014 (37th week)* (Export data)
DiseaseCurrent
weekCum 2014
5-year weekly
average†
Total cases reported for previous yearsStates reporting cases
during current week (No.)2013 2012 2011 2010 2009
Anthrax — — 0 — — 1 — 1Arboviral diseases§, ¶:
California serogroup virus disease — 23 5 95 81 137 75 55Eastern equine encephalitis virus disease — 4 0 8 15 4 10 4Powassan virus disease — 3 0 12 7 16 8 6St. Louis encephalitis virus disease — 2 0 1 3 6 10 12Western equine encephalitis virus disease — — — — — — — —
Botulism, total — 97 3 152 168 153 112 118foodborne — 12 0 4 27 24 7 10infant — 70 2 136 123 97 80 83other (wound and unspecified) — 15 0 12 18 32 25 25
Brucellosis 1 52 2 99 114 79 115 115 MI (1)Chancroid — 14 0 10 15 8 24 28Cholera — — 0 14 17 40 13 10Cyclosporiasis§ 2 336 4 784 123 151 179 141 NY (1), NYC (1)Diphtheria — 1 — — 1 — — —Haemophilus influenzae,** invasive disease (age <5 yrs):
serotype b — 17 1 31 30 14 23 35nonserotype b — 118 2 222 205 145 200 236unknown serotype 1 168 3 185 210 226 223 178 GA (1)
Hansen disease§ — 41 2 81 82 82 98 103Hantavirus pulmonary syndrome§ — 17 0 21 30 23 20 20Hemolytic uremic syndrome, postdiarrheal§ 5 130 8 329 274 290 266 242 OH (2), MD (1), FL (1), AR (1)Hepatitis B, virus infection perinatal 1 27 2 48 40 U U U TN (1)Influenza-associated pediatric mortality§,†† 1 102 2 161 52 118 61 358 TX (1)Leptospirosis — 9 0 NN NN NN NN NNListeriosis 16 420 24 735 727 870 821 851 RI (2), NYC (1), PA (2), OH (5), VA (3), FL (1),
CO (1), WA (1)Measles§§ 1 593 2 187 55 220 63 71 TX (1)Meningococcal disease, invasive¶¶:
A, C, Y, and W-135 — 77 2 142 161 257 280 301serogroup B — 40 1 99 110 159 135 174other serogroup — 18 0 17 20 20 12 23unknown serogroup 2 159 5 298 260 323 406 482 FL (1), TN (1)
Novel influenza A virus infections*** — 2 159 21 313 14 4 43,774Plague — 4 0 4 4 3 2 8Poliomyelitis, paralytic — — — 1 — — — 1Polio virus Infection, nonparalytic§ — — — — — — — —Psittacosis§ — — 0 6 2 2 4 9Q fever, total§ — 90 3 170 135 134 131 113
acute — 70 2 137 113 110 106 93chronic — 20 1 33 22 24 25 20
Rabies, human — — 0 2 1 6 2 4Rubella††† — 8 — 9 9 4 5 3Rubella, congenital syndrome — — 0 1 3 — — 2SARS-CoV§ — — — — — — — —Smallpox§ — — — — — — — —Streptococcal toxic-shock syndrome§ 1 140 2 224 194 168 142 161 KY (1)Syphilis, congenital (age <1 yr)§§§ — 163 8 348 322 360 377 423Tetanus — 19 1 26 37 36 26 18Toxic-shock syndrome (staphylococcal)§ — 34 2 71 65 78 82 74Trichinellosis — 10 0 22 18 15 7 13Tularemia — 99 3 203 149 166 124 93Typhoid fever 4 211 10 338 354 390 467 397 NY (1), MD (1), MT (2)Vancomycin-intermediate Staphylococcus aureus§ 2 124 2 248 134 82 91 78 NY (1), FL (1)Vancomycin-resistant Staphylococcus aureus§ — — — — 2 — 2 1Vibriosis (noncholera Vibrio species infections)§ 22 684 33 1,299 1,111 832 846 789 NY (5), NYC (3), OH (1), MD (2), VA (2), FL (6),
WA (2), AK (1)Viral hemorrhagic fever¶¶¶ — — — — — — 1 NNYellow fever — — — — — — — —
See Table 1 footnotes on next page.
Notifiable Diseases and Mortality Tables

Morbidity and Mortality Weekly Report
MMWR / September 19, 2014 / Vol. 63 / No. 37 ND-509
* Ratio of current 4-week total to mean of 15 4-week totals (from previous, comparable, and subsequent 4-week periods for the past 5 years). The point where the hatched area begins is based on the mean and two standard deviations of these 4-week totals.
FIGURE I. Selected notifiable disease reports, United States, comparison of provisional 4-week totals September 13, 2014, with historical data
TABLE I. (Continued) Provisional cases of infrequently reported notifiable diseases (<1,000 cases reported during the preceding year) — United States, week ending September 13, 2014 (37th week)*
—: No reported cases. N: Not reportable. NN: Not Nationally Notifiable. Cum: Cumulative year-to-date counts. * Case counts for reporting years 2013 and 2014 are provisional and subject to change. For further information on interpretation of these data, see http://wwwn.cdc.gov/nndss/document/
ProvisionalNationaNotifiableDiseasesSurveillanceData20100927.pdf. † Calculated by summing the incidence counts for the current week, the 2 weeks preceding the current week, and the 2 weeks following the current week, for a total of 5 preceding years.
Additional information is available at http://wwwn.cdc.gov/nndss/document/5yearweeklyaverage.pdf. § Not reportable in all states. Data from states where the condition is not reportable are excluded from this table except starting in 2007 for the arboviral diseases, STD data, TB data, and influenza-
associated pediatric mortality, and in 2003 for SARS-CoV. Reporting exceptions are available at http://wwwn.cdc.gov/nndss/document/SRCA_FINAL_REPORT_2006-2012_final.xlsx. ¶ Includes both neuroinvasive and nonneuroinvasive. Updated weekly from reports to the Division of Vector-Borne Infectious Diseases, National Center for Zoonotic, Vector-Borne, and
Enteric Diseases (ArboNET Surveillance). Data for West Nile virus are available in Table II. ** Data for H. influenzae (all ages, all serotypes) are available in Table II. †† Updated weekly from reports to the Influenza Division, National Center for Immunization and Respiratory Diseases. Since September 29, 2013, 108 influenza-associated pediatric deaths
occurring during the 2013-14 influenza season have been reported. §§ The one measles case reported for the current week was indigenous. ¶¶ Data for meningococcal disease (all serogroups) are available in Table II. *** CDC discontinued reporting of individual confirmed and probable cases of influenza A (H1N1)pdm09 virus infections on July 24, 2009. During 2009, four cases of human infection with
novel influenza A viruses, different from the influenza A (H1N1)pdm09 virus, were reported to CDC. The four cases of novel influenza A virus infection reported to CDC during 2010, the fourteen cases reported during 2011, the 313 cases reported in 2012, the 21 cases reported during 2013, and the two cases repoorted for 2014 are different from the influenza A (H1N1)pdm09 virus. Total case counts are provided by the Influenza Division, National Center for Immunization and Respiratory Diseases (NCIRD).
††† No rubella cases were reported for the current week. §§§ Updated weekly from reports to the Division of STD Prevention, National Center for HIV/AIDS, Viral Hepatitis, STD, and TB Prevention. ¶¶¶ There were no cases of viral hemorrhagic fever reported during the current week. See Table II for dengue hemorrhagic fever.
Notifiable Disease Data Team and 122 Cities Mortality Data Team
Umed AjaniDeborah A. Adams Willie J. AndersonLenee Blanton Rosaline DharaDiana Harris Onweh Alan W. SchleyPearl C. Sharp
820.50.25 1
Beyond historical limits
DISEASE
Ratio (Log scale)*
DECREASE INCREASECASES CURRENT
4 WEEKS
Hepatitis A, acute
Hepatitis B, acute
Hepatitis C, acute
Legionellosis
Measles
Mumps
Pertussis
Giardiasis
Meningococcal disease
805
47
91
37
254
16
10
11
798
4

Morbidity and Mortality Weekly Report
ND-510 MMWR / September 19, 2014 / Vol. 63 / No. 37
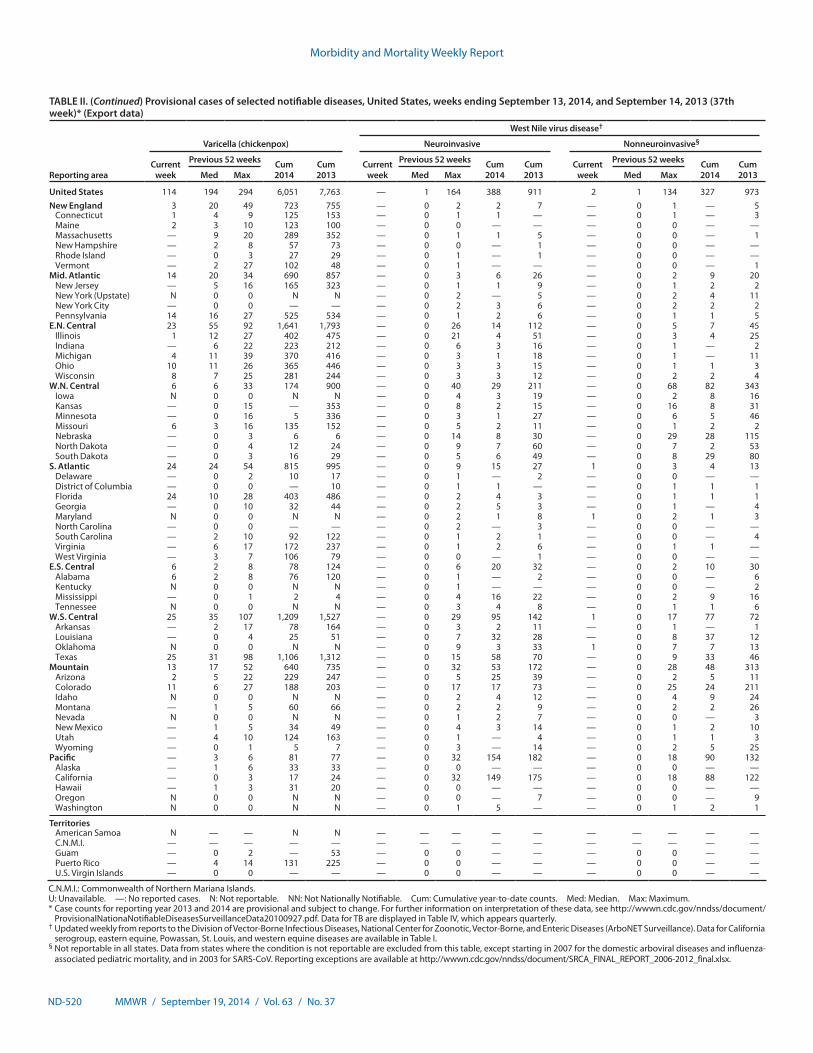
TABLE II. Provisional cases of selected notifiable diseases, United States, weeks ending September 13, 2014, and September 14, 2013 (37th week)* (Export data)
Reporting area
Babesiosis Chlamydia trachomatis infection Coccidioidomycosis
Current week
Previous 52 weeks Cum 2014
Cum 2013
Current week
Previous 52 weeks Cum 2014
Cum 2013
Current week
Previous 52 weeks Cum 2014
Cum 2013Med Max Med Max Med Max
United States 19 18 104 963 1,370 13,665 25,932 29,630 912,600 995,010 99 174 293 6,041 6,237New England — 6 59 466 796 440 838 1,157 29,167 34,736 — 0 2 4 1
Connecticut — 1 22 120 270 76 239 388 8,740 9,109 N 0 0 N NMaine — 0 5 28 30 72 69 106 2,343 2,424 N 0 0 N NMassachusetts — 1 29 199 386 247 390 669 13,108 16,846 — 0 0 — —New Hampshire — 0 4 16 19 34 35 76 825 2,242 — 0 2 2 1Rhode Island — 1 27 101 88 — 86 147 2,847 2,936 — 0 1 2 —Vermont — 0 2 2 3 11 36 98 1,304 1,179 N 0 0 N N
Mid. Atlantic 19 8 62 467 432 2,582 3,430 3,782 121,734 124,346 — 0 0 — —New Jersey — 1 23 118 155 207 569 694 20,155 20,081 N 0 0 N NNew York (Upstate) 16 3 53 297 209 942 757 1,866 26,317 25,409 N 0 0 N NNew York City 3 0 9 52 68 602 1,138 1,267 40,930 41,535 N 0 0 N NPennsylvania N 0 0 N N 831 943 1,190 34,332 37,321 N 0 0 N N
E.N. Central — 0 4 23 72 1,456 3,743 4,534 130,471 152,020 1 1 3 42 21Illinois — 0 1 — 2 41 935 1,441 29,140 44,907 N 0 0 N NIndiana — 0 1 — — 246 545 692 19,309 20,247 N 0 0 N NMichigan — 0 1 1 2 444 832 1,078 29,490 31,956 — 0 3 27 12Ohio N 0 0 N N 422 1,038 1,182 36,984 38,096 1 0 2 13 5Wisconsin — 0 4 22 68 303 447 539 15,548 16,814 — 0 1 2 4
W.N. Central — 0 2 1 58 171 1,562 1,826 53,062 58,360 — 2 6 77 71Iowa N 0 0 N N 27 222 254 7,979 7,785 N 0 0 N NKansas N 0 0 N N 58 215 258 7,468 7,890 N 0 0 N NMinnesota — 0 2 — 55 — 338 423 10,430 13,231 — 1 6 63 48Missouri N 0 0 N N — 535 623 18,409 19,542 — 0 1 6 14Nebraska — 0 0 — 1 86 149 253 5,442 5,006 — 0 1 1 1North Dakota — 0 0 — 1 — 61 83 2,101 2,059 — 0 2 7 8South Dakota — 0 1 1 1 — 66 99 1,233 2,847 N 0 0 N N
S. Atlantic — 0 2 4 9 3,826 5,398 6,934 193,131 199,626 — 0 2 8 5Delaware — 0 1 1 2 159 84 220 3,065 3,666 — 0 1 — —District of Columbia N 0 0 N N — 0 190 — 4,726 — 0 1 — —Florida N 0 0 N N — 1,594 1,838 56,546 56,845 N 0 0 N NGeorgia N 0 0 N N 1,174 1,003 2,050 32,325 35,529 N 0 0 N NMaryland — 0 1 1 6 550 483 804 17,539 17,596 — 0 2 8 5North Carolina N 0 0 N N 712 914 1,840 35,462 35,285 N 0 0 N NSouth Carolina — 0 2 2 1 471 522 925 19,277 18,814 N 0 0 N NVirginia N 0 0 N N 682 696 1,267 25,696 23,593 N 0 0 N NWest Virginia — 0 0 — — 78 93 127 3,221 3,572 N 0 0 N N
E.S. Central — 0 0 — — 1,301 1,924 2,565 68,366 67,643 — 0 0 — —Alabama — 0 0 — — 714 509 734 16,862 21,304 N 0 0 N NKentucky N 0 0 N N 369 321 483 11,681 11,820 N 0 0 N NMississippi N 0 0 N N — 434 1,235 19,470 13,007 N 0 0 N NTennessee — 0 0 — — 218 586 871 20,353 21,512 N 0 0 N N
W.S. Central — 0 1 — — 403 3,256 4,557 112,313 137,176 — 0 1 1 3Arkansas N 0 0 N N 348 287 424 10,965 11,356 N 0 0 N NLouisiana N 0 1 N N — 275 1,359 8,303 18,018 — 0 1 1 3Oklahoma N 0 0 N N 55 276 394 9,521 13,318 N 0 0 N NTexas N 0 1 N N — 2,375 2,910 83,524 94,484 N 0 0 N N
Mountain — 0 0 — — 1,101 1,750 2,764 63,492 64,058 86 125 209 4,376 3,972Arizona N 0 0 N N 480 623 1,348 22,135 18,949 86 123 208 4,279 3,870Colorado N 0 0 N N 330 378 744 14,721 14,697 N 0 0 N NIdaho N 0 0 N N — 89 156 1,684 3,825 N 0 0 N NMontana — 0 0 — — 109 76 100 2,841 2,662 — 0 2 8 2Nevada N 0 0 N N 5 201 604 8,114 8,384 — 2 5 48 52New Mexico N 0 0 N N 121 222 353 7,845 8,709 — 0 2 16 20Utah — 0 0 — — 56 145 179 5,140 5,351 — 0 4 23 26Wyoming — 0 0 — — — 31 67 1,012 1,481 — 0 1 2 2
Pacific — 0 1 2 3 2,385 4,012 4,613 140,864 157,045 12 47 93 1,533 2,164Alaska N 0 0 N N 25 110 147 4,013 4,164 — 0 0 — —California — 0 1 1 3 1,549 3,103 3,528 109,136 120,300 12 47 93 1,530 2,159Hawaii N 0 0 N N — 123 151 4,152 4,738 N 0 0 N NOregon — 0 1 1 — 373 296 395 11,045 10,150 — 0 1 3 5Washington — 0 1 — — 438 380 596 12,518 17,693 N 0 0 N N
TerritoriesAmerican Samoa N — — N N — — — — — N — — N NC.N.M.I. — — — — — — — — — — — — — — —Guam — 0 0 — — — 12 22 — 711 — 0 0 — 1Puerto Rico N 0 0 N N 89 94 317 3,460 4,045 N 0 0 N NU.S. Virgin Islands N 0 0 N N — 14 23 294 565 — 0 0 — —
C.N.M.I.: Commonwealth of Northern Mariana Islands.U: Unavailable. —: No reported cases. N: Not reportable. NN: Not Nationally Notifiable. Cum: Cumulative year-to-date counts. Med: Median. Max: Maximum.* Case counts for reporting year 2013 and 2014 are provisional and subject to change. For further information on interpretation of these data, see http://wwwn.cdc.gov/nndss/document/
ProvisionalNationaNotifiableDiseasesSurveillanceData20100927.pdf. Data for TB are displayed in Table IV, which appears quarterly.

Morbidity and Mortality Weekly Report
MMWR / September 19, 2014 / Vol. 63 / No. 37 ND-511
TABLE II. (Continued) Provisional cases of selected notifiable diseases, United States, weeks ending September 13, 2014, and September 14, 2013 (37th week)* (Export data)
Reporting area
Cryptosporidiosis
Dengue Virus Infection
Dengue Fever† Dengue Hemorrhagic Fever§
Current week
Previous 52 weeks Cum 2014
Cum 2013
Current week
Previous 52 weeks Cum 2014
Cum 2013
Current week
Previous 52 weeks Cum 2014
Cum 2013Med Max Med Max Med Max
United States 210 114 366 5,057 6,517 — 8 24 222 587 — 0 0 — 6New England — 5 12 195 212 — 0 3 16 26 — 0 0 — —
Connecticut — 1 4 30 31 — 0 2 2 12 — 0 0 — —Maine — 1 4 35 23 — 0 1 1 1 — 0 0 — —Massachusetts — 2 5 75 98 — 0 1 7 — — 0 0 — —New Hampshire — 0 3 20 32 — 0 1 — 3 — 0 0 — —Rhode Island — 0 4 14 6 — 0 1 4 8 — 0 0 — —Vermont — 0 7 21 22 — 0 2 2 2 — 0 0 — —
Mid. Atlantic 28 12 40 480 577 — 2 7 71 155 — 0 0 — 2New Jersey — 0 5 13 52 — 0 5 26 — — 0 0 — —New York (Upstate) 12 4 14 172 162 — 0 4 18 38 — 0 0 — 1New York City 7 2 6 56 52 — 1 5 18 95 — 0 0 — 1Pennsylvania 9 6 19 239 311 — 0 2 9 22 — 0 0 — —
E.N. Central 20 23 59 920 1,101 — 0 3 15 53 — 0 0 — —Illinois — 3 11 105 197 — 0 2 2 20 — 0 0 — —Indiana — 2 7 79 98 — 0 1 2 5 — 0 0 — —Michigan 2 4 12 160 194 — 0 1 — 15 — 0 0 — —Ohio 10 6 15 232 256 — 0 1 7 6 — 0 0 — —Wisconsin 8 7 28 344 356 — 0 2 4 7 — 0 0 — —
W.N. Central 1 16 102 531 2,030 — 0 3 3 26 — 0 0 — 3Iowa — 5 61 180 1,306 — 0 1 1 — — 0 0 — 2Kansas — 1 5 46 75 — 0 1 1 6 — 0 0 — —Minnesota — 0 17 — 229 — 0 2 — 14 — 0 0 — 1Missouri — 3 13 104 146 — 0 1 1 3 — 0 0 — —Nebraska — 2 7 56 104 — 0 0 — — — 0 0 — —North Dakota — 1 7 40 55 — 0 0 — 1 — 0 0 — —South Dakota 1 3 9 105 115 — 0 1 — 2 — 0 0 — —
S. Atlantic 121 26 146 1,569 778 — 2 8 45 168 — 0 0 — 1Delaware — 0 2 2 11 — 0 1 1 2 — 0 0 — —District of Columbia — 0 1 2 9 — 0 1 1 — — 0 0 — —Florida 106 10 128 1,071 255 — 1 5 21 117 — 0 0 — —Georgia 11 5 16 180 194 — 0 1 3 8 — 0 0 — —Maryland 3 1 5 50 41 — 0 2 6 6 — 0 0 — —North Carolina — 0 28 115 102 — 0 2 5 13 — 0 0 — —South Carolina — 2 6 55 61 — 0 1 2 7 — 0 0 — —Virginia 1 2 7 87 90 — 0 3 6 15 — 0 0 — 1West Virginia — 0 2 7 15 — 0 1 — — — 0 0 — —
E.S. Central 3 6 14 237 251 — 0 1 5 16 — 0 0 — —Alabama 2 2 8 82 102 — 0 1 2 5 — 0 0 — —Kentucky 1 1 6 56 57 — 0 0 — — — 0 0 — —Mississippi — 1 4 34 38 — 0 1 1 1 — 0 0 — —Tennessee — 2 5 65 54 — 0 1 2 10 — 0 0 — —
W.S. Central 13 13 46 454 571 — 0 9 14 50 — 0 0 — —Arkansas 3 1 6 25 43 — 0 1 1 1 — 0 0 — —Louisiana 1 4 21 175 272 — 0 1 1 5 — 0 0 — —Oklahoma 1 1 7 55 47 — 0 1 — 3 — 0 0 — —Texas 8 7 37 199 209 — 0 9 12 41 — 0 0 — —
Mountain 17 8 61 317 519 — 0 1 5 7 — 0 0 — —Arizona — 1 5 35 29 — 0 0 — 1 — 0 0 — —Colorado 1 1 5 48 73 — 0 0 — — — 0 0 — —Idaho 14 1 22 72 101 — 0 1 1 1 — 0 0 — —Montana 2 1 10 48 95 — 0 1 1 2 — 0 0 — —Nevada — 0 2 9 16 — 0 1 3 2 — 0 0 — —New Mexico — 1 5 57 32 — 0 0 — — — 0 0 — —Utah — 1 3 27 68 — 0 0 — — — 0 0 — —Wyoming — 0 22 21 105 — 0 0 — 1 — 0 0 — —
Pacific 7 10 26 354 478 — 1 7 48 86 — 0 0 — —Alaska — 0 1 2 4 — 0 1 2 1 — 0 0 — —California 7 6 15 231 204 — 1 7 38 70 — 0 0 — —Hawaii — 0 2 2 1 — 0 2 6 9 — 0 0 — —Oregon — 2 8 77 218 — 0 0 — — — 0 0 — —Washington — 0 11 42 51 — 0 2 2 6 — 0 0 — —
TerritoriesAmerican Samoa N — — N N — — — — — — — — — —C.N.M.I. — — — — — — — — — — — — — — —Guam — 0 0 — — — 0 0 — — — 0 0 — —Puerto Rico N 0 0 N N — 13 267 394 7,593 — 0 7 2 122U.S. Virgin Islands — 0 0 — — — 0 5 1 147 — 0 0 — 5
C.N.M.I.: Commonwealth of Northern Mariana Islands.U: Unavailable. —: No reported cases. N: Not reportable. NN: Not Nationally Notifiable. Cum: Cumulative year-to-date counts. Med: Median. Max: Maximum.* Case counts for reporting year 2013 and 2014 are provisional and subject to change. For further information on interpretation of these data, see http://wwwn.cdc.gov/nndss/document/
ProvisionalNationaNotifiableDiseasesSurveillanceData20100927.pdf. Data for TB are displayed in Table IV, which appears quarterly.† Dengue Fever includes cases that meet criteria for Dengue Fever with hemorrhage, other clinical and unknown case classifications.§ DHF includes cases that meet criteria for dengue shock syndrome (DSS), a more severe form of DHF.

Morbidity and Mortality Weekly Report
ND-512 MMWR / September 19, 2014 / Vol. 63 / No. 37
TABLE II. (Continued) Provisional cases of selected notifiable diseases, United States, weeks ending September 13, 2014, and September 14, 2013 (37th week)* (Export data)
Reporting area
Ehrlichiosis/Anaplasmosis†
Ehrlichia chaffeensis Anaplasma phagocytophilum Undetermined
Current week
Previous 52 weeks Cum 2014
Cum 2013
Current week
Previous 52 weeks Cum 2014
Cum 2013
Current week
Previous 52 weeks Cum 2014
Cum 2013Med Max Med Max Med Max
United States 14 17 100 1,045 1,165 8 28 97 1,067 1,894 1 2 11 89 166New England — 0 9 22 33 1 5 30 305 308 1 0 1 3 1
Connecticut — 0 0 — — — 0 6 39 116 — 0 0 — —Maine — 0 1 7 2 1 2 13 126 57 1 0 1 3 1Massachusetts — 0 0 — — — 0 0 — — — 0 0 — —New Hampshire — 0 1 1 7 — 0 6 45 65 — 0 1 — —Rhode Island — 0 9 13 18 — 0 11 56 46 — 0 0 — —Vermont — 0 1 1 6 — 1 4 39 24 — 0 1 — —
Mid. Atlantic 9 2 17 121 91 5 9 42 348 396 — 0 3 9 20New Jersey — 0 6 38 44 — 0 5 38 72 — 0 2 2 2New York (Upstate) 9 1 17 70 26 4 7 36 279 292 — 0 3 7 8New York City — 0 4 12 14 1 0 5 31 19 — 0 0 — —Pennsylvania — 0 1 1 7 — 0 5 — 13 — 0 2 — 10
E.N. Central — 1 5 53 78 — 5 44 341 580 — 0 6 44 79Illinois — 0 5 43 41 — 0 2 13 8 — 0 1 1 —Indiana — 0 0 — — — 0 0 — — — 0 5 18 39Michigan — 0 1 2 1 — 0 1 2 3 — 0 0 — 1Ohio — 0 1 4 8 — 0 1 1 3 — 0 1 1 1Wisconsin — 0 2 4 28 — 4 42 325 566 — 0 3 24 38
W.N. Central — 3 32 290 417 — 1 17 20 560 — 0 3 20 46Iowa N 0 0 N N N 0 0 N N N 0 0 N NKansas — 0 4 33 75 — 0 1 4 7 — 0 1 3 —Minnesota — 0 0 — 7 — 0 15 — 537 — 0 2 — 33Missouri — 2 28 251 328 — 0 2 11 8 — 0 3 17 10Nebraska — 0 2 5 6 — 0 1 1 1 — 0 0 — —North Dakota — 0 1 1 — — 0 1 4 7 — 0 0 — 3South Dakota — 0 0 — 1 — 0 0 — — — 0 0 — —
S. Atlantic 4 3 24 226 219 2 1 3 32 35 — 0 1 1 4Delaware — 0 5 20 13 — 0 1 2 — — 0 0 — 1District of Columbia N 0 0 N N N 0 0 N N N 0 0 N NFlorida — 0 3 24 16 — 0 2 6 2 — 0 0 — —Georgia — 0 5 23 17 — 0 0 — — — 0 0 — —Maryland 3 0 5 34 22 2 0 2 10 4 — 0 0 — 1North Carolina — 0 13 36 51 — 0 2 4 8 — 0 0 — —South Carolina — 0 2 8 7 — 0 0 — — — 0 0 — —Virginia 1 1 9 79 91 — 0 2 10 18 — 0 1 1 —West Virginia — 0 1 2 2 — 0 0 — 3 — 0 0 — 2
E.S. Central — 2 13 141 143 — 0 1 5 8 — 0 2 10 5Alabama — 0 2 9 10 — 0 1 4 2 — 0 1 1 —Kentucky — 1 6 57 54 — 0 0 — — — 0 0 — —Mississippi — 0 1 2 3 — 0 0 — 1 — 0 0 — 1Tennessee — 1 8 73 76 — 0 1 1 5 — 0 2 9 4
W.S. Central 1 3 63 192 183 — 0 8 16 7 — 0 0 — —Arkansas — 1 18 139 133 — 0 2 11 4 — 0 0 — —Louisiana — 0 1 2 1 — 0 0 — 1 — 0 0 — —Oklahoma — 0 62 42 44 — 0 8 3 2 — 0 0 — —Texas 1 0 2 9 5 — 0 1 2 — — 0 0 — —
Mountain — 0 1 — 1 — 0 1 — — — 0 0 — 2Arizona — 0 0 — — — 0 0 — — — 0 0 — 2Colorado N 0 0 N N N 0 0 N N N 0 0 N NIdaho N 0 0 N N N 0 0 N N N 0 0 N NMontana — 0 0 — 1 — 0 0 — — — 0 0 — —Nevada — 0 0 — — — 0 1 — — — 0 0 — —New Mexico N 0 0 N N N 0 0 N N N 0 0 N NUtah — 0 1 — — — 0 0 — — — 0 0 — —Wyoming — 0 0 — — — 0 0 — — — 0 0 — —
Pacific — 0 0 — — — 0 2 — — — 0 1 2 9Alaska N 0 0 N N N 0 0 N N N 0 0 N NCalifornia — 0 0 — — — 0 0 — — — 0 1 2 9Hawaii N 0 0 N N N 0 0 N N N 0 0 N NOregon — 0 0 — — — 0 1 — — — 0 0 — —Washington — 0 0 — — — 0 2 — — — 0 0 — —
TerritoriesAmerican Samoa N — — N N N — — N N N — — N NC.N.M.I. — — — — — — — — — — — — — — —Guam N 0 0 N N N 0 0 N N N 0 0 N NPuerto Rico N 0 0 N N N 0 0 N N N 0 0 N NU.S. Virgin Islands — 0 0 — — — 0 0 — — — 0 0 — —
C.N.M.I.: Commonwealth of Northern Mariana Islands.U: Unavailable. —: No reported cases. N: Not reportable. NN: Not Nationally Notifiable. Cum: Cumulative year-to-date counts. Med: Median. Max: Maximum.* Case counts for reporting year 2013 and 2014 are provisional and subject to change. For further information on interpretation of these data, see http://wwwn.cdc.gov/nndss/document/
ProvisionalNationaNotifiableDiseasesSurveillanceData20100927.pdf. Data for TB are displayed in Table IV, which appears quarterly.† Cumulative total E. ewingii cases reported for year 2013 = 31, and 10 cases reported for 2014.

Morbidity and Mortality Weekly Report
MMWR / September 19, 2014 / Vol. 63 / No. 37 ND-513
TABLE II. (Continued) Provisional cases of selected notifiable diseases, United States, weeks ending September 13, 2014, and September 14, 2013 (37th week)* (Export data)
Reporting area
Giardiasis GonorrheaHaemophilus influenzae, invasive†
All ages, all serotypes
Current week
Previous 52 weeks Cum 2014
Cum 2013
Current week
Previous 52 weeks Cum 2014
Cum 2013
Current week
Previous 52 weeks Cum 2014
Cum 2013Med Max Med Max Med Max
United States 217 244 439 8,592 10,286 3,462 6,146 7,239 218,552 233,597 20 62 110 2,241 2,785New England 7 23 59 810 952 71 130 179 4,526 4,628 — 4 16 149 261
Connecticut — 4 11 132 153 17 46 116 1,537 1,966 — 1 3 38 40Maine 3 4 12 103 141 6 5 9 170 190 — 0 2 14 18Massachusetts — 12 27 416 482 41 66 113 2,312 2,054 — 2 14 64 174New Hampshire 2 1 6 44 78 6 3 10 135 91 — 0 2 16 18Rhode Island — 0 7 31 22 — 8 41 318 263 — 0 9 10 4Vermont 2 3 16 84 76 1 1 6 54 64 — 0 2 7 7
Mid. Atlantic 57 51 94 1,768 1,904 612 745 926 26,466 28,749 8 10 24 385 440New Jersey — 5 12 138 257 44 125 164 4,393 4,908 — 2 7 102 87New York (Upstate) 25 17 61 653 593 175 117 339 4,133 4,385 1 3 17 90 113New York City 18 14 28 545 558 148 251 324 9,185 9,724 — 2 7 83 81Pennsylvania 14 13 28 432 496 245 248 319 8,755 9,732 7 3 7 110 159
E.N. Central 22 30 65 970 1,359 372 906 1,186 31,216 39,482 2 9 19 298 460Illinois — 1 22 29 218 18 195 364 6,246 11,670 — 2 6 84 119Indiana — 3 7 88 147 67 136 190 4,881 5,207 — 2 6 54 104Michigan 4 9 20 306 355 98 180 260 6,478 7,576 1 2 5 58 74Ohio 12 8 15 266 367 129 309 391 10,863 11,762 1 2 9 90 106Wisconsin 6 7 22 281 272 60 80 123 2,748 3,267 — 0 5 12 57
W.N. Central 1 15 59 507 1,097 52 328 411 11,436 12,376 1 4 14 165 198Iowa 1 4 13 140 181 11 28 43 1,026 1,051 — 0 1 2 —Kansas — 2 6 62 77 30 48 64 1,761 1,491 1 0 3 23 30Minnesota — 0 20 — 431 — 69 107 2,238 2,670 — 1 8 65 62Missouri — 4 12 113 168 — 140 178 4,822 5,293 — 1 6 52 77Nebraska — 2 9 81 121 11 27 56 994 981 — 0 3 17 19North Dakota — 1 3 26 32 — 10 22 363 340 — 0 2 6 7South Dakota — 2 7 85 87 — 10 26 232 550 — 0 0 — 3
S. Atlantic 30 47 87 1,678 1,745 1,127 1,402 1,750 50,007 51,824 5 16 30 595 701Delaware — 0 3 9 14 46 25 65 893 918 — 0 3 12 8District of Columbia — 1 4 16 62 — 0 82 — 1,768 — 0 1 2 11Florida 17 22 55 813 767 — 396 521 14,107 14,639 — 5 13 207 204Georgia — 12 26 407 446 341 251 612 8,494 10,127 3 2 8 93 114Maryland 6 4 8 149 165 126 109 169 3,726 3,889 2 2 5 62 72North Carolina N 0 0 N N 245 265 512 10,770 9,781 — 2 8 96 111South Carolina 2 2 9 97 89 152 157 279 5,632 5,126 — 1 4 44 83Virginia 5 5 11 149 170 200 149 372 5,786 4,795 — 1 7 53 72West Virginia — 1 4 38 32 17 16 32 599 781 — 0 4 26 26
E.S. Central 2 3 7 106 131 318 479 649 17,223 18,403 2 5 8 161 204Alabama 2 3 7 106 131 177 136 202 4,370 6,139 1 1 4 47 61Kentucky N 0 0 N N 84 79 113 2,766 3,052 — 0 3 18 37Mississippi N 0 0 N N — 129 362 5,483 3,812 — 0 2 25 25Tennessee N 0 0 N N 57 131 210 4,604 5,400 1 2 6 71 81
W.S. Central 4 7 19 249 252 133 898 1,327 30,738 36,285 1 4 11 143 137Arkansas 2 2 8 67 72 118 80 143 3,243 2,870 — 1 4 34 21Louisiana 2 5 15 182 180 — 96 397 2,405 5,461 — 1 6 38 35Oklahoma — 0 0 — — 15 89 134 2,968 3,648 1 2 5 63 79Texas N 0 0 N N — 633 779 22,122 24,306 — 0 1 8 2
Mountain 20 20 45 752 858 157 330 469 12,011 9,796 1 6 13 220 249Arizona — 2 7 67 81 114 145 262 5,310 3,849 — 1 8 70 93Colorado 11 6 17 237 259 18 56 90 1,950 1,935 1 1 6 35 63Idaho 4 2 9 111 107 — 4 15 116 116 — 0 3 15 10Montana 1 2 6 62 63 3 6 13 230 134 — 0 2 8 3Nevada — 1 5 35 64 — 53 124 2,068 1,827 — 0 2 13 11New Mexico — 1 7 63 82 5 41 81 1,376 1,298 — 1 3 33 34Utah 4 4 9 160 174 17 24 39 904 594 — 1 6 43 30Wyoming — 0 2 17 28 — 1 5 57 43 — 0 1 3 5
Pacific 74 51 125 1,752 1,988 620 961 1,126 34,929 32,054 — 3 8 125 135Alaska 6 1 6 61 50 8 25 44 891 753 — 0 3 16 11California 33 31 104 1,166 1,343 445 801 945 28,901 26,618 — 0 3 27 32Hawaii — 1 4 22 44 — 15 30 586 512 — 0 2 21 21Oregon 5 7 15 242 258 63 37 131 1,591 1,201 — 1 4 56 66Washington 30 8 66 261 293 104 86 121 2,960 2,970 — 0 3 5 5
TerritoriesAmerican Samoa — — — — — — — — — — — — — — —C.N.M.I. — — — — — — — — — — — — — — —Guam — 0 0 — 2 — 0 9 — 66 — 0 0 — —Puerto Rico — 0 9 20 34 — 8 30 318 251 — 0 1 — —U.S. Virgin Islands — 0 0 — — — 1 5 32 43 — 0 0 — —
C.N.M.I.: Commonwealth of Northern Mariana Islands.U: Unavailable. —: No reported cases. N: Not reportable. NN: Not Nationally Notifiable. Cum: Cumulative year-to-date counts. Med: Median. Max: Maximum.* Case counts for reporting year 2013 and 2014 are provisional and subject to change. For further information on interpretation of these data, see http://wwwn.cdc.gov/nndss/document/
ProvisionalNationaNotifiableDiseasesSurveillanceData20100927.pdf. Data for TB are displayed in Table IV, which appears quarterly.† Data for H. influenzae (age <5 yrs for serotype b, nonserotype b, and unknown serotype) are available in Table I.

Morbidity and Mortality Weekly Report
ND-514 MMWR / September 19, 2014 / Vol. 63 / No. 37
TABLE II. (Continued) Provisional cases of selected notifiable diseases, United States, weeks ending September 13, 2014, and September 14, 2013 (37th week)* (Export data)
Reporting area
Hepatitis (viral, acute), by type
A B C
Current week
Previous 52 weeks Cum 2014
Cum 2013
Current week
Previous 52 weeks Cum 2014
Cum 2013
Current week
Previous 52 weeks Cum 2014
Cum 2013Med Max Med Max Med Max
United States 14 22 55 765 1,293 32 55 112 1,916 2,064 4 37 67 1,193 1,449New England — 1 6 47 67 — 1 7 37 64 — 3 9 105 145
Connecticut — 0 3 18 15 — 0 2 6 4 — 0 1 4 —Maine — 0 2 2 3 — 0 1 8 9 — 0 2 21 6Massachusetts — 0 2 18 34 — 1 7 19 50 — 2 8 79 136New Hampshire — 0 1 3 6 — 0 2 — — N 0 0 N NRhode Island — 0 1 4 2 U 0 0 U U U 0 0 U UVermont — 0 1 2 7 — 0 2 4 1 — 0 1 1 3
Mid. Atlantic 1 3 14 103 203 8 3 8 113 170 2 5 15 166 212New Jersey — 0 3 11 52 — 0 2 2 51 — 1 4 25 77New York (Upstate) 1 1 5 28 50 1 1 3 28 31 2 2 11 68 67New York City — 1 7 33 60 6 1 4 39 56 — 0 4 14 10Pennsylvania — 1 4 31 41 1 1 4 44 32 — 1 5 59 58
E.N. Central 1 3 9 110 221 3 10 60 459 325 — 7 35 195 258Illinois — 1 5 34 46 — 1 5 36 63 — 0 2 16 29Indiana — 0 3 15 23 — 2 7 67 70 — 2 8 48 119Michigan 1 1 4 32 75 1 1 4 38 36 — 1 5 58 54Ohio — 0 4 23 47 2 4 12 146 151 — 2 30 68 26Wisconsin — 0 1 6 30 — 0 57 172 5 — 0 3 5 30
W.N. Central — 1 6 38 60 — 2 5 50 79 — 1 4 25 53Iowa — 0 3 7 5 — 0 2 7 8 — 0 0 — —Kansas — 0 3 3 10 — 0 1 5 9 — 0 3 18 12Minnesota — 0 2 3 25 — 0 1 1 16 — 0 3 1 36Missouri — 0 2 12 5 — 1 4 30 36 — 0 2 5 1Nebraska — 0 2 9 8 — 0 2 5 6 — 0 1 1 2North Dakota — 0 2 4 5 — 0 1 1 — — 0 1 — 2South Dakota — 0 1 — 2 — 0 1 1 4 — 0 1 — —
S. Atlantic 6 5 11 169 182 11 17 27 599 599 — 7 18 265 283Delaware — 0 1 — 2 — 0 1 4 9 U 0 0 U UDistrict of Columbia — 0 0 — — — 0 0 — — — 0 0 — —Florida 4 2 6 69 62 8 7 14 234 208 — 2 6 64 100Georgia 2 1 3 36 26 1 2 6 81 81 — 0 4 20 37Maryland — 0 3 17 22 — 1 3 25 33 — 1 3 29 38North Carolina — 0 2 20 36 — 0 16 72 46 — 1 9 64 46South Carolina — 0 1 4 9 1 1 3 22 35 — 0 1 3 —Virginia — 0 3 18 23 1 1 5 38 50 — 1 5 38 26West Virginia — 0 1 5 2 — 3 8 123 137 — 1 6 47 36
E.S. Central 1 1 4 28 43 5 11 17 372 426 1 6 13 211 267Alabama 1 0 2 9 6 1 2 5 74 60 — 0 5 20 22Kentucky — 0 2 8 18 — 4 8 103 138 — 4 8 118 168Mississippi — 0 1 3 4 2 1 3 28 42 U 0 0 U UTennessee — 0 1 8 15 2 5 10 167 186 1 2 4 73 77
W.S. Central 5 3 12 106 87 5 5 18 151 206 — 2 9 61 73Arkansas — 0 1 1 8 — 0 4 11 38 — 0 2 7 21Louisiana — 0 3 7 6 — 1 6 49 51 — 0 3 17 12Oklahoma — 0 4 12 7 — 0 5 19 26 — 0 5 10 24Texas 5 2 8 86 66 5 2 10 72 91 — 0 4 27 16
Mountain — 1 5 50 157 — 1 5 35 71 — 2 5 55 53Arizona — 0 3 13 57 — 0 2 9 18 U 0 0 U UColorado — 0 2 8 47 — 0 2 1 18 — 0 2 4 16Idaho — 0 1 4 6 — 0 2 6 8 — 0 1 4 7Montana — 0 1 5 5 — 0 1 — 2 — 0 2 10 13Nevada — 0 2 6 16 — 0 3 15 21 — 0 1 3 7New Mexico — 0 2 9 17 — 0 1 — 1 — 0 2 12 4Utah — 0 2 4 9 — 0 1 4 3 — 0 2 22 6Wyoming — 0 1 1 — — 0 0 — — — 0 0 — —
Pacific — 4 9 114 273 — 4 13 100 124 1 3 10 110 105Alaska — 0 1 1 1 — 0 1 2 1 — 0 0 — —California — 2 7 87 206 — 2 7 56 84 — 1 5 49 57Hawaii — 0 2 4 15 — 0 1 3 4 — 0 0 — —Oregon — 0 2 10 23 — 0 3 23 23 — 0 2 11 10Washington — 0 3 12 28 — 0 7 16 12 1 1 9 50 38
TerritoriesAmerican Samoa — — — — — — — — — — — — — — —C.N.M.I. — — — — — — — — — — — — — — —Guam — 0 4 — 23 — 0 7 — 53 — 0 7 — 50Puerto Rico — 0 1 2 8 — 0 2 9 32 N 0 0 N NU.S. Virgin Islands — 0 0 — — — 0 0 — — — 0 0 — —
C.N.M.I.: Commonwealth of Northern Mariana Islands.U: Unavailable. —: No reported cases. N: Not reportable. NN: Not Nationally Notifiable. Cum: Cumulative year-to-date counts. Med: Median. Max: Maximum.* Case counts for reporting year 2013 and 2014 are provisional and subject to change. For further information on interpretation of these data, see http://wwwn.cdc.gov/nndss/document/
ProvisionalNationaNotifiableDiseasesSurveillanceData20100927.pdf. Data for TB are displayed in Table IV, which appears quarterly.

Morbidity and Mortality Weekly Report
MMWR / September 19, 2014 / Vol. 63 / No. 37 ND-515
TABLE II. (Continued) Provisional cases of selected notifiable diseases, United States, weeks ending September 13, 2014, and September 14, 2013 (37th week)* (Export data)
Reporting area
Invasive Pneumococcal disease†
LegionellosisAll ages Age <5
Current week
Previous 52 weeks Cum 2014
Cum 2013
Current week
Previous 52 weeks Cum 2014
Cum 2013
Current week
Previous 52 weeks Cum 2014
Cum 2013Med Max Med Max Med Max
United States 82 277 752 9,322 12,038 8 21 56 655 808 60 76 170 2,927 3,684New England — 12 24 414 498 — 1 2 33 30 — 4 14 142 256
Connecticut — 4 10 156 243 — 0 1 7 12 — 1 3 33 47Maine — 2 8 99 87 — 0 1 5 4 — 0 4 14 13Massachusetts — 0 2 18 12 — 0 2 16 11 — 2 7 68 147New Hampshire — 1 6 59 62 — 0 1 4 3 — 0 3 9 19Rhode Island — 1 10 46 50 — 0 1 1 — — 0 10 13 18Vermont — 1 4 36 44 — 0 0 — — — 0 2 5 12
Mid. Atlantic 19 31 115 1,016 1,659 — 2 10 46 85 29 18 48 691 1,122New Jersey — 1 19 32 443 — 0 2 2 27 — 2 7 70 207New York (Upstate) 13 15 76 552 711 — 1 6 25 34 12 6 23 283 337New York City 6 12 25 432 505 — 0 4 19 24 9 3 15 134 246Pennsylvania N 0 0 N N N 0 0 N N 8 5 17 204 332
E.N. Central 9 53 84 1,636 2,235 — 3 9 103 127 7 16 43 604 1,025Illinois N 0 0 N N — 1 3 25 30 — 4 14 133 222Indiana — 10 33 339 497 — 0 4 20 21 — 2 8 84 67Michigan 3 12 21 382 557 — 0 4 19 31 — 3 9 88 217Ohio 4 20 38 652 863 — 1 4 30 28 7 6 22 266 411Wisconsin 2 6 16 263 318 — 0 3 9 17 — 1 7 33 108
W.N. Central — 16 37 442 762 — 1 4 31 70 1 3 20 131 136Iowa N 0 0 N N N 0 0 N N — 0 2 19 9Kansas — 2 9 91 107 N 0 0 N N — 0 1 7 13Minnesota — 5 18 159 394 — 0 3 8 29 1 1 4 33 35Missouri N 0 0 N N — 0 2 14 24 — 1 11 54 58Nebraska — 3 8 89 109 — 0 2 7 8 — 0 2 9 14North Dakota — 1 4 43 79 — 0 1 2 9 — 0 1 3 1South Dakota — 2 5 60 73 N 0 0 N N — 0 2 6 6
S. Atlantic 17 57 135 2,152 2,626 5 4 10 167 209 14 15 33 590 553Delaware — 0 5 25 23 — 0 1 1 — — 0 2 13 14District of Columbia — 1 6 44 64 — 0 1 1 1 — 0 1 — 11Florida 5 16 45 664 829 2 1 5 58 67 6 5 15 196 154Georgia 4 17 61 622 778 2 1 5 42 63 — 1 9 53 53Maryland 3 7 20 307 366 — 0 4 20 20 5 2 10 95 126North Carolina — 0 0 — — N 0 0 N N — 2 11 114 62South Carolina 5 7 27 306 320 1 0 2 21 15 — 0 3 31 17Virginia — 0 3 14 — — 0 3 14 29 3 1 8 64 94West Virginia — 4 16 170 246 — 0 2 10 14 — 0 4 24 22
E.S. Central 12 25 51 967 1,077 1 1 6 68 68 1 4 19 221 130Alabama 1 3 10 143 138 — 0 2 10 15 — 1 10 44 17Kentucky 1 3 10 133 202 — 0 2 8 9 — 1 8 56 34Mississippi 1 3 13 161 172 — 0 2 16 13 — 0 2 13 15Tennessee 9 15 28 530 565 1 1 4 34 31 1 2 12 108 64
W.S. Central 13 35 305 1,368 1,535 1 4 20 130 115 4 5 29 214 145Arkansas — 4 30 151 155 — 0 2 9 7 — 0 5 26 18Louisiana — 6 23 266 257 — 0 2 17 17 2 0 4 35 23Oklahoma — 0 0 — — — 0 2 20 13 — 0 4 10 7Texas 13 25 263 951 1,123 1 2 18 84 78 2 4 24 143 97
Mountain 12 30 81 1,205 1,521 1 2 7 64 89 4 3 11 97 126Arizona 4 13 40 548 616 — 0 6 27 32 2 1 4 36 52Colorado 4 8 24 260 384 — 0 2 11 22 1 0 7 19 22Idaho N 0 0 N N — 0 1 3 3 1 0 2 6 7Montana — 1 4 27 20 — 0 0 — 1 — 0 1 2 8Nevada — 3 7 96 98 — 0 2 6 4 — 0 3 15 16New Mexico 4 5 16 231 246 1 0 3 12 9 — 0 1 3 8Utah — 0 11 28 141 — 0 2 3 18 — 0 3 15 13Wyoming — 0 3 15 16 — 0 1 2 — — 0 1 1 —
Pacific — 3 8 122 125 — 0 3 13 15 — 6 15 237 191Alaska — 1 5 59 72 — 0 2 6 12 — 0 1 2 1California N 0 0 N N N 0 0 N N — 5 11 187 154Hawaii — 2 6 63 53 — 0 2 7 3 — 0 1 5 5Oregon N 0 0 N N N 0 0 N N — 0 3 18 11Washington N 0 0 N N N 0 0 N N — 0 6 25 20
TerritoriesAmerican Samoa N — — N N — — — — — N — — N NC.N.M.I. — — — — — — — — — — — — — — —Guam — 0 2 — 15 — 0 0 — — — 0 0 — —Puerto Rico — 0 0 — — — 0 0 — — — 0 1 1 13U.S. Virgin Islands — 0 0 — — — 0 0 — — — 0 0 — —
C.N.M.I.: Commonwealth of Northern Mariana Islands.U: Unavailable. —: No reported cases. N: Not reportable. NN: Not Nationally Notifiable. Cum: Cumulative year-to-date counts. Med: Median. Max: Maximum.* Case counts for reporting year 2013 and 2014 are provisional and subject to change. For further information on interpretation of these data, see http://wwwn.cdc.gov/nndss/document/
ProvisionalNationaNotifiableDiseasesSurveillanceData20100927.pdf. Data for TB are displayed in Table IV, which appears quarterly.† Includes drug resistant and susceptible cases of Invasive Pneumococcal Disease. This condition was previously named Streptococcus pneumoniae invasive disease and cases were reported
to CDC using different event codes to specify whether the cases were drug resistant or in a defined age group, such as <5 years. Since 2010, case notifications for this condition were consolidated under one event code for Invasive pneumococcal disease.

Morbidity and Mortality Weekly Report
ND-516 MMWR / September 19, 2014 / Vol. 63 / No. 37
TABLE II. (Continued) Provisional cases of selected notifiable diseases, United States, weeks ending September 13, 2014, and September 14, 2013 (37th week)* (Export data)
Reporting area
Lyme disease MalariaMeningococcal disease, invasive†
All serogroups
Current week
Previous 52 weeks Cum 2014
Cum 2013
Current week
Previous 52 weeks Cum 2014
Cum 2013
Current week
Previous 52 weeks Cum 2014
Cum 2013Med Max Med Max Med Max
United States 289 428 1,479 19,456 28,724 31 26 51 1,013 1,169 2 8 24 294 414New England 4 124 432 5,644 10,608 — 2 8 65 97 — 0 3 9 18
Connecticut — 20 139 1,296 2,510 — 0 2 8 18 — 0 1 1 2Maine — 15 85 818 1,070 — 0 2 4 6 — 0 1 — 2Massachusetts — 37 219 2,144 4,463 — 1 3 31 60 — 0 3 7 8New Hampshire — 10 48 459 1,444 — 0 2 6 9 — 0 0 — 2Rhode Island — 9 74 514 399 — 0 8 12 — — 0 1 1 1Vermont 4 9 48 413 722 — 0 2 4 4 — 0 1 — 3
Mid. Atlantic 231 181 824 10,215 10,870 20 8 21 293 293 — 1 3 29 62New Jersey — 37 130 1,689 3,110 — 1 5 49 73 — 0 2 5 12New York (Upstate) 118 48 226 2,211 2,472 3 1 5 49 41 — 0 3 6 17New York City 39 3 441 569 590 16 3 13 146 126 — 0 2 9 14Pennsylvania 74 61 555 5,746 4,698 1 1 4 49 53 — 0 2 9 19
E.N. Central 2 16 104 1,128 2,249 2 2 6 78 117 — 1 4 32 44Illinois — 1 18 149 313 — 0 3 22 57 — 0 2 10 7Indiana — 0 7 43 99 — 0 3 11 15 — 0 1 3 14Michigan — 2 9 80 130 — 0 2 11 15 — 0 2 8 3Ohio 2 1 10 72 79 2 1 3 30 21 — 0 2 7 9Wisconsin — 12 80 784 1,628 — 0 2 4 9 — 0 1 4 11
W.N. Central — 6 63 185 2,325 — 1 4 46 88 — 0 3 17 31Iowa — 1 18 138 226 — 0 2 8 10 — 0 1 1 1Kansas — 0 3 12 26 — 0 2 9 7 — 0 1 1 3Minnesota — 0 55 3 2,032 — 0 3 2 54 — 0 2 4 9Missouri — 0 2 10 2 — 0 1 13 4 — 0 1 7 8Nebraska — 0 4 11 8 — 0 2 6 3 — 0 1 — 3North Dakota — 0 4 9 27 — 0 1 6 3 — 0 1 2 3South Dakota — 0 1 2 4 — 0 1 2 7 — 0 1 2 4
S. Atlantic 47 46 309 2,048 2,331 3 7 16 303 301 1 1 6 66 77Delaware 9 8 24 319 374 — 0 1 2 9 — 0 1 1 2District of Columbia — 0 4 13 24 — 0 2 3 12 — 0 0 — —Florida 2 2 12 91 94 — 1 4 40 41 1 1 3 31 43Georgia — 0 3 3 6 — 1 5 68 53 — 0 2 10 10Maryland 17 15 60 707 913 2 2 8 103 108 — 0 1 4 3North Carolina — 0 27 65 109 — 0 7 25 16 — 0 3 11 10South Carolina — 1 5 21 25 — 0 1 4 8 — 0 1 3 2Virginia 16 16 267 737 669 1 1 5 56 53 — 0 2 6 5West Virginia 3 2 13 92 117 — 0 1 2 1 — 0 0 — 2
E.S. Central — 2 11 105 64 — 1 5 36 28 1 0 2 14 9Alabama — 0 7 49 22 — 0 3 10 2 — 0 1 5 2Kentucky — 1 9 39 30 — 0 2 9 9 — 0 1 2 1Mississippi — 0 0 — — — 0 1 1 3 — 0 1 1 3Tennessee — 0 4 17 12 — 0 2 16 14 1 0 1 6 3
W.S. Central 2 0 13 19 52 1 1 21 65 72 — 1 6 31 41Arkansas — 0 0 — — — 0 1 2 1 — 0 1 1 5Louisiana — 0 1 2 — — 0 1 11 8 — 0 2 6 9Oklahoma — 0 2 — 1 1 0 2 3 9 — 0 2 7 6Texas 2 0 11 17 51 — 1 19 49 54 — 0 5 17 21
Mountain 1 1 6 39 76 — 1 6 35 71 — 0 3 21 31Arizona 1 0 4 15 20 — 0 3 15 26 — 0 2 9 10Colorado — 0 0 — — — 0 3 7 28 — 0 1 1 6Idaho — 0 1 7 14 — 0 1 2 3 — 0 1 2 4Montana — 0 2 6 12 — 0 1 1 — — 0 1 4 —Nevada — 0 2 6 7 — 0 2 7 7 — 0 1 2 1New Mexico — 0 1 — 5 — 0 1 1 1 — 0 1 2 1Utah — 0 1 3 15 — 0 1 2 6 — 0 1 1 7Wyoming — 0 1 2 3 — 0 0 — — — 0 0 — 2
Pacific 2 2 6 73 149 5 3 9 92 102 — 2 7 75 101Alaska 1 0 2 8 9 — 0 1 1 3 — 0 0 — —California — 0 3 4 98 1 2 5 51 70 — 1 5 49 83Hawaii N 0 0 N N — 0 1 2 1 — 0 1 2 1Oregon 1 1 4 54 35 1 0 2 12 9 — 0 3 14 9Washington — 0 4 7 7 3 0 3 26 19 — 0 5 10 8
TerritoriesAmerican Samoa N — — N N — — — — — — — — — —C.N.M.I. — — — — — — — — — — — — — — —Guam — 0 0 — — — 0 0 — — — 0 0 — 1Puerto Rico N 0 0 N N — 0 1 1 — — 0 1 1 1U.S. Virgin Islands N 0 0 N N — 0 0 — — — 0 0 — —
C.N.M.I.: Commonwealth of Northern Mariana Islands.U: Unavailable. —: No reported cases. N: Not reportable. NN: Not Nationally Notifiable. Cum: Cumulative year-to-date counts. Med: Median. Max: Maximum.* Case counts for reporting year 2013 and 2014 are provisional and subject to change. For further information on interpretation of these data, see http://wwwn.cdc.gov/nndss/document/
ProvisionalNationaNotifiableDiseasesSurveillanceData20100927.pdf. Data for TB are displayed in Table IV, which appears quarterly.† Data for meningococcal disease, invasive caused by serogroups A, C, Y, and W-135; serogroup B; other serogroup; and unknown serogroup are available in Table I.

Morbidity and Mortality Weekly Report
MMWR / September 19, 2014 / Vol. 63 / No. 37 ND-517
TABLE II. (Continued) Provisional cases of selected notifiable diseases, United States, weeks ending September 13, 2014, and September 14, 2013 (37th week)* (Export data)
Reporting area
Mumps Pertussis Rabies, animal
Current week
Previous 52 weeks Cum 2014
Cum 2013
Current week
Previous 52 weeks Cum 2014
Cum 2013
Current week
Previous 52 weeks Cum 2014
Cum 2013Med Max Med Max Med Max
United States 1 11 117 1,006 483 218 575 1,036 19,783 18,904 66 58 137 1,942 2,781New England — 0 2 7 74 10 14 41 621 895 5 5 16 214 230
Connecticut — 0 0 — 4 — 1 6 36 28 1 3 8 110 108Maine — 0 0 — 1 10 5 27 308 267 2 1 3 34 37Massachusetts — 0 2 5 65 — 3 12 109 287 — 0 0 — —New Hampshire — 0 2 2 1 — 1 4 48 113 1 0 2 11 26Rhode Island — 0 1 — 2 — 1 23 81 93 — 0 4 18 21Vermont — 0 0 — 1 — 0 5 39 107 1 1 4 41 38
Mid. Atlantic — 3 25 154 93 21 34 63 1,269 1,348 13 9 24 256 556New Jersey — 0 11 31 47 — 6 14 190 299 — 0 0 — —New York (Upstate) — 0 2 9 6 18 13 40 546 499 13 6 15 256 257New York City — 1 24 105 23 — 2 10 54 82 — 0 5 — 41Pennsylvania — 0 2 9 17 3 12 26 479 468 — 0 12 — 258
E.N. Central 1 5 107 739 43 32 93 200 3,035 2,916 7 1 10 74 129Illinois — 1 15 115 23 — 12 35 343 510 2 0 6 33 39Indiana — 0 3 21 2 — 8 29 230 337 — 0 1 — 8Michigan — 0 1 9 5 8 20 44 727 577 — 0 5 22 32Ohio 1 2 97 534 11 23 28 104 1,084 691 5 0 3 19 50Wisconsin — 0 10 60 2 1 24 54 651 801 N 0 0 N N
W.N. Central — 0 6 19 9 — 41 95 1,175 1,560 1 2 11 82 182Iowa — 0 1 3 1 — 3 13 117 225 — 0 0 — —Kansas — 0 1 1 — — 8 22 216 206 — 1 4 34 47Minnesota — 0 6 11 2 — 11 28 329 578 — 0 4 — 43Missouri — 0 2 4 5 — 9 33 271 303 — 0 3 22 34Nebraska — 0 0 — — — 3 15 127 155 — 0 2 10 34North Dakota — 0 0 — 1 — 1 8 32 64 — 0 0 — —South Dakota — 0 0 — — — 2 11 83 29 1 0 2 16 24
S. Atlantic — 0 9 39 202 31 54 100 2,085 1,720 2 9 23 336 670Delaware — 0 0 — — — 1 35 200 27 — 0 0 — —District of Columbia — 0 4 16 1 — 0 4 10 28 U 0 0 U UFlorida — 0 0 — 1 12 16 63 615 451 — 0 20 59 103Georgia — 0 4 4 1 — 6 20 246 223 — 0 8 — 227Maryland — 0 1 1 87 14 3 15 109 154 — 6 19 245 286North Carolina — 0 1 1 2 — 10 43 462 417 — 0 0 — —South Carolina — 0 1 1 1 2 3 9 106 165 — 0 0 — —Virginia — 0 8 16 109 3 9 30 325 245 — 0 0 — —West Virginia — 0 0 — — — 0 3 12 10 2 1 5 32 54
E.S. Central — 0 3 7 10 4 18 36 695 605 — 1 7 52 38Alabama — 0 1 2 4 3 4 13 201 150 — 1 7 44 23Kentucky — 0 1 1 2 1 7 28 225 230 — 0 2 7 12Mississippi — 0 0 — — — 1 5 59 41 — 0 1 1 3Tennessee — 0 3 4 4 — 5 16 210 184 — 0 0 — —
W.S. Central — 0 3 13 14 53 67 499 2,116 2,944 38 22 78 773 750Arkansas — 0 1 1 3 — 7 30 210 301 7 1 23 126 120Louisiana — 0 1 — 1 — 2 8 62 163 — 0 1 — 6Oklahoma — 0 1 2 1 — 0 112 86 109 1 1 31 79 37Texas — 0 3 10 9 53 56 353 1,758 2,371 30 17 72 568 587
Mountain — 0 2 13 9 33 87 143 2,813 4,380 — 1 5 29 52Arizona — 0 2 9 1 — 13 42 354 1,159 N 0 0 N NColorado — 0 1 1 3 23 26 63 830 920 — 0 0 — —Idaho — 0 0 — — 8 6 23 294 161 — 0 3 — 19Montana — 0 0 — — 2 7 25 289 531 N 0 0 N NNevada — 0 2 2 3 — 2 11 92 141 — 0 3 8 12New Mexico — 0 1 — — — 7 24 244 424 — 0 2 7 7Utah — 0 1 1 2 — 19 38 657 982 — 0 2 14 9Wyoming — 0 0 — — — 1 6 53 62 — 0 2 — 5
Pacific — 0 2 15 29 34 96 324 5,974 2,536 — 3 14 126 174Alaska — 0 1 1 — 2 1 10 60 270 — 0 1 3 7California — 0 2 11 25 8 73 295 5,269 1,269 — 3 14 118 159Hawaii — 0 0 — — — 1 4 28 31 — 0 0 — —Oregon — 0 1 1 3 — 8 16 309 414 — 0 3 5 8Washington — 0 1 2 1 24 8 50 308 552 — 0 12 — —
TerritoriesAmerican Samoa — — — — — — — — — — N — — N NC.N.M.I. — — — — — — — — — — — — — — —Guam — 0 1 — 6 — 0 0 — — — 0 0 — —Puerto Rico — 0 1 — 2 — 0 2 7 23 — 0 5 31 44U.S. Virgin Islands — 0 0 — — — 0 0 — — — 0 0 — —
C.N.M.I.: Commonwealth of Northern Mariana Islands.U: Unavailable. —: No reported cases. N: Not reportable. NN: Not Nationally Notifiable. Cum: Cumulative year-to-date counts. Med: Median. Max: Maximum.* Case counts for reporting year 2013 and 2014 are provisional and subject to change. For further information on interpretation of these data, see http://wwwn.cdc.gov/nndss/document/
ProvisionalNationaNotifiableDiseasesSurveillanceData20100927.pdf. Data for TB are displayed in Table IV, which appears quarterly.

Morbidity and Mortality Weekly Report
ND-518 MMWR / September 19, 2014 / Vol. 63 / No. 37
TABLE II. (Continued) Provisional cases of selected notifiable diseases, United States, weeks ending September 13, 2014, and September 14, 2013 (37th week)* (Export data)
Reporting area
Salmonellosis Shiga toxin-producing E. coli (STEC)† Shigellosis
Current week
Previous 52 weeks Cum 2014
Cum 2013
Current week
Previous 52 weeks Cum 2014
Cum 2013
Current week
Previous 52 weeks Cum 2014
Cum 2013Med Max Med Max Med Max
United States 706 875 1,466 30,359 34,166 59 95 195 3,380 4,848 191 321 741 11,679 7,242New England 4 32 81 1,382 1,676 3 3 15 141 196 — 5 19 179 401
Connecticut — 7 21 335 344 — 1 5 34 52 — 1 4 34 38Maine 3 2 5 85 101 1 0 3 25 24 — 0 2 14 4Massachusetts — 16 44 693 917 — 1 6 56 81 — 2 9 95 132New Hampshire — 4 9 120 161 1 0 2 10 21 — 0 2 11 6Rhode Island — 2 8 84 94 — 0 2 4 — — 0 14 24 218Vermont 1 1 6 65 59 1 0 2 12 18 — 0 1 1 3
Mid. Atlantic 95 89 162 3,103 3,817 18 10 25 328 530 19 15 37 531 632New Jersey — 16 34 548 822 — 1 4 33 108 — 2 6 96 107New York (Upstate) 49 21 76 928 908 14 4 12 133 157 3 4 29 130 186New York City 30 18 40 690 844 4 1 5 53 73 11 6 11 214 230Pennsylvania 16 24 56 937 1,243 — 3 11 109 192 5 2 8 91 109
E.N. Central 42 92 176 3,469 4,133 4 12 33 458 791 11 28 116 1,919 1,016Illinois — 29 65 1,042 1,325 — 3 9 92 229 — 7 34 384 230Indiana — 12 36 441 515 — 2 9 69 86 1 5 54 691 74Michigan 8 17 50 700 737 1 2 12 89 130 1 3 19 202 123Ohio 34 22 46 869 869 3 3 15 132 163 7 10 22 427 558Wisconsin — 13 29 417 687 — 2 9 76 183 2 2 20 215 31
W.N. Central 6 40 84 1,439 2,448 — 12 31 457 813 4 34 80 1,367 303Iowa 1 9 24 348 451 — 2 14 145 145 2 6 45 138 54Kansas 5 7 16 278 321 — 1 7 67 71 — 0 4 35 37Minnesota — 0 22 — 599 — 0 11 — 245 — 0 6 — 98Missouri — 14 37 500 628 — 3 10 132 218 — 4 61 640 48Nebraska — 4 12 141 230 — 1 7 65 65 — 1 13 102 46North Dakota — 1 7 63 84 — 0 3 22 33 — 0 2 17 12South Dakota — 2 12 109 135 — 0 4 26 36 2 11 32 435 8
S. Atlantic 253 231 506 8,431 8,630 7 10 19 363 397 52 75 162 3,151 1,371Delaware — 2 10 86 84 — 0 2 8 11 — 1 4 46 3District of Columbia — 0 3 18 43 — 0 1 3 4 — 0 4 30 13Florida 156 115 228 3,704 3,734 7 2 9 114 83 35 40 96 1,768 541Georgia 32 32 100 1,312 1,481 — 2 6 70 97 9 19 34 574 486Maryland 24 14 49 623 610 — 1 8 51 42 7 3 12 173 77North Carolina — 22 181 981 1,076 — 0 5 26 50 — 4 119 362 104South Carolina 22 20 78 878 744 — 0 2 9 5 — 2 9 80 78Virginia 19 19 47 711 705 — 2 6 70 82 1 3 8 113 64West Virginia — 3 11 118 153 — 0 3 12 23 — 0 2 5 5
E.S. Central 34 56 150 2,365 2,287 6 5 15 226 248 10 34 66 1,071 577Alabama 7 19 80 737 663 — 0 3 34 43 1 6 13 202 192Kentucky — 10 27 413 387 3 1 6 65 85 1 2 15 148 49Mississippi 3 11 46 554 628 — 0 3 21 23 — 5 12 153 127Tennessee 24 16 36 661 609 3 2 9 106 97 8 18 50 568 209
W.S. Central 172 145 724 4,195 4,397 10 16 50 548 476 60 67 463 2,195 1,699Arkansas 26 14 36 398 421 — 2 6 63 59 8 9 198 714 148Louisiana 15 22 48 745 857 — 0 2 11 15 — 4 29 113 275Oklahoma 15 15 151 521 457 — 2 12 84 68 1 1 41 41 136Texas 116 89 543 2,531 2,662 10 11 40 390 334 51 45 393 1,327 1,140
Mountain 29 53 148 1,782 2,273 6 8 23 322 629 10 13 43 418 432Arizona 12 18 32 606 686 — 1 6 51 212 6 6 29 202 246Colorado 12 10 20 357 487 — 1 9 38 142 3 1 12 52 56Idaho 2 3 7 117 95 5 2 8 77 71 — 0 3 8 6Montana 2 2 8 91 70 1 1 4 30 36 — 0 10 9 32Nevada — 3 86 105 361 — 1 5 23 49 — 0 6 22 33New Mexico — 5 16 195 276 — 0 6 35 28 — 1 5 33 38Utah 1 6 17 265 240 — 1 5 51 71 1 0 2 20 18Wyoming — 1 4 46 58 — 0 5 17 20 — 1 6 72 3
Pacific 71 122 224 4,193 4,505 5 16 55 537 768 25 24 54 848 811Alaska — 1 6 54 67 — 0 0 — — — 0 1 3 1California 46 95 177 3,210 3,428 1 8 36 300 434 20 20 54 692 666Hawaii — 5 13 189 246 — 0 4 8 22 — 0 2 11 30Oregon 2 6 20 268 298 4 2 14 110 135 1 1 5 36 39Washington 23 10 47 472 466 — 3 31 119 177 4 2 12 106 75
TerritoriesAmerican Samoa — — — — — — — — — — — — — — —C.N.M.I. — — — — — — — — — — — — — — —Guam — 0 1 — 14 — 1 3 — 69 — 0 1 — 6Puerto Rico — 8 28 247 446 — 0 2 4 3 — 0 1 3 3U.S. Virgin Islands — 0 0 — — — 0 0 — — — 0 0 — —
C.N.M.I.: Commonwealth of Northern Mariana Islands.U: Unavailable. —: No reported cases. N: Not reportable. NN: Not Nationally Notifiable. Cum: Cumulative year-to-date counts. Med: Median. Max: Maximum.* Case counts for reporting year 2013 and 2014 are provisional and subject to change. For further information on interpretation of these data, see http://wwwn.cdc.gov/nndss/document/
ProvisionalNationaNotifiableDiseasesSurveillanceData20100927.pdf. Data for TB are displayed in Table IV, which appears quarterly.† Includes E. coli O157:H7; Shiga toxin-positive, serogroup non-O157; and Shiga toxin-positive, not serogrouped.

Morbidity and Mortality Weekly Report
MMWR / September 19, 2014 / Vol. 63 / No. 37 ND-519
TABLE II. (Continued) Provisional cases of selected notifiable diseases, United States, weeks ending September 13, 2014, and September 14, 2013 (37th week)* (Export data)
Reporting area
Spotted Fever Rickettsiosis (including RMSF)†
Syphilis, primary and secondaryConfirmed Probable
Current week
Previous 52 weeks Cum 2014
Cum 2013
Current week
Previous 52 weeks Cum 2014
Cum 2013
Current week
Previous 52 weeks Cum 2014
Cum 2013Med Max Med Max Med Max
United States 1 2 10 96 139 16 45 231 2,312 2,348 111 351 478 12,132 11,951New England — 0 1 1 1 — 0 1 5 8 1 10 19 307 346
Connecticut — 0 0 — — — 0 1 1 — — 1 5 52 41Maine — 0 0 — — — 0 1 2 2 1 0 4 11 10Massachusetts — 0 0 — — — 0 1 1 1 — 5 14 184 250New Hampshire — 0 1 1 1 — 0 1 1 3 — 0 2 16 20Rhode Island — 0 0 — — — 0 0 — 2 — 1 5 42 22Vermont — 0 0 — — — 0 0 — — — 0 1 2 3
Mid. Atlantic — 0 2 4 3 1 1 7 59 60 29 45 73 1,638 1,486New Jersey — 0 0 — 2 — 1 5 35 34 — 4 9 154 169New York (Upstate) — 0 2 3 1 1 0 6 9 11 14 6 48 271 169New York City — 0 1 — — — 0 2 8 2 3 24 37 864 820Pennsylvania — 0 1 1 — — 0 2 7 13 12 9 22 349 328
E.N. Central — 0 2 4 6 2 1 12 104 140 4 32 59 1,059 1,485Illinois — 0 1 2 3 — 1 10 68 88 1 11 27 346 600Indiana — 0 2 2 1 2 0 4 18 23 3 3 8 111 175Michigan — 0 0 — — — 0 1 2 3 — 8 17 230 345Ohio — 0 0 — 1 — 0 1 11 18 — 9 17 321 298Wisconsin — 0 0 — 1 — 0 2 5 8 — 1 5 51 67
W.N. Central — 0 2 11 9 — 3 22 229 230 1 15 26 530 465Iowa — 0 0 — — — 0 2 6 8 — 1 6 24 67Kansas — 0 0 — — — 0 0 — — 1 1 3 41 34Minnesota — 0 0 — 1 — 0 1 — 11 — 4 10 162 126Missouri — 0 2 8 2 — 3 20 213 196 — 6 11 232 181Nebraska — 0 1 2 5 — 0 2 8 8 — 1 3 36 30North Dakota — 0 1 1 — — 0 1 1 2 — 0 2 9 7South Dakota — 0 0 — 1 — 0 1 1 5 — 0 6 26 20
S. Atlantic — 1 6 49 89 6 11 89 584 615 46 90 215 3,092 2,629Delaware — 0 0 — — — 0 3 20 11 — 1 6 27 26District of Columbia — 0 1 — 3 — 0 0 — 1 — 0 8 — 117Florida — 0 2 5 4 — 1 3 28 13 — 32 45 1,098 1,005Georgia — 1 3 32 69 — 0 0 — — 22 23 151 835 539Maryland — 0 1 2 — — 0 2 13 7 6 9 16 292 300North Carolina — 0 2 5 9 — 2 66 250 270 8 12 29 443 231South Carolina — 0 1 — — — 0 3 19 45 5 4 13 165 189Virginia — 0 1 5 3 6 4 21 250 266 5 5 18 214 213West Virginia — 0 0 — 1 — 0 3 4 2 — 0 2 18 9
E.S. Central — 0 3 17 10 6 13 52 632 721 8 12 30 469 431Alabama — 0 2 6 1 1 4 12 155 190 1 3 7 91 135Kentucky — 0 1 — 2 1 0 5 39 55 7 2 8 101 85Mississippi — 0 1 2 1 — 0 2 7 30 — 3 27 151 58Tennessee — 0 2 9 6 4 6 42 431 446 — 4 9 126 153
W.S. Central 1 0 3 4 11 1 13 95 679 509 1 42 69 1,558 1,574Arkansas 1 0 0 1 4 — 11 53 493 337 1 3 9 87 126Louisiana — 0 0 — — — 0 2 12 3 — 9 22 281 266Oklahoma — 0 3 3 6 — 0 55 108 126 — 2 7 84 92Texas — 0 0 — 1 1 2 16 66 43 — 28 48 1,106 1,090
Mountain — 0 1 3 8 — 0 3 11 53 3 19 31 766 576Arizona — 0 1 1 6 — 0 2 6 39 — 8 16 313 199Colorado — 0 0 — — — 0 0 — 6 2 3 7 109 116Idaho — 0 0 — 1 — 0 0 — — — 0 2 4 10Montana — 0 1 1 — — 0 1 3 2 1 0 2 7 5Nevada — 0 0 — — — 0 1 1 1 — 5 20 242 123New Mexico — 0 1 1 1 — 0 1 1 2 — 2 6 77 60Utah — 0 0 — — — 0 1 — 3 — 0 3 14 62Wyoming — 0 0 — — — 0 1 — — — 0 0 — 1
Pacific — 0 1 3 2 — 0 2 9 12 18 80 102 2,713 2,959Alaska N 0 0 N N N 0 0 N N — 0 3 14 16California — 0 1 3 1 — 0 1 6 12 14 69 92 2,403 2,529Hawaii N 0 0 N N N 0 0 N N — 1 5 34 32Oregon — 0 0 — 1 — 0 1 3 — 1 5 11 167 198Washington — 0 0 — — — 0 2 — — 3 3 11 95 184
TerritoriesAmerican Samoa N — — N N N — — N N — — — — —C.N.M.I. — — — — — — — — — — — — — — —Guam N 0 0 N N N 0 0 N N — 0 0 — —Puerto Rico N 0 0 N N N 0 0 N N 8 7 29 331 306U.S. Virgin Islands N 0 0 N N N 0 0 N N — 0 0 — 1
C.N.M.I.: Commonwealth of Northern Mariana Islands.U: Unavailable. —: No reported cases. N: Not reportable. NN: Not Nationally Notifiable. Cum: Cumulative year-to-date counts. Med: Median. Max: Maximum.* Case counts for reporting year 2013 and 2014 are provisional and subject to change. For further information on interpretation of these data, see http://wwwn.cdc.gov/nndss/document/
ProvisionalNationaNotifiableDiseasesSurveillanceData20100927.pdf. Data for TB are displayed in Table IV, which appears quarterly.† Illnesses with similar clinical presentation that result from Spotted fever group rickettsia infections are reported as Spotted fever rickettsioses. Rocky Mountain spotted fever (RMSF) caused
by Rickettsia rickettsii, is the most common and well-known spotted fever.
Morbidity and Mortality Weekly Report
ND-520 MMWR / September 19, 2014 / Vol. 63 / No. 37
TABLE II. (Continued) Provisional cases of selected notifiable diseases, United States, weeks ending September 13, 2014, and September 14, 2013 (37th week)* (Export data)
Reporting area
Varicella (chickenpox)
West Nile virus disease†
Neuroinvasive Nonneuroinvasive§
Current week
Previous 52 weeks Cum 2014
Cum 2013
Current week
Previous 52 weeks Cum 2014
Cum 2013
Current week
Previous 52 weeks Cum 2014
Cum 2013Med Max Med Max Med Max
United States 114 194 294 6,051 7,763 — 1 164 388 911 2 1 134 327 973New England 3 20 49 723 755 — 0 2 2 7 — 0 1 — 5
Connecticut 1 4 9 125 153 — 0 1 1 — — 0 1 — 3Maine 2 3 10 123 100 — 0 0 — — — 0 0 — —Massachusetts — 9 20 289 352 — 0 1 1 5 — 0 0 — 1New Hampshire — 2 8 57 73 — 0 0 — 1 — 0 0 — —Rhode Island — 0 3 27 29 — 0 1 — 1 — 0 0 — —Vermont — 2 27 102 48 — 0 1 — — — 0 0 — 1
Mid. Atlantic 14 20 34 690 857 — 0 3 6 26 — 0 2 9 20New Jersey — 5 16 165 323 — 0 1 1 9 — 0 1 2 2New York (Upstate) N 0 0 N N — 0 2 — 5 — 0 2 4 11New York City — 0 0 — — — 0 2 3 6 — 0 2 2 2Pennsylvania 14 16 27 525 534 — 0 1 2 6 — 0 1 1 5
E.N. Central 23 55 92 1,641 1,793 — 0 26 14 112 — 0 5 7 45Illinois 1 12 27 402 475 — 0 21 4 51 — 0 3 4 25Indiana — 6 22 223 212 — 0 6 3 16 — 0 1 — 2Michigan 4 11 39 370 416 — 0 3 1 18 — 0 1 — 11Ohio 10 11 26 365 446 — 0 3 3 15 — 0 1 1 3Wisconsin 8 7 25 281 244 — 0 3 3 12 — 0 2 2 4
W.N. Central 6 6 33 174 900 — 0 40 29 211 — 0 68 82 343Iowa N 0 0 N N — 0 4 3 19 — 0 2 8 16Kansas — 0 15 — 353 — 0 8 2 15 — 0 16 8 31Minnesota — 0 16 5 336 — 0 3 1 27 — 0 6 5 46Missouri 6 3 16 135 152 — 0 5 2 11 — 0 1 2 2Nebraska — 0 3 6 6 — 0 14 8 30 — 0 29 28 115North Dakota — 0 4 12 24 — 0 9 7 60 — 0 7 2 53South Dakota — 0 3 16 29 — 0 5 6 49 — 0 8 29 80
S. Atlantic 24 24 54 815 995 — 0 9 15 27 1 0 3 4 13Delaware — 0 2 10 17 — 0 1 — 2 — 0 0 — —District of Columbia — 0 0 — 10 — 0 1 1 — — 0 1 1 1Florida 24 10 28 403 486 — 0 2 4 3 — 0 1 1 1Georgia — 0 10 32 44 — 0 2 5 3 — 0 1 — 4Maryland N 0 0 N N — 0 2 1 8 1 0 2 1 3North Carolina — 0 0 — — — 0 2 — 3 — 0 0 — —South Carolina — 2 10 92 122 — 0 1 2 1 — 0 0 — 4Virginia — 6 17 172 237 — 0 1 2 6 — 0 1 1 —West Virginia — 3 7 106 79 — 0 0 — 1 — 0 0 — —
E.S. Central 6 2 8 78 124 — 0 6 20 32 — 0 2 10 30Alabama 6 2 8 76 120 — 0 1 — 2 — 0 0 — 6Kentucky N 0 0 N N — 0 1 — — — 0 0 — 2Mississippi — 0 1 2 4 — 0 4 16 22 — 0 2 9 16Tennessee N 0 0 N N — 0 3 4 8 — 0 1 1 6
W.S. Central 25 35 107 1,209 1,527 — 0 29 95 142 1 0 17 77 72Arkansas — 2 17 78 164 — 0 3 2 11 — 0 1 — 1Louisiana — 0 4 25 51 — 0 7 32 28 — 0 8 37 12Oklahoma N 0 0 N N — 0 9 3 33 1 0 7 7 13Texas 25 31 98 1,106 1,312 — 0 15 58 70 — 0 9 33 46
Mountain 13 17 52 640 735 — 0 32 53 172 — 0 28 48 313Arizona 2 5 22 229 247 — 0 5 25 39 — 0 2 5 11Colorado 11 6 27 188 203 — 0 17 17 73 — 0 25 24 211Idaho N 0 0 N N — 0 2 4 12 — 0 4 9 24Montana — 1 5 60 66 — 0 2 2 9 — 0 2 2 26Nevada N 0 0 N N — 0 1 2 7 — 0 0 — 3New Mexico — 1 5 34 49 — 0 4 3 14 — 0 1 2 10Utah — 4 10 124 163 — 0 1 — 4 — 0 1 1 3Wyoming — 0 1 5 7 — 0 3 — 14 — 0 2 5 25
Pacific — 3 6 81 77 — 0 32 154 182 — 0 18 90 132Alaska — 1 6 33 33 — 0 0 — — — 0 0 — —California — 0 3 17 24 — 0 32 149 175 — 0 18 88 122Hawaii — 1 3 31 20 — 0 0 — — — 0 0 — —Oregon N 0 0 N N — 0 0 — 7 — 0 0 — 9Washington N 0 0 N N — 0 1 5 — — 0 1 2 1
TerritoriesAmerican Samoa N — — N N — — — — — — — — — —C.N.M.I. — — — — — — — — — — — — — — —Guam — 0 2 — 53 — 0 0 — — — 0 0 — —Puerto Rico — 4 14 131 225 — 0 0 — — — 0 0 — —U.S. Virgin Islands — 0 0 — — — 0 0 — — — 0 0 — —
C.N.M.I.: Commonwealth of Northern Mariana Islands.U: Unavailable. —: No reported cases. N: Not reportable. NN: Not Nationally Notifiable. Cum: Cumulative year-to-date counts. Med: Median. Max: Maximum.* Case counts for reporting year 2013 and 2014 are provisional and subject to change. For further information on interpretation of these data, see http://wwwn.cdc.gov/nndss/document/
ProvisionalNationaNotifiableDiseasesSurveillanceData20100927.pdf. Data for TB are displayed in Table IV, which appears quarterly.† Updated weekly from reports to the Division of Vector-Borne Infectious Diseases, National Center for Zoonotic, Vector-Borne, and Enteric Diseases (ArboNET Surveillance). Data for California
serogroup, eastern equine, Powassan, St. Louis, and western equine diseases are available in Table I.§ Not reportable in all states. Data from states where the condition is not reportable are excluded from this table, except starting in 2007 for the domestic arboviral diseases and influenza-
associated pediatric mortality, and in 2003 for SARS-CoV. Reporting exceptions are available at http://wwwn.cdc.gov/nndss/document/SRCA_FINAL_REPORT_2006-2012_final.xlsx.
Morbidity and Mortality Weekly Report
MMWR / September 19, 2014 / Vol. 63 / No. 37 ND-521
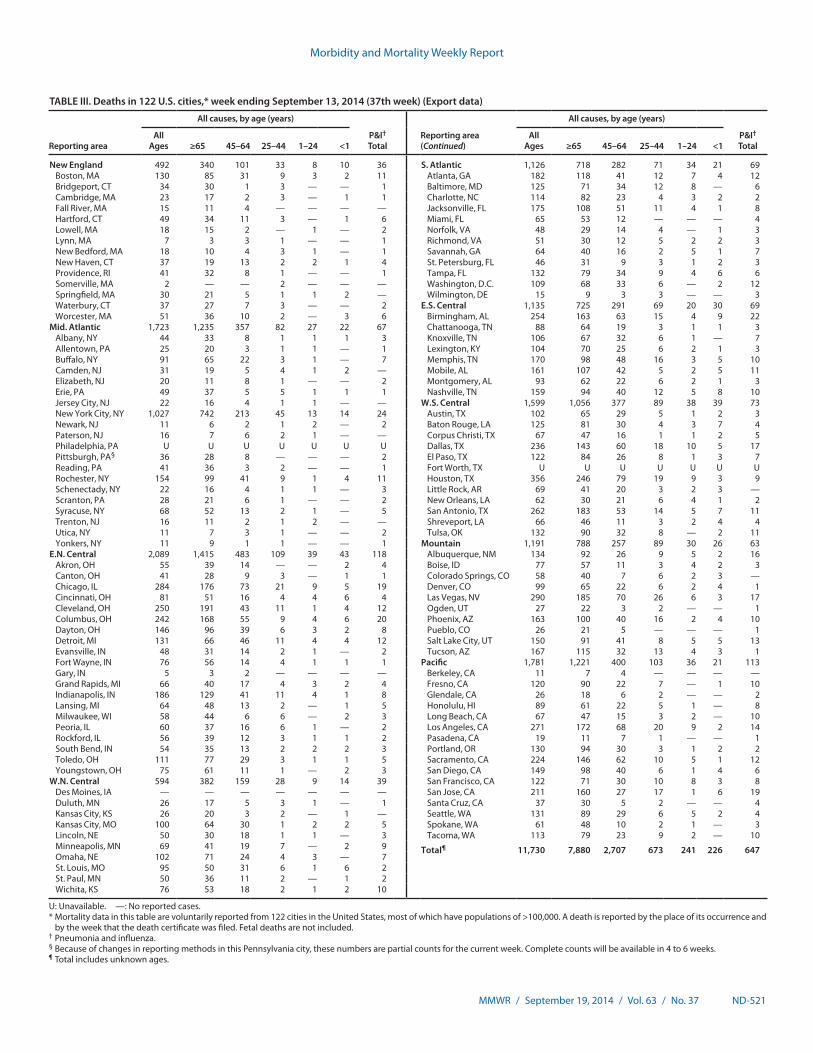
TABLE III. Deaths in 122 U.S. cities,* week ending September 13, 2014 (37th week) (Export data)
Reporting area
All causes, by age (years)
P&I† Total
Reporting area (Continued)
All causes, by age (years)
P&I† Total
All Ages ≥65 45–64 25–44 1–24 <1
All Ages ≥65 45–64 25–44 1–24 <1
New England 492 340 101 33 8 10 36 S. Atlantic 1,126 718 282 71 34 21 69Boston, MA 130 85 31 9 3 2 11 Atlanta, GA 182 118 41 12 7 4 12Bridgeport, CT 34 30 1 3 — — 1 Baltimore, MD 125 71 34 12 8 — 6Cambridge, MA 23 17 2 3 — 1 1 Charlotte, NC 114 82 23 4 3 2 2Fall River, MA 15 11 4 — — — — Jacksonville, FL 175 108 51 11 4 1 8Hartford, CT 49 34 11 3 — 1 6 Miami, FL 65 53 12 — — — 4Lowell, MA 18 15 2 — 1 — 2 Norfolk, VA 48 29 14 4 — 1 3Lynn, MA 7 3 3 1 — — 1 Richmond, VA 51 30 12 5 2 2 3New Bedford, MA 18 10 4 3 1 — 1 Savannah, GA 64 40 16 2 5 1 7New Haven, CT 37 19 13 2 2 1 4 St. Petersburg, FL 46 31 9 3 1 2 3Providence, RI 41 32 8 1 — — 1 Tampa, FL 132 79 34 9 4 6 6Somerville, MA 2 — — 2 — — — Washington, D.C. 109 68 33 6 — 2 12Springfield, MA 30 21 5 1 1 2 — Wilmington, DE 15 9 3 3 — — 3Waterbury, CT 37 27 7 3 — — 2 E.S. Central 1,135 725 291 69 20 30 69Worcester, MA 51 36 10 2 — 3 6 Birmingham, AL 254 163 63 15 4 9 22
Mid. Atlantic 1,723 1,235 357 82 27 22 67 Chattanooga, TN 88 64 19 3 1 1 3Albany, NY 44 33 8 1 1 1 3 Knoxville, TN 106 67 32 6 1 — 7Allentown, PA 25 20 3 1 1 — 1 Lexington, KY 104 70 25 6 2 1 3Buffalo, NY 91 65 22 3 1 — 7 Memphis, TN 170 98 48 16 3 5 10Camden, NJ 31 19 5 4 1 2 — Mobile, AL 161 107 42 5 2 5 11Elizabeth, NJ 20 11 8 1 — — 2 Montgomery, AL 93 62 22 6 2 1 3Erie, PA 49 37 5 5 1 1 1 Nashville, TN 159 94 40 12 5 8 10Jersey City, NJ 22 16 4 1 1 — — W.S. Central 1,599 1,056 377 89 38 39 73New York City, NY 1,027 742 213 45 13 14 24 Austin, TX 102 65 29 5 1 2 3Newark, NJ 11 6 2 1 2 — 2 Baton Rouge, LA 125 81 30 4 3 7 4Paterson, NJ 16 7 6 2 1 — — Corpus Christi, TX 67 47 16 1 1 2 5Philadelphia, PA U U U U U U U Dallas, TX 236 143 60 18 10 5 17Pittsburgh, PA§ 36 28 8 — — — 2 El Paso, TX 122 84 26 8 1 3 7Reading, PA 41 36 3 2 — — 1 Fort Worth, TX U U U U U U URochester, NY 154 99 41 9 1 4 11 Houston, TX 356 246 79 19 9 3 9Schenectady, NY 22 16 4 1 1 — 3 Little Rock, AR 69 41 20 3 2 3 —Scranton, PA 28 21 6 1 — — 2 New Orleans, LA 62 30 21 6 4 1 2Syracuse, NY 68 52 13 2 1 — 5 San Antonio, TX 262 183 53 14 5 7 11Trenton, NJ 16 11 2 1 2 — — Shreveport, LA 66 46 11 3 2 4 4Utica, NY 11 7 3 1 — — 2 Tulsa, OK 132 90 32 8 — 2 11Yonkers, NY 11 9 1 1 — — 1 Mountain 1,191 788 257 89 30 26 63
E.N. Central 2,089 1,415 483 109 39 43 118 Albuquerque, NM 134 92 26 9 5 2 16Akron, OH 55 39 14 — — 2 4 Boise, ID 77 57 11 3 4 2 3Canton, OH 41 28 9 3 — 1 1 Colorado Springs, CO 58 40 7 6 2 3 —Chicago, IL 284 176 73 21 9 5 19 Denver, CO 99 65 22 6 2 4 1Cincinnati, OH 81 51 16 4 4 6 4 Las Vegas, NV 290 185 70 26 6 3 17Cleveland, OH 250 191 43 11 1 4 12 Ogden, UT 27 22 3 2 — — 1Columbus, OH 242 168 55 9 4 6 20 Phoenix, AZ 163 100 40 16 2 4 10Dayton, OH 146 96 39 6 3 2 8 Pueblo, CO 26 21 5 — — — 1Detroit, MI 131 66 46 11 4 4 12 Salt Lake City, UT 150 91 41 8 5 5 13Evansville, IN 48 31 14 2 1 — 2 Tucson, AZ 167 115 32 13 4 3 1Fort Wayne, IN 76 56 14 4 1 1 1 Pacific 1,781 1,221 400 103 36 21 113Gary, IN 5 3 2 — — — — Berkeley, CA 11 7 4 — — — —Grand Rapids, MI 66 40 17 4 3 2 4 Fresno, CA 120 90 22 7 — 1 10Indianapolis, IN 186 129 41 11 4 1 8 Glendale, CA 26 18 6 2 — — 2Lansing, MI 64 48 13 2 — 1 5 Honolulu, HI 89 61 22 5 1 — 8Milwaukee, WI 58 44 6 6 — 2 3 Long Beach, CA 67 47 15 3 2 — 10Peoria, IL 60 37 16 6 1 — 2 Los Angeles, CA 271 172 68 20 9 2 14Rockford, IL 56 39 12 3 1 1 2 Pasadena, CA 19 11 7 1 — — 1South Bend, IN 54 35 13 2 2 2 3 Portland, OR 130 94 30 3 1 2 2Toledo, OH 111 77 29 3 1 1 5 Sacramento, CA 224 146 62 10 5 1 12Youngstown, OH 75 61 11 1 — 2 3 San Diego, CA 149 98 40 6 1 4 6
W.N. Central 594 382 159 28 9 14 39 San Francisco, CA 122 71 30 10 8 3 8Des Moines, IA — — — — — — — San Jose, CA 211 160 27 17 1 6 19Duluth, MN 26 17 5 3 1 — 1 Santa Cruz, CA 37 30 5 2 — — 4Kansas City, KS 26 20 3 2 — 1 — Seattle, WA 131 89 29 6 5 2 4Kansas City, MO 100 64 30 1 2 2 5 Spokane, WA 61 48 10 2 1 — 3Lincoln, NE 50 30 18 1 1 — 3 Tacoma, WA 113 79 23 9 2 — 10Minneapolis, MN 69 41 19 7 — 2 9 Total¶ 11,730 7,880 2,707 673 241 226 647Omaha, NE 102 71 24 4 3 — 7St. Louis, MO 95 50 31 6 1 6 2St. Paul, MN 50 36 11 2 — 1 2Wichita, KS 76 53 18 2 1 2 10
U: Unavailable. —: No reported cases.* Mortality data in this table are voluntarily reported from 122 cities in the United States, most of which have populations of >100,000. A death is reported by the place of its occurrence and
by the week that the death certificate was filed. Fetal deaths are not included.† Pneumonia and influenza.§ Because of changes in reporting methods in this Pennsylvania city, these numbers are partial counts for the current week. Complete counts will be available in 4 to 6 weeks.¶ Total includes unknown ages.


![Report of Mechanical Model - VGTUdspace.vgtu.lt/bitstream/1/3656/3/Annex B.pdf · 2018. 7. 16. · b1314 0[N] b1315 0[N] b1316 0[N] b1317 0[N] b1318 0[N] 7 Name Expression Description](https://static.fdocuments.us/doc/165x107/60a60787ba74840c8341baa4/report-of-mechanical-model-bpdf-2018-7-16-b1314-0n-b1315-0n-b1316.jpg)