Morbidity and Mortality Weekly Report · Morbidity and Mortality Weekly Report ... morbidity, and...
32
Morbidity and Mortality Weekly Report Weekly January 14, 2005 / Vol. 54 / No. 1 depar depar depar depar department of health and human ser tment of health and human ser tment of health and human ser tment of health and human ser tment of health and human services vices vices vices vices Centers for Disease Control and Prevention Centers for Disease Control and Prevention Centers for Disease Control and Prevention Centers for Disease Control and Prevention Centers for Disease Control and Prevention INSIDE 3 Differences in Disability Among Black and White Stroke Survivors — United States, 2000–2001 7 Racial/Ethnic Disparities in Prevalence, Treatment, and Control of Hypertension — United States, 1999–2002 9 Racial Disparities in Nationally Notifiable Diseases — United States, 2002 11 Reducing Childhood Asthma Through Community-Based Service Delivery — New York City, 2001–2004 14 Update: Influenza Activity — United States, 2004–05 Season 17 Notices to Readers 18 QuickStats Health Disparities Experienced by Black or African Americans — United States In the 2000 census, 36.4 million persons, approximately 12.9% of the U.S. population, identified themselves as Black or African American; 35.4 million of these persons identified themselves as non-Hispanic (1). For many health conditions, non-Hispanic blacks bear a disproportionate burden of disease, injury, death, and disability. Although the top three causes and seven of the 10 leading causes of death are the same for non- Hispanic blacks and non-Hispanic whites (the largest racial/ ethnic population in the United States), the risk factors and incidence, morbidity, and mortality rates for these diseases and injuries often are greater among blacks than whites. In addi- tion, three of the 10 leading causes of death for non-Hispanic blacks are not among the leading causes of death for non- Hispanic whites: homicide (sixth), human immunodeficiency virus (HIV) disease (seventh), and septicemia (ninth) (Table). This week’s MMWR is the third in a series* focusing on racial/ ethnic health disparities. Eliminating these disparities will require culturally appropriate public health initiatives, commu- nity support, and equitable access to quality health care. In 2002, non-Hispanic blacks who died from HIV disease had approximately 11 times † as many age-adjusted years of potential life lost before age 75 years per 100,000 population as non-Hispanic whites. Non-Hispanic blacks also had sub- stantially more years of potential life lost than non-Hispanic whites for homicide (nine times as many), stroke (three times as many), perinatal diseases (three times as many), and diabe- tes (three times as many) (2). Cancer is the second leading cause of death for both non- Hispanic blacks and non-Hispanic whites (Table). However, in 2001, the age-adjusted incidence per 100,000 population was substantially higher for black females than for white females for certain cancers, including colon/rectal (54.0 ver- sus 43.3), pancreatic (13.0 versus 8.9), and stomach (9.0 ver- sus 4.5) cancers. Among males, the age-adjusted incidence was higher for black males than for white males for certain cancers, including prostate (251.3 versus 167.8), lung/bron- chus (108.2 versus 72.8), colon/rectal (68.3 versus 58.9), and stomach (16.3 versus 10.0) cancers (3). Stroke is the third leading cause of death for both non- Hispanic blacks and non-Hispanic whites (Table). However, during 1999–2002, non-Hispanic black males and females aged 20–74 years had higher † age-adjusted rates per 100,000 population of hypertension than their white counterparts (36.8 versus 23.9 for males; 39.4 versus 23.3 for females) (4). Racial/ethnic health disparities are reflected in leading indi- cators of progress toward achievement of the national health objectives for 2010 (5). In 2002, non-Hispanic blacks trailed non-Hispanic whites in at least four positive health indica- tors † , including percentages of 1) persons aged <65 years with health insurance (81% of non-Hispanic blacks versus 87% of non-Hispanic whites), 2) adults aged >65 years vaccinated against influenza (50% versus 69%) and pneumococcal dis- *See also: CDC. Health disparities experienced by racial/ethnic minority populations. MMWR 2004;53:755. CDC. Health disparities experienced by Hispanics—United States. MMWR 2004;53:935–7. † Differences not tested for statistical significance.
Transcript of Morbidity and Mortality Weekly Report · Morbidity and Mortality Weekly Report ... morbidity, and...
Morbidity and Mortality Weekly Report
Weekly January 14, 2005 / Vol. 54 / No. 1
depardepardepardepardepartment of health and human sertment of health and human sertment of health and human sertment of health and human sertment of health and human servicesvicesvicesvicesvicesCenters for Disease Control and PreventionCenters for Disease Control and PreventionCenters for Disease Control and PreventionCenters for Disease Control and PreventionCenters for Disease Control and Prevention
INSIDE
3 Differences in Disability Among Black and White StrokeSurvivors — United States, 2000–2001
7 Racial/Ethnic Disparities in Prevalence, Treatment, andControl of Hypertension — United States, 1999–2002
9 Racial Disparities in Nationally Notifiable Diseases —United States, 2002
11 Reducing Childhood Asthma Through Community-BasedService Delivery — New York City, 2001–2004
14 Update: Influenza Activity — United States, 2004–05Season
17 Notices to Readers18 QuickStats
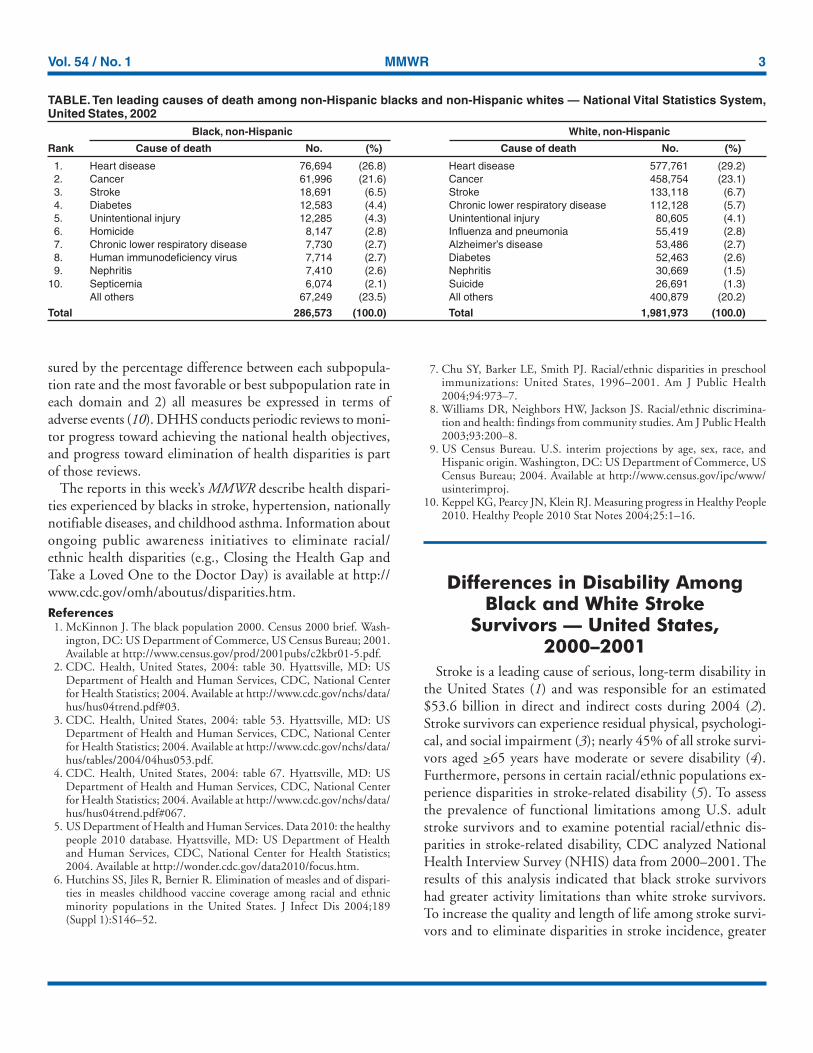
Health Disparities Experienced by Black or African Americans — United StatesIn the 2000 census, 36.4 million persons, approximately
12.9% of the U.S. population, identified themselves as Blackor African American; 35.4 million of these persons identifiedthemselves as non-Hispanic (1). For many health conditions,non-Hispanic blacks bear a disproportionate burden of disease,injury, death, and disability. Although the top three causes andseven of the 10 leading causes of death are the same for non-Hispanic blacks and non-Hispanic whites (the largest racial/ethnic population in the United States), the risk factors andincidence, morbidity, and mortality rates for these diseases andinjuries often are greater among blacks than whites. In addi-tion, three of the 10 leading causes of death for non-Hispanicblacks are not among the leading causes of death for non-Hispanic whites: homicide (sixth), human immunodeficiencyvirus (HIV) disease (seventh), and septicemia (ninth) (Table).This week’s MMWR is the third in a series* focusing on racial/ethnic health disparities. Eliminating these disparities willrequire culturally appropriate public health initiatives, commu-nity support, and equitable access to quality health care.
In 2002, non-Hispanic blacks who died from HIV diseasehad approximately 11 times† as many age-adjusted years ofpotential life lost before age 75 years per 100,000 populationas non-Hispanic whites. Non-Hispanic blacks also had sub-stantially more years of potential life lost than non-Hispanicwhites for homicide (nine times as many), stroke (three timesas many), perinatal diseases (three times as many), and diabe-tes (three times as many) (2).
Cancer is the second leading cause of death for both non-Hispanic blacks and non-Hispanic whites (Table). However,in 2001, the age-adjusted incidence per 100,000 populationwas substantially higher for black females than for white
females for certain cancers, including colon/rectal (54.0 ver-sus 43.3), pancreatic (13.0 versus 8.9), and stomach (9.0 ver-sus 4.5) cancers. Among males, the age-adjusted incidencewas higher for black males than for white males for certaincancers, including prostate (251.3 versus 167.8), lung/bron-chus (108.2 versus 72.8), colon/rectal (68.3 versus 58.9), andstomach (16.3 versus 10.0) cancers (3).
Stroke is the third leading cause of death for both non-Hispanic blacks and non-Hispanic whites (Table). However,during 1999–2002, non-Hispanic black males and femalesaged 20–74 years had higher† age-adjusted rates per 100,000population of hypertension than their white counterparts (36.8versus 23.9 for males; 39.4 versus 23.3 for females) (4).
Racial/ethnic health disparities are reflected in leading indi-cators of progress toward achievement of the national healthobjectives for 2010 (5). In 2002, non-Hispanic blacks trailednon-Hispanic whites in at least four positive health indica-tors†, including percentages of 1) persons aged <65 years withhealth insurance (81% of non-Hispanic blacks versus 87% ofnon-Hispanic whites), 2) adults aged >65 years vaccinatedagainst influenza (50% versus 69%) and pneumococcal dis-
* See also: CDC. Health disparities experienced by racial/ethnic minoritypopulations. MMWR 2004;53:755. CDC. Health disparities experienced byHispanics—United States. MMWR 2004;53:935–7.
† Differences not tested for statistical significance.
Please note: An erratum has been published for this issue. To view the erratum, please click here.
2 MMWR January 14, 2005
SUGGESTED CITATIONCenters for Disease Control and Prevention. [Article Title].MMWR 2005;54:[inclusive page numbers].
The MMWR series of publications is published by theCoordinating Center for Health Information and Service*,Centers for Disease Control and Prevention (CDC), U.S.Department of Health and Human Services, Atlanta, GA 30333.
Centers for Disease Control and Prevention
Julie L. Gerberding, MD, MPHDirector
Dixie E. Snider, MD, MPHChief of Science
Tanja Popovic, MD, PhD(Acting) Associate Director for Science
Coordinating Center for Health Informationand Service*
Blake Caldwell, MD, MPH, and Edward J. Sondik, PhD(Acting) Directors
National Center for Health Marketing*
Steven L. Solomon, MD(Acting) Director
Division of Scientific Communications*
John W. Ward, MD(Acting) Director
Editor, MMWR Series
Suzanne M. Hewitt, MPAManaging Editor, MMWR Series
Douglas W. Weatherwax(Acting) Lead Technical Writer-Editor
Stephanie M. MalloyJude C. RutledgeTeresa F. Rutledge
Writers-Editors
Lynda G. CupellMalbea A. LaPete
Visual Information Specialists
Kim L. Bright, MBAQuang M. Doan, MBA
Erica R. ShaverInformation Technology Specialists
Notifiable Disease Morbidity and 122 Cities Mortality DataPatsy A. Hall Donna EdwardsDeborah A. Adams Mechelle HesterFelicia J. Connor Tambra McGeeRosaline Dhara Pearl C. Sharp
* Proposed.
ease (37% versus 60%), 3) women receiving prenatal care inthe first trimester (75% versus 89%), and 4) persons aged>18 years who participated in regular moderate physicalactivity (25% versus 35%). In addition, non-Hispanic blackshad substantially higher proportions of certain negative healthindicators than non-Hispanic whites, including 1) new casesof gonorrhea (742 versus 31 per 100,000 population; 2002data), 2) deaths from homicide (21.6 versus 2.8; 2002 data),3) persons aged 6–19 years who were overweight or obese(22% versus 12%; 2000 data), and 4) adults who were obese(40% versus 29%; 2000 data).
Since the 1970s, racial/ethnic disparities in measles cases andmeasles-vaccine coverage have been all but eliminated (6). How-ever, during 1996–2001, the vaccination-coverage gap betweennon-Hispanic white and non-Hispanic black children widenedby an average of 1.1% each year for children aged 19–35 monthswho were up to date for the 4:3:1:3:3 series of vaccines (recom-mended to prevent diphtheria, tetanus, and pertussis; polio;measles; Haemophilus influenzae type b disease; and hepatitisB) (7). In 2002, among children aged 19–35 months, 68% ofnon-Hispanic black children were fully vaccinated, comparedwith 78% of non-Hispanic white children.Reported by: Office of Minority Health, Office of the Director, CDC.
Editorial Note: Multiple factors contribute to racial/ethnichealth disparities, including socioeconomic factors (e.g., edu-cation, employment, and income), lifestyle behaviors (e.g., physi-cal activity and alcohol intake), social environment (e.g.,educational and economic opportunities, racial/ethnic discrimi-nation, and neighborhood and work conditions), and access topreventive health-care services (e.g., cancer screening and vac-cination) (8). Recent immigrants also can be at increased riskfor chronic disease and injury, particularly those who lack flu-ency in English and familiarity with the U.S. health-care sys-tem or who have different cultural attitudes about the use oftraditional versus conventional medicine. Approximately 6%of persons who identified themselves as Black or African Ameri-can in the 2000 census were foreign-born.
For blacks in the United States, health disparities can meanearlier deaths, decreased quality of life, loss of economicopportunities, and perceptions of injustice. For society, thesedisparities translate into less than optimal productivity, higherhealth-care costs, and social inequity. By 2050, an estimated 61million black persons will reside in the United States, amount-ing to approximately 15% of the total U.S. population (9).
To promote consistency in measuring progress towardachieving the national health objectives, a workgroupappointed by the U.S. Department of Health and HumanServices (DHHS) has recommended that 1) progress towardeliminating disparities for individual subpopulations be mea-
Vol. 54 / No. 1 MMWR 3
sured by the percentage difference between each subpopula-tion rate and the most favorable or best subpopulation rate ineach domain and 2) all measures be expressed in terms ofadverse events (10). DHHS conducts periodic reviews to moni-tor progress toward achieving the national health objectives,and progress toward elimination of health disparities is partof those reviews.
The reports in this week’s MMWR describe health dispari-ties experienced by blacks in stroke, hypertension, nationallynotifiable diseases, and childhood asthma. Information aboutongoing public awareness initiatives to eliminate racial/ethnic health disparities (e.g., Closing the Health Gap andTake a Loved One to the Doctor Day) is available at http://www.cdc.gov/omh/aboutus/disparities.htm.References1. McKinnon J. The black population 2000. Census 2000 brief. Wash-
ington, DC: US Department of Commerce, US Census Bureau; 2001.Available at http://www.census.gov/prod/2001pubs/c2kbr01-5.pdf.
2. CDC. Health, United States, 2004: table 30. Hyattsville, MD: USDepartment of Health and Human Services, CDC, National Centerfor Health Statistics; 2004. Available at http://www.cdc.gov/nchs/data/hus/hus04trend.pdf#03.
3. CDC. Health, United States, 2004: table 53. Hyattsville, MD: USDepartment of Health and Human Services, CDC, National Centerfor Health Statistics; 2004. Available at http://www.cdc.gov/nchs/data/hus/tables/2004/04hus053.pdf.
4. CDC. Health, United States, 2004: table 67. Hyattsville, MD: USDepartment of Health and Human Services, CDC, National Centerfor Health Statistics; 2004. Available at http://www.cdc.gov/nchs/data/hus/hus04trend.pdf#067.
5. US Department of Health and Human Services. Data 2010: the healthypeople 2010 database. Hyattsville, MD: US Department of Healthand Human Services, CDC, National Center for Health Statistics;2004. Available at http://wonder.cdc.gov/data2010/focus.htm.
6. Hutchins SS, Jiles R, Bernier R. Elimination of measles and of dispari-ties in measles childhood vaccine coverage among racial and ethnicminority populations in the United States. J Infect Dis 2004;189(Suppl 1):S146–52.
7. Chu SY, Barker LE, Smith PJ. Racial/ethnic disparities in preschoolimmunizations: United States, 1996–2001. Am J Public Health2004;94:973–7.
8. Williams DR, Neighbors HW, Jackson JS. Racial/ethnic discrimina-tion and health: findings from community studies. Am J Public Health2003;93:200–8.
9. US Census Bureau. U.S. interim projections by age, sex, race, andHispanic origin. Washington, DC: US Department of Commerce, USCensus Bureau; 2004. Available at http://www.census.gov/ipc/www/usinterimproj.
10. Keppel KG, Pearcy JN, Klein RJ. Measuring progress in Healthy People2010. Healthy People 2010 Stat Notes 2004;25:1–16.
Differences in Disability AmongBlack and White Stroke
Survivors — United States,2000–2001
Stroke is a leading cause of serious, long-term disability inthe United States (1) and was responsible for an estimated$53.6 billion in direct and indirect costs during 2004 (2).Stroke survivors can experience residual physical, psychologi-cal, and social impairment (3); nearly 45% of all stroke survi-vors aged >65 years have moderate or severe disability (4).Furthermore, persons in certain racial/ethnic populations ex-perience disparities in stroke-related disability (5). To assessthe prevalence of functional limitations among U.S. adultstroke survivors and to examine potential racial/ethnic dis-parities in stroke-related disability, CDC analyzed NationalHealth Interview Survey (NHIS) data from 2000–2001. Theresults of this analysis indicated that black stroke survivorshad greater activity limitations than white stroke survivors.To increase the quality and length of life among stroke survi-vors and to eliminate disparities in stroke incidence, greater
TABLE. Ten leading causes of death among non-Hispanic blacks and non-Hispanic whites — National Vital Statistics System,United States, 2002
Black, non-Hispanic White, non-Hispanic
Rank Cause of death No. (%) Cause of death No. (%)
1. Heart disease 76,694 (26.8) Heart disease 577,761 (29.2)2. Cancer 61,996 (21.6) Cancer 458,754 (23.1)3. Stroke 18,691 (6.5) Stroke 133,118 (6.7)4. Diabetes 12,583 (4.4) Chronic lower respiratory disease 112,128 (5.7)5. Unintentional injury 12,285 (4.3) Unintentional injury 80,605 (4.1)6. Homicide 8,147 (2.8) Influenza and pneumonia 55,419 (2.8)7. Chronic lower respiratory disease 7,730 (2.7) Alzheimer’s disease 53,486 (2.7)8. Human immunodeficiency virus 7,714 (2.7) Diabetes 52,463 (2.6)9. Nephritis 7,410 (2.6) Nephritis 30,669 (1.5)
10. Septicemia 6,074 (2.1) Suicide 26,691 (1.3)All others 67,249 (23.5) All others 400,879 (20.2)
Total 286,573 (100.0) Total 1,981,973 (100.0)
4 MMWR January 14, 2005
efforts are needed to implement stroke prevention and inter-vention activities among black populations, particularly youngto middle-aged adults. Increasing public awareness of stroke-related warning signs and encouraging patients to seek imme-diate treatment might reduce stroke-related disabilities andcosts.
NHIS is a household survey designed and conducted annu-ally by CDC to collect self-reported information from a rep-resentative sample of the U.S. civilian, noninstitutionalizedpopulation. Data collected in 2000 and 2001 were combined.Respondents who reported having ever been told by a doctoror other health professional that they had had a stroke wereidentified as stroke survivors. Stroke survivors were asked abouttheir ability to perform the following 12 activities: 1) walk aquarter mile (i.e., approximately three city blocks); 2) walkup 10 steps without resting; 3) stand or be on feet forapproximately 2 hours; 4) sit for approximately 2 hours; 5)stoop, bend, or kneel; 6) reach up over head; 7) use fingers tograsp or handle small objects; 8) lift or carry something asheavy as 10 pounds (e.g., a full bag of groceries); 9) push orpull large objects (e.g., living room chair); 10) go out (e.g.,shopping, movies, or sporting events); 11) participate insocial activities (e.g., visit friends, attend clubs or meetings, orgo to parties; and 12) do things to relax at home or for leisure(e.g., read, watch TV, sew, or listen to music). Limitation ofactivity was defined as a reported response of either “very dif-ficult” or “can’t do at all” (compared with “not at all difficult,”“only a little difficult,” “somewhat difficult,” or “do not dothis activity”). The need for special equipment (e.g., cane,wheelchair, special bed, or special telephone) was also assessed.
A total of 65,700 persons aged >18 years participated in the2000 and 2001 NHIS surveys; 1,613 (2.2%) respondentsreported ever having a stroke. Differences in sociodemographiccharacteristics and limitation of activities between non-Hispanic blacks and non-Hispanic whites with stroke werecompared. The prevalence of stroke was 2.3% among whitesand 2.7% among blacks; approximately 3.4 million non-Hispanic whites and 600,000 non-Hispanic blacks survived astroke and lived at home during 2000–2001. Hispanics andpersons of other races/ethnicities were excluded because ofsmall sample size; the sample consisted of 1,391noninstitutionalized stroke survivors, including 297 blacks and1,094 whites. Statistical software was used for all analyses toaccount for complex multistage sampling design and toobtain estimates representative of the U.S. population.
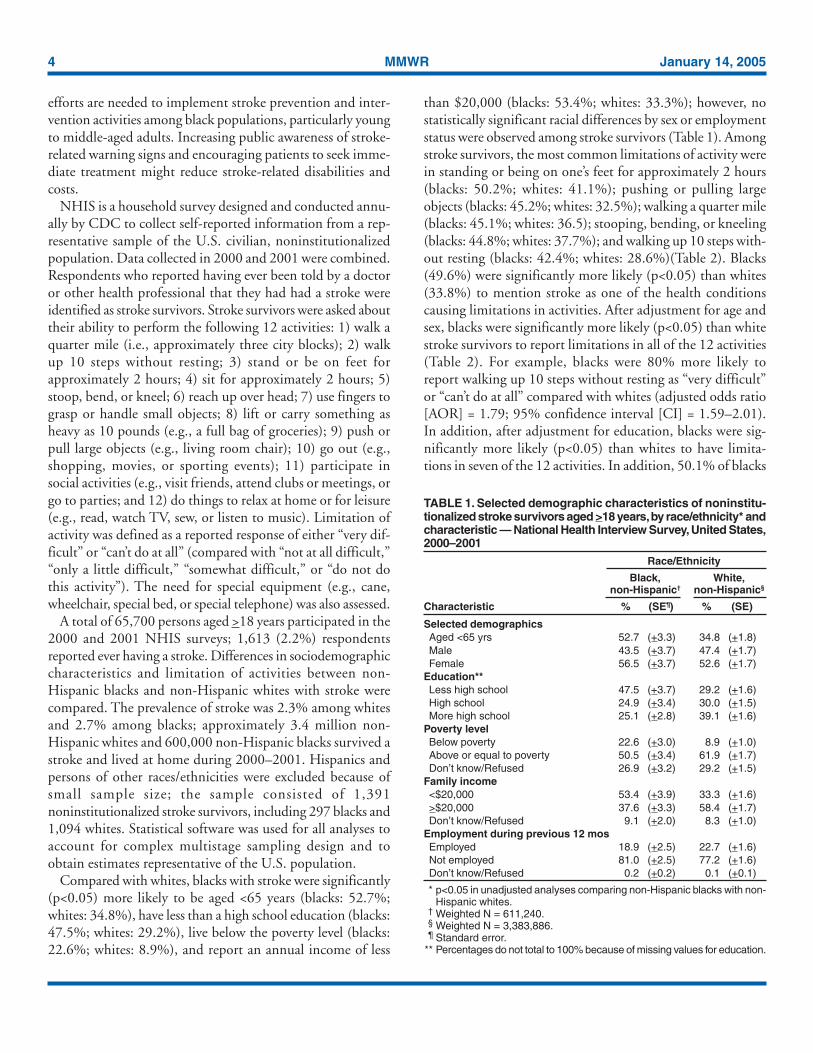
Compared with whites, blacks with stroke were significantly(p<0.05) more likely to be aged <65 years (blacks: 52.7%;whites: 34.8%), have less than a high school education (blacks:47.5%; whites: 29.2%), live below the poverty level (blacks:22.6%; whites: 8.9%), and report an annual income of less
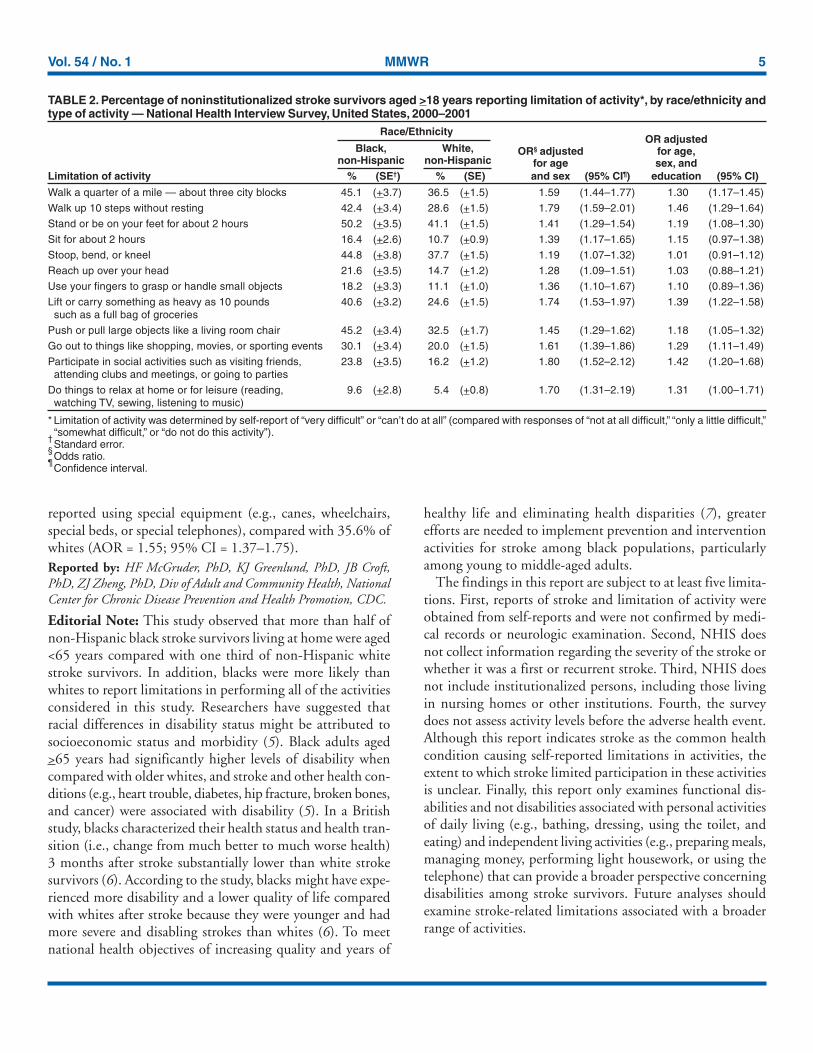
than $20,000 (blacks: 53.4%; whites: 33.3%); however, nostatistically significant racial differences by sex or employmentstatus were observed among stroke survivors (Table 1). Amongstroke survivors, the most common limitations of activity werein standing or being on one’s feet for approximately 2 hours(blacks: 50.2%; whites: 41.1%); pushing or pulling largeobjects (blacks: 45.2%; whites: 32.5%); walking a quarter mile(blacks: 45.1%; whites: 36.5); stooping, bending, or kneeling(blacks: 44.8%; whites: 37.7%); and walking up 10 steps with-out resting (blacks: 42.4%; whites: 28.6%)(Table 2). Blacks(49.6%) were significantly more likely (p<0.05) than whites(33.8%) to mention stroke as one of the health conditionscausing limitations in activities. After adjustment for age andsex, blacks were significantly more likely (p<0.05) than whitestroke survivors to report limitations in all of the 12 activities(Table 2). For example, blacks were 80% more likely toreport walking up 10 steps without resting as “very difficult”or “can’t do at all” compared with whites (adjusted odds ratio[AOR] = 1.79; 95% confidence interval [CI] = 1.59–2.01).In addition, after adjustment for education, blacks were sig-nificantly more likely (p<0.05) than whites to have limita-tions in seven of the 12 activities. In addition, 50.1% of blacks
TABLE 1. Selected demographic characteristics of noninstitu-tionalized stroke survivors aged >18 years, by race/ethnicity* andcharacteristic — National Health Interview Survey, United States,2000–2001
Race/Ethnicity
Black, White,non-Hispanic† non-Hispanic§
Characteristic % (SE¶) % (SE)
Selected demographicsAged <65 yrs 52.7 (+3.3) 34.8 (+1.8)Male 43.5 (+3.7) 47.4 (+1.7)Female 56.5 (+3.7) 52.6 (+1.7)
Education**Less high school 47.5 (+3.7) 29.2 (+1.6)High school 24.9 (+3.4) 30.0 (+1.5)More high school 25.1 (+2.8) 39.1 (+1.6)
Poverty levelBelow poverty 22.6 (+3.0) 8.9 (+1.0)Above or equal to poverty 50.5 (+3.4) 61.9 (+1.7)Don’t know/Refused 26.9 (+3.2) 29.2 (+1.5)
Family income<$20,000 53.4 (+3.9) 33.3 (+1.6)>$20,000 37.6 (+3.3) 58.4 (+1.7)Don’t know/Refused 9.1 (+2.0) 8.3 (+1.0)
Employment during previous 12 mosEmployed 18.9 (+2.5) 22.7 (+1.6)Not employed 81.0 (+2.5) 77.2 (+1.6)Don’t know/Refused 0.2 (+0.2) 0.1 (+0.1)
* p<0.05 in unadjusted analyses comparing non-Hispanic blacks with non-Hispanic whites.
† Weighted N = 611,240.§ Weighted N = 3,383,886.¶ Standard error.
** Percentages do not total to 100% because of missing values for education.
Vol. 54 / No. 1 MMWR 5
reported using special equipment (e.g., canes, wheelchairs,special beds, or special telephones), compared with 35.6% ofwhites (AOR = 1.55; 95% CI = 1.37–1.75).Reported by: HF McGruder, PhD, KJ Greenlund, PhD, JB Croft,PhD, ZJ Zheng, PhD, Div of Adult and Community Health, NationalCenter for Chronic Disease Prevention and Health Promotion, CDC.
Editorial Note: This study observed that more than half ofnon-Hispanic black stroke survivors living at home were aged<65 years compared with one third of non-Hispanic whitestroke survivors. In addition, blacks were more likely thanwhites to report limitations in performing all of the activitiesconsidered in this study. Researchers have suggested thatracial differences in disability status might be attributed tosocioeconomic status and morbidity (5). Black adults aged>65 years had significantly higher levels of disability whencompared with older whites, and stroke and other health con-ditions (e.g., heart trouble, diabetes, hip fracture, broken bones,and cancer) were associated with disability (5). In a Britishstudy, blacks characterized their health status and health tran-sition (i.e., change from much better to much worse health)3 months after stroke substantially lower than white strokesurvivors (6). According to the study, blacks might have expe-rienced more disability and a lower quality of life comparedwith whites after stroke because they were younger and hadmore severe and disabling strokes than whites (6). To meetnational health objectives of increasing quality and years of
healthy life and eliminating health disparities (7), greaterefforts are needed to implement prevention and interventionactivities for stroke among black populations, particularlyamong young to middle-aged adults.
The findings in this report are subject to at least five limita-tions. First, reports of stroke and limitation of activity wereobtained from self-reports and were not confirmed by medi-cal records or neurologic examination. Second, NHIS doesnot collect information regarding the severity of the stroke orwhether it was a first or recurrent stroke. Third, NHIS doesnot include institutionalized persons, including those livingin nursing homes or other institutions. Fourth, the surveydoes not assess activity levels before the adverse health event.Although this report indicates stroke as the common healthcondition causing self-reported limitations in activities, theextent to which stroke limited participation in these activitiesis unclear. Finally, this report only examines functional dis-abilities and not disabilities associated with personal activitiesof daily living (e.g., bathing, dressing, using the toilet, andeating) and independent living activities (e.g., preparing meals,managing money, performing light housework, or using thetelephone) that can provide a broader perspective concerningdisabilities among stroke survivors. Future analyses shouldexamine stroke-related limitations associated with a broaderrange of activities.
TABLE 2. Percentage of noninstitutionalized stroke survivors aged >18 years reporting limitation of activity*, by race/ethnicity andtype of activity — National Health Interview Survey, United States, 2000–2001
Race/EthnicityOR adjusted
Black, White, OR§ adjusted for age,non-Hispanic non-Hispanic for age sex, and
Limitation of activity % (SE†) % (SE) and sex (95% CI¶) education (95% CI)
Walk a quarter of a mile — about three city blocks 45.1 (+3.7) 36.5 (+1.5) 1.59 (1.44–1.77) 1.30 (1.17–1.45)
Walk up 10 steps without resting 42.4 (+3.4) 28.6 (+1.5) 1.79 (1.59–2.01) 1.46 (1.29–1.64)
Stand or be on your feet for about 2 hours 50.2 (+3.5) 41.1 (+1.5) 1.41 (1.29–1.54) 1.19 (1.08–1.30)
Sit for about 2 hours 16.4 (+2.6) 10.7 (+0.9) 1.39 (1.17–1.65) 1.15 (0.97–1.38)
Stoop, bend, or kneel 44.8 (+3.8) 37.7 (+1.5) 1.19 (1.07–1.32) 1.01 (0.91–1.12)
Reach up over your head 21.6 (+3.5) 14.7 (+1.2) 1.28 (1.09–1.51) 1.03 (0.88–1.21)
Use your fingers to grasp or handle small objects 18.2 (+3.3) 11.1 (+1.0) 1.36 (1.10–1.67) 1.10 (0.89–1.36)
Lift or carry something as heavy as 10 pounds 40.6 (+3.2) 24.6 (+1.5) 1.74 (1.53–1.97) 1.39 (1.22–1.58) such as a full bag of groceries
Push or pull large objects like a living room chair 45.2 (+3.4) 32.5 (+1.7) 1.45 (1.29–1.62) 1.18 (1.05–1.32)
Go out to things like shopping, movies, or sporting events 30.1 (+3.4) 20.0 (+1.5) 1.61 (1.39–1.86) 1.29 (1.11–1.49)
Participate in social activities such as visiting friends, 23.8 (+3.5) 16.2 (+1.2) 1.80 (1.52–2.12) 1.42 (1.20–1.68) attending clubs and meetings, or going to parties
Do things to relax at home or for leisure (reading, 9.6 (+2.8) 5.4 (+0.8) 1.70 (1.31–2.19) 1.31 (1.00–1.71) watching TV, sewing, listening to music)
* Limitation of activity was determined by self-report of “very difficult” or “can’t do at all” (compared with responses of “not at all difficult,” “only a little difficult,”“somewhat difficult,” or “do not do this activity”).
†Standard error.
§Odds ratio.
¶Confidence interval.
6 MMWR January 14, 2005
National public health efforts to reduce stroke disabilityaddress both stroke prevention and treatment interventions(8). For example, the CDC Paul Coverdell National AcuteStroke Registry operates in Georgia, Illinois, Massachusetts,and North Carolina to track and improve delivery of care tohospital patients with acute stroke. Data from this registrywill help state health departments and hospitals develop plansto reduce delay times in emergency transport, promote health-system adherence to clinical practice guidelines for stroke evalu-ation and treatment, improve the quality of life of strokesurvivors, and reduce disability from stroke. In addition, CDCfunds health departments in 32 states and the District ofColumbia to develop, implement, and evaluate programs thatpromote cardiovascular health, increase public awareness, pre-vent disease, and eliminate health disparities. An example ofeliminating health disparities is to collaborate on developingsystems and intervention programs to detect and control highblood pressure among high-risk groups. CDC and its part-ners are implementing a plan (9) to address specific steps to-ward preventing heart disease and stroke through 2020 andbeyond.
Improvements in stroke survival and reduction of disabilitymight be influenced by implementing culturally appropriatepublic education messages. These messages should increaseawareness of stroke signs and symptoms and the need topromptly call 911 to reduce treatment delay (10).References
1. CDC. Prevalence of disabilities and associated health conditions amongadults—United States, 1999. MMWR 2001;50:120–5.
2. American Heart Association. Heart disease and stroke statistics—2004update. Dallas, TX: American Heart Association; 2003.
3. Kim P, Warren S, Madill H, Hadley M. Quality of life of stroke survi-vors. Qual Life Res 1999;8:293–301.
4. Wolf PA, Kelly-Hayes M, Kase CS, Gresham GE, Beiser A. Prevalenceof stroke-related disability: U.S. estimates for the Framingham Study.Neurol 1998;4(Suppl 4):A55–6.
5. Kelley-Moore JA, Ferraro KF. The black/white disability gap: persis-tent inequality in later life? J Gerontol B Psychol Soc Sci 2004:59B;1:S34–43.
6. Hillen T, Davies S, Rudd AG, Kieselbach T, Wolfe CD. Self ratings ofhealth predict functional outcome and recurrence free survival afterstroke. J Epidemiol Community Health 2003;57:960–6.
7. US Department of Health and Human Services. Healthy people 2010(conference ed, in 2 vols). Washington, DC: US Department of Healthand Human Services; 2000. Available at http://www.health.gov/healthypeople.
8. CDC. CDC State Heart Disease and Stroke Prevention Program.Atlanta, GA: US Department of Health and Human Services; 2004.Available at http://www.cdc.gov/cvh/state_program/index.htm.
9. CDC. A public health action plan to prevent heart disease and stroke.Atlanta, GA: US Department of Health and Human Services; 2003.Available at http://www.cdc.gov/cvh/Action_Plan/index.htm.
10. McGruder HF, Malarcher AM, Antoine TL, et al. Racial and ethnicdisparities in cardiovascular risk factors among stroke survivors—United States, 1999–2001. Stroke 2004;35:1557–61.
cdc.gov/mmwr
MMWR Continuing Education is
designed with your needs in
mind: timely public health and
clinical courses, online exams,
instant course certificates, and
economical tuition (it's free).
Visit MMWR Online to learn
more about our program's
features and available courses.
MMWR CE
It's ready when you are.
Chinese Proverb
a teacher appears." "When the mind is ready,
ContinuingEducation
Vol. 54 / No. 1 MMWR 7
Racial/Ethnic Disparitiesin Prevalence, Treatment,
and Control of Hypertension —United States, 1999–2002
High blood pressure (HBP) is a major risk factor for heartdisease and stroke, end-stage renal disease, and peripheral vas-cular disease and is a chief contributor to adult disability (1).Approximately one in four adults in the United States hashypertension (2). Although effective therapy has been avail-able for more than 50 years (3), most persons with hyperten-sion do not have their blood pressure (BP) under control (4).National health objectives for 2010 include reducing the pro-portion of adults with HBP to 16% (baseline: 28%), increas-ing the proportion of adults with hypertension who are takingaction to control it to 95% (baseline: 82%), and increasingthe proportion of adults with controlled BP to 50% (baseline:18%) (5). During 1990–2000, the prevalence of hyperten-sion, the percentage of those with hypertension who were awareof their condition, and treatment and control of hypertensionincreased among non-Hispanic whites, non-Hispanic blacks,and Hispanics (6,7). CDC analyzed data from the NationalHealth and Nutrition Examination Surveys (NHANES) for1999–2002. This report summarizes the results of that analy-sis, which determined that racial/ethnic disparities in aware-ness of, treatment for, and control of hypertension persist. Ifnational health objectives are to be met, public health effortsmust continue to focus on the prevention of HBP and must
improve awareness, treatment, and control of hypertensionamong minority populations.
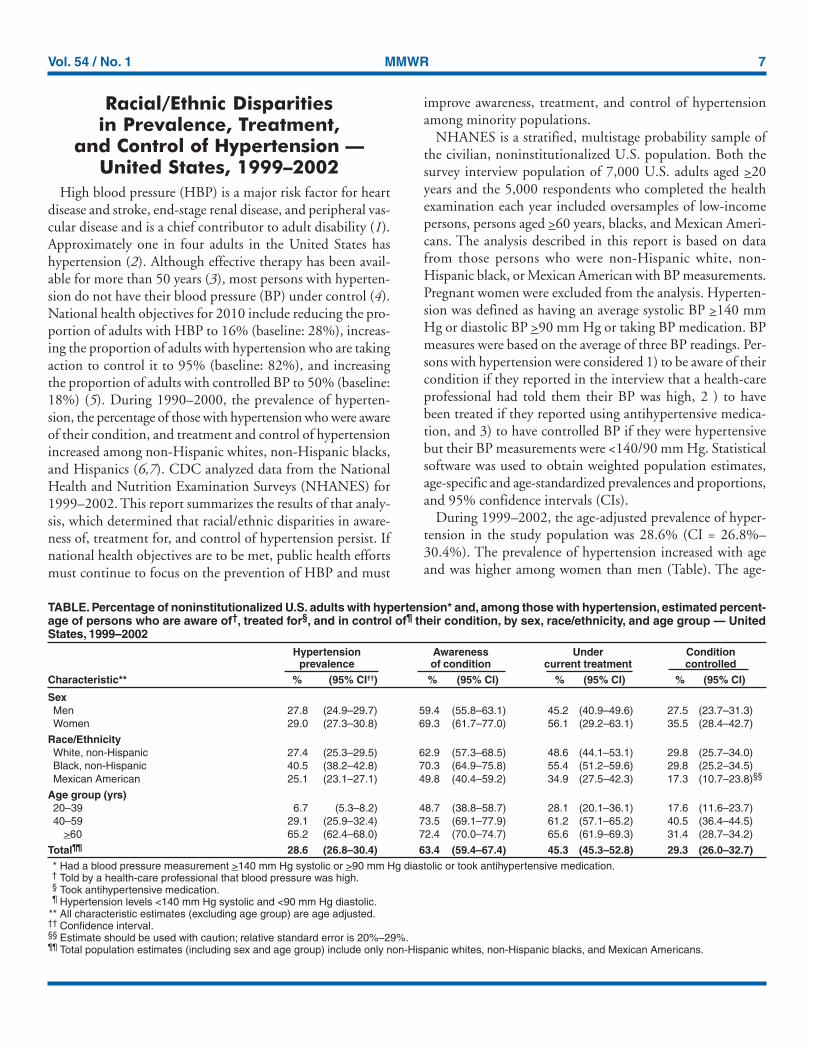
NHANES is a stratified, multistage probability sample ofthe civilian, noninstitutionalized U.S. population. Both thesurvey interview population of 7,000 U.S. adults aged >20years and the 5,000 respondents who completed the healthexamination each year included oversamples of low-incomepersons, persons aged >60 years, blacks, and Mexican Ameri-cans. The analysis described in this report is based on datafrom those persons who were non-Hispanic white, non-Hispanic black, or Mexican American with BP measurements.Pregnant women were excluded from the analysis. Hyperten-sion was defined as having an average systolic BP >140 mmHg or diastolic BP >90 mm Hg or taking BP medication. BPmeasures were based on the average of three BP readings. Per-sons with hypertension were considered 1) to be aware of theircondition if they reported in the interview that a health-careprofessional had told them their BP was high, 2 ) to havebeen treated if they reported using antihypertensive medica-tion, and 3) to have controlled BP if they were hypertensivebut their BP measurements were <140/90 mm Hg. Statisticalsoftware was used to obtain weighted population estimates,age-specific and age-standardized prevalences and proportions,and 95% confidence intervals (CIs).
During 1999–2002, the age-adjusted prevalence of hyper-tension in the study population was 28.6% (CI = 26.8%–30.4%). The prevalence of hypertension increased with ageand was higher among women than men (Table). The age-
TABLE. Percentage of noninstitutionalized U.S. adults with hypertension* and, among those with hypertension, estimated percent-age of persons who are aware of†, treated for§, and in control of¶ their condition, by sex, race/ethnicity, and age group — UnitedStates, 1999–2002
Hypertension Awareness Under Conditionprevalence of condition current treatment controlled
Characteristic** % (95% CI††) % (95% CI) % (95% CI) % (95% CI)
SexMen 27.8 (24.9–29.7) 59.4 (55.8–63.1) 45.2 (40.9–49.6) 27.5 (23.7–31.3)Women 29.0 (27.3–30.8) 69.3 (61.7–77.0) 56.1 (29.2–63.1) 35.5 (28.4–42.7)
Race/EthnicityWhite, non-Hispanic 27.4 (25.3–29.5) 62.9 (57.3–68.5) 48.6 (44.1–53.1) 29.8 (25.7–34.0)Black, non-Hispanic 40.5 (38.2–42.8) 70.3 (64.9–75.8) 55.4 (51.2–59.6) 29.8 (25.2–34.5)Mexican American 25.1 (23.1–27.1) 49.8 (40.4–59.2) 34.9 (27.5–42.3) 17.3 (10.7–23.8)§§
Age group (yrs)20–39 6.7 (5.3–8.2) 48.7 (38.8–58.7) 28.1 (20.1–36.1) 17.6 (11.6–23.7)40–59 29.1 (25.9–32.4) 73.5 (69.1–77.9) 61.2 (57.1–65.2) 40.5 (36.4–44.5)
>60 65.2 (62.4–68.0) 72.4 (70.0–74.7) 65.6 (61.9–69.3) 31.4 (28.7–34.2)
Total¶¶ 28.6 (26.8–30.4) 63.4 (59.4–67.4) 45.3 (45.3–52.8) 29.3 (26.0–32.7)* Had a blood pressure measurement >140 mm Hg systolic or >90 mm Hg diastolic or took antihypertensive medication.† Told by a health-care professional that blood pressure was high.§ Took antihypertensive medication.¶ Hypertension levels <140 mm Hg systolic and <90 mm Hg diastolic.
** All characteristic estimates (excluding age group) are age adjusted.†† Confidence interval.§§ Estimate should be used with caution; relative standard error is 20%–29%.¶¶ Total population estimates (including sex and age group) include only non-Hispanic whites, non-Hispanic blacks, and Mexican Americans.
8 MMWR January 14, 2005
adjusted prevalence of hypertension was 40.5% among non-Hispanic blacks, 27.4% among non-Hispanic whites, and25.1% among Mexican Americans. Of those with HBP, 63.4%(CI = 59.4%–67.4%) had been told that their BP was high.The proportion who were aware of having a high BP wasgreater among those aged >40 years (73.5% versus 48.7%),and the proportion was higher among women than men(69.3% versus 59.4%). Among adults with hypertension, theproportion who were aware of having HBP was 70.3% amongnon-Hispanic blacks, 62.9% among non-Hispanic whites, and49.8% among Mexican Americans. Among those with hyper-tension, 45.3% (CI = 45.3%–52.8%) had been treated withantihypertensive medication. Percentages of those treated forHBP were higher among women than men (56.1% versus45.2%) and increased with age. The age-adjusted proportionwho reported treatment was 55.4% among non-Hispanicblacks, 48.6% among non-Hispanic whites, and 34.9% amongMexican Americans. Only 29% of U.S. adults with hyperten-sion had controlled BP levels (<140/90 mm Hg), and the pro-portion of hypertensive adults who had controlled their BPvaried substantially by age group: 17.6% of those aged 20–39years, 40.5% of those aged 40–59 years, and 31.4% of thoseaged >60 years. The proportion with controlled BP was simi-lar among non-Hispanic blacks (29.8%) and non-Hispanicwhites (29.8%) but substantially lower among Mexican Ameri-cans (17.3%).Reported by: MJ Glover, ScD, KJ Greenlund, PhD, C Ayala, PhD,JB Croft, PhD, Div of Adult and Community Health, National Centerfor Chronic Disease Prevention and Health Promotion, CDC.
Editorial Note: The findings of this report demonstrate con-tinuing racial/ethnic disparities in the prevalence of hyper-tension and in the percentages of those with HBP who areaware of, are being treated for, and are in control of their con-dition. Because of the serious health consequences associatedwith HBP, greater efforts are needed to prevent HBP and/orimprove BP control and HBP diagnosis rates among all popu-lations. Greater efforts are needed specifically to prevent HBPamong non-Hispanic blacks, who have a higher prevalence,and to increase BP treatment and control among MexicanAmericans, who appear to have lower rates of treatment andcontrol, compared with other racial/ethnic populations. Forthis report, CDC analyzed a 4-year period instead of the 2-yearperiod represented in data published recently from 1999–2000NHANES (7,8); therefore, this report also represents anupdate of those findings.
During 1991–1999, nearly 95% of U.S. adults had had a BPscreening within the previous 2 years; however, levels of BPscreening were lower among Hispanics than among non-Hispanic whites or non-Hispanic blacks (6). Lack of access to
health-care services, insufficient attention by health-care pro-viders, lack of necessary resources to engage in appropriatelifestyle modifications, cultural norms, and compliance in medi-cation use might be barriers to prevention and control of HBP.
The findings in this report are subject to at least four limi-tations. First, NHANES only surveyed the noninstitu-tionalized population; persons in nursing homes and otherinstitutions were not included. Second, Mexican Americanswere the only Hispanic subpopulation sampled, even thoughthe Hispanic population consists of only 66.1% MexicanAmericans (9); information for the other Hispanic subpopu-lations was not of sufficient size for reliable analysis. Third,although a strength of NHANES is the collection of actualBP measurements, these measurements are taken during thesame visit and therefore do not reflect the actual care guide-lines, which state that the determination of HBP should bebased on measurements from two separate visits. Finally, analy-ses were restricted to NHANES participants who had BP mea-surements and do not include those who might havehypertension but did not have BP measurements.
The prevention and management of HBP is a major publichealth challenge. HBP usually has no signs or symptoms andis called “the silent killer.” Untreated or uncontrolled HBPincreases risk for heart disease, renal disease, and stroke. Rec-ommendations by the Joint National Committee on Preven-tion, Detection, Evaluation, and Treatment of High BloodPressure advise health-care providers regarding screening,detecting, treating, and monitoring cases of HBP and hyper-tension (3). In addition, BP surveillance data should be usedto monitor and evaluate the effectiveness of interventions de-signed to prevent and control HBP. To reduce disparities andimprove HBP prevention and control among U.S. adults,public health officials and clinicians need to increase their ef-forts to treat and control BP levels among persons with hy-pertension, and promote physical activity, nutrition changes(e.g., reducing high salt/sodium), weight reduction or man-agement, stress reduction, and routine BP screening.References1. US Department of Health and Human Services, National Institutes for
Health, National Heart, Lung, and Blood Institute. High blood pres-sure: who is at risk? Available at http://www.nhlbi.nih.gov/health/dci/Diseases/Hbp/HBP_WhoIsAtRisk.html.
2. American Heart Association. Heart disease and stroke statistics—2004update. Dallas, TX: American Heart Association; 2003.
3. National High Blood Pressure Education Program. The seventh report ofthe Joint National Committee on Prevention, Detection, Evaluation, andTreatment of High Blood Pressure. Hypertension 2003;42:1206–52.
4. Chobanian AV, Bakris GL, Black HR, et al. The seventh report of theJoint National Committee on Prevention, Detection, Evaluation, andTreatment of High Blood Pressure: the JNC 7 report. JAMA 2003;289:2506–72.
Vol. 54 / No. 1 MMWR 9
5. US Department of Health and Human Services. Healthy people 2010(conference ed, in 2 vols). Washington, DC: US Department of Healthand Human Services; 2000. Available at http://www.health.gov/healthypeople.
6. CDC. State-specific trends in self-reported blood pressure screening andhigh blood pressure—United States, 1991–1999. MMWR 2002;51:456–60.
7. Fields LE, Burt VL, Cutler JA, et al. The burden of adult hypertensionin the United States 1999 to 2000: a rising tide. Hypertension 2004;44:1–7.
8. Hajjar I, Kotchen TA. Trends in prevalence, awareness, treatment, andcontrol of hypertension in the United States, 1988–2000. JAMA 2003;290:199–206.
9. Rameriz RR, de la Cruz GP. The Hispanic population in the UnitedStates: March 2002. Curr Popul Rep [Spec Censuses] 2002;20–545.
Racial Disparities in NationallyNotifiable Diseases —United States, 2002
Infectious diseases are a major cause of morbidity, mortal-ity, and disability in the United States and often affect racial/ethnic populations disproportionately (1,2). Eliminatingracial disparities is a goal of many of the national healthobjectives for 2010 (3). To estimate racial disparities in theincidence of nationally notifiable infectious diseases by race/ethnicity, CDC reviewed 2002 data from the NationallyNotifiable Diseases Surveillance System (NNDSS), collectedthrough the National Electronic Telecommunications Systemfor Surveillance (NETSS). This report summarizes the resultsof that analysis, which indicated that incidence rates were atleast two times greater for blacks than whites for eight of 42nationally notifiable diseases; however, substantial gaps exist inthe reporting of racial/ethnic data for the 42 diseases, whichaccounted for approximately 1.3 million of the cases reportedby NNDSS. Public health practitioners and policy makers mightuse these results to address disparities in disease rates amongblacks and other racial/ethnic populations, but they also shouldwork to close gaps in data reporting to accurately measureprogress toward achieving the national health objectives.
NNDSS is a public health surveillance system that collectsdata on cases of notifiable diseases. The system is maintainedby CDC, in collaboration with the Council of State and Ter-ritorial Epidemiologists (CSTE), which determines nation-ally notifiable conditions and standard case definitions. Thedecision to make a disease nationally notifiable is based on itspublic health importance (e.g., number of cases or severity ofthe disease) and its preventability. Since 1990, case data havebeen reported to NNDSS by the 50 states, District ofColumbia, New York City, and U.S. territories. For this analy-sis, notifiable diseases were reviewed for completeness of
racial data where 25 or more cases were reported; incidencerates were reported by race where five or more cases were re-ported. For this report, racial classifications might include bothpersons who are Hispanic and non-Hispanic. Hispanicethnicity was only considered in determining the percentageof cases for which ethnicity data were not provided; no inci-dence rates were calculated for Hispanics. The number of cases,rate per 100,000 population by racial population, and black/white rate ratio were determined for 42 nationally notifiablediseases. Data for primary and secondary syphilis were com-bined. Data were analyzed for cases reported directly throughNETSS; data from U.S. territories were excluded. Populationdata from states in which diseases were not notifiable or dis-ease data were not available were excluded from rate calcula-tions.
For 42 nationally notifiable infectious diseases in 2002, atotal of 1,362,628 cases were reported (Table). Racial datawere provided for 70% of cases; Hispanic ethnicity data wereprovided for 65% of cases. Missing data on race ranged fromsix (5%) cases of streptococcal toxic shock syndrome to 3,527(71%) cases of coccidioidomycosis; missing data on Hispanicethnicity ranged from zero for syphilis to 66% forcoccidiodomycosis. By state, missing data on race ranged from1% to 63% of cases, with an interquartile range of 13%–35%;missing data on Hispanic ethnicity ranged from zero to 98%of cases, with an interquartile range of 16%–45%. Nineteendiseases had >30% cases with missing race information.
At least 20,000 cases were reported by each of six infectiousdiseases: chlamydia (834,555 cases), gonorrhea (351,852),salmonellosis (44,264), Lyme disease (23,763), shigellosis(23,541), and giardiasis (21,206). For three of those six dis-eases, and eight of the 42 nationally notifiable diseases, theincidence rate for blacks was at least twice as high as the ratefor whites in 1992. For gonorrhea, the incidence rate for blackswas 24 times greater, at 570.4 per 100,000 population, com-pared with 23.6 for whites. For malaria, the rates were 1.8 forblacks and 0.2 for whites; for chlamydia, 805.9 for blacks and90.2 for whites; for syphilis, 9.4 for blacks and 1.1 for whites;for shigellosis, 16.8 for blacks and 4.0 for whites; for typhoidfever, 0.1 for blacks and 0.02 for whites; for hepatitis B, 3.9for blacks and 1.5 for whites; and for Streptococcus pneumoniae(i.e., invasive, drug resistant), 1.5 for blacks and 0.7 for whites.
In other findings, the incidence rate for Lyme disease amongwhites (7.8 per 100,000 population) was approximately 11times greater than that for blacks (0.7), and the incidence ratefor giardiasis was approximately two times greater for whites(5.4) than for blacks (2.5). Among racial populations, the high-est incidence rates of salmonellosis (17.4 per 100,000 popu-lation) and shigellosis (19.7) were among American Indians/Alaska Natives (AI/AN).
10 MMWR January 14, 2005
Reported by: N Adekoya, DrPH, RS Hopkins, MD, Div of Public HealthSurveillance and Informatics, Epidemiology Program Office, CDC.
Editorial Note: The findings in this report indicate substan-tial disparities between racial populations in notifiable infec-tious diseases, including three of the six diseases with morethan 20,000 cases per year. Public health efforts shouldattempt to reduce these disparities in diseases, including gon-orrhea, chlamydia, and shigellosis among blacks, salmonello-sis and shigellosis among AI/AN, and giardiasis and Lyme
disease among whites. However, efforts to reduce these dis-parities require more accurate and complete racial/ethnic datafor nationally notifiable diseases. The amounts of missingracial/ethnic data from NETSS described in this report aresimilar to those reported previously (4).
The findings in this report are subject to at least four limi-tations. First, surveillance practices vary among states/areas,and definitions can be misapplied. Second, availability ofresources can influence the detail of reporting (e.g., racial/
TABLE. Number of cases* and rate†, by racial classification§, and percentage of cases with missing racial and ethnic data for 42selected nationally notifiable diseases — United States, 2002
Racial classificationRace Ethnicity
American Indian/ Asian/ not notBlack White Black/white Alaska Native Pacific Islander stated stated
Disease No. Rate No. Rate rate ratio No. Rate No. Rate Total % %
Botulism, foodborne 0 —¶ 7 — — 15 0.7 0 — 28 21 25Botulism, infant 1 — 42 1.4 — 0 — 5 3.0 69 30 29Brucellosis 1 — 51 — — 0 — 2 — 125 56 16Chlamydia** 280,075 805.9 178,802 90.2 8.9 10,924 512.1 11,871 108.0 834,555 42 28Coccidioidomycosis 148 0.8 1,154 1.1 0.7 42 3.2 87 1.1 4,968 71 66Cryptosporidiosis 267 0.8 1,842 0.9 0.9 11 0.5 26 0.2 3,016 28 40Cyclosporiasis 5 — 105 0.1 — 0 — 2 — 156 28 37Ehrlichiosis, human granulocytic 2 — 267 0.1 — 2 — 2 — 511 46 65Ehrlichiosis, human monocytic 6 — 146 0.1 — 1 — 0 — 216 29 32Encephalitis, California serogroup viral 5 — 122 0.1 — 1 — 0 — 164 21 59Encephalitis, St. Louis 1 — 14 — — 0 — 0 — 28 46 14Encephalitis, West Nile 366 1.1 1,669 0.8 1.4 5 0.2 8 0.1 2,840 28 65E. coli, 0157:H7 101 0.3 2,412 1.2 0.3 153 7.2 63 0.6 3,840 28 37E. coli, non-0157 5 — 113 0.1 — 1 — 1 — 194 39 46Escherichia coli, not serogrouped 2 — 32 — — 0 — 0 — 60 42 57Giardiasis 808 2.5 9,853 5.4 0.5 76 3.8 498 4.6 21,206 47 54Gonorrhea 198,221 570.4 46,781 23.6 24.2 2,049 96.1 2,013 18.3 351,852 29 23Haemophilus influenzae, invasive 209 0.6 1,020 0.5 1.2 39 1.8 25 0.2 1,743 25 42Hansen disease 3 — 24 — — 0 — 23 0.2 96 47 28Hemolytic uremic syndrome post diarrheal 6 — 153 0.1 — 0 — 6 0.1 216 21 30Hepatitis A, acute 705 2.0 4,544 2.3 0.9 90 4.2 252 2.3 8,795 36 34Hepatitis B, acute 1,343 3.9 2,932 1.5 2.6 118 5.6 237 2.2 7,996 42 47Hepatitis C; non-A, non-B 141 0.4 913 0.5 0.8 16 0.8 9 0.1 1,835 41 46Legionellosis 160 0.5 860 0.4 1.3 5 0.2 10 0.1 1,321 21 41Listeriosis 60 0.2 351 0.2 1.0 2 — 35 0.3 665 32 38Lyme disease 229 0.7 15,408 7.8 0.1 45 2.1 134 1.2 23,763 33 52Malaria 634 1.8 321 0.2 9.0 3 — 66 0.6 1,430 26 38Measles 2 — 28 — — 0 — 9 0.1 44 9 50Meningococcal disease 230 0.7 1,107 0.6 1.2 16 0.8 28 0.3 1,814 24 28Mumps 16 0.1 139 0.1 — 3 — 38 0.4 270 27 7Pertussis 538 1.6 7,355 3.7 0.4 89 4.2 110 1.0 9,771 17 16Q fever 3 — 40 — — 0 — 1 — 61 28 28Rocky Mountain spotted fever 73 0.2 816 0.4 0.5 21 1.0 6 0.1 1,104 17 25Salmonellosis 3,863 11.1 21,557 10.9 1.0 371 17.4 607 5.5 44,264 40 50Shigellosis 5,838 16.8 7,884 4.0 4.2 421 19.7 159 1.5 23,541 39 47Syphilis, primary and secondary 3,268 9.4 2,190 1.1 8.5 49 2.3 89 0.8 6,862 18 0Tetanus 1 — 15 — — 0 — 1 — 25 32 24Tularemia 5 — 60 — 0.3 6 0.3 0 — 90 21 9Streptococcal toxic-shock syndrome 18 0.1 94 0.1 1.0 0 — 0 — 118 5 36Streptococcus pneumoniae, invasive†† 428 1.5 1,431 0.7 2.1 10 0.8 11 0.1 2,546 26 51Toxic-shock syndrome 4 — 84 0.1 — 0 — 1 — 109 18 38Typhoid fever 29 0.1 44 — 4.0 2 — 80 0.7 321 48 38
Total 497,820 312,782 14,586 16,515 1,362,628
* Cases missing data on race were excluded from racial classification counts but included in totals for each disease.† Per 100,000 population, calculated by using U.S. Census Bureau population estimates. Rates were not calculated where fewer than five cases were
reported for a racial classification.§ Racial classifications might include persons who are Hispanic or non-Hispanic.¶ Rate not calculated or <0.1.
** Chlamydia trachomatis infection.†† Drug resistant.
Vol. 54 / No. 1 MMWR 11
ethnic data) by states/areas. Third, underreporting of certaindiseases might reflect lack of awareness of a disease or its lowpriority with state and local officials; conversely, concertedefforts to reduce syphilis might explain the high percentage ofsyphilis cases reported with racial/ethnic data. Finally, the sub-stantial gaps in collection of racial/ethnic data might beattributable to various factors and could result in under-reporting of certain racial populations.
Although NETSS data have been useful at national and statelevels (3), implementing the National Electronic Disease Sur-veillance System (NEDSS)*, including the NEDSS Base Sys-tem, might lead to improvement in the reporting of racial/ethnic data, especially if the data are contained in electronicclinical records that are moved directly into NEDSS compo-nents. Implementing NEDSS might also improve the com-patibility of racial/ethnic data reporting across states and acrossprograms; data are collected in the same format and codingsystem as those used for the decennial census.
Infectious diseases continue to place a considerable burdenon the nation, and better prevention and more effective con-trol measures are needed (5–7). To plan programs and evalu-ate the success of efforts to control infectious diseases of publichealth importance, improvements are necessary in the data-collection methods of surveillance systems to enable targetingof populations at greatest risk and to reduce health disparitiesamong racial/ethnic populations.
* NEDSS is designed as a major component of the Public Health InformationNetwork to promote the use of data and information system standards toadvance the development of efficient, integrated, and interoperable surveillancesystems at federal, state, and local levels. The NEDSS Base System can be usedby health departments for the surveillance and analysis of notifiable diseases.With NEDSS, providers can transfer clinical and laboratory-based dataelectronically to health departments, thereby lessening the burden of reporting,reducing missing data, and improving timeliness. Additional information isavailable at http://www.cdc.gov/nedss.
References1. CDC. Summary of notifiable diseases, United States, 2002. MMWR
2002;51(53):1–84.2. Board of Health Sciences Policy, Institute of Medicine. Unequal treat-
ment: confronting racial and ethnic disparities in health care. Washing-ton, DC: The National Academies Press; 2003.
3. US Department of Health and Human Services. Healthy people 2010(conference ed, in 2 vols). Washington, DC: US Department of Healthand Human Services; 2000. Available at http://www.health.gov/healthypeople.
4. CDC. Reporting race and ethnicity data—National Electronic Telecom-munications System for Surveillance, 1994–1997. MMWR 1999;48:305–12.
5. Peterson CA, Calderon RL. Trends in enteric disease as a cause of deathin the United States, 1989–1996. Am J Epidemiol 2003;157:58–65.
6. CDC. Sexually transmitted disease surveillance, 2002. Atlanta, GA: USDepartment of Health and Human Services, CDC; 2003.
7. Mead PS, Slutsker L, Dietz V, et al. Food-related illness and death in theUnited States. Emerg Infect Dis 1999;5:607–25.
Reducing Childhood AsthmaThrough Community-Based Service
Delivery — New York City,2001–2004
Since 1980, asthma prevalence, hospitalization, and mor-tality have been increasing in the United States (1). Becauseof concern about asthma-related morbidity among childrenin Central Harlem, New York City (NYC), the HarlemChildren’s Zone Asthma Initiative (HCZAI) was establishedin 2001 to reduce asthma-related morbidity through improvedsurveillance, health-care use, and health-care service deliveryfor children aged <12 years living in a 60-block radius of Cen-tral Harlem known as the Harlem Children’s Zone Project*.Families of children with asthma or asthma-like signs† or physi-cal findings consistent with asthma are invited to participatein the program. This report summarizes preliminary data col-lected during 2001–2004 on the effectiveness of the programin reducing asthma-related morbidity; data indicate decreasedparental/guardian reports of school absences among childrenenrolled in the program, both for any reason and because ofasthma. In addition, emergency department and unscheduledphysician office visits for treatment of asthma decreased from35% to 8% after 18 months of the program, indicatingimproved asthma management and appropriate use of health-care services by program enrollees. The effectiveness of HCZAIunderscores the utility of community-based public health pro-grams in reducing asthma morbidity.
Potential participants in HCZAI are identified throughscreening of all children aged <12 years who live or attendschool in the Harlem Children’s Zone Project or participatein any Harlem Children’s Zone, Inc., program (2). Screeningconsists of a written survey completed by a parent/guardianand a physical examination of the child conducted by a phy-sician or nurse (6). Participation rates for the various sitesranged from 66% to 100%, with 88% of parents/guardiansconsenting to physical examination of their children.
Because of the large number of children identified withasthma or asthma-like signs, participation is prioritized forchildren with recent symptoms. Over time, all eligible chil-
* Partners of this ongoing health intervention are Harlem Children’s Zone, Inc.(2) and the Department of Pediatrics at Harlem Hospital Center (3,4). TheHarlem Health Promotion Center, one of 33 Prevention Research Centersfunded by CDC (5), provides translational research support to better document,monitor, and inform HCZAI during its efforts to address the asthma epidemicin Central Harlem.
† For children with asthma, a parent/guardian indicated that the child had everbeen told by a doctor or nurse that the child had asthma. For children withasthma-like signs, a health-care provider indicated that the child’s chestradiograph was not clear, or peak expiratory flow rate for children aged >6years was correctly performed and abnormal.
12 MMWR January 14, 2005
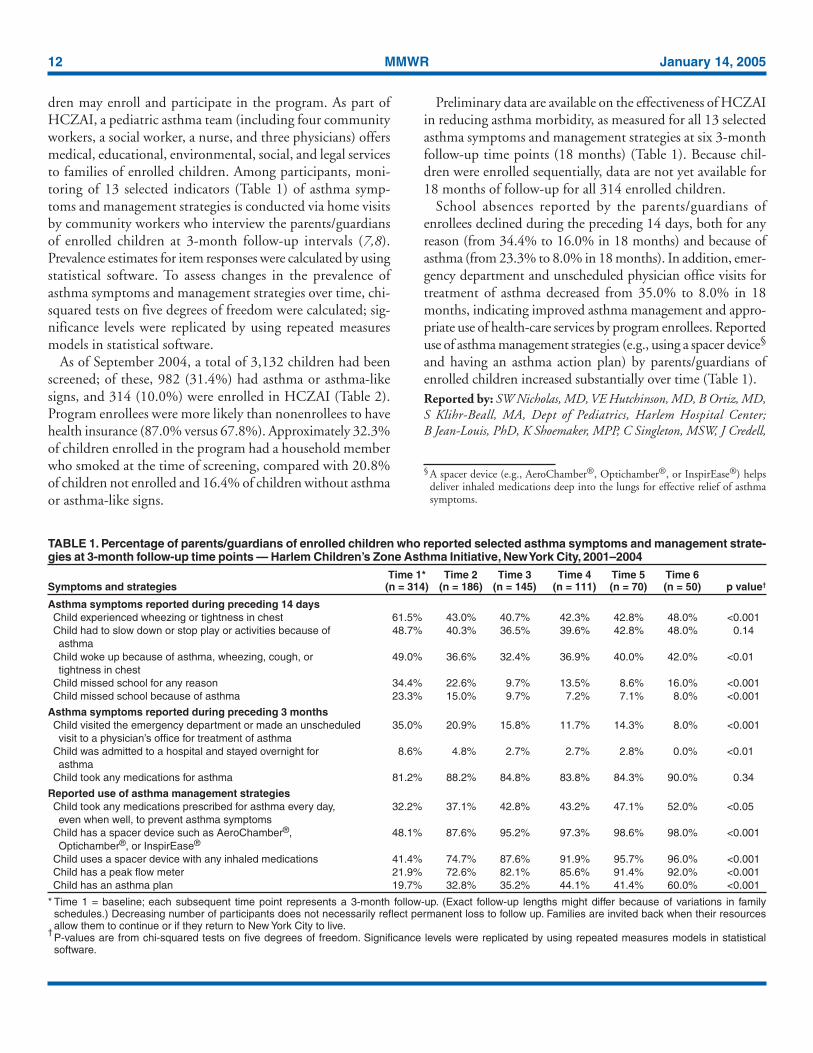
TABLE 1. Percentage of parents/guardians of enrolled children who reported selected asthma symptoms and management strate-gies at 3-month follow-up time points — Harlem Children’s Zone Asthma Initiative, New York City, 2001–2004
Time 1* Time 2 Time 3 Time 4 Time 5 Time 6Symptoms and strategies (n = 314) (n = 186) (n = 145) (n = 111) (n = 70) (n = 50) p value†
Asthma symptoms reported during preceding 14 daysChild experienced wheezing or tightness in chest 61.5% 43.0% 40.7% 42.3% 42.8% 48.0% <0.001Child had to slow down or stop play or activities because of 48.7% 40.3% 36.5% 39.6% 42.8% 48.0% 0.14asthma
Child woke up because of asthma, wheezing, cough, or 49.0% 36.6% 32.4% 36.9% 40.0% 42.0% <0.01tightness in chest
Child missed school for any reason 34.4% 22.6% 9.7% 13.5% 8.6% 16.0% <0.001Child missed school because of asthma 23.3% 15.0% 9.7% 7.2% 7.1% 8.0% <0.001
Asthma symptoms reported during preceding 3 monthsChild visited the emergency department or made an unscheduled 35.0% 20.9% 15.8% 11.7% 14.3% 8.0% <0.001visit to a physician’s office for treatment of asthma
Child was admitted to a hospital and stayed overnight for 8.6% 4.8% 2.7% 2.7% 2.8% 0.0% <0.01asthma
Child took any medications for asthma 81.2% 88.2% 84.8% 83.8% 84.3% 90.0% 0.34
Reported use of asthma management strategiesChild took any medications prescribed for asthma every day, 32.2% 37.1% 42.8% 43.2% 47.1% 52.0% <0.05even when well, to prevent asthma symptoms
Child has a spacer device such as AeroChamber®, 48.1% 87.6% 95.2% 97.3% 98.6% 98.0% <0.001Optichamber®, or InspirEase®
Child uses a spacer device with any inhaled medications 41.4% 74.7% 87.6% 91.9% 95.7% 96.0% <0.001Child has a peak flow meter 21.9% 72.6% 82.1% 85.6% 91.4% 92.0% <0.001Child has an asthma plan 19.7% 32.8% 35.2% 44.1% 41.4% 60.0% <0.001
* Time 1 = baseline; each subsequent time point represents a 3-month follow-up. (Exact follow-up lengths might differ because of variations in familyschedules.) Decreasing number of participants does not necessarily reflect permanent loss to follow up. Families are invited back when their resourcesallow them to continue or if they return to New York City to live.
†P-values are from chi-squared tests on five degrees of freedom. Significance levels were replicated by using repeated measures models in statisticalsoftware.
§ A spacer device (e.g., AeroChamber®, Optichamber®, or InspirEase®) helpsdeliver inhaled medications deep into the lungs for effective relief of asthmasymptoms.
dren may enroll and participate in the program. As part ofHCZAI, a pediatric asthma team (including four communityworkers, a social worker, a nurse, and three physicians) offersmedical, educational, environmental, social, and legal servicesto families of enrolled children. Among participants, moni-toring of 13 selected indicators (Table 1) of asthma symp-toms and management strategies is conducted via home visitsby community workers who interview the parents/guardiansof enrolled children at 3-month follow-up intervals (7,8).Prevalence estimates for item responses were calculated by usingstatistical software. To assess changes in the prevalence ofasthma symptoms and management strategies over time, chi-squared tests on five degrees of freedom were calculated; sig-nificance levels were replicated by using repeated measuresmodels in statistical software.
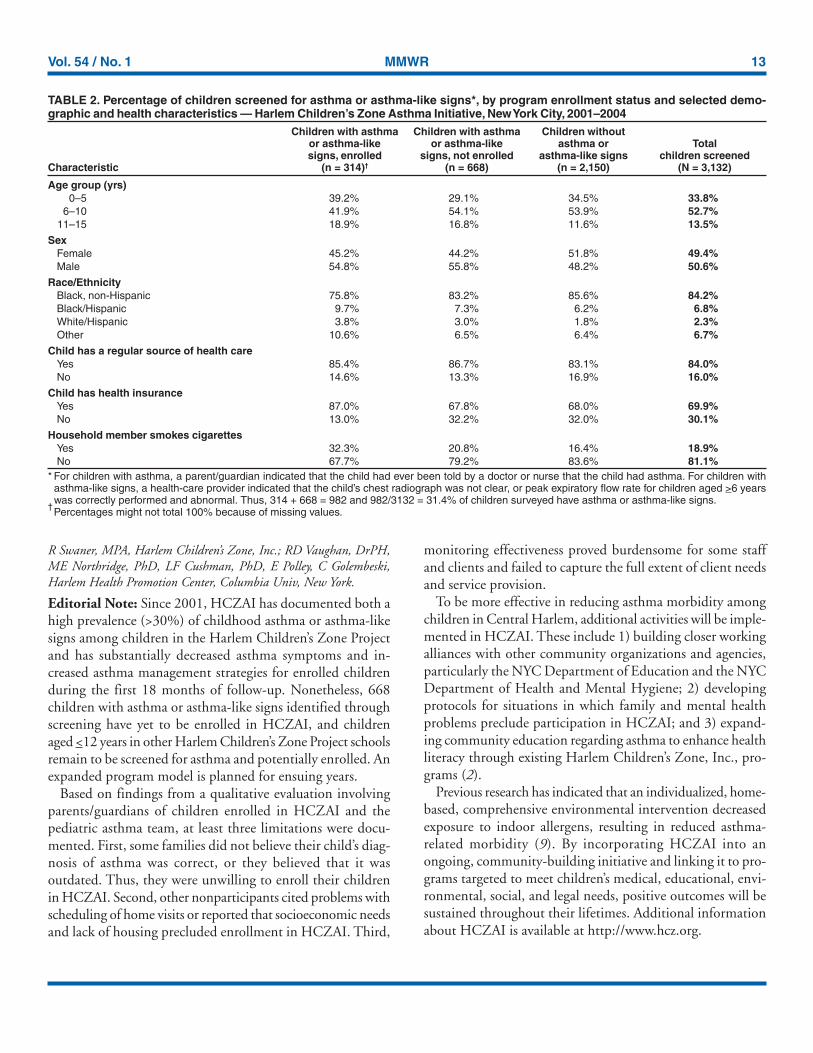
As of September 2004, a total of 3,132 children had beenscreened; of these, 982 (31.4%) had asthma or asthma-likesigns, and 314 (10.0%) were enrolled in HCZAI (Table 2).Program enrollees were more likely than nonenrollees to havehealth insurance (87.0% versus 67.8%). Approximately 32.3%of children enrolled in the program had a household memberwho smoked at the time of screening, compared with 20.8%of children not enrolled and 16.4% of children without asthmaor asthma-like signs.
Preliminary data are available on the effectiveness of HCZAIin reducing asthma morbidity, as measured for all 13 selectedasthma symptoms and management strategies at six 3-monthfollow-up time points (18 months) (Table 1). Because chil-dren were enrolled sequentially, data are not yet available for18 months of follow-up for all 314 enrolled children.
School absences reported by the parents/guardians ofenrollees declined during the preceding 14 days, both for anyreason (from 34.4% to 16.0% in 18 months) and because ofasthma (from 23.3% to 8.0% in 18 months). In addition, emer-gency department and unscheduled physician office visits fortreatment of asthma decreased from 35.0% to 8.0% in 18months, indicating improved asthma management and appro-priate use of health-care services by program enrollees. Reporteduse of asthma management strategies (e.g., using a spacer device§
and having an asthma action plan) by parents/guardians ofenrolled children increased substantially over time (Table 1).Reported by: SW Nicholas, MD, VE Hutchinson, MD, B Ortiz, MD,S Klihr-Beall, MA, Dept of Pediatrics, Harlem Hospital Center;B Jean-Louis, PhD, K Shoemaker, MPP, C Singleton, MSW, J Credell,
Vol. 54 / No. 1 MMWR 13
R Swaner, MPA, Harlem Children’s Zone, Inc.; RD Vaughan, DrPH,ME Northridge, PhD, LF Cushman, PhD, E Polley, C Golembeski,Harlem Health Promotion Center, Columbia Univ, New York.
Editorial Note: Since 2001, HCZAI has documented both ahigh prevalence (>30%) of childhood asthma or asthma-likesigns among children in the Harlem Children’s Zone Projectand has substantially decreased asthma symptoms and in-creased asthma management strategies for enrolled childrenduring the first 18 months of follow-up. Nonetheless, 668children with asthma or asthma-like signs identified throughscreening have yet to be enrolled in HCZAI, and childrenaged <12 years in other Harlem Children’s Zone Project schoolsremain to be screened for asthma and potentially enrolled. Anexpanded program model is planned for ensuing years.
Based on findings from a qualitative evaluation involvingparents/guardians of children enrolled in HCZAI and thepediatric asthma team, at least three limitations were docu-mented. First, some families did not believe their child’s diag-nosis of asthma was correct, or they believed that it wasoutdated. Thus, they were unwilling to enroll their childrenin HCZAI. Second, other nonparticipants cited problems withscheduling of home visits or reported that socioeconomic needsand lack of housing precluded enrollment in HCZAI. Third,
monitoring effectiveness proved burdensome for some staffand clients and failed to capture the full extent of client needsand service provision.
To be more effective in reducing asthma morbidity amongchildren in Central Harlem, additional activities will be imple-mented in HCZAI. These include 1) building closer workingalliances with other community organizations and agencies,particularly the NYC Department of Education and the NYCDepartment of Health and Mental Hygiene; 2) developingprotocols for situations in which family and mental healthproblems preclude participation in HCZAI; and 3) expand-ing community education regarding asthma to enhance healthliteracy through existing Harlem Children’s Zone, Inc., pro-grams (2).
Previous research has indicated that an individualized, home-based, comprehensive environmental intervention decreasedexposure to indoor allergens, resulting in reduced asthma-related morbidity (9). By incorporating HCZAI into anongoing, community-building initiative and linking it to pro-grams targeted to meet children’s medical, educational, envi-ronmental, social, and legal needs, positive outcomes will besustained throughout their lifetimes. Additional informationabout HCZAI is available at http://www.hcz.org.
TABLE 2. Percentage of children screened for asthma or asthma-like signs*, by program enrollment status and selected demo-graphic and health characteristics — Harlem Children’s Zone Asthma Initiative, New York City, 2001–2004
Children with asthma Children with asthma Children withoutor asthma-like or asthma-like asthma or Totalsigns, enrolled signs, not enrolled asthma-like signs children screened
Characteristic (n = 314)† (n = 668) (n = 2,150) (N = 3,132)
Age group (yrs)0–5 39.2% 29.1% 34.5% 33.8%
6–10 41.9% 54.1% 53.9% 52.7%11–15 18.9% 16.8% 11.6% 13.5%
SexFemale 45.2% 44.2% 51.8% 49.4%Male 54.8% 55.8% 48.2% 50.6%
Race/EthnicityBlack, non-Hispanic 75.8% 83.2% 85.6% 84.2%Black/Hispanic 9.7% 7.3% 6.2% 6.8%White/Hispanic 3.8% 3.0% 1.8% 2.3%Other 10.6% 6.5% 6.4% 6.7%
Child has a regular source of health careYes 85.4% 86.7% 83.1% 84.0%No 14.6% 13.3% 16.9% 16.0%
Child has health insuranceYes 87.0% 67.8% 68.0% 69.9%No 13.0% 32.2% 32.0% 30.1%
Household member smokes cigarettesYes 32.3% 20.8% 16.4% 18.9%No 67.7% 79.2% 83.6% 81.1%
* For children with asthma, a parent/guardian indicated that the child had ever been told by a doctor or nurse that the child had asthma. For children withasthma-like signs, a health-care provider indicated that the child’s chest radiograph was not clear, or peak expiratory flow rate for children aged >6 yearswas correctly performed and abnormal. Thus, 314 + 668 = 982 and 982/3132 = 31.4% of children surveyed have asthma or asthma-like signs.
†Percentages might not total 100% because of missing values.
14 MMWR January 14, 2005
References1. Mannino DM, Homa D, Pertowski C, et al. Surveillance for asthma—
United States, 1960–1995. In: CDC Surveillance Summaries, April 24,1998. MMWR 1998;47(No. SS-1).
2. Harlem Children’s Zone, Inc. Harlem Children’s Zone Project. Avail-able at http://www.hcz.org/hczproject.
3. Davidson LL, Durkin MS, Kuhn L, O’Connor P, Barlow B, HeagartyMC. The impact of the Safe Kids/Healthy Neighborhoods Injury Pre-vention Program in Harlem, 1988 through 1991. Am J Public Health1994;84:580–6.
4. Northridge ME, Shoemaker K, Jean-Louis B, et al. What matters tocommunities? Using community-based participatory research to ask andanswer questions regarding the environment and health. Environ HealthPerspect (in press).
5. CDC. National Center for Chronic Disease Prevention and Health Pro-motion. Prevention Research Centers. Available at http://www.cdc.gov/prc.
6. Northridge ME, Jean-Louis B, Shoemaker K, Nicholas S. Advancingpopulation health in the Harlem Children’s Zone Project. SozPraventivmed 2002;47:201–4.
7. Mitchell H, Senturia Y, Gergen P, et al. Design and methods of theNational Cooperative Inner-City Asthma Study. Pediatr Pulmonol 1997;24:237–52.
8. Nicholas SW, Jean-Louis B, Ortiz B, et al. Addressing the childhoodasthma crisis in Harlem: The Harlem Children’s Zone Asthma Initia-tive. Am J Public Health (in press).
9. Morgan MJ, Crain EF, Gruchalla RS, et al. Results of a home-basedenvironmental intervention among urban children with asthma. N EnglJ Med 2004;351:1068–80.
Update: Influenza Activity —United States, 2004–05 Season
Influenza activity was low in the United States duringOctober through early December but has increased steadilysince mid-December. Current surveillance indicators suggestthat influenza activity for the season has not yet peaked.Laboratory-confirmed influenza infections have been reportedfrom 45 states, and this season’s influenza vaccine strains havebeen well matched antigenically to the influenza viruses iso-lated so far this season. In response to this season’s influenzavaccine supply shortage, the Department of Health and Hu-man Services (DHHS) has purchased 1.2 million doses of2004–05 inactivated influenza vaccine from GlaxoSmithKline(GSK). The GSK vaccine is produced, licensed, and distrib-uted globally but is not licensed for use in the United States;therefore, it will be administered in the United States underan Investigational New Drug (IND) protocol. This report sum-marizes influenza activity during October 3, 2004–January 1,2005* and provides information on the availability of addi-tional influenza vaccine from GSK.
Online
know what matters.
e ncore.Week after week, MMWR Online plays an important role in helping
you stay informed. From the latest CDC guidance to breaking
health news, count on MMWR Online to deliver the news you
need, when you need it.
Log on to cdc.gov/mmwr and enjoy MMWR performance.
* As of January 13, 2005, reporting is incomplete.
Vol. 54 / No. 1 MMWR 15
Influenza Surveillance ReportsDuring October 3–January 1, World Health Organization
(WHO) collaborating laboratories and National Respiratoryand Enteric Virus Surveillance System laboratories in the UnitedStates tested 34,497 respiratory specimens for influenza viruses;1,369 (4.0%) were positive. The percentages of specimens test-ing positive for influenza ranged each week from 0.7% to 12.1%and first exceeded 10% during the week ending December 25.During the 2001–02, 2002–03, and 2003–04 influenza sea-sons, peak percentages of specimens testing positive for influ-enza ranged from 24.7% to 35.2% (CDC, unpublished data,2004). During October 3–January 1, influenza viruses werereported from 45 states. As of January 1, approximately onehalf of the viruses have been reported from the Mid-Atlantic†
(26.4%) and New England§ (23.1%) regions. Of the 1,369influenza viruses identified since October 3, a total 1,128(82.4%) were influenza A viruses, and 241 (17.6%) were influ-enza B viruses. Of the 1,128 influenza A viruses, 406 (36.0%)have been subtyped; 404 (99.5%) were influenza A (H3N2)viruses, and two (0.5%) were influenza A (H1)¶ viruses.
CDC has characterized antigenically 107 influenza virusescollected by U.S. laboratories since October 3. All 85 of theinfluenza A (H3N2) isolates were A/Fujian/411/2002-like(H3N2), the influenza A (H3N2) strain recommended forthe 2004–05 influenza vaccine**. Nineteen influenza B iso-lates were from the B/Yamagata lineage and were character-ized as B/Shanghai/361/2002-like, the influenza B strain inthe 2004–05 influenza vaccine. Three B isolates belonged tothe B/Victoria lineage and were characterized as B/Hong Kong/330/2001-like. Influenza B viruses fall into one of two anti-genically and genetically distinct lineages represented byB/Yamagata/16/88 and B/Victoria/2/87 viruses. During 1990–2001, B/Yamagata lineage viruses circulated worldwide,whereas B/Victoria-like viruses were identified only in Asia.However, during March 2001–October 2003, B/Victoria-likeviruses were the predominant B viruses in several countries,including the United States. Victoria-lineage and Yamagata-lineage viruses continue to be reported worldwide. However,Yamagata-lineage viruses have been reported more frequentlyand are represented in the current vaccine.
During October 3–January 1, weekly percentages of patientvisits for influenza-like illness (ILI)†† reported by approxi-mately 1,500 U.S. sentinel providers in 50 states, New York
City (NYC), Chicago, and the District of Columbia haveranged from 1.0% to 3.0%. During the week ending January 1,the percentage of patient visits for ILI was 3.0%, exceedingthe national baseline of 2.5% for the first time this season§§.During the 2001–02, 2002–03, and 2003–04 influenza sea-sons, national weekly peak percentages of patient visits forILI ranged from 3.2% to 7.6% (CDC, unpublished data,2004).
Since the week ending October 9, a total of 16 states andNYC have reported widespread or regional influenza activity.During the week ending January 1, two states and NYC re-ported widespread activity, 12 states reported regional activity,and 13 states and the District of Columbia reported local activ-ity. During the same week, 6.7% of recorded deaths in the 122Cities Mortality Reporting System were attributed to pneumo-nia and influenza (P&I), which is below the epidemic thresh-old of 7.9%¶¶ for that week. The percentage of P&I deathsexceeded the epidemic threshold for 1 week during October 3–January 1 but otherwise has remained below.
The New Vaccine Surveillance Network (NVSN) consistsof three sites (Cincinnati, Ohio; Nashville, Tennessee; andRochester, New York) that conduct population-based surveil-lance for laboratory-confirmed influenza among children aged<4 years who are admitted to the hospital with fever or acuterespiratory illnesses. During October 3–December 25, 2004,two such hospitalizations occurred (preliminary rate: 0.42 per10,000 children). During 2000–2003, the end-of-season hos-pitalization rates in the NVSN sites ranged from 3.7 to 12.0per 10,000 children.
In June 2004, the Council of State and Territorial Epidemi-ologists changed nationally notifiable conditions to includedeaths in children aged <18 years associated with laboratorytest-confirmed influenza a nationally notifiable condition.Data collection began in October 2004, and as of January 8,2005, one pediatric death has been reported to CDC by theBureau of Health in Maine.
Purchase of Additional InactivatedInfluenza Vaccine
DHHS has purchased 1.2 million doses of the GSK influ-enza vaccine, Fluarix®, for use in areas with continued vac-cine shortages. The Fluarix vaccine obtained by DHHS is
† New Jersey, New York, and Pennsylvania.§ Connecticut, Maine, Massachusetts, New Hampshire, Rhode Island, and Vermont.¶ Includes both the A (H1N1) and A (H1N2) influenza virus subtypes.
** The A/Fujian/411/2002-like virus used by U.S. vaccine manufacturers wasA/Wyoming/03/2003, an antigenically equivalent virus appropriate for vaccineproduction.
†† Temperature of >100.0ºF (>37.8ºC) and either cough or sore throat in theabsence of a known cause.
§§ The national baseline was calculated as the mean weighted percentage ofvisits for ILI during noninfluenza weeks, plus two standard deviations. Widevariability in regional data precludes calculating region-specific baselines;applying the national baseline to regional data is inappropriate.
¶¶ The expected seasonal baseline proportion of P&I deaths reported by 122Cities Mortality Reporting System is projected by using a robust regressionprocedure in which a periodic regression model is applied to the observedpercentage of deaths from P&I during the previous 5 years. The epidemicthreshold is 1.645 standard deviations above the seasonal baseline.
16 MMWR January 14, 2005
similar to other injectable U.S.-licensed influenza vaccines andis licensed and used in more than 78 countries, including the25 countries of the European Union, Australia, and NewZealand. Because both Fluarix and U.S.-licensed influenzavaccines adhere to the WHO vaccine strain recommendations,components of the two vaccines are similar. However, Fluarixmust be used under an IND protocol in the United Statesbecause it is not currently licensed by the Food and DrugAdministration (FDA) and the time available is not sufficientto obtain FDA licensure for this vaccine to be administered asa licensed product for this season. This vaccine will be avail-able for:
• Adults aged >50 years,• Persons aged >3 years with underlying chronic medical
conditions***,• Pregnant women in the 2nd or 3rd trimester or women
in the 1st trimester with other high-risk conditions forinfluenza complications***,
• Residents of nursing homes and long-term–care facilities,• Children aged 3–18 years on chronic aspirin therapy***,• Health-care workers involved in direct patient care,• Out-of-home caregivers and household contacts of
persons with high-risk conditions†††.During the next several weeks, the IND vaccine will be avail-
able in identified clinics in selected areas of the United Stateswhere need for more influenza vaccine persists. CDC is work-ing with state and local public health officials to finalize theclinic locations. When decisions have been finalized, infor-mation on the clinic locations will be available through localand state public health authorities, at telephone 800-232-4636,and on the CDC website. Persons who wish to receive thisvaccine must call the clinic for appointments during regularclinic hours, sign a consent form, and provide limited addi-tional information for monitoring the IND vaccine program.The cost of vaccination will be paid by Medicare for personswith Medicare part B coverage. These persons should be pre-pared to provide their Medicare number and other billing in-formation at the time of vaccination. Persons without Medicarewill be responsible for the cost of the vaccine and its adminis-tration at the time of their appointment.Reported by: L Brammer, MPH, E Murray, MSPH, K Teates, MPH,S Harper, MD, K Fukuda, MD, A Klimov, PhD, N Cox, PhD, WHO
Collaborating Center for Surveillance, Epidemiology, and Control ofInfluenza, Div of Viral and Rickettsial Diseases; L Rotz, MD, NationalCenter for Infectious Diseases; R Seither, MPH, M Iwane, PhD;Epidemiology and Surveillance Div; J Copeland, MS, NationalImmunization Program, CDC.
Editorial Note: Influenza activity has been low but is increas-ing in the United States and does not appear to have reacheda peak. Influenza viruses might continue to circulate for sev-eral more months, and persons for whom influenza vaccine isrecommended are strongly encouraged to seek vaccination.Influenza vaccine coverage estimates from December suggestthat many persons in vaccine priority groups had not yet beenvaccinated and that vaccination rates lagged substantially be-hind vaccination coverage estimates for the previous year (1).
The influenza vaccine strains are well-matched antigenicallyto the circulating influenza virus strains. The match betweenvaccine demand and vaccine availability varies depending onthe area. Overall, supplies of both inactivated vaccine and live,attenuated influenza vaccine licensed for use in the UnitedStates are available. Beginning January 3, 2005, the prioritygroups for influenza vaccine have been expanded to includepersons aged 50–64 years and household contacts of any per-son at increased risk for influenza-related complications.Efforts should continue to utilize existing licensed influenzavaccine to vaccinate persons in priority groups. Additionalinformation is available at http://www.cdc.gov/flu/protect/whoshouldget.htm.
In addition, IND inactivated influenza vaccine will becomeavailable this month to further increase supply. Thus, personswho were not successful in obtaining vaccination earlier inthe season are encouraged to contact their personal physiciansor their local health departments to determine where vaccineis available in their areas. Influenza surveillance reports forthe United States are published weekly during October–Mayand are available at http://www.cdc.gov/flu/weekly or throughCDC’s voice (888-232-3228) and fax (888-232-3299, docu-ment number 361100) information systems.
AcknowledgmentsThis report is based on data contributed by participating state
and territorial epidemiologists and state public health laboratorydirectors, WHO collaborating laboratories, National Respiratoryand Enteric Virus Surveillance System collaborating laboratories,U.S. Influenza Sentinel Provider Surveillance System, New VaccineSurveillance Network.
Reference1. CDC. Estimated influenza vaccination coverage among adults and chil-
dren—United States, September 1–November 30, 2004. MMWR2004;53:1147–53.
*** Groups differ from the Advisory Committee on Immunization Practicesrecommendations to accommodate for differences in Fluarix licensedindications or lack of pediatric doses of the IND vaccine
††† Persons at high risk include adults aged >65 years, children aged 6–23 months,persons aged 2–64 years with underlying chronic medical conditions, womenwho will be pregnant during the influenza season, residents of nursing homesand long-term–care facilities, and children aged 2–18 years on chronic aspirintherapy.
enr0
Highlight
enr0
Text Box
Please note: An erratum has been published for this issue. To view the erratum, please click here.
Vol. 54 / No. 1 MMWR 17
Notice to Readers
Changes to Data Presentedin Tables I and II
This issue of MMWR incorporates modifications to TablesI and II, Provisional Cases of Selected Notifiable Diseases,United States. This year, the modifications add serogroup datato the meningococcal disease category reported in Table IIand broaden domestic arboviral disease data presented in TablesI and II to include both neuroinvasive and non-neuroinvasiveillness.
Meningococcal Disease DataMeningococcal disease is nationally reportable and the
cumulative (year-to-date) incidence data for the current andpreceding year are reported by state in Table II. Confirmedcases are those in which Neisseria meningitidis is isolated froma normally sterile site (e.g., blood or cerebrospinal fluid [CSF]or less commonly, joint, pleural, or pericardial fluid) (1). Prob-able cases of meningococcal disease include those with a posi-tive antigen test in CSF or clinical purpura fulminans in theabsence of a positive blood culture.
Most meningococcal disease in the United States is causedby N. meningitidis belonging to one of three serogroups, B,C, and Y, which caused 23%, 31%, and 39% of reportedcases, respectively, during 1996–2001 (2). Two additionalserogroups, A and W-135, are important causes of disease inother parts of the world. Disease caused by four of theseserogroups, A, C, Y, and W-135 can be prevented by vaccina-tion with a quadrivalent meningococcal polysaccharide vac-cine marketed in the United States as Menomune®. However,this vaccine is not routinely used in the general U.S. popula-tion because of its poor immunogenicity in children, shortduration of protection, and inability to induce herd immu-nity (2). A new, quadrivalent A/C/Y/W-135 protein-conjugate vaccine might become available in the United Statesin 2005 for persons aged 11–55 years. The vaccine is expectedto have improved immunogenicity in young children, pro-vide longer-lasting immunity, and might provide herd immu-nity if used in certain strategies. The Advisory Committee onImmunization Practices is considering recommendations forits use. Other meningococcal conjugate vaccines, with differ-ent formulations, combinations, and target age groups areexpected to be available within the next 5 years.
To monitor changes in the incidence of vaccine-prevent-able meningococcal disease, meningococcal disease reports
should include serogroup information. However, in 2003, only459 (26.0%) of 1,768 cases of meningococcal disease reportedto CDC included this information. To encourage serogroupreporting, the Council of State and Territorial Epidemiolo-gists (CSTE) recommends that state, territorial, and localhealth departments encourage bacterial culture for all suspectedcases of meningococcal invasive disease and that every isolateof N. meningitidis from normally sterile sites be serogrouped.CSTE further recommends that state, territorial, and localhealth departments collect serogroup information for allreported cases and report this information to CDC (3).
Beginning with this issue, meningococcal disease datareported in Table II will be presented in five columns underthe headings “All Serogroups,” “Serogroup A, C, Y, W-135,”“Serogroup B,” “Other serogroup,” and “Serogroup unknown.”These changes are intended to stimulate more completeserogroup reporting and will make Table II more informativeby permiting the data to be used for monitoring the impact ofvaccine interventions on the incidence of meningococcal dis-ease.
Domestic Arboviral Disease DataAt its 2004 meeting, CSTE broadened the surveillance case
definition for domestic arboviral diseases to include bothneuroinvasive and non-neuroinvasive illness (4). For each low-incidence domestic arbovirus (California serogroup, easternand western equine, Powassan, and St. Louis encephalitis vi-ruses), neuroinvasive and non-neuroinvasive disease reportsmeeting the revised case definition will be combined and con-tinue to appear in Table I. Case reports of West Nile virusdisease will continue to appear in Table II, with separate col-umns for neuroinvasive and non-neuroinvasive disease, con-sistent with the revised case definition.References1. CDC. Case definitions for infectious conditions under public health
surveillance. MMWR 1997;46(No. RR-10):24.2. Raghunathan PL, Bernhardt SA, Rosenstein NE. Opportunities for con-
trol of meningococcal disease in the United States. Annu Rev Med2004;55:333–53.
3. Council of State and Territorial Epidemiologists. Position statement 04-ID-08: meningococcal serogroup surveillance. Available at http://www.cste.org/ps/2004pdf/04-ID-08-final.pdf
4. Council of State and Territorial Epidemiologists. Position statement 04-ID-01: revision of national surveillance case definition of disease causedby neurotropic domestic aboviruses, including the addition to theNNDSS of non-neuroinvasive illnesses caused by these viruses. Avail-able at http://www.cste.org/ps/2004pdf/04-ID-01-final.pdf.
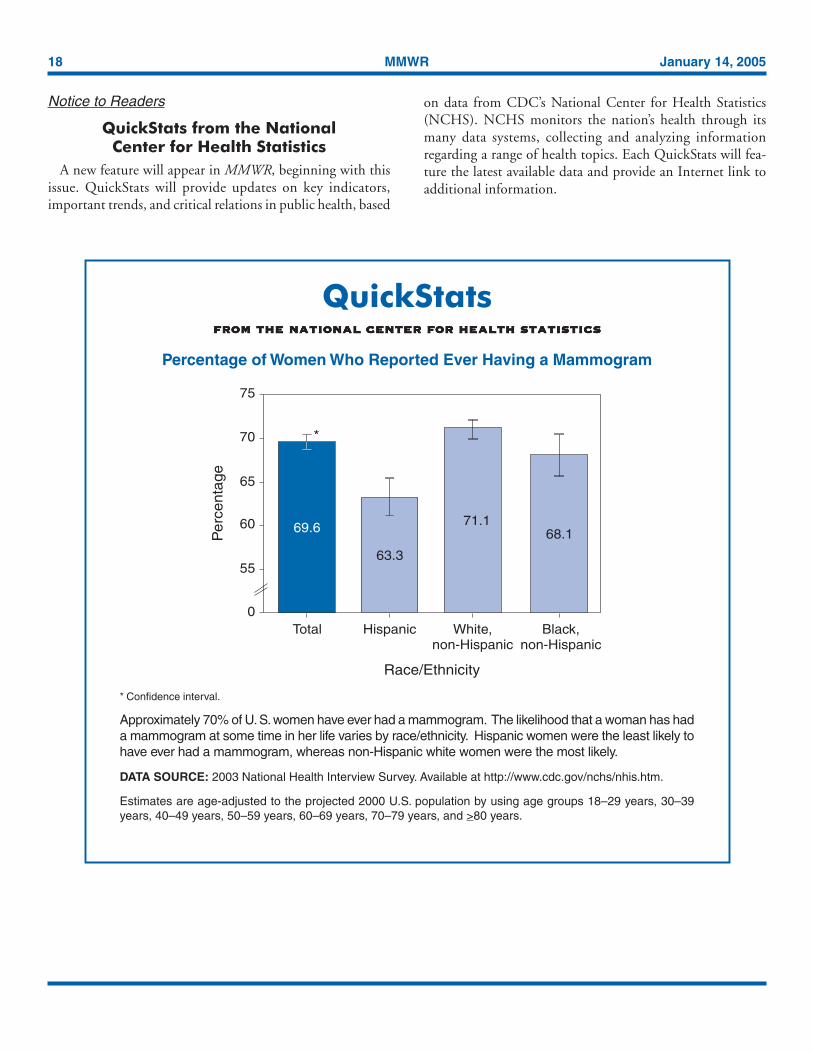
18 MMWR January 14, 2005
QuickStatsfrom the national center for health statisticsfrom the national center for health statisticsfrom the national center for health statisticsfrom the national center for health statisticsfrom the national center for health statistics
Percentage of Women Who Reported Ever Having a Mammogram
* Confidence interval.
Approximately 70% of U. S. women have ever had a mammogram. The likelihood that a woman has hada mammogram at some time in her life varies by race/ethnicity. Hispanic women were the least likely tohave ever had a mammogram, whereas non-Hispanic white women were the most likely.
DATA SOURCE: 2003 National Health Interview Survey. Available at http://www.cdc.gov/nchs/nhis.htm.
Estimates are age-adjusted to the projected 2000 U.S. population by using age groups 18–29 years, 30–39years, 40–49 years, 50–59 years, 60–69 years, 70–79 years, and >80 years.
Race/Ethnicity
Per
cent
age
75
70
65
60
0
5563.3
Hispanic
69.6
Total
71.1
White,non-Hispanic
Black,non-Hispanic
68.1
*
Notice to Readers
QuickStats from the NationalCenter for Health Statistics
A new feature will appear in MMWR, beginning with thisissue. QuickStats will provide updates on key indicators,important trends, and critical relations in public health, based
on data from CDC’s National Center for Health Statistics(NCHS). NCHS monitors the nation’s health through itsmany data systems, collecting and analyzing informationregarding a range of health topics. Each QuickStats will fea-ture the latest available data and provide an Internet link toadditional information.
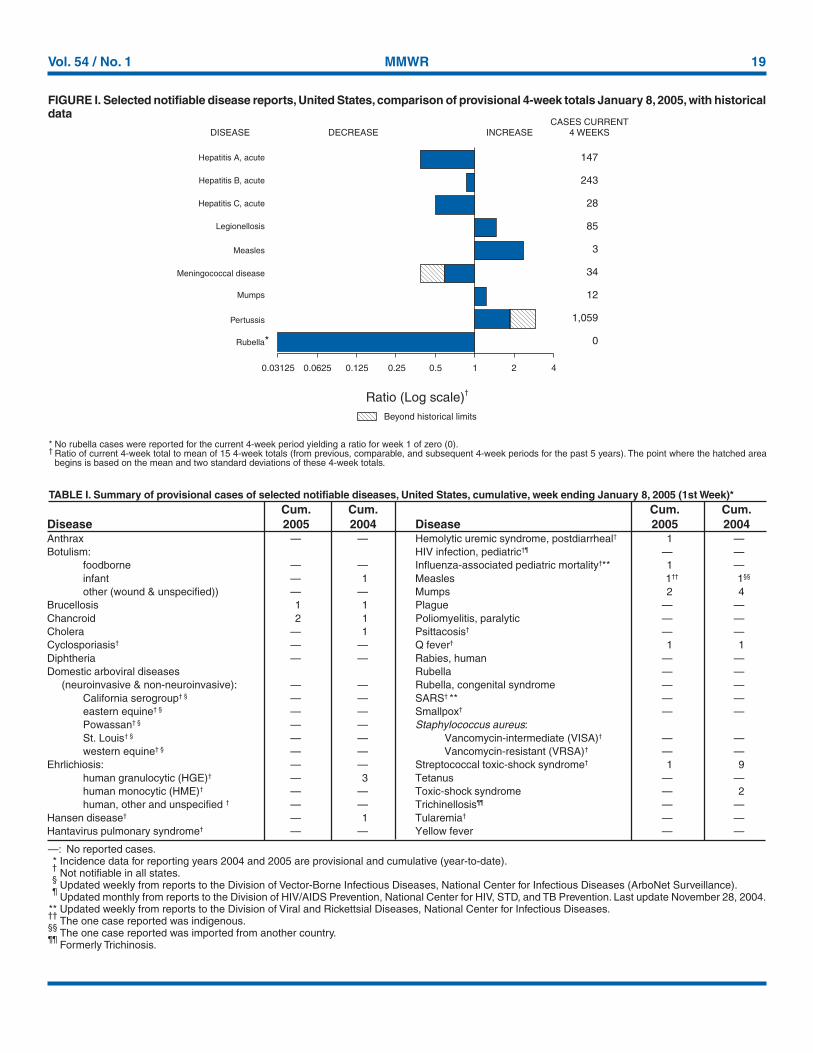
Vol. 54 / No. 1 MMWR 19
* No rubella cases were reported for the current 4-week period yielding a ratio for week 1 of zero (0).† Ratio of current 4-week total to mean of 15 4-week totals (from previous, comparable, and subsequent 4-week periods for the past 5 years). The point where the hatched area
begins is based on the mean and two standard deviations of these 4-week totals.
—: No reported cases.* Incidence data for reporting years 2004 and 2005 are provisional and cumulative (year-to-date).†
Not notifiable in all states.§
Updated weekly from reports to the Division of Vector-Borne Infectious Diseases, National Center for Infectious Diseases (ArboNet Surveillance).¶
Updated monthly from reports to the Division of HIV/AIDS Prevention, National Center for HIV, STD, and TB Prevention. Last update November 28, 2004.** Updated weekly from reports to the Division of Viral and Rickettsial Diseases, National Center for Infectious Diseases.††
The one case reported was indigenous.§§
The one case reported was imported from another country.¶¶
Formerly Trichinosis.
TABLE I. Summary of provisional cases of selected notifiable diseases, United States, cumulative, week ending January 8, 2005 (1st Week)*Cum. Cum. Cum. Cum.
Disease 2005 2004 Disease 2005 2004
FIGURE I. Selected notifiable disease reports, United States, comparison of provisional 4-week totals January 8, 2005, with historicaldata
DISEASE DECREASE INCREASECASES CURRENT
4 WEEKS
Ratio (Log scale)†
Beyond historical limits
4210.50.250.125
147
243
28
85
3
34
12
1,059
0
Hepatitis A, acute
Hepatitis B, acute
Hepatitis C, acute
Legionellosis
Measles
Mumps
Pertussis
Rubella
Meningococcal disease
0.06250.03125
*
Anthrax — — Hemolytic uremic syndrome, postdiarrheal† 1 —Botulism: HIV infection, pediatric†¶ — —
foodborne — — Influenza-associated pediatric mortality†** 1 —infant — 1 Measles 1†† 1§§
other (wound & unspecified)) — — Mumps 2 4Brucellosis 1 1 Plague — —Chancroid 2 1 Poliomyelitis, paralytic — —Cholera — 1 Psittacosis† — —Cyclosporiasis† — — Q fever† 1 1Diphtheria — — Rabies, human — —Domestic arboviral diseases Rubella — — (neuroinvasive & non-neuroinvasive): — — Rubella, congenital syndrome — —
California serogroup† § — — SARS† ** — —eastern equine† § — — Smallpox† — —Powassan† § — — Staphylococcus aureus:St. Louis† § — — Vancomycin-intermediate (VISA)† — —western equine† § — — Vancomycin-resistant (VRSA)† — —
Ehrlichiosis: — — Streptococcal toxic-shock syndrome† 1 9human granulocytic (HGE)† — 3 Tetanus — —human monocytic (HME)† — — Toxic-shock syndrome — 2human, other and unspecified † — — Trichinellosis¶¶ — —
Hansen disease† — 1 Tularemia† — —Hantavirus pulmonary syndrome† — — Yellow fever — —
20 MMWR January 14, 2005
TABLE II. Provisional cases of selected notifiable diseases, United States, weeks ending January 8, 2005, and January 10, 2004(1st Week)*
AIDS Chlamydia† Coccidioidomycosis Cryptosporidiosis
Cum. Cum. Cum. Cum. Cum. Cum. Cum. Cum.Reporting area 2005§ 2004 2005 2004 2005 2004 2005 2004UNITED STATES — 17 7,551 14,267 47 22 18 50
NEW ENGLAND — — 616 492 — — — 5Maine — — 53 27 N N — 2N.H. — — 32 35 — — — —Vt.¶ — — 6 24 — — — 1Mass. — — 244 218 — — — 2R.I. — — 82 123 — — — —Conn. — — 199 65 N N — —
MID. ATLANTIC — 14 1,015 1,597 — — 3 5Upstate N.Y. — — 55 130 N N 1 2N.Y. City — 14 282 617 — — — 2N.J. — — 225 379 — — — —Pa. — — 453 471 N N 2 1
E.N. CENTRAL — — 622 2,372 — — 4 8Ohio — — — 488 N N 4 2Ind. — — 361 323 N N — —Ill. — — 155 769 — — — 3Mich. — — — 515 — — — 1Wis. — — 106 277 — — — 2
W.N. CENTRAL — — 84 910 — — 1 3Minn. — — — 240 N N — —Iowa — — — 125 N N — —Mo. — — — 350 — — — 1N. Dak. — — 12 21 N N — —S. Dak. — — 61 23 — — 1 —Nebr.¶ — — — 87 — — — —Kans. — — 11 64 N N — 2
S. ATLANTIC — — 2,509 2,746 — — 9 14Del. — — 63 47 N N — —Md. — — 275 319 — — 3 1D.C. — — 44 63 — — — —Va. — — 571 535 — — — —W. Va. — — 39 45 N N — —N.C. — — 590 529 N N 2 7S.C.¶ — — 247 — — — — 1Ga. — — 174 800 — — 2 3Fla. — — 506 408 N N 2 2
E.S. CENTRAL — — 339 999 — — 1 3Ky. — — 188 130 N N — —Tenn.¶ — — — 416 N N — 1Ala.¶ — — 2 217 — — 1 1Miss. — — 149 236 — — — 1
W.S. CENTRAL — — 1,026 2,296 — — — 1Ark. — — 118 93 — — — —La. — — — 931 — — — —Okla. — — — 230 N N — —Tex.¶ — — 908 1,042 N N — 1
MOUNTAIN — — 609 690 45 — — 2Mont. — — 6 — N N — —Idaho — — — 26 N N — —Wyo. — — 13 17 — — — —Colo. — — 67 198 N N — 2N. Mex. — — 21 128 — — — —Ariz. — — 484 188 45 — — —Utah — — 18 25 — — — —Nev.¶ — — — 108 — — — —
PACIFIC — 3 731 2,165 2 22 — 9Wash. — — 286 157 N N — —Oreg.¶ — — 100 67 — — — —Calif. — 3 337 1,798 2 22 — 9Alaska — — 8 18 — — — —Hawaii — — — 125 — — — —
Guam — — — 22 — — — —P.R. — — 20 26 N N N NV.I. — — — 6 — — — —Amer. Samoa U U U U U U U UC.N.M.I. — U — U — U — U
N: Not notifiable. U: Unavailable. —: No reported cases. C.N.M.I.: Commonwealth of Northern Mariana Islands.* Incidence data for reporting years 2004 and 2005 are provisional and cumulative (year-to-date).† Chlamydia refers to genital infections caused by C. trachomatis.§ Updated monthly from reports to the Division of HIV/AIDS Prevention, National Center for HIV, STD, and TB Prevention. Last update November 28, 2004.¶ Contains data reported through National Electronic Disease Surveillance System (NEDSS).
Vol. 54 / No. 1 MMWR 21
TABLE II. (Continued) Provisional cases of selected notifiable diseases, United States, weeks ending January 8, 2005, and January 10, 2004(1st Week)*
Escherichia coli, Enterohemorrhagic (EHEC)Shiga toxin positive, Shiga toxin positive,
O157:H7 serogroup non-O157 not serogrouped Giardiasis GonorrheaCum. Cum. Cum. Cum. Cum. Cum. Cum. Cum. Cum. Cum.
Reporting area 2005 2004 2005 2004 2005 2004 2005 2004 2005 2004
UNITED STATES 6 22 1 — 4 1 64 239 2,739 5,793
NEW ENGLAND — — — — — — 3 25 140 121Maine — — — — — — 1 4 1 5N.H. — — — — — — — 1 2 1Vt. — — — — — — — 1 1 —Mass. — — — — — — 2 19 50 64R.I. — — — — — — — — 10 19Conn. — — — — — — — — 76 32
MID. ATLANTIC — 3 — — — — 11 56 291 560Upstate N.Y. — — — — — — 3 6 48 43N.Y. City — 1 — — — — — 19 58 228N.J. — — — — — — 6 11 62 132Pa. — 2 — — — — 2 20 123 157
E.N. CENTRAL 3 6 — — 1 1 11 44 268 1,056Ohio 3 2 — — 1 1 11 21 — 394Ind. — — — — — — — — 168 109Ill. — 2 — — — — — 10 55 337Mich. — 2 — — — — — 11 — 138Wis. — — — — — — — 2 45 78
W.N. CENTRAL — 3 — — — — 2 20 16 388Minn. — — — — — — — 3 — 118Iowa — — — — — — — 4 — 36Mo. — 2 — — — — — 9 — 170N. Dak. — — — — — — — — 1 2S. Dak. — — — — — — — — 4 5Nebr. — — — — — — 2 — — 36Kans. — 1 — — — — — 4 11 21
S. ATLANTIC 2 2 — — 3 — 14 42 1,071 1,343Del. — — N N N N — — 11 19Md. 2 — — — — — 4 1 139 145D.C. — — — — — — — — 29 60Va. — — — — — — — — 152 217W. Va. — — — — — — — — 12 16N.C. — — — — 3 — N N 264 284S.C. — — — — — — — — 138 —Ga. — 1 — — — — 1 24 85 374Fla. — 1 — — — — 9 17 241 228
E.S. CENTRAL — — — — — — 4 2 153 562Ky. — — — — — — N N 86 72Tenn. — — — — — — 1 2 — 208Ala. — — — — — — 3 — 3 172Miss. — — — — — — — — 64 110
W.S. CENTRAL — 1 — — — — — 1 457 1,015Ark. — — — — — — — — 78 46La. — — — — — — — 1 — 475Okla. — — — — — — — — — 104Tex. — 1 — — — — N N 379 390
MOUNTAIN — — 1 — — — 10 17 160 195Mont. — — — — — — — — 1 —Idaho — — — — — — — 1 — 1Wyo. — — — — — — — — 1 —Colo. — — 1 — — — 9 12 44 67N. Mex. — — — — — — — 1 2 11Ariz. — — N N N N 1 — 111 58Utah — — — — — — — 1 1 6Nev. — — — — — — — 2 — 52
PACIFIC 1 7 — — — — 9 32 183 553Wash. — — — — — — — — 35 38Oreg. — 1 — — — — 3 7 19 6Calif. — 4 — — — — 3 25 128 474Alaska — — — — — — 2 — 1 3Hawaii 1 2 — — — — 1 — — 32
Guam N N — — — — — — — 6P.R. — — — — — — — — 8 —V.I. — — — — — — — — — 2Amer. Samoa U U U U U U U U U UC.N.M.I. — U — U — U — U — U
N: Not notifiable. U: Unavailable. —: No reported cases. C.N.M.I.: Commonwealth of Northern Mariana Islands.* Incidence data for reporting years 2004 and 2005 are provisional and cumulative (year-to-date).
22 MMWR January 14, 2005
TABLE II. (Continued) Provisional cases of selected notifiable diseases, United States, weeks ending January 8, 2005, and January 10, 2004(1st Week)*
Haemophilus influenzae, invasive
All ages Age <5 years
All serotypes Serotype b Non-serotype b Unknown serotypeCum. Cum. Cum. Cum. Cum. Cum. Cum. Cum.
Reporting area 2005 2004 2005 2004 2005 2004 2005 2004UNITED STATES 20 55 — — 1 — 1 9
NEW ENGLAND — 3 — — — — — —Maine — — — — — — — —N.H. — — — — — — — —Vt. — 1 — — — — — —Mass. — 2 — — — — — —R.I. — — — — — — — —Conn. — — — — — — — —
MID. ATLANTIC 7 19 — — — — — 2Upstate N.Y. 1 3 — — — — — —N.Y. City 1 2 — — — — — 1N.J. 1 6 — — — — — 1Pa. 4 8 — — — — — —
E.N. CENTRAL 2 8 — — — — — 4Ohio 1 3 — — — — — 1Ind. 1 — — — — — — —Ill. — 2 — — — — — 1Mich. — 2 — — — — — 1Wis. — 1 — — — — — 1
W.N. CENTRAL — 3 — — — — — —Minn. — — — — — — — —Iowa — — — — — — — —Mo. — — — — — — — —N. Dak. — — — — — — — —S. Dak. — — — — — — — —Nebr. — 3 — — — — — —Kans. — — — — — — — —
S. ATLANTIC 10 11 — — 1 — 1 2Del. — — — — — — — —Md. 3 5 — — 1 — 1 —D.C. — — — — — — — —Va. — — — — — — — —W. Va. — — — — — — — —N.C. 2 — — — — — — —S.C. — — — — — — — —Ga. — 4 — — — — — 2Fla. 5 2 — — — — — —
E.S. CENTRAL — 1 — — — — — —Ky. — — — — — — — —Tenn. — 1 — — — — — —Ala. — — — — — — — —Miss. — — — — — — — —
W.S. CENTRAL — 1 — — — — — —Ark. — — — — — — — —La. — 1 — — — — — —Okla. — — — — — — — —Tex. — — — — — — — —
MOUNTAIN — 8 — — — — — 1Mont. — — — — — — — —Idaho — — — — — — — —Wyo. — — — — — — — —Colo. — 4 — — — — — —N. Mex. — 3 — — — — — 1Ariz. — — — — — — — —Utah — — — — — — — —Nev. — 1 — — — — — —
PACIFIC 1 1 — — — — — —Wash. — — — — — — — —Oreg. — 1 — — — — — —Calif. — — — — — — — —Alaska 1 — — — — — — —Hawaii — — — — — — — —
Guam — — — — — — — —P.R. — — — — — — — —V.I. — — — — — — — —Amer. Samoa U U U U U U U UC.N.M.I. — U — U — U — U
N: Not notifiable. U: Unavailable. —: No reported cases. C.N.M.I.: Commonwealth of Northern Mariana Islands.* Incidence data for reporting years 2004 and 2005 are provisional and cumulative (year-to-date).
Vol. 54 / No. 1 MMWR 23
TABLE II. (Continued) Provisional cases of selected notifiable diseases, United States, weeks ending January 8, 2005, and January 10, 2004(1st Week)*
Hepatitis (viral, acute), by typeA B C
Cum. Cum. Cum. Cum. Cum. Cum.Reporting area 2005 2004 2005 2004 2005 2004UNITED STATES 25 100 43 72 4 19
NEW ENGLAND 10 13 2 4 — —Maine — — — — — —N.H. — — — — — —Vt. — — — — — —Mass. 8 12 2 2 — —R.I. — — — — — —Conn. 2 1 — 2 — —
MID. ATLANTIC — 22 14 10 1 3Upstate N.Y. — — — — — —N.Y. City — 5 — 1 — —N.J. — 7 13 5 — —Pa. — 10 1 4 1 3
E.N. CENTRAL 1 8 1 3 — 1Ohio 1 1 1 1 — —Ind. — — — — — —Ill. — 6 — — — —Mich. — 1 — 2 — 1Wis. — — — — — —
W.N. CENTRAL — 2 1 7 — 4Minn. — — — — — —Iowa — — — — — —Mo. — — — 6 — 4N. Dak. — — — — — —S. Dak. — — — — — —Nebr. — 2 1 1 — —Kans. — — — — — —
S. ATLANTIC 6 27 24 26 2 2Del. — — — — — —Md. — 2 1 1 2 1D.C. — — — — — —Va. — — — — — —W. Va. — — — — — —N.C. — — 10 — — —S.C. — — — — — —Ga. — 17 3 17 — 1Fla. 6 8 10 8 — —
E.S. CENTRAL — 2 — 5 1 1Ky. — — — — — —Tenn. — — — — — —Ala. — 2 — — 1 —Miss. — — — 5 — 1
W.S. CENTRAL — 18 — 5 — 6Ark. — — — — — —La. — 1 — 5 — 4Okla. — — — — — —Tex. — 17 — — — 2
MOUNTAIN 7 1 — 4 — —Mont. 1 — — — — —Idaho — — — — — —Wyo. — — — 1 — —Colo. — 1 — — — —N. Mex. — — — — — —Ariz. 6 — — — — —Utah — — — — — —Nev. — — — 3 — —
PACIFIC 1 7 1 8 — 2Wash. — — — — — —Oreg. 1 — — 3 — 1Calif. — 7 1 5 — —Alaska — — — — — —Hawaii — — — — — 1
Guam — — — — — —P.R. — — — — — —V.I. — — — — — —Amer. Samoa U U U U U UC.N.M.I. — U — U — U
N: Not notifiable. U: Unavailable. —: No reported cases. C.N.M.I.: Commonwealth of Northern Mariana Islands.* Incidence data for reporting years 2004 and 2005 are provisional and cumulative (year-to-date).
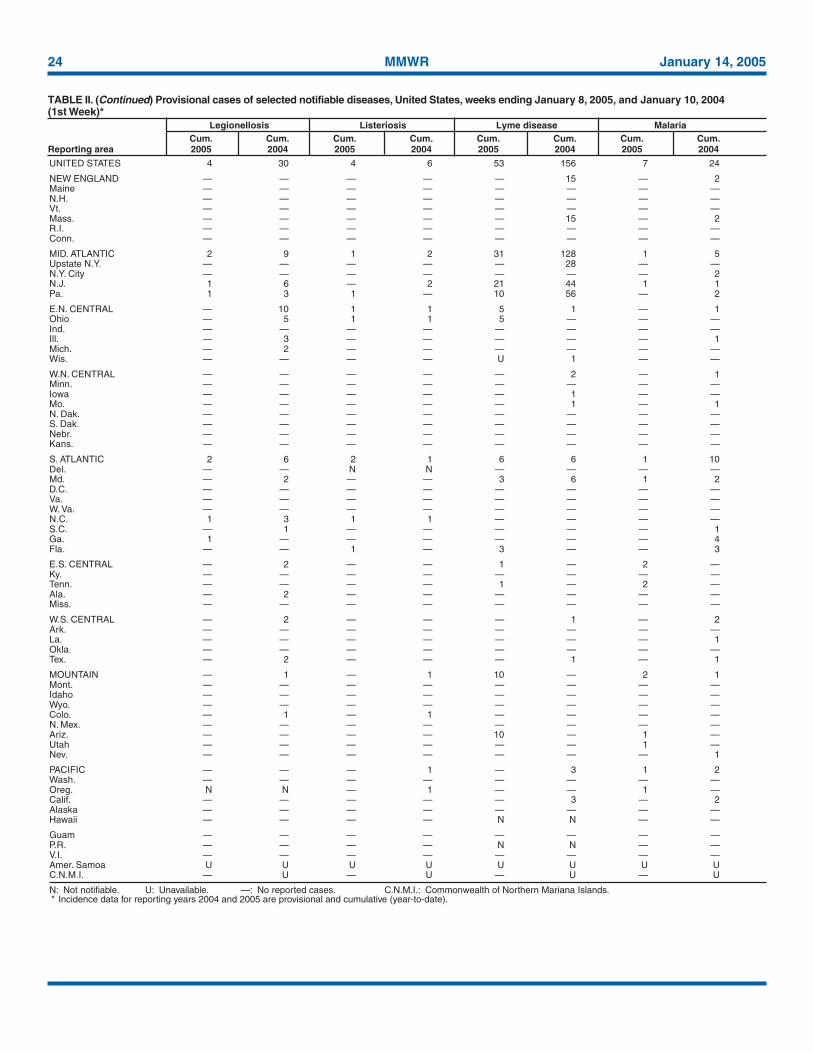
24 MMWR January 14, 2005
TABLE II. (Continued) Provisional cases of selected notifiable diseases, United States, weeks ending January 8, 2005, and January 10, 2004(1st Week)*
Legionellosis Listeriosis Lyme disease MalariaCum. Cum. Cum. Cum. Cum. Cum. Cum. Cum.
Reporting area 2005 2004 2005 2004 2005 2004 2005 2004
UNITED STATES 4 30 4 6 53 156 7 24
NEW ENGLAND — — — — — 15 — 2Maine — — — — — — — —N.H. — — — — — — — —Vt. — — — — — — — —Mass. — — — — — 15 — 2R.I. — — — — — — — —Conn. — — — — — — — —
MID. ATLANTIC 2 9 1 2 31 128 1 5Upstate N.Y. — — — — — 28 — —N.Y. City — — — — — — — 2N.J. 1 6 — 2 21 44 1 1Pa. 1 3 1 — 10 56 — 2
E.N. CENTRAL — 10 1 1 5 1 — 1Ohio — 5 1 1 5 — — —Ind. — — — — — — — —Ill. — 3 — — — — — 1Mich. — 2 — — — — — —Wis. — — — — U 1 — —
W.N. CENTRAL — — — — — 2 — 1Minn. — — — — — — — —Iowa — — — — — 1 — —Mo. — — — — — 1 — 1N. Dak. — — — — — — — —S. Dak. — — — — — — — —Nebr. — — — — — — — —Kans. — — — — — — — —
S. ATLANTIC 2 6 2 1 6 6 1 10Del. — — N N — — — —Md. — 2 — — 3 6 1 2D.C. — — — — — — — —Va. — — — — — — — —W. Va. — — — — — — — —N.C. 1 3 1 1 — — — —S.C. — 1 — — — — — 1Ga. 1 — — — — — — 4Fla. — — 1 — 3 — — 3
E.S. CENTRAL — 2 — — 1 — 2 —Ky. — — — — — — — —Tenn. — — — — 1 — 2 —Ala. — 2 — — — — — —Miss. — — — — — — — —
W.S. CENTRAL — 2 — — — 1 — 2Ark. — — — — — — — —La. — — — — — — — 1Okla. — — — — — — — —Tex. — 2 — — — 1 — 1
MOUNTAIN — 1 — 1 10 — 2 1Mont. — — — — — — — —Idaho — — — — — — — —Wyo. — — — — — — — —Colo. — 1 — 1 — — — —N. Mex. — — — — — — — —Ariz. — — — — 10 — 1 —Utah — — — — — — 1 —Nev. — — — — — — — 1
PACIFIC — — — 1 — 3 1 2Wash. — — — — — — — —Oreg. N N — 1 — — 1 —Calif. — — — — — 3 — 2Alaska — — — — — — — —Hawaii — — — — N N — —
Guam — — — — — — — —P.R. — — — — N N — —V.I. — — — — — — — —Amer. Samoa U U U U U U U UC.N.M.I. — U — U — U — U
N: Not notifiable. U: Unavailable. —: No reported cases. C.N.M.I.: Commonwealth of Northern Mariana Islands.* Incidence data for reporting years 2004 and 2005 are provisional and cumulative (year-to-date).
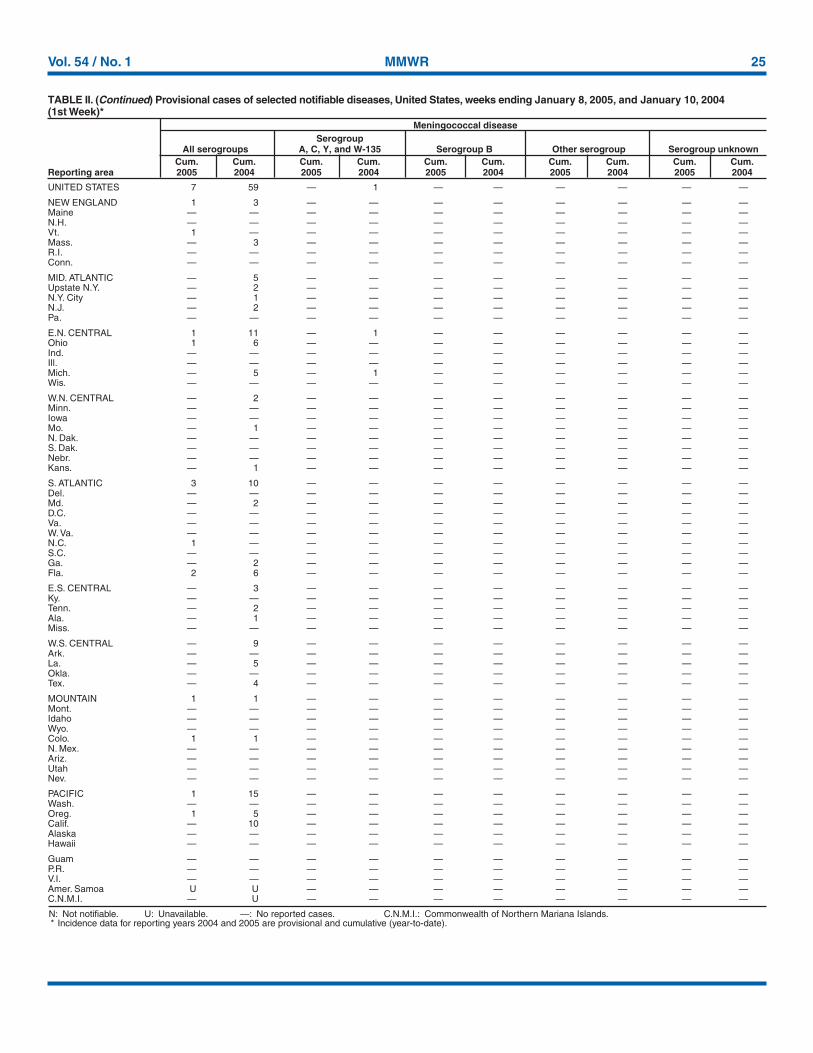
Vol. 54 / No. 1 MMWR 25
TABLE II. (Continued) Provisional cases of selected notifiable diseases, United States, weeks ending January 8, 2005, and January 10, 2004(1st Week)*
Meningococcal diseaseSerogroup
All serogroups A, C, Y, and W-135 Serogroup B Other serogroup Serogroup unknownCum. Cum. Cum. Cum. Cum. Cum. Cum. Cum. Cum. Cum.
Reporting area 2005 2004 2005 2004 2005 2004 2005 2004 2005 2004
UNITED STATES 7 59 — 1 — — — — — —
NEW ENGLAND 1 3 — — — — — — — —Maine — — — — — — — — — —N.H. — — — — — — — — — —Vt. 1 — — — — — — — — —Mass. — 3 — — — — — — — —R.I. — — — — — — — — — —Conn. — — — — — — — — — —
MID. ATLANTIC — 5 — — — — — — — —Upstate N.Y. — 2 — — — — — — — —N.Y. City — 1 — — — — — — — —N.J. — 2 — — — — — — — —Pa. — — — — — — — — — —
E.N. CENTRAL 1 11 — 1 — — — — — —Ohio 1 6 — — — — — — — —Ind. — — — — — — — — — —Ill. — — — — — — — — — —Mich. — 5 — 1 — — — — — —Wis. — — — — — — — — — —
W.N. CENTRAL — 2 — — — — — — — —Minn. — — — — — — — — — —Iowa — — — — — — — — — —Mo. — 1 — — — — — — — —N. Dak. — — — — — — — — — —S. Dak. — — — — — — — — — —Nebr. — — — — — — — — — —Kans. — 1 — — — — — — — —
S. ATLANTIC 3 10 — — — — — — — —Del. — — — — — — — — — —Md. — 2 — — — — — — — —D.C. — — — — — — — — — —Va. — — — — — — — — — —W. Va. — — — — — — — — — —N.C. 1 — — — — — — — — —S.C. — — — — — — — — — —Ga. — 2 — — — — — — — —Fla. 2 6 — — — — — — — —
E.S. CENTRAL — 3 — — — — — — — —Ky. — — — — — — — — — —Tenn. — 2 — — — — — — — —Ala. — 1 — — — — — — — —Miss. — — — — — — — — — —
W.S. CENTRAL — 9 — — — — — — — —Ark. — — — — — — — — — —La. — 5 — — — — — — — —Okla. — — — — — — — — — —Tex. — 4 — — — — — — — —
MOUNTAIN 1 1 — — — — — — — —Mont. — — — — — — — — — —Idaho — — — — — — — — — —Wyo. — — — — — — — — — —Colo. 1 1 — — — — — — — —N. Mex. — — — — — — — — — —Ariz. — — — — — — — — — —Utah — — — — — — — — — —Nev. — — — — — — — — — —
PACIFIC 1 15 — — — — — — — —Wash. — — — — — — — — — —Oreg. 1 5 — — — — — — — —Calif. — 10 — — — — — — — —Alaska — — — — — — — — — —Hawaii — — — — — — — — — —
Guam — — — — — — — — — —P.R. — — — — — — — — — —V.I. — — — — — — — — — —Amer. Samoa U U — — — — — — — —C.N.M.I. — U — — — — — — — —
N: Not notifiable. U: Unavailable. —: No reported cases. C.N.M.I.: Commonwealth of Northern Mariana Islands.* Incidence data for reporting years 2004 and 2005 are provisional and cumulative (year-to-date).
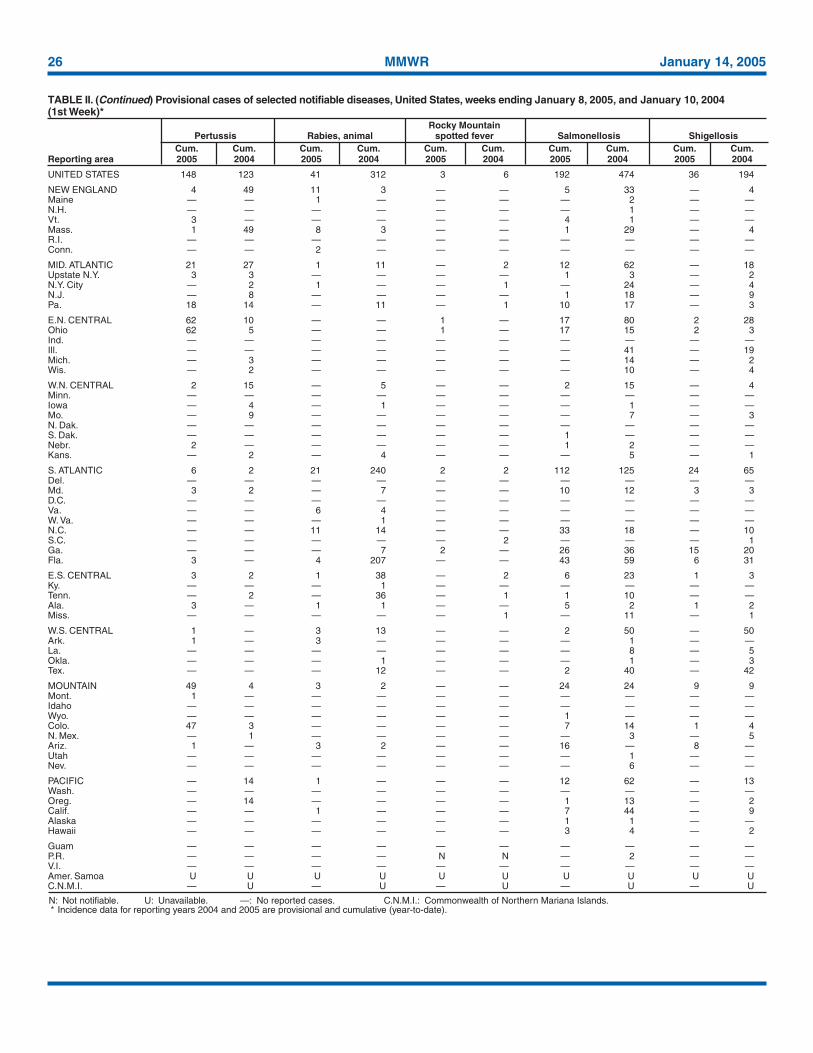
26 MMWR January 14, 2005
TABLE II. (Continued) Provisional cases of selected notifiable diseases, United States, weeks ending January 8, 2005, and January 10, 2004(1st Week)*
Rocky MountainPertussis Rabies, animal spotted fever Salmonellosis Shigellosis
Cum. Cum. Cum. Cum. Cum. Cum. Cum. Cum. Cum. Cum.Reporting area 2005 2004 2005 2004 2005 2004 2005 2004 2005 2004
UNITED STATES 148 123 41 312 3 6 192 474 36 194
NEW ENGLAND 4 49 11 3 — — 5 33 — 4Maine — — 1 — — — — 2 — —N.H. — — — — — — — 1 — —Vt. 3 — — — — — 4 1 — —Mass. 1 49 8 3 — — 1 29 — 4R.I. — — — — — — — — — —Conn. — — 2 — — — — — — —
MID. ATLANTIC 21 27 1 11 — 2 12 62 — 18Upstate N.Y. 3 3 — — — — 1 3 — 2N.Y. City — 2 1 — — 1 — 24 — 4N.J. — 8 — — — — 1 18 — 9Pa. 18 14 — 11 — 1 10 17 — 3
E.N. CENTRAL 62 10 — — 1 — 17 80 2 28Ohio 62 5 — — 1 — 17 15 2 3Ind. — — — — — — — — — —Ill. — — — — — — — 41 — 19Mich. — 3 — — — — — 14 — 2Wis. — 2 — — — — — 10 — 4
W.N. CENTRAL 2 15 — 5 — — 2 15 — 4Minn. — — — — — — — — — —Iowa — 4 — 1 — — — 1 — —Mo. — 9 — — — — — 7 — 3N. Dak. — — — — — — — — — —S. Dak. — — — — — — 1 — — —Nebr. 2 — — — — — 1 2 — —Kans. — 2 — 4 — — — 5 — 1
S. ATLANTIC 6 2 21 240 2 2 112 125 24 65Del. — — — — — — — — — —Md. 3 2 — 7 — — 10 12 3 3D.C. — — — — — — — — — —Va. — — 6 4 — — — — — —W. Va. — — — 1 — — — — — —N.C. — — 11 14 — — 33 18 — 10S.C. — — — — — 2 — — — 1Ga. — — — 7 2 — 26 36 15 20Fla. 3 — 4 207 — — 43 59 6 31
E.S. CENTRAL 3 2 1 38 — 2 6 23 1 3Ky. — — — 1 — — — — — —Tenn. — 2 — 36 — 1 1 10 — —Ala. 3 — 1 1 — — 5 2 1 2Miss. — — — — — 1 — 11 — 1
W.S. CENTRAL 1 — 3 13 — — 2 50 — 50Ark. 1 — 3 — — — — 1 — —La. — — — — — — — 8 — 5Okla. — — — 1 — — — 1 — 3Tex. — — — 12 — — 2 40 — 42
MOUNTAIN 49 4 3 2 — — 24 24 9 9Mont. 1 — — — — — — — — —Idaho — — — — — — — — — —Wyo. — — — — — — 1 — — —Colo. 47 3 — — — — 7 14 1 4N. Mex. — 1 — — — — — 3 — 5Ariz. 1 — 3 2 — — 16 — 8 —Utah — — — — — — — 1 — —Nev. — — — — — — — 6 — —
PACIFIC — 14 1 — — — 12 62 — 13Wash. — — — — — — — — — —Oreg. — 14 — — — — 1 13 — 2Calif. — — 1 — — — 7 44 — 9Alaska — — — — — — 1 1 — —Hawaii — — — — — — 3 4 — 2
Guam — — — — — — — — — —P.R. — — — — N N — 2 — —V.I. — — — — — — — — — —Amer. Samoa U U U U U U U U U UC.N.M.I. — U — U — U — U — U
N: Not notifiable. U: Unavailable. —: No reported cases. C.N.M.I.: Commonwealth of Northern Mariana Islands.* Incidence data for reporting years 2004 and 2005 are provisional and cumulative (year-to-date).
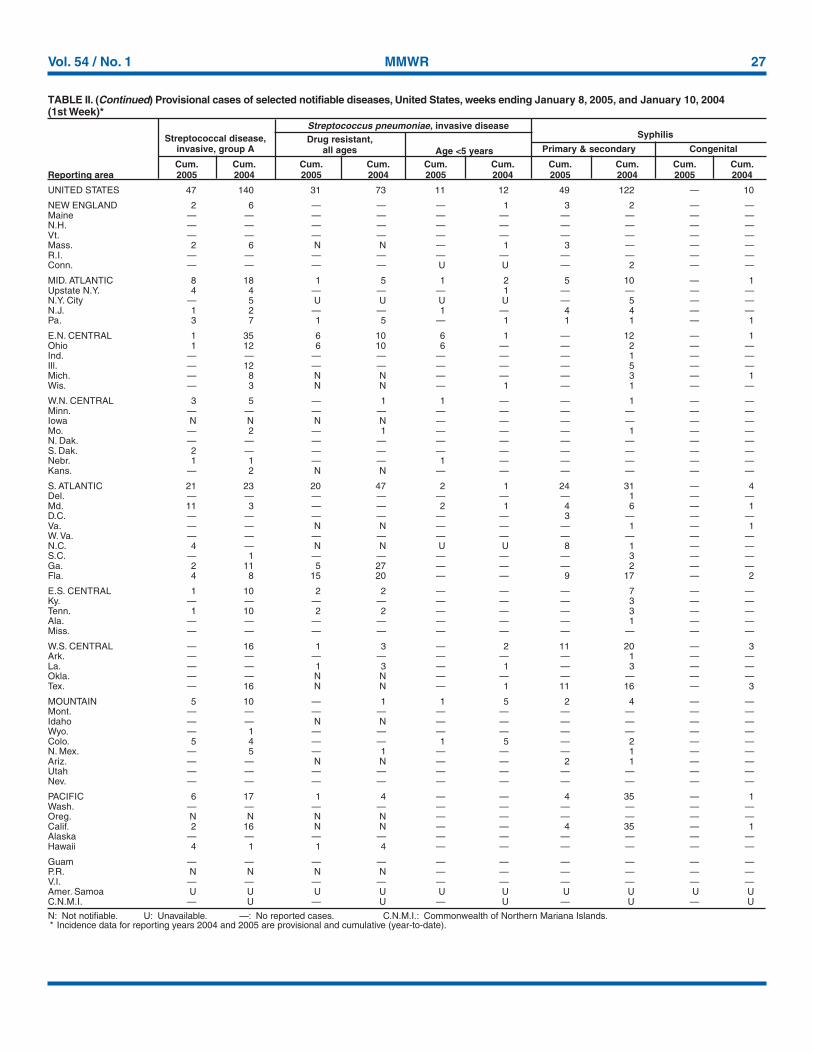
Vol. 54 / No. 1 MMWR 27
N: Not notifiable. U: Unavailable. —: No reported cases. C.N.M.I.: Commonwealth of Northern Mariana Islands.* Incidence data for reporting years 2004 and 2005 are provisional and cumulative (year-to-date).
TABLE II. (Continued) Provisional cases of selected notifiable diseases, United States, weeks ending January 8, 2005, and January 10, 2004(1st Week)*
Streptococcus pneumoniae, invasive diseaseStreptococcal disease, Drug resistant, Syphilis
invasive, group A all ages Age <5 years Primary & secondary Congenital
Cum. Cum. Cum. Cum. Cum. Cum. Cum. Cum. Cum. Cum.Reporting area 2005 2004 2005 2004 2005 2004 2005 2004 2005 2004
UNITED STATES 47 140 31 73 11 12 49 122 — 10
NEW ENGLAND 2 6 — — — 1 3 2 — —Maine — — — — — — — — — —N.H. — — — — — — — — — —Vt. — — — — — — — — — —Mass. 2 6 N N — 1 3 — — —R.I. — — — — — — — — — —Conn. — — — — U U — 2 — —
MID. ATLANTIC 8 18 1 5 1 2 5 10 — 1Upstate N.Y. 4 4 — — — 1 — — — —N.Y. City — 5 U U U U — 5 — —N.J. 1 2 — — 1 — 4 4 — —Pa. 3 7 1 5 — 1 1 1 — 1
E.N. CENTRAL 1 35 6 10 6 1 — 12 — 1Ohio 1 12 6 10 6 — — 2 — —Ind. — — — — — — — 1 — —Ill. — 12 — — — — — 5 — —Mich. — 8 N N — — — 3 — 1Wis. — 3 N N — 1 — 1 — —
W.N. CENTRAL 3 5 — 1 1 — — 1 — —Minn. — — — — — — — — — —Iowa N N N N — — — — — —Mo. — 2 — 1 — — — 1 — —N. Dak. — — — — — — — — — —S. Dak. 2 — — — — — — — — —Nebr. 1 1 — — 1 — — — — —Kans. — 2 N N — — — — — —
S. ATLANTIC 21 23 20 47 2 1 24 31 — 4Del. — — — — — — — 1 — —Md. 11 3 — — 2 1 4 6 — 1D.C. — — — — — — 3 — — —Va. — — N N — — — 1 — 1W. Va. — — — — — — — — — —N.C. 4 — N N U U 8 1 — —S.C. — 1 — — — — — 3 — —Ga. 2 11 5 27 — — — 2 — —Fla. 4 8 15 20 — — 9 17 — 2
E.S. CENTRAL 1 10 2 2 — — — 7 — —Ky. — — — — — — — 3 — —Tenn. 1 10 2 2 — — — 3 — —Ala. — — — — — — — 1 — —Miss. — — — — — — — — — —
W.S. CENTRAL — 16 1 3 — 2 11 20 — 3Ark. — — — — — — — 1 — —La. — — 1 3 — 1 — 3 — —Okla. — — N N — — — — — —Tex. — 16 N N — 1 11 16 — 3
MOUNTAIN 5 10 — 1 1 5 2 4 — —Mont. — — — — — — — — — —Idaho — — N N — — — — — —Wyo. — 1 — — — — — — — —Colo. 5 4 — — 1 5 — 2 — —N. Mex. — 5 — 1 — — — 1 — —Ariz. — — N N — — 2 1 — —Utah — — — — — — — — — —Nev. — — — — — — — — — —
PACIFIC 6 17 1 4 — — 4 35 — 1Wash. — — — — — — — — — —Oreg. N N N N — — — — — —Calif. 2 16 N N — — 4 35 — 1Alaska — — — — — — — — — —Hawaii 4 1 1 4 — — — — — —
Guam — — — — — — — — — —P.R. N N N N — — — — — —V.I. — — — — — — — — — —Amer. Samoa U U U U U U U U U UC.N.M.I. — U — U — U — U — U
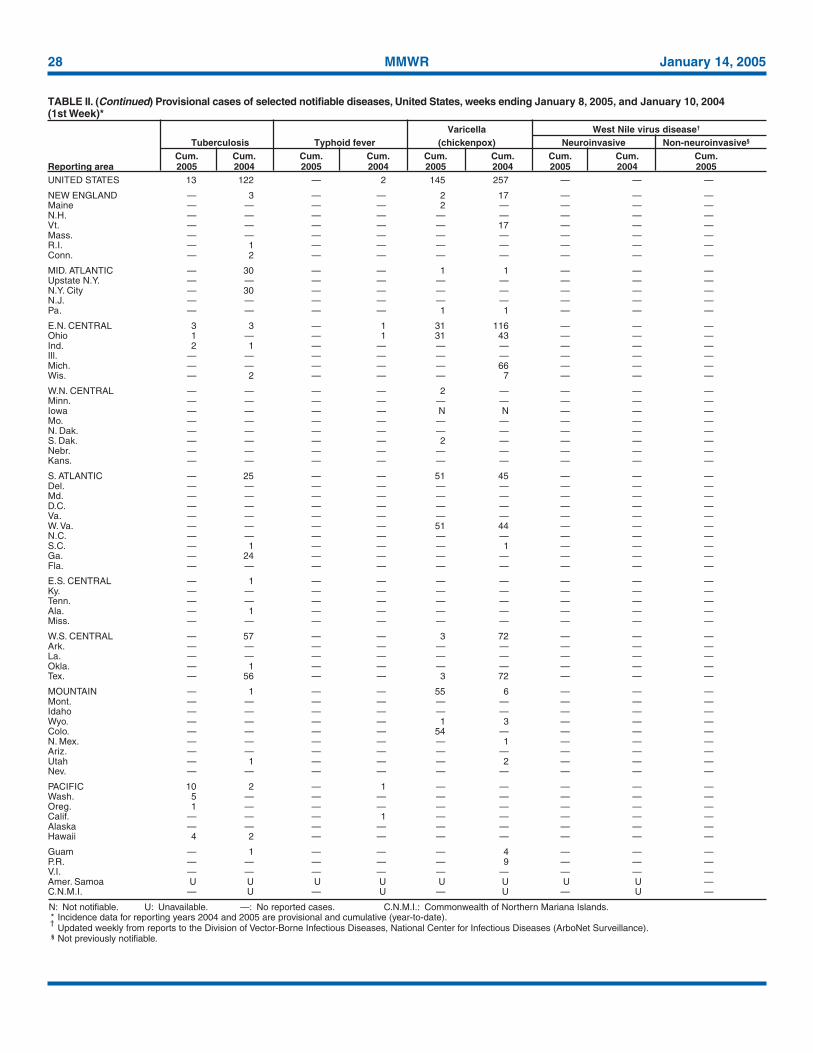
28 MMWR January 14, 2005
TABLE II. (Continued) Provisional cases of selected notifiable diseases, United States, weeks ending January 8, 2005, and January 10, 2004(1st Week)*
Varicella West Nile virus disease†
Tuberculosis Typhoid fever (chickenpox) Neuroinvasive Non-neuroinvasive§
Cum. Cum. Cum. Cum. Cum. Cum. Cum. Cum. Cum.Reporting area 2005 2004 2005 2004 2005 2004 2005 2004 2005UNITED STATES 13 122 — 2 145 257 — — —
NEW ENGLAND — 3 — — 2 17 — — —Maine — — — — 2 — — — —N.H. — — — — — — — — —Vt. — — — — — 17 — — —Mass. — — — — — — — — —R.I. — 1 — — — — — — —Conn. — 2 — — — — — — —
MID. ATLANTIC — 30 — — 1 1 — — —Upstate N.Y. — — — — — — — — —N.Y. City — 30 — — — — — — —N.J. — — — — — — — — —Pa. — — — — 1 1 — — —
E.N. CENTRAL 3 3 — 1 31 116 — — —Ohio 1 — — 1 31 43 — — —Ind. 2 1 — — — — — — —Ill. — — — — — — — — —Mich. — — — — — 66 — — —Wis. — 2 — — — 7 — — —
W.N. CENTRAL — — — — 2 — — — —Minn. — — — — — — — — —Iowa — — — — N N — — —Mo. — — — — — — — — —N. Dak. — — — — — — — — —S. Dak. — — — — 2 — — — —Nebr. — — — — — — — — —Kans. — — — — — — — — —
S. ATLANTIC — 25 — — 51 45 — — —Del. — — — — — — — — —Md. — — — — — — — — —D.C. — — — — — — — — —Va. — — — — — — — — —W. Va. — — — — 51 44 — — —N.C. — — — — — — — — —S.C. — 1 — — — 1 — — —Ga. — 24 — — — — — — —Fla. — — — — — — — — —
E.S. CENTRAL — 1 — — — — — — —Ky. — — — — — — — — —Tenn. — — — — — — — — —Ala. — 1 — — — — — — —Miss. — — — — — — — — —
W.S. CENTRAL — 57 — — 3 72 — — —Ark. — — — — — — — — —La. — — — — — — — — —Okla. — 1 — — — — — — —Tex. — 56 — — 3 72 — — —
MOUNTAIN — 1 — — 55 6 — — —Mont. — — — — — — — — —Idaho — — — — — — — — —Wyo. — — — — 1 3 — — —Colo. — — — — 54 — — — —N. Mex. — — — — — 1 — — —Ariz. — — — — — — — — —Utah — 1 — — — 2 — — —Nev. — — — — — — — — —
PACIFIC 10 2 — 1 — — — — —Wash. 5 — — — — — — — —Oreg. 1 — — — — — — — —Calif. — — — 1 — — — — —Alaska — — — — — — — — —Hawaii 4 2 — — — — — — —
Guam — 1 — — — 4 — — —P.R. — — — — — 9 — — —V.I. — — — — — — — — —Amer. Samoa U U U U U U U U —C.N.M.I. — U — U — U — U —
N: Not notifiable. U: Unavailable. —: No reported cases. C.N.M.I.: Commonwealth of Northern Mariana Islands.* Incidence data for reporting years 2004 and 2005 are provisional and cumulative (year-to-date).†
Updated weekly from reports to the Division of Vector-Borne Infectious Diseases, National Center for Infectious Diseases (ArboNet Surveillance).§ Not previously notifiable.
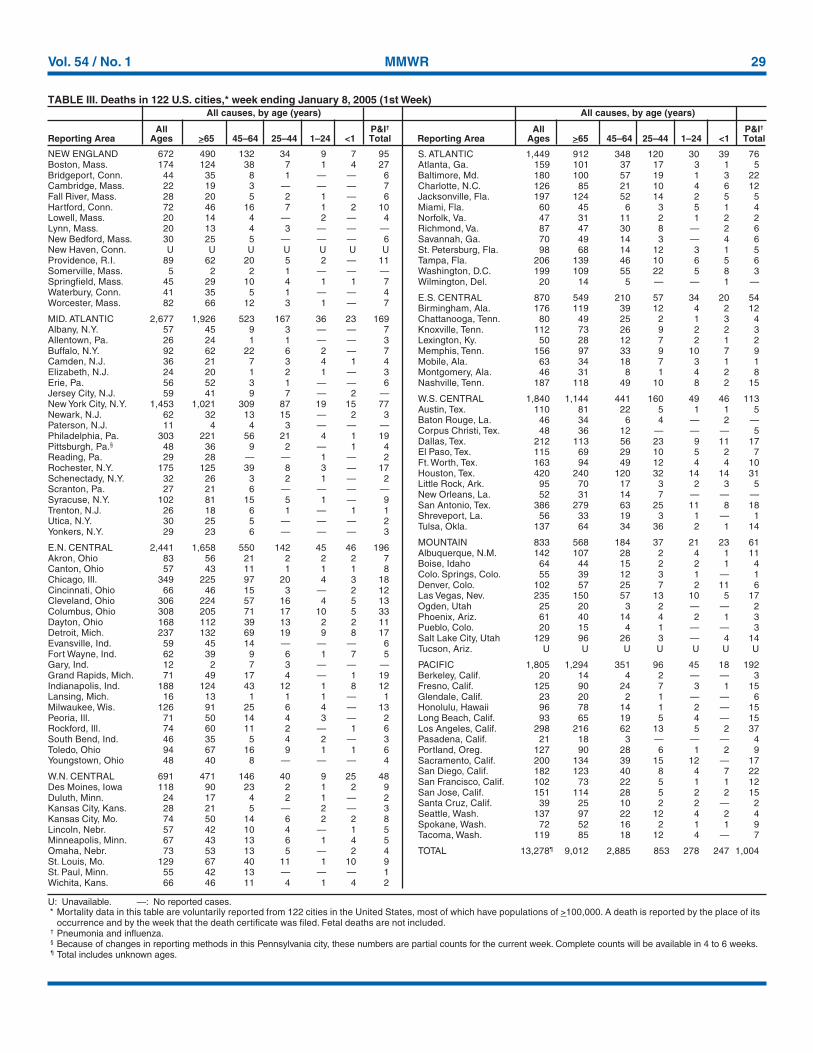
Vol. 54 / No. 1 MMWR 29
U: Unavailable. —: No reported cases.* Mortality data in this table are voluntarily reported from 122 cities in the United States, most of which have populations of >100,000. A death is reported by the place of its
occurrence and by the week that the death certificate was filed. Fetal deaths are not included.† Pneumonia and influenza.§ Because of changes in reporting methods in this Pennsylvania city, these numbers are partial counts for the current week. Complete counts will be available in 4 to 6 weeks.¶ Total includes unknown ages.
TABLE III. Deaths in 122 U.S. cities,* week ending January 8, 2005 (1st Week)All causes, by age (years) All causes, by age (years)
All P&I† All P&I†
Reporting Area Ages >65 45–64 25–44 1–24 <1 Total Reporting Area Ages >65 45–64 25–44 1–24 <1 Total
NEW ENGLAND 672 490 132 34 9 7 95Boston, Mass. 174 124 38 7 1 4 27Bridgeport, Conn. 44 35 8 1 — — 6Cambridge, Mass. 22 19 3 — — — 7Fall River, Mass. 28 20 5 2 1 — 6Hartford, Conn. 72 46 16 7 1 2 10Lowell, Mass. 20 14 4 — 2 — 4Lynn, Mass. 20 13 4 3 — — —New Bedford, Mass. 30 25 5 — — — 6New Haven, Conn. U U U U U U UProvidence, R.I. 89 62 20 5 2 — 11Somerville, Mass. 5 2 2 1 — — —Springfield, Mass. 45 29 10 4 1 1 7Waterbury, Conn. 41 35 5 1 — — 4Worcester, Mass. 82 66 12 3 1 — 7
MID. ATLANTIC 2,677 1,926 523 167 36 23 169Albany, N.Y. 57 45 9 3 — — 7Allentown, Pa. 26 24 1 1 — — 3Buffalo, N.Y. 92 62 22 6 2 — 7Camden, N.J. 36 21 7 3 4 1 4Elizabeth, N.J. 24 20 1 2 1 — 3Erie, Pa. 56 52 3 1 — — 6Jersey City, N.J. 59 41 9 7 — 2 —New York City, N.Y. 1,453 1,021 309 87 19 15 77Newark, N.J. 62 32 13 15 — 2 3Paterson, N.J. 11 4 4 3 — — —Philadelphia, Pa. 303 221 56 21 4 1 19Pittsburgh, Pa.§ 48 36 9 2 — 1 4Reading, Pa. 29 28 — — 1 — 2Rochester, N.Y. 175 125 39 8 3 — 17Schenectady, N.Y. 32 26 3 2 1 — 2Scranton, Pa. 27 21 6 — — — —Syracuse, N.Y. 102 81 15 5 1 — 9Trenton, N.J. 26 18 6 1 — 1 1Utica, N.Y. 30 25 5 — — — 2Yonkers, N.Y. 29 23 6 — — — 3
E.N. CENTRAL 2,441 1,658 550 142 45 46 196Akron, Ohio 83 56 21 2 2 2 7Canton, Ohio 57 43 11 1 1 1 8Chicago, Ill. 349 225 97 20 4 3 18Cincinnati, Ohio 66 46 15 3 — 2 12Cleveland, Ohio 306 224 57 16 4 5 13Columbus, Ohio 308 205 71 17 10 5 33Dayton, Ohio 168 112 39 13 2 2 11Detroit, Mich. 237 132 69 19 9 8 17Evansville, Ind. 59 45 14 — — — 6Fort Wayne, Ind. 62 39 9 6 1 7 5Gary, Ind. 12 2 7 3 — — —Grand Rapids, Mich. 71 49 17 4 — 1 19Indianapolis, Ind. 188 124 43 12 1 8 12Lansing, Mich. 16 13 1 1 1 — 1Milwaukee, Wis. 126 91 25 6 4 — 13Peoria, Ill. 71 50 14 4 3 — 2Rockford, Ill. 74 60 11 2 — 1 6South Bend, Ind. 46 35 5 4 2 — 3Toledo, Ohio 94 67 16 9 1 1 6Youngstown, Ohio 48 40 8 — — — 4
W.N. CENTRAL 691 471 146 40 9 25 48Des Moines, Iowa 118 90 23 2 1 2 9Duluth, Minn. 24 17 4 2 1 — 2Kansas City, Kans. 28 21 5 — 2 — 3Kansas City, Mo. 74 50 14 6 2 2 8Lincoln, Nebr. 57 42 10 4 — 1 5Minneapolis, Minn. 67 43 13 6 1 4 5Omaha, Nebr. 73 53 13 5 — 2 4St. Louis, Mo. 129 67 40 11 1 10 9St. Paul, Minn. 55 42 13 — — — 1Wichita, Kans. 66 46 11 4 1 4 2
S. ATLANTIC 1,449 912 348 120 30 39 76Atlanta, Ga. 159 101 37 17 3 1 5Baltimore, Md. 180 100 57 19 1 3 22Charlotte, N.C. 126 85 21 10 4 6 12Jacksonville, Fla. 197 124 52 14 2 5 5Miami, Fla. 60 45 6 3 5 1 4Norfolk, Va. 47 31 11 2 1 2 2Richmond, Va. 87 47 30 8 — 2 6Savannah, Ga. 70 49 14 3 — 4 6St. Petersburg, Fla. 98 68 14 12 3 1 5Tampa, Fla. 206 139 46 10 6 5 6Washington, D.C. 199 109 55 22 5 8 3Wilmington, Del. 20 14 5 — — 1 —
E.S. CENTRAL 870 549 210 57 34 20 54Birmingham, Ala. 176 119 39 12 4 2 12Chattanooga, Tenn. 80 49 25 2 1 3 4Knoxville, Tenn. 112 73 26 9 2 2 3Lexington, Ky. 50 28 12 7 2 1 2Memphis, Tenn. 156 97 33 9 10 7 9Mobile, Ala. 63 34 18 7 3 1 1Montgomery, Ala. 46 31 8 1 4 2 8Nashville, Tenn. 187 118 49 10 8 2 15
W.S. CENTRAL 1,840 1,144 441 160 49 46 113Austin, Tex. 110 81 22 5 1 1 5Baton Rouge, La. 46 34 6 4 — 2 —Corpus Christi, Tex. 48 36 12 — — — 5Dallas, Tex. 212 113 56 23 9 11 17El Paso, Tex. 115 69 29 10 5 2 7Ft. Worth, Tex. 163 94 49 12 4 4 10Houston, Tex. 420 240 120 32 14 14 31Little Rock, Ark. 95 70 17 3 2 3 5New Orleans, La. 52 31 14 7 — — —San Antonio, Tex. 386 279 63 25 11 8 18Shreveport, La. 56 33 19 3 1 — 1Tulsa, Okla. 137 64 34 36 2 1 14
MOUNTAIN 833 568 184 37 21 23 61Albuquerque, N.M. 142 107 28 2 4 1 11Boise, Idaho 64 44 15 2 2 1 4Colo. Springs, Colo. 55 39 12 3 1 — 1Denver, Colo. 102 57 25 7 2 11 6Las Vegas, Nev. 235 150 57 13 10 5 17Ogden, Utah 25 20 3 2 — — 2Phoenix, Ariz. 61 40 14 4 2 1 3Pueblo, Colo. 20 15 4 1 — — 3Salt Lake City, Utah 129 96 26 3 — 4 14Tucson, Ariz. U U U U U U U
PACIFIC 1,805 1,294 351 96 45 18 192Berkeley, Calif. 20 14 4 2 — — 3Fresno, Calif. 125 90 24 7 3 1 15Glendale, Calif. 23 20 2 1 — — 6Honolulu, Hawaii 96 78 14 1 2 — 15Long Beach, Calif. 93 65 19 5 4 — 15Los Angeles, Calif. 298 216 62 13 5 2 37Pasadena, Calif. 21 18 3 — — — 4Portland, Oreg. 127 90 28 6 1 2 9Sacramento, Calif. 200 134 39 15 12 — 17San Diego, Calif. 182 123 40 8 4 7 22San Francisco, Calif. 102 73 22 5 1 1 12San Jose, Calif. 151 114 28 5 2 2 15Santa Cruz, Calif. 39 25 10 2 2 — 2Seattle, Wash. 137 97 22 12 4 2 4Spokane, Wash. 72 52 16 2 1 1 9Tacoma, Wash. 119 85 18 12 4 — 7
TOTAL 13,278¶ 9,012 2,885 853 278 247 1,004

30 MMWR January 14, 2005

Vol. 54 / No. 1 MMWR 31
MMWR
The Morbidity and Mortality Weekly Report (MMWR) Series is prepared by the Centers for Disease Control and Prevention (CDC) and is available free of chargein electronic format and on a paid subscription basis for paper copy. To receive an electronic copy each week, send an e-mail message to [email protected]. Thebody content should read SUBscribe mmwr-toc. Electronic copy also is available from CDC’s World-Wide Web server at http://www.cdc.gov/mmwr or from CDC’sfile transfer protocol server at ftp://ftp.cdc.gov/pub/publications/mmwr. To subscribe for paper copy, contact Superintendent of Documents, U.S. GovernmentPrinting Office, Washington, DC 20402; telephone 202-512-1800.
Data in the weekly MMWR are provisional, based on weekly reports to CDC by state health departments. The reporting week concludes at close of business onFriday; compiled data on a national basis are officially released to the public on the following Friday. Address inquiries about the MMWR Series, including materialto be considered for publication, to Editor, MMWR Series, Mailstop E-96, CDC, 1600 Clifton Rd., N.E., Atlanta, GA 30333; telephone 888-232-3228.
All material in the MMWR Series is in the public domain and may be used and reprinted without permission; citation as to source, however, is appreciated.
All MMWR references are available on the Internet at http://www.cdc.gov/mmwr. Use the search function to find specific articles.
Use of trade names and commercial sources is for identification only and does not imply endorsement by the U.S. Department of Health and Human Services.
References to non-CDC sites on the Internet are provided as a service to MMWR readers and do not constitute or imply endorsement of these organizations ortheir programs by CDC or the U.S. Department of Health and Human Services. CDC is not responsible for the content of these sites. URL addresses listed inMMWR were current as of the date of publication.
✩U.S. Government Printing Office: 2005-733-116/00066 Region IV ISSN: 0149-2195
32 January 14, 2005