MORANBAH and Commercial Assessment - dsdmip.qld.gov.au · cafe and dining uses Up to 4,000 m2 (with...
41
Retail and Commercial Assessment Moranbah Prepared for Urban Land Development Authority MacroPlan Australia Pty Ltd March 2011 1 MORANBAH Retail and Commercial Assessment Prepared for Urban Land Development Authority MacroPlan Australia Pty Ltd March 2011 FINAL REPORT MACROPLAN AUSTRALIA PTY LTD SYDNEY | MELBOURNE | BRISBANE | PERTH
Transcript of MORANBAH and Commercial Assessment - dsdmip.qld.gov.au · cafe and dining uses Up to 4,000 m2 (with...

Retail and Commercial Assessment Moranbah
Prepared for Urban Land Development Authority MacroPlan Australia Pty Ltd March 2011
1
PREPARED FOR THE LOCAL GOVERNMENT ASSOCIATION OF SOUTH AUSTRALIA
MORANBAH Retail and Commercial Assessment
Prepared for Urban Land Development Authority MacroPlan Australia Pty Ltd March 2011
FINAL REPORT
MACROPLAN AUSTRALIA PTY LTDSYDNEY | MELBOURNE | BRISBANE | PERTH

Retail and Commercial Assessment Moranbah
Prepared for Urban Land Development Authority MacroPlan Australia Pty Ltd March 2011
2
* This document is for discussion purposes only unless signed and dated by the persons identified.
Signed*
………………………………… DATE: March 2011
Project Director
Teresa Bullock‐Smith QLD Director
[email protected] www.macroplan.com.au
CONTACT
MacroPlan Australia Pty Ltd Suite 6, Level 2, 320 Adelaide Street Brisbane QLD 4000 t 07 3010 9240 f 07 3010 9640
© MacroPlan Australia Pty Ltd All Rights Reserved. No part of this document may be reproduced, transmitted, stored in a retrieval system, or translated into any language in any form by any means without the written permission of MacroPlan Australia Pty Ltd. All Rights Reserved. All methods, processes, commercial proposals and other contents described in this document are the confidential intellectual property of MacroPlan Australia Pty Ltd and may not be used or disclosed to any party without the written permission of MacroPlan Australia Pty Ltd
MACROPLAN AUSTRALIA PTY LTD SYDNEY | MELBOURNE | BRISBANE | PERTH
Project Manager
Daniel Parker Senior Consultant Queensland Economics
Retail and Commercial Assessment Moranbah
Prepared for Urban Land Development Authority MacroPlan Australia Pty Ltd March 2011
3
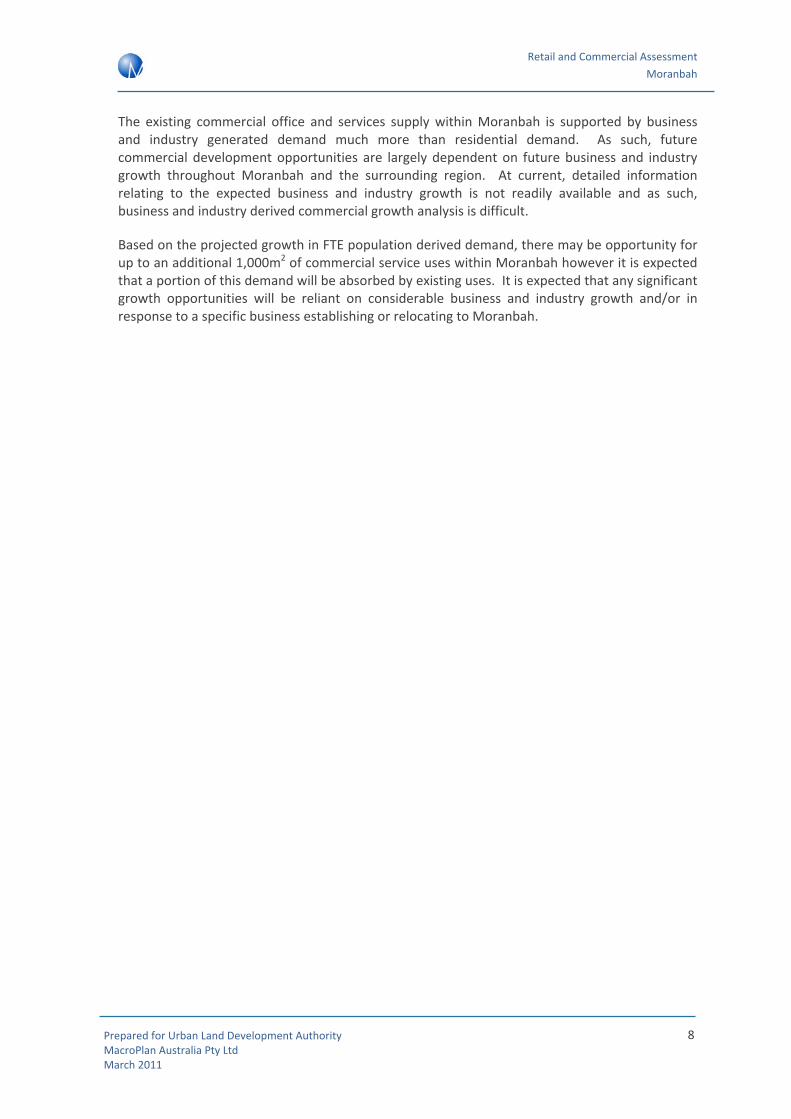
1 EXECUTIVE SUMMARY ................................................................................... 4
2 INTRODUCTION .............................................................................................. 9
2.1 PROJECT SCOPE .......................................................................................................... 9 2.2 MORANBAH TOWNSHIP ................................................................................................. 9 2.3 REGIONAL RESOURCE INDUSTRY ACTIVITY.................................................................... 10
3 REVIEW OF EXISTING DOCUMENTATION .................................................. 12
3.1 CENTRES STRATEGY – URBAN ECONOMICS (2006) ...................................................... 12 3.2 MORANBAH RESIDENTIAL MARKET ANALYSIS – URBIS (2009) ........................................ 14 3.3 STRUCTURE PLAN OVERVIEW – ULDA ......................................................................... 15 3.4 DEVELOPMENT APPLICATIONS AND PROPOSALS ........................................................... 18
4 POPULATION GROWTH AND DEMOGRAPHIC ANALYSIS ........................ 21
4.1 EXISTING AND FORECAST POPULATION ASSESSMENT .................................................... 21 4.2 SOCIO-DEMOGRAPHIC PROFILE .................................................................................. 24 4.3 IMPLICATIONS ............................................................................................................ 26
5 RETAIL AND COMMERCIAL SUPPLY ASSESSMENT ................................. 27
5.1 SUPPLY ASSESSMENT ................................................................................................. 27 5.2 SUMMARY.................................................................................................................. 28
6 RETAIL AND COMMERCIAL DEMAND ASSESSMENT ............................... 29
6.1 RETAIL DEMAND – PERMANENT RESIDENT CATCHMENT ................................................ 29 6.2 RETAIL DEMAND – NON-RESIDENT CATCHMENT ........................................................... 31 6.3 RETAIL ANALYSIS – ESCAPE EXPENDITURE ANALYSIS .................................................... 32 6.4 COMMERCIAL DEMAND ............................................................................................... 33 6.5 IMPLICATIONS ............................................................................................................ 33
7 GAP ANALYSIS AND RECOMMENDATIONS ............................................... 35
7.1 GAP ANALYSIS ........................................................................................................... 35 7.2 RECOMMENDATIONS .................................................................................................. 37
Contents

Retail and Commercial Assessment Moranbah
Prepared for Urban Land Development Authority MacroPlan Australia Pty Ltd March 2011
4
1 Executive Summary
As a regional service centre, Moranbah accommodates a range of retail and commercial uses that serve both the resident population of the town as well as the temporary resource industry worker population (non‐resident population), and the business and industry operations throughout the surrounding region.
The designated Urban Development Area in Moranbah is expected to result in a significant increase to the townships current population which will result in an increase in demand for retail and commercial uses. The non‐resident population of Moranbah is also expected to increase over time based on planned future resource projects within the region surrounding the town.
The future full‐time equivalent population projections (comprising permanent residents and non‐residents) for Moranbah are indicated in the table below. The permanent resident population capacity is based on current urban design and land use planning for the Urban Development Area in the town (including the southern growth area).
The non‐resident population growth has been based on historical growth rates. It is acknowledged that this methodology is not ideal due to the volatility of this market sector however based on the lack of available detailed information and the low growth rate utilised, these growth estimates are considered reasonable.
On the basis of the FTE population projections, the following table outlines the estimated future retail demand growth.
As indicated, there is expected to be significant growth in retail and commercial services demand. However, not all demand will be converted into local supply as there is a substantial amount of retail escape expenditure (estimated between 40% and 50%) distributed to centres outside of Moranbah, predominantly in Mackay. This is particularly the case for the Non‐Food retail category which is representative of higher order retail uses.
Based on the existing supply of retail and commercial uses and the projected future demand requirements for the estimated population capacity (with consideration of the expected level of escape expenditure), the following table provides recommendations as to the future retail development opportunities throughout Moranbah.
2006 2010 2011 2016 2021 2026 2031 CapacityIsaac Regional Council 21,113 22,650 24,131 27,436 30,289 32,432 34,580 NA
Moranbah ‐ Permanent Residents 7,611 8,511 9,188 10,584 11,836 12,835 13,858 17,135Moranbah ‐ Non‐Residents 1,915 2,931 3,124 3,598 4,024 4,364 4,712 5,826Moranbah ‐ FTE Residents 9,526 11,442 12,312 14,182 15,860 17,199 18,570 22,961
2011 2016 2021 2026 2031 At capaci tyFood and Grocery 7,534 8,721 9,801 10,681 11,590 14,331Catering (Restaurant and Café) 3,831 4,435 4,985 5,432 5,894 7,288Bottle-shop 703 814 914 996 1,081 1,660Non-Food 12,728 15,267 17,796 20,136 22,707 23,733Services 1,290 1,493 1,678 1,829 1,984 2,408Total Development Potent ial 26,086 30,730 35,175 39,075 43,256 49,419

Retail and Commercial Assessment Moranbah
Prepared for Urban Land Development Authority MacroPlan Australia Pty Ltd March 2011
5
Future Retail Development Recommendations
Retail Use Scale Potential Tenant/s Locational Recommendations Required Triggers General Recommendations
Full line supermarket
Approx. 4,000 m2
(with up to 500 m2 of associated specialty retail)
Woolworths Ideally the supermarket should be located within the town centre precinct to provide the best level of service for residents as well as increasing competition with the existing Coles supermarket.
It is recommended that a minimum FTE population of 14,000 people be established before the second full line supermarket commences operation. Based on the current population projections this is expected to occur around 2021.
Ideally a catchment of between 18,000 people and 20,000 people is required for two full line supermarkets however it is expected that this second supermarket may establish early in order to grow market share.
It is expected that a small scale of specialty retail stores may establish in conjunction with this supermarket including specialty food and non‐food retail uses up to 500 m2.
There is a risk that if this supermarket is proposed early it will generate significant impacts on the existing Coles.

Retail and Commercial Assessment Moranbah
Prepared for Urban Land Development Authority MacroPlan Australia Pty Ltd March 2011
6
Retail Use Scale Potential Tenant/s Locational Recommendations Required Triggers General Recommendations
Convenience supermarkets (up to two)
Approx. 400 to 600 m2 each
IGA, Night Owl, 7 Eleven
A convenience supermarket is required to serve the residential community in the south western growth area. It is recommended that a convenience supermarket should front Goonyella Road to capture inflow demand from passing traffic.
The residential growth area in the east of Moranbah may generate sufficient population to support a second convenience supermarket.
A population trigger of 2,000 people within the south western growth will be required to support the first convenience supermarket.
A second convenience supermarket may be supported in the eastern growth area in Moranbah however this will be dependent on the scale of previous facilities established and the strength of the Town Centre.
A convenience supermarket will serve a predominantly different range of retails needs than a full line supermarket. This retail use is therefore not likely to generate any significant impact on the existing Coles.
Food and beverage, cafe and dining uses
Up to 4,000 m2 (with up to 2,000 m2 dining precinct)
Various food and beverage, cafe, fast food and restaurants
A consolidated dining precinct should be located within the town centre precinct to leverage off of existing demand and activity.
Other dining uses should be provided in convenient and accessible locations, preferably alongside existing commercial or activity uses.
Up to 2,500 m2 should be located within the town centre and fringe area with the remaining 1,500 m2 being located within the south west growth area and other local centres that may be developed.
There is considered an undersupply of catering retail uses in Moranbah now with opportunity for up to 1,500 m2.
Additional growth will be dependent on population derived demand as indicated in Section 6.
The highly affluent resident and worker population within Moranbah will provide demand and opportunity to establish a broad range of dining uses. This should be considered when planning for the dining precinct.
A consolidated precinct within the town centre will encourage additional activity which will benefit surrounding retail uses.

Retail and Commercial Assessment Moranbah
Prepared for Urban Land Development Authority MacroPlan Australia Pty Ltd March 2011
7
Retail Use Scale Potential Tenant/s Locational Recommendations Required Triggers General Recommendations
Homemakers /bulky goods precinct
Up to 4,000 m2
Local furniture and homewares stores, though preferably some small scale national retailers
These retail uses can be located outside of the town centre precinct as they are destination retail uses which are not likely to gain or generate any benefit from a town centre location. These uses will however require a main road location such as along Goonyella Road.
Ideally these uses will be established in line with the demand indicated in Section 6. However, it is expected that some homewares retailers may be willing to establish early to grow market share and trade to the high number of new households within Moranbah.
This type of retail will be hard because of the established competition in Mackay. Ideally, one or more national retail brand stores will be established as an anchor for the small centre/precinct.
Non‐food and general retail growth
Up to 1,000 m2
Fashion retail and general specialty retail stores
These retail uses will be located predominantly throughout the expanding town centre precinct. This scale of uses may be reduced if the scale of specialty retail uses accompanying the new full line supermarket exceeds 500 m2. Similarly, a portion of these uses may be located in conjunction with the convenience supermarket however this is expected to be minimal.
These uses are expected to be established in line with the growth and development to occur throughout the town centre precinct. This will predominantly be influenced by the new full line supermarket.
These additional uses will not be viable if the existing specialty retail uses throughout the town centre are trading poorly. This will need to be monitored closely prior to any additional development.
In addition, any future development should, where possible, be staged to ensure efficient take up of new retail space.
Retail and Commercial Assessment Moranbah
Prepared for Urban Land Development Authority MacroPlan Australia Pty Ltd March 2011
8
The existing commercial office and services supply within Moranbah is supported by business and industry generated demand much more than residential demand. As such, future commercial development opportunities are largely dependent on future business and industry growth throughout Moranbah and the surrounding region. At current, detailed information relating to the expected business and industry growth is not readily available and as such, business and industry derived commercial growth analysis is difficult.
Based on the projected growth in FTE population derived demand, there may be opportunity for up to an additional 1,000m2 of commercial service uses within Moranbah however it is expected that a portion of this demand will be absorbed by existing uses. It is expected that any significant growth opportunities will be reliant on considerable business and industry growth and/or in response to a specific business establishing or relocating to Moranbah.
Retail and Commercial Assessment Moranbah
Prepared for Urban Land Development Authority MacroPlan Australia Pty Ltd March 2011
9
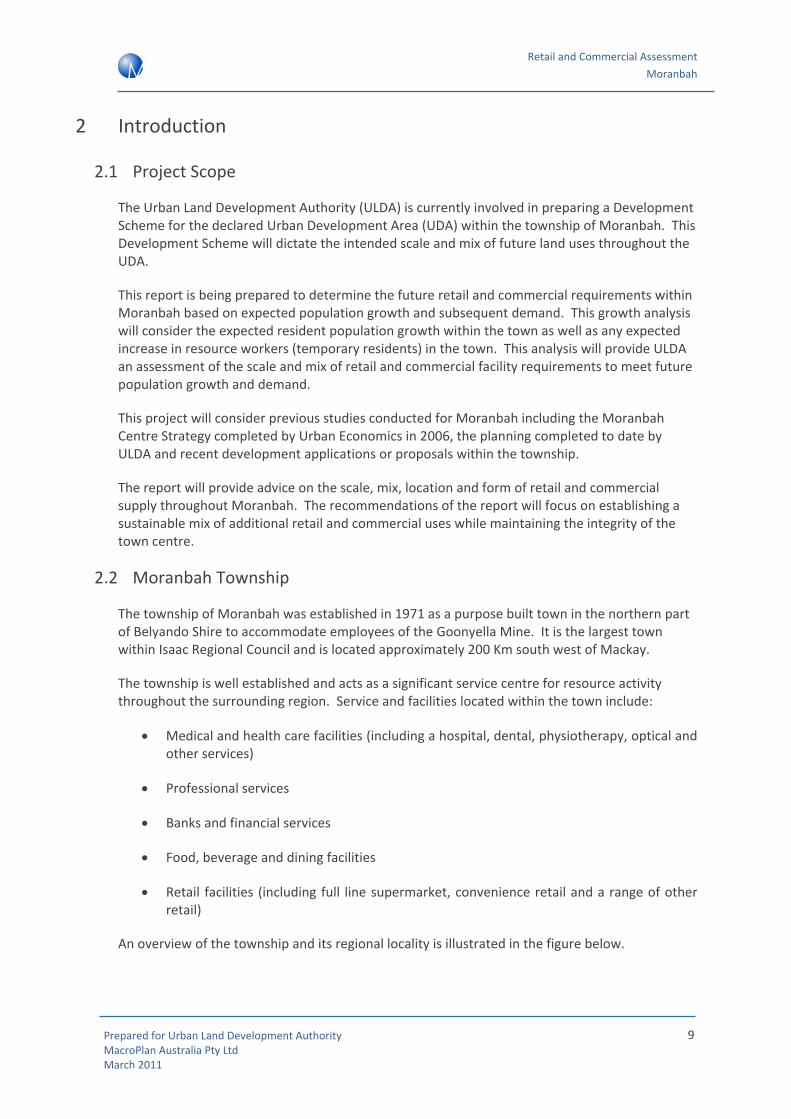
2 Introduction
2.1 Project Scope
The Urban Land Development Authority (ULDA) is currently involved in preparing a Development Scheme for the declared Urban Development Area (UDA) within the township of Moranbah. This Development Scheme will dictate the intended scale and mix of future land uses throughout the UDA.
This report is being prepared to determine the future retail and commercial requirements within Moranbah based on expected population growth and subsequent demand. This growth analysis will consider the expected resident population growth within the town as well as any expected increase in resource workers (temporary residents) in the town. This analysis will provide ULDA an assessment of the scale and mix of retail and commercial facility requirements to meet future population growth and demand.
This project will consider previous studies conducted for Moranbah including the Moranbah Centre Strategy completed by Urban Economics in 2006, the planning completed to date by ULDA and recent development applications or proposals within the township.
The report will provide advice on the scale, mix, location and form of retail and commercial supply throughout Moranbah. The recommendations of the report will focus on establishing a sustainable mix of additional retail and commercial uses while maintaining the integrity of the town centre.
2.2 Moranbah Township
The township of Moranbah was established in 1971 as a purpose built town in the northern part of Belyando Shire to accommodate employees of the Goonyella Mine. It is the largest town within Isaac Regional Council and is located approximately 200 Km south west of Mackay.
The township is well established and acts as a significant service centre for resource activity throughout the surrounding region. Service and facilities located within the town include:
• Medical and health care facilities (including a hospital, dental, physiotherapy, optical and other services)
• Professional services
• Banks and financial services
• Food, beverage and dining facilities
• Retail facilities (including full line supermarket, convenience retail and a range of other retail)
An overview of the township and its regional locality is illustrated in the figure below.

Retail and Commercial Assessment Moranbah
Prepared for Urban Land Development Authority MacroPlan Australia Pty Ltd March 2011
10
Figure 1. Regional Overview
2.3 Regional Resource Industry Activity
Moranbah is located within the Bowen Basin region which is a significant resource rich area throughout Central Queensland. Activity within the coal mining industry in the Bowen Basin has increased significantly, approximately doubling production within the region between 2000 and 2010 and now represents approximately 85% of all coal mining activity in Queensland.
At current, an additional 18 mining projects are either being developed or under consideration throughout the Bowen Basin region. The largest project is BHP Billiton Mitsubishi Alliance’s (BMA’s) Bowen Basin project. This project will allow an additional 20 million tonnes of coal produced per annum. The project incorporates staged development of the new Daunia and Caval Ridge mines and the expansion of the Goonyella Riverside Mine, as well as mining related development including a new airport at Moranbah. These projects are expected to employ approximately 2,450 people during construction and 1,240 people once operational, with an expected 30 year lifetime.
This additional mining and mining related development by BMA is largely centred around the township of Moranbah and will contribute to future population and workforce growth and in turn, future retail and commercial growth within the township.

Retail and Commercial Assessment Moranbah
Prepared for Urban Land Development Authority MacroPlan Australia Pty Ltd March 2011
11
Other notable mining projects throughout the Bowen Basin region include:
• The expansion of Millennium Open Cut Mine is expected to employ some 200 people and with an estimated life of 15 years.
• The Ellensfield Underground Coal Project is expected to employ 300 people during construction and 230 once operational, with a 20‐year lifetime.
• The Clermont Open Cut Mine is expected to employ 306 people during construction and 380 once operational, with a lifetime of about 17 years.
• The Moranbah South Underground Project is expected to employ 300 people, with a mine lifetime of 20 years.
• The expanded Eaglefield open cut mine is expected to employ a workforce of between 200 and 400 people.
• Development of the Grosvenor Underground Coal Mine will employ about 400 people during construction and 380 once operational.
• A new underground mine at Saraji is expected to employ 400 people, with an expected lifetime of 40 years.
Further development of the region's ports is also expected to boost employment. In addition, the expansion of Abbot Point Coal Terminal is expected to employ 2,700 people during construction and 1,500 in operation, while the ongoing Dalrymple Bay Coal Terminal expansion is expected to employ 1,000 people during construction.

Retail and Commercial Assessment Moranbah
Prepared for Urban Land Development Authority MacroPlan Australia Pty Ltd March 2011
12
3 Review of Existing Documentation
The following provides a review of the existing documentation and planning relevant to Moranbah in terms of retail and commercial facilities as well as future growth and development within the township. These documents have been produced through previous studies and assessments as well as more recent planning processes including the production of a Structure Plan for those designated UDAs by the ULDA.
The review highlights the key findings and implications that are relevant to, or likely to impact, the future scale and mix of retail and commercial facilities within Moranbah.
3.1 Centres Strategy – Urban Economics (2006)
The Moranbah Centres Strategy was prepared by Urban Economics in 2006. The strategy outlines the future direction and potential for existing and proposed centres throughout Moranbah.
The report provides a detailed review of existing retail and commercial floorspace throughout the township. Population projections based on the fulltime equivalent (FTE) population, using Queensland Planning, Information and Forecasting Unit (PIFU) data as a basis, have also been produced and provide the basis for projected future retail growth opportunities.
A number of assumptions have been considered in determining the future population projections and retail demand modelling for the report. Two key assumptions include the following:
• The assessment considers that the absent population in the 2006 census should be included as part of the population estimates within Moranbah. This population requires the same range of commercial and retail facilities and therefore, should be included to estimate future population and retail demand.
• The assessment also assumes that the drive‐in/drive‐out population generate a latent demand for dwellings but the current shortage of residential accommodation makes it difficult for these workers to finally settle in Moranbah. Therefore, a study of the retail strategy is closely linked with the planning structure for residential development in the town.
The population projections outlined in the Centres Strategy are as follows:
• 2006 – 8,742 people
• 2011 – 11,776 people
• 2016 – 12,396 people
• 2021 – 12,456 people
• Capacity – 15,000 people

Retail and Commercial Assessment Moranbah
Prepared for Urban Land Development Authority MacroPlan Australia Pty Ltd March 2011
13
The strategy notes that the township is occupied by extremely affluent blue collar oriented young families as a result of a high proportion of mining related employment (43% of the local workforce). It is acknowledged that this has resulted in a comparatively high average household retail expenditure.
The assessment of existing retail and commercial facilities within Moranbah is summarised in the table below.
Figure 2. Moranbah Floorspace Assessment (2006)
Source: Centres Strategy, Urban Economics (September 2006)
A key assumption of the strategy is that based on the existing population of Moranbah and the corresponding level of retail facilities, up to 50% of retail demand generated within the township is being lost to higher order retail facilities, predominantly in Mackay. It is assumed future population growth will result in an increase in demand and therefore the local retail offering within Moranbah, including some higher order retail which could reduce the current level of escape expenditure to 35%.
The current productivity level for retail uses within Moranbah was estimated at $4,400/m2. The report assumes that this productivity level will potentially increase to $4,700/m2 if market share (retail capture) can be increase to 65%. If this occurs, based on a population of 15,000 people it is has been estimated that approximately 30,000 m2 of retail uses will be required.
The following provides an overview of Urban Economics’ recommended centres strategy for Moranbah.
Figure 3. Recommended Centre Strategy
Source: Centres Strategy, Urban Economics (September 2006)
Count m2 (%) Count m3 (%) Count m4 (%)Supermarkets 2 4,290 24.6% 0 0.0% 2 4,290 23.9%ther Specialised Food Retailing 6 824 4.7% 1 125 24.5% 7 949 5.3%Department Store 1 350 2.0% 0 0.0% 1 350 2.0%Clothing and Soft Good Retailing 6 775 4.5% 1 186 36.5% 7 961 5.4%Furniture, Houseware and Appliance Retailing 7 4,080 23.4% 0 0.0% 7 4,080 22.8%Recreational Goods Retailing 6 1,025 5.9% 0 0.0% 6 1,025 5.7%Other Personal and Household Goods Retailing 7 905 5.2% 0 0.0% 7 905 5.0%Cafes and Restaurants 1 150 0.9% 0 0.0% 1 150 0.8%Video Hire Outlets 1 250 1.4% 0 0.0% 1 250 1.4%Hairdressingand Beauty 7 735 4.2% 0 0.0% 7 735 4.1%TOTAL SHOPFRONT RETAILING 44 13,384 76.9% 2 311 61.0% 46 13,695 76.4%Commercial Services 17 2,694 15.5% 2 137 26.9% 19 2,831 15.8%Community Services 2 140 0.8% 0 0.0% 2 140 0.8%Health and Medical 4 960 5.5% 0 0.0% 4 960 5.4%Vacant 3 235 1.3% 1 62 12.2% 4 297 1.7%GRAND TOTAL 70 17,413 100.0% 5 510 100.0% 75 17,923 100.0%
Town Centre Clements Road TotalCategory
Retail (m2) Commercial (m2)Town Centre 23,000 9,000 25‐30Neighbourhood Centre 6,000 2,000 8Convenience Centre 1,000 0 1TOTAL 30,000 11,000 34‐39
Indicative Floorspace Indicative Site Area (Ha)

Retail and Commercial Assessment Moranbah
Prepared for Urban Land Development Authority MacroPlan Australia Pty Ltd March 2011
14
Summary
The key findings and implications of the Centres Strategy produced by Urban Economics are as follows:
• The existing mix of retail and commercial facilities are largely concentrated within the town centre precinct;
• It is estimated that the retail market share captured within Moranbah is approximately 50% based on the limited supply of higher order retail facilities, this may increase to 65% with future retail growth;
• The future population capacity of Moranbah is estimated at 15,000 people;
• The recommended future retail capacity within Moranbah is 30,000 m2 distributed throughout the town centre, a neighbourhood centre and a convenience centre and including two full line supermarkets (totalling 8,000 m2)and a discount department store (4,000 m2).
3.2 Moranbah Residential Market Analysis – Urbis (2009)
The Moranbah Residential Market Analysis completed by Urbis was commissioned to “understand the market drivers and factors relating to dwelling demand and supply, the current and future demographic profile, the scale and type of future housing required, the scale of affordable housing required and how this compares to the current stock and current market prices”.
In terms of resident population for Moranbah, the report estimated a 2.8% growth rate per annum between 2011 and 2016. The resident population is forecasted to reach 12,178 people by 2026.
A view of this assessment is to promote growth within those service industries throughout Moranbah to provide an appropriate level of services to support future population growth. In order to encourage growth within these service industries it is recognised that the provision of affordable housing is crucial to tackle the significant disparities in household income due to highly paid mining jobs. It is stated that Council together with State Government must provide a diverse range of housing product to ensure that it is not only the mining workers able to afford housing prices.
Some key objectives were to encourage mining companies to reduce rent subsidies in order to reduce the current level of artificial inflation in rental prices and for State Government to provide significant supply of semi‐detached housing in the sub $232,000 category to accommodate low income service workers.
Based on recent building approvals in Moranbah, there is expected to be an increase in the housing densities which may contribute to an increase in affordability.

Retail and Commercial Assessment Moranbah
Prepared for Urban Land Development Authority MacroPlan Australia Pty Ltd March 2011
15
Summary
The key findings and implications of the report are as follows:
• Employment in the mining industry as well as mining related industries increased during the period 2001 to 2006, as did service industry employment. All additional employment contributed to an increase in demand for residential dwellings however the provision of affordable housing for service industry employees is difficult given the higher incomes and higher housing rents related to the mining industry.
• Median vacant land values increased by an average of 11.7% per annum between 2005 and 2009. Similarly, detached dwelling prices increased by an average of 17.7% per annum during the same period.
• Housing rents increased by an average of 13.8% and 15.4% respectively for three and four bedroom houses in the period 2005 to 2009. In 2009, weekly rental rates for three and four bedroom houses averaged $650 and $1,000 per week respectively.
• The residential market in Moranbah is being inflated due to a number of issues including:
o Generous rental subsidies offered by the mining companies which artificially inflate rental prices;
o Strong demand from the investor market in response to yields of between 10% and 14% on detached dwelling purchases within Moranbah; and
o Constraints and a shortage of available residential land supply within Moranbah.
3.3 Structure Plan Overview – ULDA
The ULDA has developed a Draft Structure Plan which outlines the potential land uses within the declared Moranbah UDA. The structure plan has considered a number of constraints that have influenced the extent to which the existing township can be expanded beyond the existing urban boundary.
The plan proposes additional residential development areas within the town and within the growth area to the south west of the town that is intended to relieve some pressure on increasing house prices. In addition, non‐residential worker accommodation is proposed to be located in the north west of the town.
The structure plan also includes the redevelopment of the Ted Rolfe Oval as a mixed use site that would integrate retail, commercial, residential and recreational facilities and expand the existing town centre precinct.
This structure plan aims to improve land supply to make housing more affordable and deliver a range of housing options for the changing needs of the Moranbah community.
The preferred draft structure plan including the town and growth area is illustrated in the following figures below.

Retail and Commercial Assessment Moranbah
Prepared for Urban Land Development Authority MacroPlan Australia Pty Ltd March 2011
16
Figure 4. Preferred Draft Structure Plan ‐ Town
Source: Urban Land Development Authority, Draft for Consultation – October/November 2010

Retail and Commercial Assessment Moranbah
Prepared for Urban Land Development Authority MacroPlan Australia Pty Ltd March 2011
17
Figure 5. Preferred Draft Structure Plan – Growth Area
Source: Urban Land Development Authority, Draft for Consultation – October/November 2010

Retail and Commercial Assessment Moranbah
Prepared for Urban Land Development Authority MacroPlan Australia Pty Ltd March 2011
18
Summary
The identified UDA both within the existing township area and to the south west of the township provides the opportunity to accommodate the expanding permanent and temporary resident populations of Moranbah. The intent of the UDA is to not only increase the scale of residential dwellings but also the mix of residential product, including a range of housing options and densities as well as affordable housing product.
The increased population established throughout the defined UDAs will generate increased demand for retail and commercial facilities. There are two specific identified mixed use areas within the UDAs based on the preferred structure plan. Defining the opportunity to establish additional retail and commercial facilities in terms of the scale, mix and location of future facilities is the focus of this assessment.
3.4 Development Applications and Proposals
The following provides an indication of the rate of development within Moranbah as well as those current proposed and pending developments within the township.
The number of new dwelling approvals in Moranbah as well as the broader Belyando SLA has fluctuated significantly over the past ten years. The following table indicates the number of new dwelling approvals within Moranbah and the proportion that represents of total development within the Belyando SLA.
Figure 6. Moranbah new dwellings approvals, 2000‐2010
Source: ABS, MacroPlan (2010)
The following provides a summary of current proposed developments and development applications within Moranbah. This data has been sourced from the Cordell Connect database and was reported as current at December 2010.
Moranbah % of Total SLA Belyando SLA
2000/01 0 0% 22001/02 4 80% 52002/03 12 80% 152003/04 31 91% 342004/05 90 60% 1502005/06 81 93% 872006/07 62 76% 822007/08 51 88% 582008/09 26 87% 302009/10 89 93% 96

Retail and Commercial Assessment Moranbah
Prepared for Urban Land Development Authority MacroPlan Australia Pty Ltd March 2011
19
Figure 7. Moranbah Current Developments – Proposed and Pending (December 2010)
Project Name Proposed Uses Stage Estimated Value
Highview Moranbah Units
50 Units Tenders Called $8,000,000
Mills Avenue Units
120 Units Early Planning $15,000,000
Moranbah Housing Project
45 Units Construction $6,000,000
Isaac Views Estate Housing
8 Houses Construction $2,000,000
Thurston Drive Units
12 Units Development Application
$2,500,000
Grosvenor Estate Units
3 Units Building Application $700,000
Anderson Court Units
4 Units Construction $800,000
The MAC Accommodation Centre
Extension of 415 rooms
Development Application
$6,000,000
Belyando Avenue Accommodation Village
300 Accommodation Units
Contract Let $7,000,000
Caval Ridge Coal Project – Buffell Village
Accommodation Village – 2,496
Rooms
Development Application
$20,000,000
Bacon Street Mixed Use Development
12 Units and 6 Shops Development Application
$6,000,000
Moranbah Accommodation Village
Accommodation Village – 193 Units
Development Application
$10,000,000
Source: Cordell Connect Database (2010)
The current proposed and pending developments indicated above demonstrate there is already an increasing amount of development planned within Moranbah, particularly within

Retail and Commercial Assessment Moranbah
Prepared for Urban Land Development Authority MacroPlan Australia Pty Ltd March 2011
20
accommodation centres. The scale of proposed accommodation centre developments is indicative of the expanding employment capacity of those existing and planned resource projects throughout the surrounding region as well as the current undersupply in suitable residential accommodation within the township.

Retail and Commercial Assessment Moranbah
Prepared for Urban Land Development Authority MacroPlan Australia Pty Ltd March 2011
21
4 Population Growth and Demographic Analysis
This section analyses the estimated future population growth within Moranbah. This analysis is critical to understanding the future retail and commercial requirements within the township as they will largely be local population serving.
This analysis considers both the permanent resident population as well as the temporary resident population which comprises those resource industry employees that have a permanent place of residence elsewhere.
4.1 Existing and Forecast Population Assessment
Moranbah was originally established as a mining town and has continued to serve as a significant accommodation and service centre for the many resource projects in the surrounding area. As such, the population of the town is largely dependent on the mining industry performance and future projects throughout the region.
The influence from the resource industry on future population growth also affects the type of population growth within the town in terms of permanent residents and temporary or non‐permanent residents. Temporary or non‐residents include resource industry workers who reside in Moranbah part time for the duration of their working period but essentially have a permanent place of residence elsewhere.
As the population in the town is composed by residents and workforce, applying the ABS definition of residential population is considered to be limited. The ABS term of estimated resident population includes all permanent residents and some temporary residents, as the term is defined to include all those persons living or likely to live in their place of usual residence for more than 6 months of the year.
To account for the number of temporary residents the Planning Information and Forecasting Unit (PIFU) has prepared the “Full‐Time Equivalent” (FTE) population estimates for Moranbah. FTE population estimates provides a representation of the number of persons that live in an area on a permanent basis as well as those who live and work in the area for an extended period but have a usual place of residence elsewhere. The FTE population is an indication of the number of persons (including permanent residents and temporary residents) living within an area at a given point in time.
The FTE population of Moranbah has been estimated by PIFU in the Bowen Basin Population Report (2009). These estimates are indicated in the table below.
Figure 8. Moranbah new dwellings approvals, 2000‐2010
Source: Bowen Basin Population Report (PIFU, 2010)
2006 2010Estimated Resident Population 7,611 8,511Non‐Resident Population* 1,915 2,931FTE Population Estimate 9,526 11,442*Based on the PIFU Survey of accommodation providers , 2010
Retail and Commercial Assessment Moranbah
Prepared for Urban Land Development Authority MacroPlan Australia Pty Ltd March 2011
22
As indicated in Figure 8, there was an estimated 1,915 non‐residents that contributed to the Moranbah FTE population in 2006. This increased to 2,931 non‐residents in 2010. The non‐residents recorded are indicative of workers who fly‐in/fly‐out and drive‐in/drive‐out (FIFO/DIDO) of the area. Typically these non‐residents comprise workers and contractors associated with mining and gas production, as well as the construction of associated infrastructure.
PIFU articulates two vital points when considering the FTE population:
• The needs for the two populations are different and are not always the same. Most of the services and infrastructure are required by both residents and non‐residents but some services like schools, libraries and other community and sporting facilities are mainly used by the resident population. The retail needs also differ between permanent residents and non‐permanent.
• The number of the non‐residents population will fluctuate over time making it difficult to predict into the future.
Taken these points into account, MacroPlan considers that this FIFO and DIDO non‐resident population should be included as part of the demand for retail but in a differential way to the permanent residents (with consideration to the household survey).
Based on the population data produced by PIFU for Moranbah in the Bowen Basin Population Report (2010), and the population projections produced in the Demographic Analysis of the Bowen Basin report (OESR, December 2010), MacroPlan has produced the following population projections for the township of Moranbah. The population capacity estimates are based on the existing residential dwelling supply within the township and the calculated additional dwelling capacity based on the remaining developable area (including the UDAs) and the intended land uses on these areas. MacroPlan has received input from the ULDA in determining population projections.
The permanent resident population is expected to expand significantly within Moranbah up to an estimated capacity of 17,135 people. It is noted that this capacity estimate does exceed previous estimates however this is based on more recent dwelling capacity estimates from current urban design and land use planning for the township and those UDAs in particular. This growth is likely to be driven by continuing and expanded resource projects in the region as well as an increase in residential affordability and mix as a result of the UDAs.
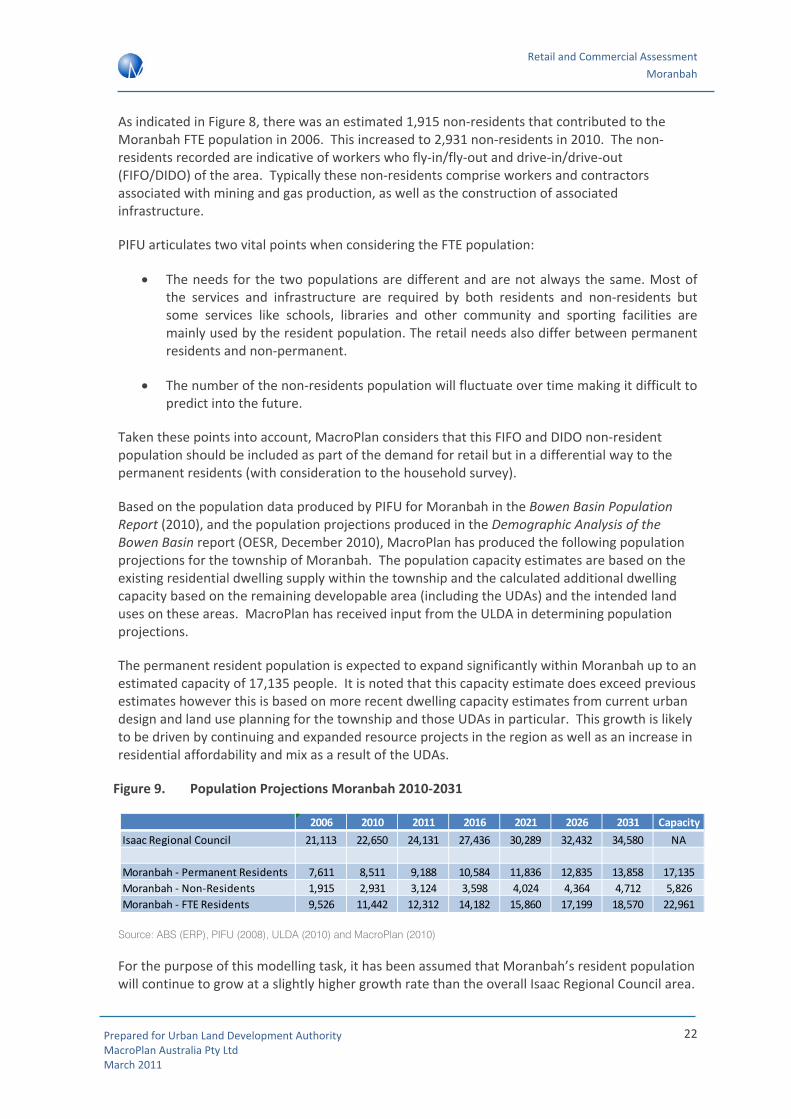
Figure 9. Population Projections Moranbah 2010‐2031
Source: ABS (ERP), PIFU (2008), ULDA (2010) and MacroPlan (2010)
For the purpose of this modelling task, it has been assumed that Moranbah’s resident population will continue to grow at a slightly higher growth rate than the overall Isaac Regional Council area.
2006 2010 2011 2016 2021 2026 2031 CapacityIsaac Regional Council 21,113 22,650 24,131 27,436 30,289 32,432 34,580 NA
Moranbah ‐ Permanent Residents 7,611 8,511 9,188 10,584 11,836 12,835 13,858 17,135Moranbah ‐ Non‐Residents 1,915 2,931 3,124 3,598 4,024 4,364 4,712 5,826Moranbah ‐ FTE Residents 9,526 11,442 12,312 14,182 15,860 17,199 18,570 22,961

Retail and Commercial Assessment Moranbah
Prepared for Urban Land Development Authority MacroPlan Australia Pty Ltd March 2011
23
Projects 2006‐07 2010Burton/Plum Tree 470 400Goonyella/Riverside 2,650 2,500Moranbah Nth 300 300Coppabella 300 300Moorvale 150 200North Goonyella 620 600Peak Downs 1,000 1,000South Walker Creek 120 120Isaac Plains 50 50Carborough Downs/Broadlea North 150 150Millennium 160 160Poitrel 200 200Total 6,170 5,980New developmentsOlive Downs 100Goonyella expansion 200Carborough expansion 50Isaac Plain expansion 50Grosvenor 300Moranbah South 300Moorvale West 200Daunia 120Wards Well 200Lenton 60Total 1,580
This will see Moranbah’s proportion of the regional population increase from approximately 38% in 2010 to 40% in 2031.
The rate of growth for non‐residents has been conservatively estimated at comprising approximately 25% of Moranbah’s total FTE population. This estimate has been established based on the current proportion of total FTE population (approximately 26%) and the scale and mix of planned resource projects and activity throughout the surrounding region that will require a sustained and expanding workforce. An indication of the current and planned resource projects and the employment generated by these projects is presented in the table below.
Figure 10. Projected mining employee numbers within 50 kilometres of Moranbah
Source: Queensland Mines and Energy
At 2006 the estimated non‐resident contribution to the FTE population was 1,915 people. This compared with the 6,170 workers in the region surrounding Moranbah indicates that approximately one third of the total resource project workforce is representative of the non‐resident contribution. On this basis, it may be estimated that the existing and planned future resource project developments will generate a non‐resident contribution of approximately 2,500 people. However, this is a difficult assumption to make as it is not known how these future workers will be accommodated. If they are accommodated in mining camps outside of the township for example they are likely to have a contribution much lower than one third. Other

Retail and Commercial Assessment Moranbah
Prepared for Urban Land Development Authority MacroPlan Australia Pty Ltd March 2011
24
factors including the duration of these planned resource projects make it difficult to produce any future workforce growth projections.
4.2 Socio‐Demographic Profile
Figure 11 below provides a comparison of those key socio‐economic characteristics of Moranbah with those of Regional Queensland. The information presented has been derived from the 2006 ABS Census Survey of Population and Housing.
The key observations of these key socio‐demographic characteristics are as follows:
• Residents in Moranbah have higher levels of wealth, reflected in the high individual incomes. Average individual taxable incomes in Moranbah are approximately 45% higher than Queensland.
• The analysis of the age distribution reveals that the proportion of residents below 14 years is higher than for Queensland state average, with 27% compared to 21% respectively. The 25 to 54 years old ‘workforce’ population was also 10% above the State average, which is a result of the strong employment in resource industries. In addition, the population over 55 years in Moranbah is only 7% compared to 24% in Queensland.
• The profile of residents is dominated by couple families with children (59%), which is higher than the Queensland average of 43%. This demographic composition will probably lead to an elevated average level of expenditure on supermarket related retailing.
• Regarding the tenure type, rental accommodation represented a very high proportion of total dwellings (51%) and was significantly higher than the Queensland average (32%). This is a direct result of the high mobility levels of the residents of Moranbah and the DIDO and FIFO residents working in Moranbah.
• With respect to the dwelling types, a larger proportion of dwellings are separate house, 89% as compared to 80% in Queensland State.
In general, the socio demographic profile of Moranbah indicates a township with a relatively high proportion of young singles and families with high household income. This is a direct result of the significant proportion of employment in resource industries which generally has an inflationary effect on employment in other industries also. These residents and particularly those with dependent children will generate demand for a greater scale and mix of retail uses locally.

Retail and Commercial Assessment Moranbah
Prepared for Urban Land Development Authority MacroPlan Australia Pty Ltd March 2011
25
Moranbah Queensland
Headline Indicators (2006)Populat ion and Households
Persons 7,129 3,904,395
Households 2,123 1,391,636
Average Household Size 3.36 2.81
Socio-Economic SnapshotIncome and Weal th
Median Individual Taxable Income $70,927 $48,872
variation from Queensland 45.1% -Occupat ion by Sector
White Collar 28% 45%
Blue Collar 62% 35%
Service Sector 11% 20%
Age Dist ribut ion
0-4 years 10% 7%
5-14 years 17% 14%
15-24 years 14% 14%
25-54 years 52% 42%
55-64 years 6% 11%
65-74 years 1% 7%
75+ years 0% 6%
Fami ly Types
Couple family with children 59% 43%
Couple family without children 31% 39%
One parent family 8% 16%
Other family 1% 2%
Tenure Type
Owner 25% 32%
Purchaser 24% 35%
Renter 51% 32%
Other 1% 1%
Dwel l ing Type
Separate House 89% 80%
Semi-detached 3% 8%
Flat, Unit, Apartment 4% 11%
Other 5% 2%
Birthp lace
Australia 83% 75%
Overseas 17% 25%
Figure 11. Population and Demographic Summary (2006)
Source: ABS Census (2006), MacroPlan (2010)

Retail and Commercial Assessment Moranbah
Prepared for Urban Land Development Authority MacroPlan Australia Pty Ltd March 2011
26
4.3 Implications
There are two resident groups which need to be considered when determining the population of Moranbah. In addition to the permanent resident population there is a substantial temporary or non‐resident population that has a direct influence on the population of the township at any one time.
These non‐residents are generally resource industry employees who reside in Moranbah only during the period in which they are working locally and maintain a permanent place of residence elsewhere. The estimated number of these non‐residents residing in Moranbah at any one time is combined with the permanent resident population to calculate what has been defined by the PIFU as Moranbah’s FTE population.
The estimated FTE population projections for Moranbah are as follows:
• 2011 – Approx. 12,300 FTE people
• 2021 – Approx. 15,900 FTE people
• 2031 – Approx. 18,600 FTE people
• Capacity – Approx. 23,000 FTE people
This estimated future growth within Moranbah will largely be driven by those continuing and expanding resource projects in the surrounding region and the employment generated within these and related industries. This is also likely to maintain the current demographic profile of the community which is indicative of young families with considerably high household incomes.
Retail and Commercial Assessment Moranbah
Prepared for Urban Land Development Authority MacroPlan Australia Pty Ltd March 2011
27
5 Retail and Commercial Supply Assessment
This section provides an assessment of the existing supply of retail and commercial facilities throughout the township of Moranbah.
5.1 Supply Assessment
The following supply assessment has been produced based on the existing mix of retail and commercial facilities throughout Moranbah. This assessment has incorporated the detailed floorspace analysis that was produced for the Centres Strategy completed in 2006 by Urban Economics.
The existing retail and commercial supply throughout Moranbah is largely concentrated in and around the town centre which is bound by Belyando Ave to the north, Mills Ave to the south, Bacon Ave to the west and Appleton St to the east.
The largest consolidated retail centre in Moranbah is the Moranbah Fair shopping centre. The centre is located within the town centre precinct and comprises approximately 7,600 m2 of retail floorspace. The centre is anchored by a Coles full line supermarket (3,900 m2) and a Target Country mini major store (700 m2). There is an additional 17 specialty stores that comprise the remaining 3,000 m2M2 of floorspace.
Other retail and commercial uses include the ‘strip retail’ uses along those street fronts surrounding the town centre precinct as well as that along the recently redeveloped Town Square Avenue. Based on the floorspace assessment conducted in the 2006 Centres Strategy, this retail and commercial supply in combination with the Moranbah Fair shopping centre comprises a total of approximately 17,400 m2. This floorspace assessment is believed to be reasonably accurate at 2010 due to no significant recent retail development within the town.
There is also a small convenience retail centre located at Clements Road in Moranbah East which comprises approximately 510 m2 of floorspace.
The following table summarises the centres and the total retail area supplied.
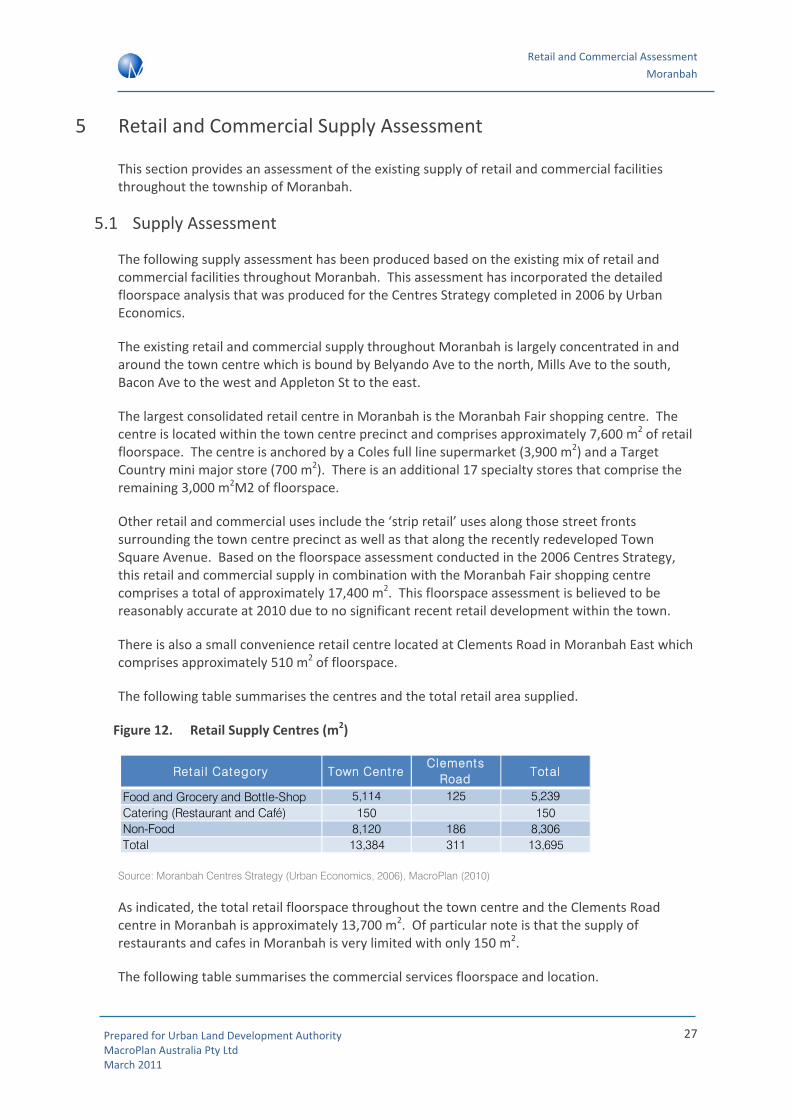
Figure 12. Retail Supply Centres (m2)
Source: Moranbah Centres Strategy (Urban Economics, 2006), MacroPlan (2010)
As indicated, the total retail floorspace throughout the town centre and the Clements Road centre in Moranbah is approximately 13,700 m2. Of particular note is that the supply of restaurants and cafes in Moranbah is very limited with only 150 m2.
The following table summarises the commercial services floorspace and location.
Retai l Category Town Cent reClements
RoadTotal
Food and Grocery and Bottle-Shop 5,114 125 5,239Catering (Restaurant and Café) 150 150Non-Food 8,120 186 8,306Total 13,384 311 13,695
Retail and Commercial Assessment Moranbah
Prepared for Urban Land Development Authority MacroPlan Australia Pty Ltd March 2011
28
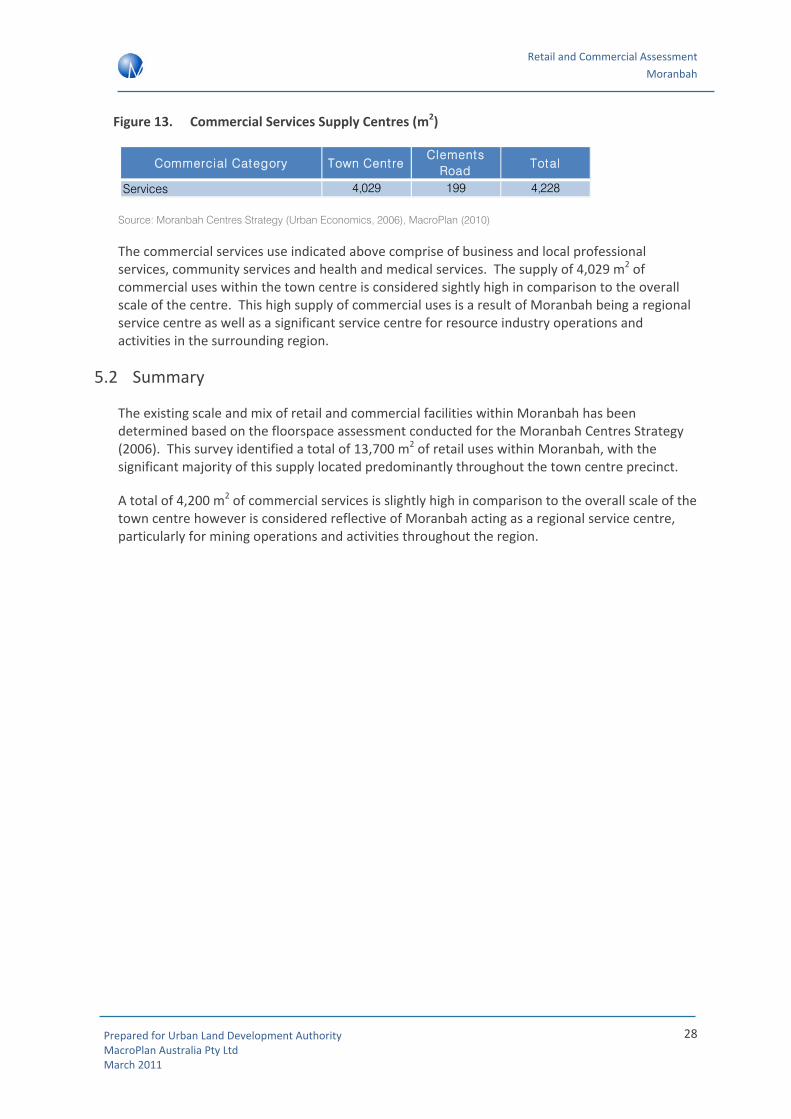
Figure 13. Commercial Services Supply Centres (m2)
Source: Moranbah Centres Strategy (Urban Economics, 2006), MacroPlan (2010)
The commercial services use indicated above comprise of business and local professional services, community services and health and medical services. The supply of 4,029 m2 of commercial uses within the town centre is considered sightly high in comparison to the overall scale of the centre. This high supply of commercial uses is a result of Moranbah being a regional service centre as well as a significant service centre for resource industry operations and activities in the surrounding region.
5.2 Summary
The existing scale and mix of retail and commercial facilities within Moranbah has been determined based on the floorspace assessment conducted for the Moranbah Centres Strategy (2006). This survey identified a total of 13,700 m2 of retail uses within Moranbah, with the significant majority of this supply located predominantly throughout the town centre precinct.
A total of 4,200 m2 of commercial services is slightly high in comparison to the overall scale of the town centre however is considered reflective of Moranbah acting as a regional service centre, particularly for mining operations and activities throughout the region.
Commercial Category Town Cent reClements
RoadTotal
Services 4,029 199 4,228

Retail and Commercial Assessment Moranbah
Prepared for Urban Land Development Authority MacroPlan Australia Pty Ltd March 2011
29
6 Retail and Commercial Demand Assessment
The retail and commercial demand assessment incorporates the population analysis and forecasts completed in Section 4 of this report. Importantly, the retail demand analysis will consider the permanent and non‐resident populations separately based on the different retail expenditure profiles of these two catchments.
Potential growth in non retail commercial facilities (commercial services) will also be assessed based on the existing and predicted future commercial and service requirements within the township.
This assessment of both retail and commercial facilities demand will provide the basis for determining the future floorspace capacity within Moranbah. This potential capacity assessment will be aggregated to provide an indication of the market ‘gap’ based on future population thresholds in the final section of this report.
6.1 Retail Demand – Permanent Resident Catchment
The following provides an assessment of the retail expenditure and the corresponding scale of retail floorspace demand generated by the permanent residents within Moranbah. The retail expenditure and demand analysis is based on five major retail categories including:
• Food and grocery (includes supermarkets)
• Catering (Restaurants and Cafes)
• Bottle‐Shop
• Non‐food
• Services
Retail expenditure is derived using MarketInfo 2006, a micro‐simulation model. This model is based on information from the National ABS Household expenditure Survey, the Census population and Housing as well as other information sources. The model combines propensity to spend on particular commodities with socio‐economic characteristics of individuals, thus deriving spending estimates on a small area basis (CCD level). Retail per capita levels in Moranbah are detailed in the following table.
Figure 14. Retail Expenditure per Capita – Moranbah Permanent Resident Population
Source: MarketInfo (2006), MacroPlan (2010)
Retai l CategoryExpendi ture per cap i ta
Food and Grocery $4,843Catering (Restaurant and Café) $1,567Bottle-shop $657Non-Food $5,288Services $489Total Retai l Expendi ture $12,843

Retail and Commercial Assessment Moranbah
Prepared for Urban Land Development Authority MacroPlan Australia Pty Ltd March 2011
30
As indicated above, the average annual retail expenditure per capita of permanent residents in Moranbah is $12,843 (in 2010 dollars).
The following table analyses what the total forecast retail expenditure of permanent residents in Moranbah is based on the expenditure per capita and the population projections indicated in Section 4. The total annual retail expenditure is expected to increase from an estimated $119.6 million in 2011 to $176.6 in 2021 and $237.7 in 2031. Based on the current estimated population capacity, there is estimated to be up to $294 million generated in total retail expenditure by permanent residents.
Figure 15. Retail Expenditure Growth – Moranbah Permanent Resident Population
Source: MarketInfo (2006), MacroPlan (2010)
Based on the total retail expenditure generated, the following table analyses the corresponding scale of retail floorspace that will be required.
Figure 16. Retail Floorspace Demand (m2) – Moranbah Permanent Resident Population
Source: MarketInfo (2006), MacroPlan (2010)
Figure 16 indicates that at 2011, the permanent residential population of Moranbah will generate demand for up to approximately 22,300 m2 of retail floorspace. Based on estimated population growth this overall level of retail demand is expected to increase to approximately 30,100 m2 in 2021 and 37,000 m2 in 2031. At capacity it is estimated that there will be demand generated for up to 41,700 m2.
It is important to note that a proportion of retail demand generated by Moranbah permanent residents will be distributed to retail facilities outside of Moranbah, predominantly in Mackay. This ‘escape’ demand is related to higher order retail uses and will be considered in determining the scale and mix of retail opportunities in Moranbah.
Given the current supply of approximately 18,000 m2, there will be an undersupply of approximately 4,000m2 by 2011. This is considered reflective of the current situation, reinforcing the expenditure escaping to other centres, such as Mackay.
2011 2016 2021 2026 2031 At capaci tyFood and Grocery $45.0 $54.7 $64.7 $74.1 $84.4 $104.4Catering (Restaurant and Café) $14.6 $17.7 $20.9 $24.0 $27.3 $33.8Bottle-shop $6.1 $7.4 $8.8 $10.0 $11.4 $14.2Non-Food $49.4 $62.1 $75.8 $89.8 $106.0 $131.1Services $4.5 $5.5 $6.5 $7.5 $8.5 $10.5Total Retai l Expendi ture $119.6 $147.5 $176.6 $205.3 $237.7 $294.0
2011 2016 2021 2026 2031 At capaci tyFood and Grocery 6,632 7,677 8,628 9,403 10,202 12,615Catering (Restaurant and Café) 2,859 3,310 3,720 4,054 4,399 5,439Bottle-shop 524 607 682 744 807 998Non-Food 11,204 13,440 15,666 17,725 19,988 20,532Services 1,102 1,276 1,434 1,563 1,696 2,097Total Development Potent ial 22,322 26,310 30,130 33,488 37,092 41,681

Retail and Commercial Assessment Moranbah
Prepared for Urban Land Development Authority MacroPlan Australia Pty Ltd March 2011
31
6.2 Retail Demand – Non‐Resident Catchment
The non‐resident population within Moranbah will generate demand for a range of retail uses locally, however this is based on a different expenditure profile to permanent residents. Non‐residents will typically spend less on retail within Moranbah than their permanent place of residence for a number of reasons including:
• The time they spend in Moranbah is largely spent working; and
• The majority of meals are provided for in mining camps and accommodation centres.
The typical retail expenditure profile of permanent residents in Moranbah has been adjusted based on the estimate proportion of expenditure which is distributed locally within Moranbah. These estimates have been based on previous research and analysis in resource towns which has included conducting surveys with mining camp residents.
The expenditure profile for these non‐residents indicates that expenditure in some retail categories such as Catering and Bottle‐Shop are consistent with permanent residents of Moranbah. This is reflective of the specific differences in retail demand as well as the high average incomes of non residents. Other categories such as Non‐Food will typically capture only a small proportion of the demand generated by non‐residents.
Figure 17. Retail Expenditure per Capita – Moranbah Non‐Resident Population
Source: MarketInfo (2006), MacroPlan (2010)
The estimated average annual retail expenditure per capita generated by non‐residents in Moranbah is $6,520 (in 2010 dollars). This is approximately 51% of the retail demand generated by permanent residents in Moranbah.
The forecast growth in retail expenditure based on the estimated future number of non‐residents in Moranbah is indicated in the table below. The total value of retail expenditure is estimated to increase from approximately $20.6 million in 2011 to $30.3 in 2021 and $40.5 million in 2031.
Retai l CategoryExpendi ture per
capi ta
Food and Grocery $1,937Catering (Restaurant and Café) $1,567Bottle-shop $657Non-Food $2,115Services $244Total Retai l Expendi ture $6,520
Retail and Commercial Assessment Moranbah
Prepared for Urban Land Development Authority MacroPlan Australia Pty Ltd March 2011
32
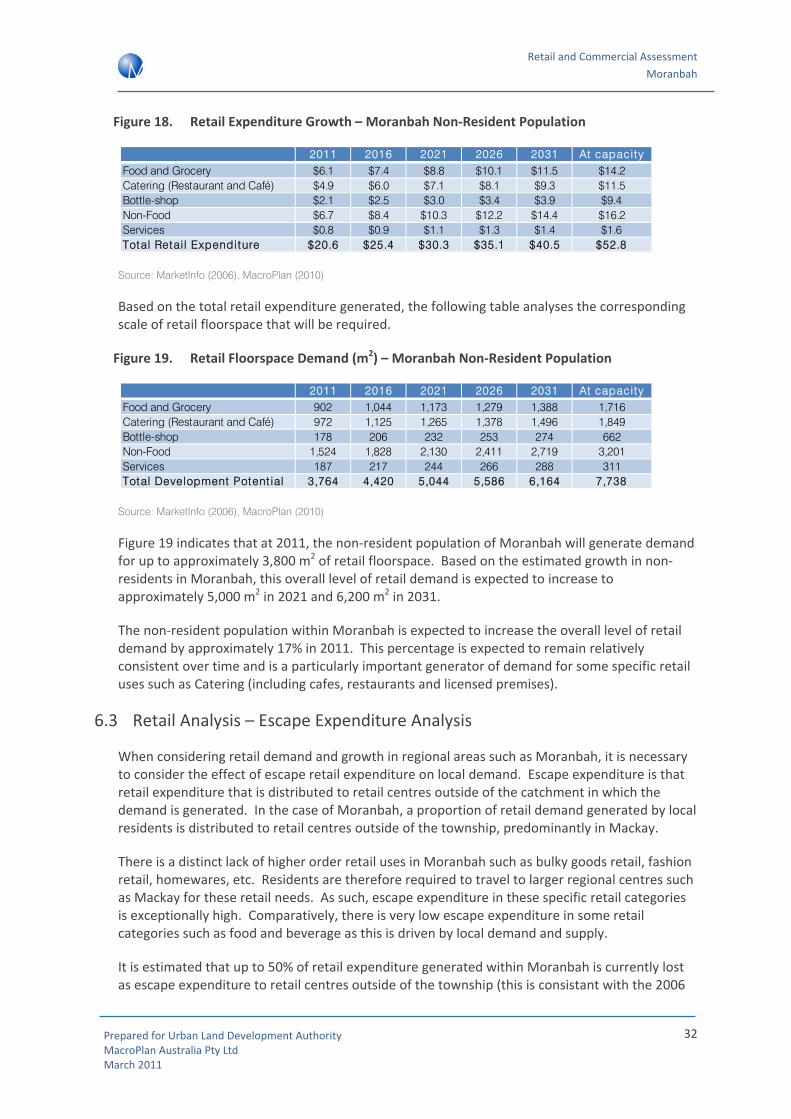
Figure 18. Retail Expenditure Growth – Moranbah Non‐Resident Population
Source: MarketInfo (2006), MacroPlan (2010)
Based on the total retail expenditure generated, the following table analyses the corresponding scale of retail floorspace that will be required.
Figure 19. Retail Floorspace Demand (m2) – Moranbah Non‐Resident Population
Source: MarketInfo (2006), MacroPlan (2010)
Figure 19 indicates that at 2011, the non‐resident population of Moranbah will generate demand for up to approximately 3,800 m2 of retail floorspace. Based on the estimated growth in non‐residents in Moranbah, this overall level of retail demand is expected to increase to approximately 5,000 m2 in 2021 and 6,200 m2 in 2031.
The non‐resident population within Moranbah is expected to increase the overall level of retail demand by approximately 17% in 2011. This percentage is expected to remain relatively consistent over time and is a particularly important generator of demand for some specific retail uses such as Catering (including cafes, restaurants and licensed premises).
6.3 Retail Analysis – Escape Expenditure Analysis
When considering retail demand and growth in regional areas such as Moranbah, it is necessary to consider the effect of escape retail expenditure on local demand. Escape expenditure is that retail expenditure that is distributed to retail centres outside of the catchment in which the demand is generated. In the case of Moranbah, a proportion of retail demand generated by local residents is distributed to retail centres outside of the township, predominantly in Mackay.
There is a distinct lack of higher order retail uses in Moranbah such as bulky goods retail, fashion retail, homewares, etc. Residents are therefore required to travel to larger regional centres such as Mackay for these retail needs. As such, escape expenditure in these specific retail categories is exceptionally high. Comparatively, there is very low escape expenditure in some retail categories such as food and beverage as this is driven by local demand and supply.
It is estimated that up to 50% of retail expenditure generated within Moranbah is currently lost as escape expenditure to retail centres outside of the township (this is consistant with the 2006
2011 2016 2021 2026 2031 At capaci tyFood and Grocery $6.1 $7.4 $8.8 $10.1 $11.5 $14.2Catering (Restaurant and Café) $4.9 $6.0 $7.1 $8.1 $9.3 $11.5Bottle-shop $2.1 $2.5 $3.0 $3.4 $3.9 $9.4Non-Food $6.7 $8.4 $10.3 $12.2 $14.4 $16.2Services $0.8 $0.9 $1.1 $1.3 $1.4 $1.6Total Retai l Expendi ture $20.6 $25.4 $30.3 $35.1 $40.5 $52.8
2011 2016 2021 2026 2031 At capaci tyFood and Grocery 902 1,044 1,173 1,279 1,388 1,716Catering (Restaurant and Café) 972 1,125 1,265 1,378 1,496 1,849Bottle-shop 178 206 232 253 274 662Non-Food 1,524 1,828 2,130 2,411 2,719 3,201Services 187 217 244 266 288 311Total Development Potent ial 3,764 4,420 5,044 5,586 6,164 7,738

Retail and Commercial Assessment Moranbah
Prepared for Urban Land Development Authority MacroPlan Australia Pty Ltd March 2011
33
Moranbah Centres Strategy report). Future population growth within Moranbah will increase retail demand and is likely to result in an increase in some higher order retail uses. However, the supply of higher order retail uses within Moranbah is not expected to be of significant scale and as such it is expected that retail escape expenditure will remain relatively high. By 2031 it is estimated that retail escape expenditure will be approximately 40% of total retail expenditure based on the expected future growth in retail facilities.
6.4 Commercial Demand
Moranbah is a significant regional service centre in terms of commercial services and facilities accounting for the significant scale of commercial offices and uses. Demand for commercial offices is affected by permanent residents and non‐residents, as well as business and industry operations within Moranbah and the surrounding region. It is this demand from business and industry operations, which is predominantly resource industry related, that increases the provision of commercial services in Moranbah significantly.
Future growth in demand for commercial services and facilities in Moranbah will be influenced by population growth as well as any growth in industry activity, particularly any additional resource projects in the area.
The future demand from residents is indicated in Figure 16 identifies the growth in demand for Services, generally representative of commercial uses such as banks, medical services and local professional services. The estimated future growth in demand is expected to require up to an additional 1,000 Sq M of Services facilities based on the assumed resident population capacity.
It should be noted that the current high level of supply is likely to accommodate some of the projected future Services demand requirement. The total supply of Services facilities in Moranbah at 2006 was 4,228 m2 in comparison to the scale of demand estimated at 2011 of 1,289 m2. This does not mean that there is a current oversupply of facilities, rather it is indicative of the significant demand for commercial services generated by the business and industry activity throughout the surrounding region. In addition, any future growth is likely to require a dedicated business prior to establishment based on the limited market. This will be further discussed in the recommendations of this report.
6.5 Implications
Retail demand in Moranbah is generated from two separate sources. The majority of demand is generated by local permanent residents. This demand is supplemented by demand generated by non‐residents who are typically resource industry employees who reside in Moranbah for the duration of their working period which may be several days up to two weeks or more. These non‐residents have a permanent place of residence elsewhere and as such have a different expenditure profile in terms of expenditure within Moranbah.
Future retail demand and growth will be influenced by the scale of population as well as workforce growth within and surrounding Moranbah. Based on the anticipated growth in the permanent resident population as well as the non‐resident population, which combined are referred to as the FTE population, the following table indicated the estimated future retail floorspace demand by major retail categories.

Retail and Commercial Assessment Moranbah
Prepared for Urban Land Development Authority MacroPlan Australia Pty Ltd March 2011
34
Figure 20. Retail Floorspace Demand (m2) – FTE Population
Source: MarketInfo (2006), MacroPlan (2010)
As indicated, future growth in the FTE population is expected to generate demand for up to an additional 17,200 m2 of retail uses between 2011 and 2031. This could potentially increase by up to an additional 6,200 m2 based on the estimated resident population capacity.
At current, up to an estimated 50% of demand generated by the permanent residents in Moranbah is lost to centres outside of the township as escape expenditure. Specifically, the majority of escape expenditure is from the Non‐Food retail category which represents higher order retail uses including furniture, homewares, electrical appliances and fashion retail. As such, while this retail category represents a significant proportion of demand generated within Moranbah, only a portion of the future growth in this retail category is expected to be delivered locally.
Demand for commercial uses will be driven by residential growth as well as any business and industry growth in the township and surrounding region. The scale of commercial uses within the town at current is considered slightly high with business and industry derived demand supporting the majority of the existing supply. Future resident growth will generate demand for up to an additional 1,000 m2 however a portion of this additional demand is likely to be absorbed by existing services. Any significant increase is likely to be more dependent on any business and industry growth throughout the surrounding region rather than resident population growth.
2011 2016 2021 2026 2031 At capaci tyFood and Grocery 7,534 8,721 9,801 10,681 11,590 14,331Catering (Restaurant and Café) 3,831 4,435 4,985 5,432 5,894 7,288Bottle-shop 703 814 914 996 1,081 1,660Non-Food 12,728 15,267 17,796 20,136 22,707 23,733Services 1,290 1,493 1,678 1,829 1,984 2,408Total Development Potent ial 26,086 30,730 35,175 39,075 43,256 49,419

Retail and Commercial Assessment Moranbah
Prepared for Urban Land Development Authority MacroPlan Australia Pty Ltd March 2011
35
7 Gap Analysis and Recommendations
This section clearly defines the expected ‘gap’ in retail and commercial floorspace within Moranbah based on the anticipated growth throughout the township. This gap analysis will produce recommendations outlining the potential scale, mix, location and staging of future retail and commercial facilities that may be supported within Moranbah.
7.1 Gap Analysis
The future retail and commercial growth opportunities are dependent on the difference or ‘gap’ between the scale of facilities currently provided within Moranbah and the scale of facilities that are demanded in the future. Importantly, this gap analysis needs to consider what proportion of demand can reasonably be accommodated and captured within Moranbah and what is likely to be distributed to centres outside of Moranbah (such as a proportion of higher order retail uses).
The following table indicates the difference between the current scale of retail uses in Moranbah and the anticipated scale of demand at 2011 based on the FTE population of Moranbah.
Figure 21. Retail Gap Analysis (m2) – 2011 FTE Population
Source: MarketInfo (2006), MacroPlan (2010)
As indicated, there is expected to be an undersupply of uses in all categories with the exception of Services which comprises a significant existing supply due to demand generated by business and industry demand throughout the surrounding region.
While there is an undersupply in those other retail categories, the actual opportunity to establish additional retail uses is considered limited in 2011 due to the expected level of escape expenditure (estimated at between 40% and 50%), particularly for higher order retail uses under the Non‐Food retail category.
There is however considered opportunity for additional supply of Catering retail uses such as cafes restaurants and take away food uses. There is a significant existing undersupply of these types of retail uses in Moranbah and at 2011 there is considered opportunity to increase the supply of these uses significantly by up to 1,500 Sq M, potentially more if this supply is absorbed quickly.
The table below indicates the retail gap analysis based on the estimated FTE population in Moranbah at capacity (based on the residential dwelling capacity).
Current Supply Demand - 2011 Difference*Food and Grocery and Bottle-Shop 5,239 8,236 2,997Catering (Restaurant and Café) 150 3,831 3,681Non-Food 8,306 12,728 4,422Services 4,228 1,290 -2,938Total 17,923 26,086 11,101*Negative values removed from total for accuracy

Retail and Commercial Assessment Moranbah
Prepared for Urban Land Development Authority MacroPlan Australia Pty Ltd March 2011
36
Figure 22. Retail Gap Analysis (m2) – Estimated Capacity FTE Population
Source: MarketInfo (2006), MacroPlan (2010)
While at 2011 there is considered to be limited retail development opportunities the expected increase in population growth and the corresponding increase in retail demand, based on the townships estimated population capacity, is expected to generate a range of retail development opportunities.
The opportunity for additional Food and Grocery and Bottle‐Shop retail is significant as based on the scale of demand as well as the population, there is opportunity to establish an additional full line supermarket within Moranbah and potentially a smaller convenience supermarket also.
A full line supermarket generally requires a catchment of between 8,000 people to 10,000 people while a small convenience supermarket (such as an IGA or Night Owl) requires a catchment of between 2,500 people to 4,000 people depending on the scale of the convenience supermarket. At capacity, Moranbah is expected to have a FTE population of approximately 23,000 people which is consistent with the catchment requirements for two full line supermarkets, one convenience supermarket servicing the south western growth area of the UDA, and potentially a second convenience supermarket depending on urban growth patterns and the scale and strength of those full line and convenience supermarkets once established.
At capacity the scale of demand for Catering retail uses and the population is considered sufficient to support a small dining precinct within the town. There is opportunity to expand the scale of cafe and restaurant and dining uses within the township beyond that 1,500 m2 identified as an opportunity in 2011 by up to an additional 1,500 m2 for a total of 4,000m2. It is recommended that at least half of this total 4,000 m2 is consolidated within the town centre precinct to form a food court / dining precinct. This will establish a critical mass and will act as a strong attractant which will benefit other surrounding retail uses.
The opportunity to increase the supply of Non‐Food retail uses, which are predominantly higher order retail uses, will still be affected by the high level escape expenditure at capacity. Realistically, there isn’t the opportunity to establish a critical mass or any significant level of competition in higher order retail within Moranbah so escape expenditure will remain high. However the significant growth in demand coupled with the high number of new households within the town is considered to create the opportunity to establish some of these uses locally. Specifically, there is considered the opportunity to establish a small range of furniture, homewares and electrical appliance stores within the town up to a total scale of approximately 4,000 m2.
As indicated, the current scale of commercial services and facilities is more than what is expected to be required by the FTE population at capacity. As such, it is clear that the scale of these uses is far more dependent on business and industry activity throughout the region. Based on the anticipated growth in non‐residents it is expected that this activity will increase though not
Current Supply Demand - Capaci ty Di fference*Food and Grocery and Bottle-Shop 5,239 15,991 10,752Catering (Restaurant and Café) 150 7,288 7,138Non-Food 8,306 23,733 15,427Services 4,228 2,408 -1,820Total 17,923 49,419 33,316*Negative values removed from total for accuracy

Retail and Commercial Assessment Moranbah
Prepared for Urban Land Development Authority MacroPlan Australia Pty Ltd March 2011
37
significantly. There is not expected to be any need or opportunity to establish any significant scale of additional commercial facilities and it is likely that any future commercial development or growth will be in response to a specific business establishing or relocating to the area.
The following recommendations will provide further scope to these identified opportunities within Moranbah.
7.2 Recommendations
There will be a range of retail development and growth opportunities within the township of Moranbah based on the expected future population growth. Much of this growth will be accommodated within the defined UDA which is divided between the existing township area (which will support infill growth) and the south western expansion area. These two growth areas need to be considered when planning for future retail development so that residents are provided with suitably scaled, convenient and accessible retail facilities.
The retail development opportunities identified in the gap analysis presented above include the following:
• One full line supermarket development – Approx. 4,000 m2
• One to two convenience supermarkets – Approx. 400 to 600 m2 each
• A food court / dining precinct – Up to 2,000 m2 (with up to an additional 2,000 m2 of dining uses throughout the township)
• A small homemakers/bulky goods precinct – Up to 4,000 m2
• Other non‐food retail including fashion retail – Up to 1,000 m2 within the town centre
Some of these uses will require key population thresholds to be supported while others are expected to establish early and trade at below average productivities in order to gain market share. The following table provides further detail around the scale and scope of these opportunities, locational requirements, key population thresholds and general recommendations.

Retail and Commercial Assessment Moranbah
Prepared for Urban Land Development Authority MacroPlan Australia Pty Ltd March 2011
38
Figure 23. Future Retail Development Recommendations
Retail Use Scale Potential Tenant/s Locational Recommendations Required Triggers General Recommendations
Full line supermarket
Approx. 4,000 m2
(with up to 500 m2 of associated specialty retail)
Woolworths Ideally the supermarket should be located within the town centre precinct to provide the best level of service for residents as well as increasing competition with the existing Coles supermarket.
It is recommended that a minimum FTE population of 14,000 people be established before the second full line supermarket commences operation. Based on the current population projections this is expected to occur around 2021.
Ideally a catchment of between 18,000 people and 20,000 people is required for two full line supermarkets however it is expected that this second supermarket may establish early in order to grow market share.
It is expected that a small scale of specialty retail stores may establish in conjunction with this supermarket including specialty food and non‐food retail uses up to 500 m2.
There is a risk that if this supermarket is proposed early it will generate significant impacts on the existing Coles.

Retail and Commercial Assessment Moranbah
Prepared for Urban Land Development Authority MacroPlan Australia Pty Ltd March 2011
39
Retail Use Scale Potential Tenant/s Locational Recommendations Required Triggers General Recommendations
Convenience supermarkets (up to two)
Approx. 400 to 600 m2 each
IGA, Night Owl, 7 Eleven
A convenience supermarket is required to serve the residential community in the south western growth area. It is recommended that a convenience supermarket should front Goonyella Road to capture inflow demand from passing traffic.
The residential growth area in the east of Moranbah may generate sufficient population to support a second convenience supermarket.
A population trigger of 2,000 people within the south western growth will be required to support the first convenience supermarket.
A second convenience supermarket may be supported in the eastern growth area in Moranbah however this will be dependent on the scale of previous facilities established and the strength of the Town Centre.
A convenience supermarket will serve a predominantly different range of retails needs than a full line supermarket. This retail use is therefore not likely to generate any significant impact on the existing Coles.
Food and beverage, cafe and dining uses
Up to 4,000 m2 (with up to 2,000 m2 dining precinct)
Various food and beverage, cafe, fast food and restaurants
A consolidated dining precinct should be located within the town centre precinct to leverage off of existing demand and activity.
Other dining uses should be provided in convenient and accessible locations, preferably alongside existing commercial or activity uses.
Up to 2,500 m2 should be located within the town centre and fringe area with the remaining 1,500 m2 being located within the south west growth area and other local centres that may be developed.
There is considered an undersupply of catering retail uses in Moranbah now with opportunity for up to 1,500 m2.
Additional growth will be dependent on population derived demand as indicated in Section 6.
The highly affluent resident and worker population within Moranbah will provide demand and opportunity to establish a broad range of dining uses. This should be considered when planning for the dining precinct.
A consolidated precinct within the town centre will encourage additional activity which will benefit surrounding retail uses.

Retail and Commercial Assessment Moranbah
Prepared for Urban Land Development Authority MacroPlan Australia Pty Ltd March 2011
40
Retail Use Scale Potential Tenant/s Locational Recommendations Required Triggers General Recommendations
Homemakers /bulky goods precinct
Up to 4,000 m2
Local furniture and homewares stores, though preferably some small scale national retailers
These retail uses can be located outside of the town centre precinct as they are destination retail uses which are not likely to gain or generate any benefit from a town centre location. These uses will however require a main road location such as along Goonyella Road.
Ideally these uses will be established in line with the demand indicated in Section 6. However, it is expected that some homewares retailers may be willing to establish early to grow market share and trade to the high number of new households within Moranbah.
This type of retail will be hard because of the established competition in Mackay. Ideally, one or more national retail brand stores will be established as an anchor for the small centre/precinct.
Non‐food and general retail growth
Up to 1,000 m2
Fashion retail and general specialty retail stores
These retail uses will be located predominantly throughout the expanding town centre precinct. This scale of uses may be reduced if the scale of specialty retail uses accompanying the new full line supermarket exceeds 500 m2. Similarly, a portion of these uses may be located in conjunction with the convenience supermarket however this is expected to be minimal.
These uses are expected to be established in line with the growth and development to occur throughout the town centre precinct. This will predominantly be influenced by the new full line supermarket.
These additional uses will not be viable if the existing specialty retail uses throughout the town centre are trading poorly. This will need to be monitored closely prior to any additional development.
In addition, any future development should, where possible, be staged to ensure efficient take up of new retail space.

Retail and Commercial Assessment Moranbah
Prepared for Urban Land Development Authority MacroPlan Australia Pty Ltd March 2011
41
As indicated above, the full line supermarket and convenience supermarket will both require minimum population triggers being met prior to establishment. All other retail opportunities will be dependent on the establishment of these key supermarket retail uses and/or the increasing scale of retail demand as dictated by population growth.
The opportunities and recommendations have identified up to an additional 14,300 m2 of retail uses within Moranbah based on the anticipated FTE population capacity. This represents an increase of approximately 80% based on the existing 17,900 m2 of retail uses throughout the township. Between 2010 and capacity, the FTE population of Moranbah is estimated to increase by approximately 100%. The marginally less growth in the scale of retail uses is indicative of a continuing, though slightly declining, level of retail escape expenditure.
As previously stated, commercial office growth is likely to be dictated by any significant growth in business and industry activity throughout the surrounding region rather than population growth. It is expected that future commercial growth is most likely to occur in response to a specific business establishing or relocating to Moranbah.