Moore Stress 2.0 Semiconductors - Jefferies · PDF fileSemiconductors Moore Stress 2.0 ......
16
USA | Technology Semiconductors June 2, 2014 Semiconductors Moore Stress 2.0 – Follow the Money EQUITY RESEARCH GLOBAL Mark Lipacis * Equity Analyst (415) 229-1438 [email protected] Sundeep Bajikar * Equity Analyst (415) 229-1552 [email protected] Lee Simpson § Equity Analyst 44 (0) 207 029 8695 [email protected] Delos Elder, CFA, CPA * Equity Associate (415) 229-1511 [email protected] * Jefferies LLC § Jefferies International Limited Key Takeaway Over the past 10 yrs, Moore's Law drove profitability to semis from customers and suppliers. Over the next 5 yrs, we believe the stalling transistor cost curve reverses that trend. We expect 1) more vertical integration by customers 2) pricing power by suppliers, and 3) emergence of a low GM business model in semis. We expect a downward bias on growth and margins for semis broadly, but view AMAT, LRCX, INTC, Samsung and AMD as beneficiaries of these trends. Moore Stress 2.0: In our original Moore Stress note (Sep-’12), we argued that the inflecting transistor cost curve would structurally change the semiconductor industry. In this note we introduce Moore Stress 2.0, and argue that the inflection structurally changes the supply chain as well. Follow the Money: The rapid pace of technology change in semis described by Moore's Law has caused both consolidation and a concentration of supply chain power within semis. Consequently, over the past 10 years, EBIT margins for semis have increased to 20%-30% (S&P500 top quintile), while those of its customers and suppliers declined. We think that a deceleration in the transistor cost curve will drive a mean reversion process on those 10-yr EBIT trends that manifests on three dimensions: 1) Customer Vertical Integration: We think a slower transistor cost curve levels the playing field between semiconductor companies and their customers. The internal design teams, and the companies they outsource design work to, have more time to optimize a design using older transistor technology for maximum economic benefit. Apple and Huawei are just two examples of traditional semiconductor customers that are increasingly designing their own chips - we expect to see more. 2) Supplier Pricing Power: We think two things give suppliers pricing power going forward: A) Consolidation: Semi-Cap and EDA companies have consolidated at a faster rate than their customers over the past several years; B) More Value: as it becomes more difficult to climb down the transistor cost curve at historical rates, improvements in supplier products will be considered higher value-add and command higher prices. 3) Lower Gross Margin Business Model: A decelerating transistor cost curve means longer time at a given transistor node, and more time for fast (or slow) followers to develop and amortize development for IP blocks. We think AMD's semi-custom business model offers a glimpse of what device makers may be up against: gross margins of 25%-30%, customer funded R&D in the form of NREs (non-recurring engineering), nominal inventory risk, and operating margins in the 15%-to-20% range. Moore Stress 2.0 Beneficiaries: We think suppliers like AMAT and LRCX are poised to benefit from these trends and initiate coverage with a Buy on those stocks concurrent with this note. We continue to believe scale is critical for IDMs to stay on the historical Moore's Law Transistor cost curve, and view INTC and Samsung as long-term beneficiaries, as their competitors drop off. Finally, we think AMD's new business model and its unique position as a holder of intellectual property around x86, ARM, Graphics and server fabric technology, position it to benefit from these emerging dynamics. Moore Stress 2.0 Challenged: We view high-margin, leading edge fabless companies as being potentially challenged by these dynamics, and are incrementally cautious on ALTR, XLNX and NVDA. Links to Related Reports: Moore Stress = Structural Industry Shift Moore Stress - One Year Anniversary Compendium Moore Stress 2.0: Equipment Supplier Leverage - Initiating Coverage Jefferies does and seeks to do business with companies covered in its research reports. As a result, investors should be aware that Jefferies may have a conflict of interest that could affect the objectivity of this report. Investors should consider this report as only a single factor in making their investment decision. Please see analyst certifications, important disclosure information, and information regarding the status of non-US analysts on pages 13 to 16 of this report.
Transcript of Moore Stress 2.0 Semiconductors - Jefferies · PDF fileSemiconductors Moore Stress 2.0 ......

USA | Technology
Semiconductors June 2, 2014
SemiconductorsMoore Stress 2.0 – Follow the Money
EQU
ITY R
ESEARC
H G
LOB
AL
Mark Lipacis *Equity Analyst
(415) 229-1438 [email protected] Bajikar *
Equity Analyst(415) 229-1552 [email protected]
Lee Simpson §Equity Analyst
44 (0) 207 029 8695 [email protected] Elder, CFA, CPA *
Equity Associate(415) 229-1511 [email protected]
* Jefferies LLC § Jefferies International Limited
Key TakeawayOver the past 10 yrs, Moore's Law drove profitability to semis from customersand suppliers. Over the next 5 yrs, we believe the stalling transistor cost curvereverses that trend. We expect 1) more vertical integration by customers 2)pricing power by suppliers, and 3) emergence of a low GM business model insemis. We expect a downward bias on growth and margins for semis broadly,but view AMAT, LRCX, INTC, Samsung and AMD as beneficiaries of these trends.
Moore Stress 2.0: In our original Moore Stress note (Sep-’12), we argued that the inflectingtransistor cost curve would structurally change the semiconductor industry. In this note weintroduce Moore Stress 2.0, and argue that the inflection structurally changes the supplychain as well.
Follow the Money: The rapid pace of technology change in semis described by Moore'sLaw has caused both consolidation and a concentration of supply chain power within semis.Consequently, over the past 10 years, EBIT margins for semis have increased to 20%-30%(S&P500 top quintile), while those of its customers and suppliers declined. We think that adeceleration in the transistor cost curve will drive a mean reversion process on those 10-yrEBIT trends that manifests on three dimensions:
1) Customer Vertical Integration: We think a slower transistor cost curve levels theplaying field between semiconductor companies and their customers. The internal designteams, and the companies they outsource design work to, have more time to optimizea design using older transistor technology for maximum economic benefit. Apple andHuawei are just two examples of traditional semiconductor customers that are increasinglydesigning their own chips - we expect to see more.2) Supplier Pricing Power: We think two things give suppliers pricing power goingforward: A) Consolidation: Semi-Cap and EDA companies have consolidated at a faster ratethan their customers over the past several years; B) More Value: as it becomes more difficultto climb down the transistor cost curve at historical rates, improvements in supplier productswill be considered higher value-add and command higher prices.3) Lower Gross Margin Business Model: A decelerating transistor cost curve meanslonger time at a given transistor node, and more time for fast (or slow) followers to developand amortize development for IP blocks. We think AMD's semi-custom business modeloffers a glimpse of what device makers may be up against: gross margins of 25%-30%,customer funded R&D in the form of NREs (non-recurring engineering), nominal inventoryrisk, and operating margins in the 15%-to-20% range.Moore Stress 2.0 Beneficiaries: We think suppliers like AMAT and LRCX are poised tobenefit from these trends and initiate coverage with a Buy on those stocks concurrent withthis note. We continue to believe scale is critical for IDMs to stay on the historical Moore'sLaw Transistor cost curve, and view INTC and Samsung as long-term beneficiaries, as theircompetitors drop off. Finally, we think AMD's new business model and its unique positionas a holder of intellectual property around x86, ARM, Graphics and server fabric technology,position it to benefit from these emerging dynamics.Moore Stress 2.0 Challenged: We view high-margin, leading edge fabless companies asbeing potentially challenged by these dynamics, and are incrementally cautious on ALTR,XLNX and NVDA.Links to Related Reports:Moore Stress = Structural Industry ShiftMoore Stress - One Year Anniversary CompendiumMoore Stress 2.0: Equipment Supplier Leverage - Initiating Coverage
Jefferies does and seeks to do business with companies covered in its research reports. As a result, investors should be aware that Jefferies may have a conflictof interest that could affect the objectivity of this report. Investors should consider this report as only a single factor in making their investment decision.Please see analyst certifications, important disclosure information, and information regarding the status of non-US analysts on pages 13 to 16 of this report.

Moore Stress 2.0: Follow the Money Moore Stress is Real and Investable. In our original Moore Stress note (Sep-’12), we
argued that the transistor cost curve inflection would structurally change the
semiconductor industry. Since that note, MU is up 300%, a memory stock started paying
a dividend (SNDK: August, 2013) and Altera shifted its sourcing of leading edge chips to
Intel from TSMC. In Moore Stress 2.0, we argue that the inflection structurally changes
the supply chain as well.
As Barbie may have said…“Semis are Tough!” Designing chips using the latest,
leading edge transistors is not just extremely difficult to do, it is expensive too. IBS
estimates that in 2004, it cost about $20 million to design an integrated circuit (IC) using
90nm transistors – that cost has skyrocketed to $170m to design an IC on 20nm
transistors today. On the manufacturing side, it can cost upwards of $10 billion and three
years to build a new leading edge semiconductor manufacturing facility.
Higher Costs Have Driven Semiconductor Consolidation. Importantly, the
semiconductor industry has consolidated at a faster pace than its customers and
suppliers, and therefore gained relative power in the supply chain. We think that this
increased power shows up in their profitability (EBIT). Over the past 10 years, profitability
of semiconductor companies has increased, and profitability of their customers and
suppliers has decreased (Charts 3 and 4). Many semiconductor companies have EBIT
margins in the 20%-to-30% range, putting them in the top quintile of the S&P500.
Follow the Money. The juicy semiconductor EBIT margins have always been a target for
semiconductor customers and suppliers. We think that the inflecting transistor cost curve
starts a mean reversion process on those 10-year EBIT trends that manifests on three
dimensions:
1) Customer Vertical Integration: We think a slower transistor cost curve levels the
playing field between leading edge companies and their customers. If the economic
benefit of moving to the next smaller transistor is not as obvious, then why pay
semiconductor companies a high margin to do it? The internal design teams at OEMs
have more time to optimize an N-1 design for maximum economic benefit. Apple and
Huawei are examples of traditional semiconductor customers that are now designing their
own chips; we expect to see more (Charts 7 and 8).
2) Supplier Pricing Power: We think two things give suppliers pricing power going
forward: A) Consolidation: Semi-Cap and EDA companies have consolidated at a faster
rate than their customers over the past several years; B) More Value: as it becomes more
difficult to climb down the transistor cost curve at historical rates, improvements in
supplier products will be considered higher value-add and command higher prices. The
mean reversion process has already started at EDA companies; we think Semiconductor
Capital Equipment companies are next.
3) Lower Gross Margin Business Model: A decelerating transistor cost curve means
longer time at a given transistor node, and more time for fast (or even slow) followers to
develop and amortize IP blocks for different semiconductor manufacturing processes. We
think AMD's semi-custom business model offers a glimpse of what device makers may be
up against: gross margins of 25%-30%, customer funded R&D in the form of NREs (non-
recurring engineering), nominal inventory risk, and operating margins in the 15%-to-20%
range.
Moore Stress 2.0 Beneficiaries: We think suppliers like AMAT and LRCX are best
poised to benefit from these trends, and in conjunction with this note, we launch
coverage with Buy ratings on both. We continue to believe scale is critical for IDMs to
Technology
Semiconductors
June 2, 2014
page 2 of 16 , Equity Analyst, (415) 229-1438, [email protected] Lipacis
Please see important disclosure information on pages 13 - 16 of this report.
stay on the historical Moore's Law Transistor cost curve, and view INTC and Samsung as
long-term beneficiaries, as their competitors drop off. Finally, we think the power of
AMD's new business model and its unique position as a holder of intellectual property
around x86, ARM, Graphics and server fabric technology, position it to benefit from these
emerging dynamics.
Moore Stress 2.0 Challenged: We view high-margin, leading edge fabless companies
as being potentially challenged by these dynamics. We expect to see (and may already be
seeing) slower growth associated with increased vertical integration by traditional
semiconductor customers and increased price pressure as a new lower gross margin
business model emerges to take advantage of the slower transistor cost curve. Below the
top line, we expect higher R&D intensity as consolidation translates to increased pricing
power by suppliers. We are incrementally cautious on ALTR, XLNX and NVDA.
Technology
Semiconductors
June 2, 2014
page 3 of 16 , Equity Analyst, (415) 229-1438, [email protected] Lipacis
Please see important disclosure information on pages 13 - 16 of this report.
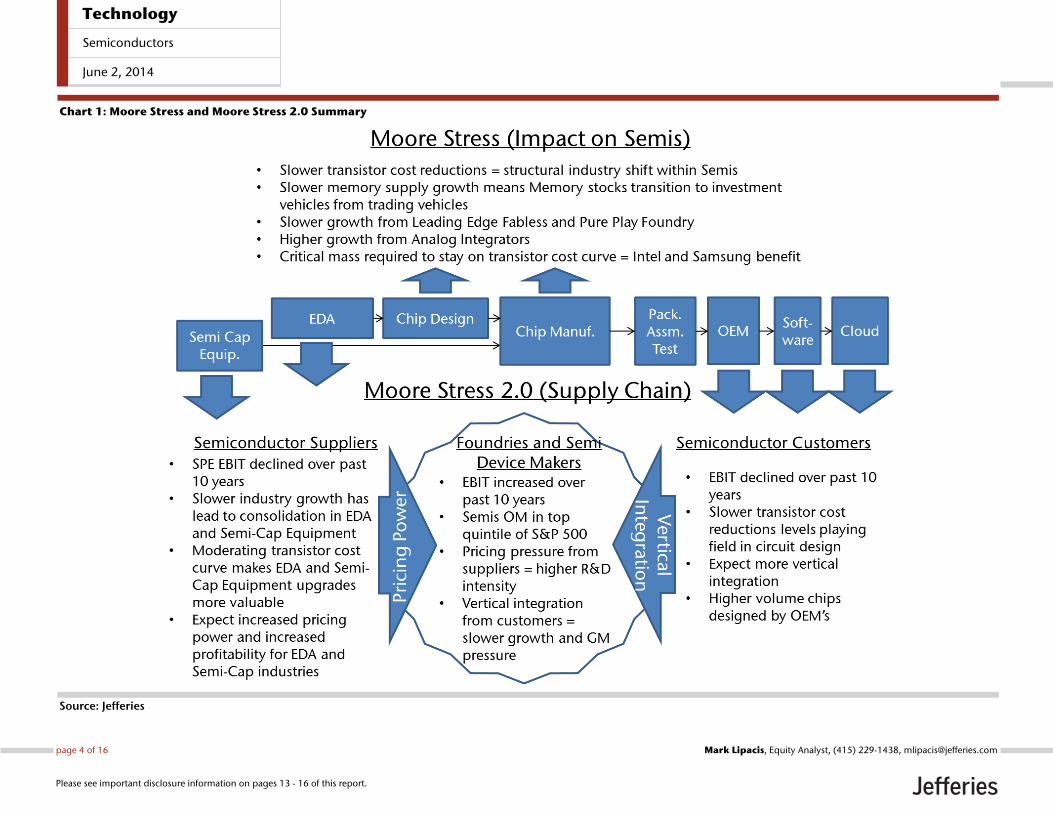
Chart 1: Moore Stress and Moore Stress 2.0 Summary
Source: Jefferies
Technology
Semiconductors
June 2, 2014
page 4 of 16 , Equity Analyst, (415) 229-1438, [email protected] Lipacis
Please see important disclosure information on pages 13 - 16 of this report.

Chart 2: Changing Transistor Cost Curve = Changing Competitive Dynamics in the Supply Chain
Source: Jefferies, company data, IBS
Technology
Semiconductors
June 2, 2014
page 5 of 16 , Equity Analyst, (415) 229-1438, [email protected] Lipacis
Please see important disclosure information on pages 13 - 16 of this report.
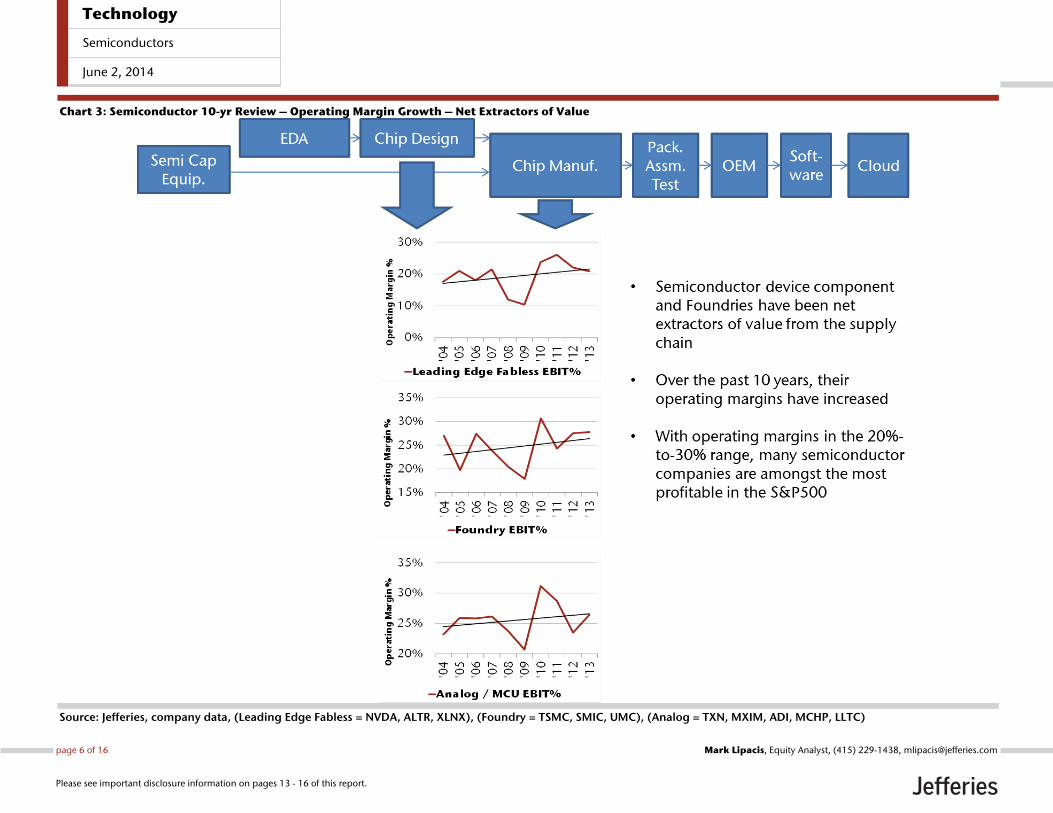
Chart 3: Semiconductor 10-yr Review – Operating Margin Growth – Net Extractors of Value
Source: Jefferies, company data, (Leading Edge Fabless = NVDA, ALTR, XLNX), (Foundry = TSMC, SMIC, UMC), (Analog = TXN, MXIM, ADI, MCHP, LLTC)
Technology
Semiconductors
June 2, 2014
page 6 of 16 , Equity Analyst, (415) 229-1438, [email protected] Lipacis
Please see important disclosure information on pages 13 - 16 of this report.

Chart 4: Semiconductor Customer and Supplier 10-yr Review – Operating Margin Decline – Net Losers of Value
Source: Jefferies, company data, (Semi Cap = ASML, AMAT, LRCX, KLAC, TEL), (EDA = CDNS, SNPS, MENT), (OEM = DELL, HP, CSCO, ALU, ERIC), (Cloud = AMZN, GOOG, FB)
Technology
Semiconductors
June 2, 2014
page 7 of 16 , Equity Analyst, (415) 229-1438, [email protected] Lipacis
Please see important disclosure information on pages 13 - 16 of this report.

Chart 5: Herfindahl Index for Semi-Cap Equipment Segments
Source: Jefferies, company data, Gartner
Technology
Semiconductors
June 2, 2014
page 8 of 16 , Equity Analyst, (415) 229-1438, [email protected] Lipacis
Please see important disclosure information on pages 13 - 16 of this report.

Chart 6: Acquisition and Op Margins for EDA Companies
Source: Jefferies, company data, (EDA = CDNS, SNPS, MENT)
Technology
Semiconductors
June 2, 2014
page 9 of 16 , Equity Analyst, (415) 229-1438, [email protected] Lipacis
Please see important disclosure information on pages 13 - 16 of this report.
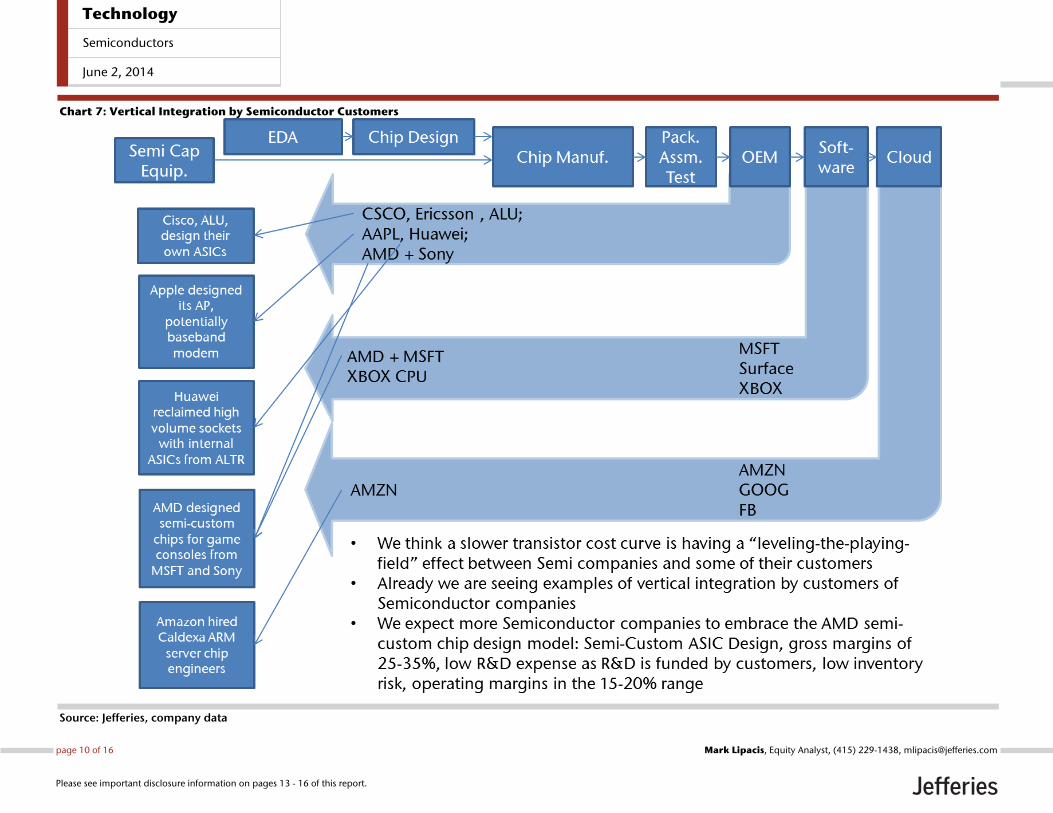
Chart 7: Vertical Integration by Semiconductor Customers
Source: Jefferies, company data
Technology
Semiconductors
June 2, 2014
page 10 of 16 , Equity Analyst, (415) 229-1438, [email protected] Lipacis
Please see important disclosure information on pages 13 - 16 of this report.

Chart 8: Data Points on OEMs Moving to Chip Design (click underlined text for link to article)
Microsoft
& Sony • Engaged AMD to design custom chips for Xbox
One and PS4
Moor Insights: The Real Reasons Microsoft, Sony Chose AMD For The
Xbox One And PS4
Apple • Acquired SoC designer PA Semi (April 2008)
• Acquired core accelerator chip designer Intrinsity
(April 2010)
Wired: Four Reasons Apple Bought PA Semi The New York Times: Apple Buys Intrinsity, a Maker of Fast Chips
Amazon • Hired former Calxeda engineers
• Posted job openings for CPU Architects (April 2014)
GigaOm: Amazon joins other web giants trying to design its own
chips
Google • Acquired Agnilux (April 2010)
• Designed data center switches
Ars Technica: Google Buys Secret Chip Startup Wired: Mystery Google Device Appears in Small-Town Iowa
Huawei
• Huawei’s internal ASIC design team, HiSilicon,
licensed ARM (2011)
• Captured high-volume design wins from Altera
(2H12)
ARM: HiSilicon Licenses ARM Technology for use in Innovative 3G/4G
Base Station, Networking Infrastructure and Mobile Computing
Applications eetimes: Huawei Using ASICs for First Time
Facebook • Collaborates with Intel on server chip designs Wired: The Facebook Special: How Intel Builds Custom Chips for
Giants of the Web
ZTE • Licenses CEVA DSP cores in internal ASIC designs eetimes: Ceva-ZTE Deal Hints Home-Grown ASIC Is Back
Cisco • Large internal team engaged in ASIC design Seeking Alpha: Cisco announces new network processor, EZchip
tumbles
Alcatel-
Lucent • Also has an internal ASIC design team Itweb: Alcatel-Lucent Enterprise to address network application
challenge with new access switch, added analytics, SDN capabilities Source: Jefferies, company data, media reports
Technology
Semiconductors
June 2, 2014
page 11 of 16 , Equity Analyst, (415) 229-1438, [email protected] Lipacis
Please see important disclosure information on pages 13 - 16 of this report.
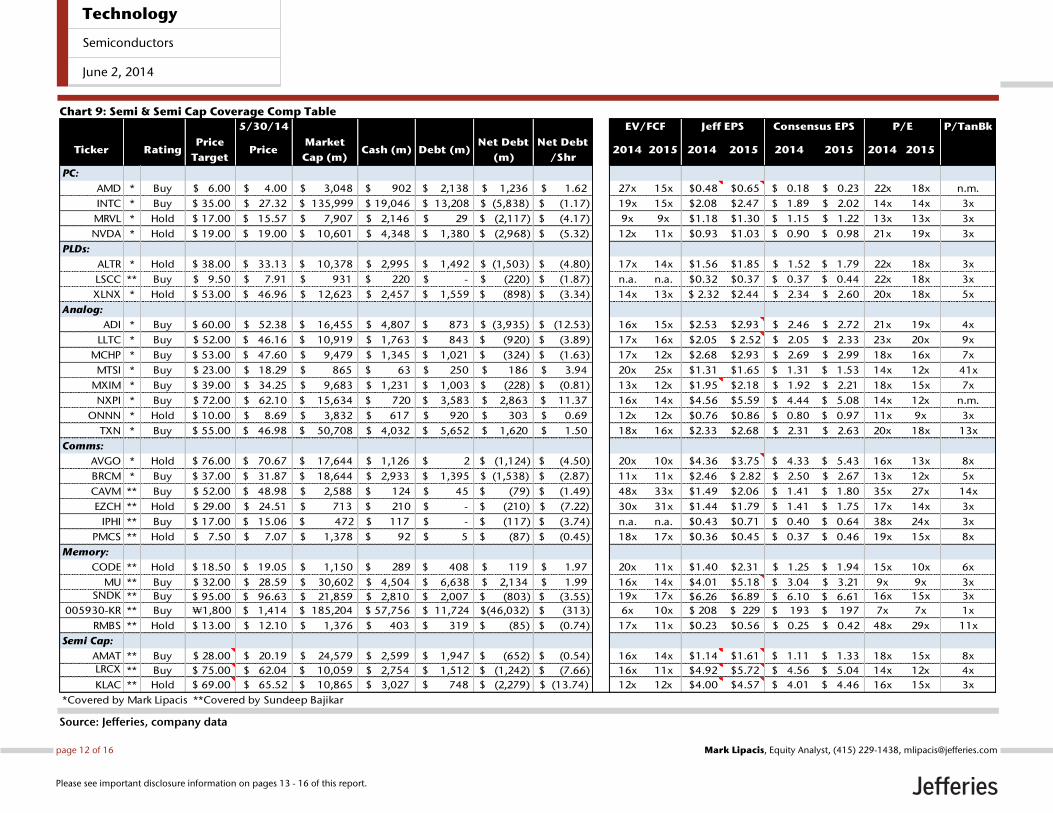
Chart 9: Semi & Semi Cap Coverage Comp Table
Source: Jefferies, company data
5/30/14 EV/FCF Jeff EPS Consensus EPS P/E P/TanBk
Ticker RatingPrice
TargetPrice
Market
Cap (m)Cash (m) Debt (m)
Net Debt
(m)
Net Debt
/Shr2014 2015 2014 2015 2014 2015 2014 2015
PC:
AMD * Buy $ 6.00 $ 4.00 $ 3,048 $ 902 $ 2,138 $ 1,236 $ 1.62 27x 15x $0.48 $0.65 $ 0.18 $ 0.23 22x 18x n.m.
INTC * Buy $ 35.00 $ 27.32 $ 135,999 $ 19,046 $ 13,208 $ (5,838) $ (1.17) 19x 15x $2.08 $2.47 $ 1.89 $ 2.02 14x 14x 3x
MRVL * Hold $ 17.00 $ 15.57 $ 7,907 $ 2,146 $ 29 $ (2,117) $ (4.17) 9x 9x $1.18 $1.30 $ 1.15 $ 1.22 13x 13x 3x
NVDA * Hold $ 19.00 $ 19.00 $ 10,601 $ 4,348 $ 1,380 $ (2,968) $ (5.32) 12x 11x $0.93 $1.03 $ 0.90 $ 0.98 21x 19x 3x
PLDs:
ALTR * Hold $ 38.00 $ 33.13 $ 10,378 $ 2,995 $ 1,492 $ (1,503) $ (4.80) 17x 14x $1.56 $1.85 $ 1.52 $ 1.79 22x 18x 3x
LSCC ** Buy $ 9.50 $ 7.91 $ 931 $ 220 $ - $ (220) $ (1.87) n.a. n.a. $0.32 $0.37 $ 0.37 $ 0.44 22x 18x 3x
XLNX * Hold $ 53.00 $ 46.96 $ 12,623 $ 2,457 $ 1,559 $ (898) $ (3.34) 14x 13x $ 2.32 $2.44 $ 2.34 $ 2.60 20x 18x 5x
Analog:
ADI * Buy $ 60.00 $ 52.38 $ 16,455 $ 4,807 $ 873 $ (3,935) $ (12.53) 16x 15x $2.53 $2.93 $ 2.46 $ 2.72 21x 19x 4x
LLTC * Buy $ 52.00 $ 46.16 $ 10,919 $ 1,763 $ 843 $ (920) $ (3.89) 17x 16x $2.05 $ 2.52 $ 2.05 $ 2.33 23x 20x 9x
MCHP * Buy $ 53.00 $ 47.60 $ 9,479 $ 1,345 $ 1,021 $ (324) $ (1.63) 17x 12x $2.68 $2.93 $ 2.69 $ 2.99 18x 16x 7x
MTSI * Buy $ 23.00 $ 18.29 $ 865 $ 63 $ 250 $ 186 $ 3.94 20x 25x $1.31 $1.65 $ 1.31 $ 1.53 14x 12x 41x
MXIM * Buy $ 39.00 $ 34.25 $ 9,683 $ 1,231 $ 1,003 $ (228) $ (0.81) 13x 12x $1.95 $2.18 $ 1.92 $ 2.21 18x 15x 7x
NXPI * Buy $ 72.00 $ 62.10 $ 15,634 $ 720 $ 3,583 $ 2,863 $ 11.37 16x 14x $4.56 $5.59 $ 4.44 $ 5.08 14x 12x n.m.
ONNN * Hold $ 10.00 $ 8.69 $ 3,832 $ 617 $ 920 $ 303 $ 0.69 12x 12x $0.76 $0.86 $ 0.80 $ 0.97 11x 9x 3x
TXN * Buy $ 55.00 $ 46.98 $ 50,708 $ 4,032 $ 5,652 $ 1,620 $ 1.50 18x 16x $2.33 $2.68 $ 2.31 $ 2.63 20x 18x 13x
Comms:
AVGO * Hold $ 76.00 $ 70.67 $ 17,644 $ 1,126 $ 2 $ (1,124) $ (4.50) 20x 10x $4.36 $3.75 $ 4.33 $ 5.43 16x 13x 8x
BRCM * Buy $ 37.00 $ 31.87 $ 18,644 $ 2,933 $ 1,395 $ (1,538) $ (2.87) 11x 11x $2.46 $ 2.82 $ 2.50 $ 2.67 13x 12x 5x
CAVM ** Buy $ 52.00 $ 48.98 $ 2,588 $ 124 $ 45 $ (79) $ (1.49) 48x 33x $1.49 $2.06 $ 1.41 $ 1.80 35x 27x 14x
EZCH ** Hold $ 29.00 $ 24.51 $ 713 $ 210 $ - $ (210) $ (7.22) 30x 31x $1.44 $1.79 $ 1.41 $ 1.75 17x 14x 3x
IPHI ** Buy $ 17.00 $ 15.06 $ 472 $ 117 $ - $ (117) $ (3.74) n.a. n.a. $0.43 $0.71 $ 0.40 $ 0.64 38x 24x 3x
PMCS ** Hold $ 7.50 $ 7.07 $ 1,378 $ 92 $ 5 $ (87) $ (0.45) 18x 17x $0.36 $0.45 $ 0.37 $ 0.46 19x 15x 8x
Memory:
CODE ** Hold $ 18.50 $ 19.05 $ 1,150 $ 289 $ 408 $ 119 $ 1.97 20x 11x $1.40 $2.31 $ 1.25 $ 1.94 15x 10x 6x
MU ** Buy $ 32.00 $ 28.59 $ 30,602 $ 4,504 $ 6,638 $ 2,134 $ 1.99 16x 14x $4.01 $5.18 $ 3.04 $ 3.21 9x 9x 3x
SNDK ** Buy $ 95.00 $ 96.63 $ 21,859 $ 2,810 $ 2,007 $ (803) $ (3.55) 19x 17x $6.26 $6.89 $ 6.10 $ 6.61 16x 15x 3x
005930-KR ** Buy ₩1,800 $ 1,414 $ 185,204 $ 57,756 $ 11,724 $(46,032) $ (313) 6x 10x $ 208 $ 229 $ 193 $ 197 7x 7x 1x
RMBS ** Hold $ 13.00 $ 12.10 $ 1,376 $ 403 $ 319 $ (85) $ (0.74) 17x 11x $0.23 $0.56 $ 0.25 $ 0.42 48x 29x 11x
Semi Cap:
AMAT ** Buy $ 28.00 $ 20.19 $ 24,579 $ 2,599 $ 1,947 $ (652) $ (0.54) 16x 14x $1.14 $1.61 $ 1.11 $ 1.33 18x 15x 8x
LRCX ** Buy $ 75.00 $ 62.04 $ 10,059 $ 2,754 $ 1,512 $ (1,242) $ (7.66) 16x 11x $4.92 $5.72 $ 4.56 $ 5.04 14x 12x 4x
KLAC ** Hold $ 69.00 $ 65.52 $ 10,865 $ 3,027 $ 748 $ (2,279) $ (13.74) 12x 12x $4.00 $4.57 $ 4.01 $ 4.46 16x 15x 3x
*Covered by Mark Lipacis **Covered by Sundeep Bajikar
Technology
Semiconductors
June 2, 2014
page 12 of 16 , Equity Analyst, (415) 229-1438, [email protected] Lipacis
Please see important disclosure information on pages 13 - 16 of this report.

Analyst CertificationI, Mark Lipacis, certify that all of the views expressed in this research report accurately reflect my personal views about the subject security(ies) andsubject company(ies). I also certify that no part of my compensation was, is, or will be, directly or indirectly, related to the specific recommendationsor views expressed in this research report.I, Sundeep Bajikar, certify that all of the views expressed in this research report accurately reflect my personal views about the subject security(ies) andsubject company(ies). I also certify that no part of my compensation was, is, or will be, directly or indirectly, related to the specific recommendationsor views expressed in this research report.I, Lee Simpson, certify that all of the views expressed in this research report accurately reflect my personal views about the subject security(ies) andsubject company(ies). I also certify that no part of my compensation was, is, or will be, directly or indirectly, related to the specific recommendationsor views expressed in this research report.I, Delos Elder, CFA, CPA, certify that all of the views expressed in this research report accurately reflect my personal views about the subjectsecurity(ies) and subject company(ies). I also certify that no part of my compensation was, is, or will be, directly or indirectly, related to the specificrecommendations or views expressed in this research report.Registration of non-US analysts: Lee Simpson is employed by Jefferies International Limited, a non-US affiliate of Jefferies LLC and is not registered/qualified as a research analyst with FINRA. This analyst(s) may not be an associated person of Jefferies LLC, a FINRA member firm, and therefore maynot be subject to the NASD Rule 2711 and Incorporated NYSE Rule 472 restrictions on communications with a subject company, public appearancesand trading securities held by a research analyst.
As is the case with all Jefferies employees, the analyst(s) responsible for the coverage of the financial instruments discussed in this report receivescompensation based in part on the overall performance of the firm, including investment banking income. We seek to update our research asappropriate, but various regulations may prevent us from doing so. Aside from certain industry reports published on a periodic basis, the large majorityof reports are published at irregular intervals as appropriate in the analyst's judgement.
Company Specific DisclosuresFor Important Disclosure information on companies recommended in this report, please visit our website at https://javatar.bluematrix.com/sellside/Disclosures.action or call 212.284.2300.
Meanings of Jefferies RatingsBuy - Describes stocks that we expect to provide a total return (price appreciation plus yield) of 15% or more within a 12-month period.Hold - Describes stocks that we expect to provide a total return (price appreciation plus yield) of plus 15% or minus 10% within a 12-month period.Underperform - Describes stocks that we expect to provide a total negative return (price appreciation plus yield) of 10% or more within a 12-monthperiod.The expected total return (price appreciation plus yield) for Buy rated stocks with an average stock price consistently below $10 is 20% or more withina 12-month period as these companies are typically more volatile than the overall stock market. For Hold rated stocks with an average stock priceconsistently below $10, the expected total return (price appreciation plus yield) is plus or minus 20% within a 12-month period. For Underperformrated stocks with an average stock price consistently below $10, the expected total return (price appreciation plus yield) is minus 20% within a 12-month period.NR - The investment rating and price target have been temporarily suspended. Such suspensions are in compliance with applicable regulations and/or Jefferies policies.CS - Coverage Suspended. Jefferies has suspended coverage of this company.NC - Not covered. Jefferies does not cover this company.Restricted - Describes issuers where, in conjunction with Jefferies engagement in certain transactions, company policy or applicable securitiesregulations prohibit certain types of communications, including investment recommendations.Monitor - Describes stocks whose company fundamentals and financials are being monitored, and for which no financial projections or opinions onthe investment merits of the company are provided.
Valuation MethodologyJefferies' methodology for assigning ratings may include the following: market capitalization, maturity, growth/value, volatility and expected totalreturn over the next 12 months. The price targets are based on several methodologies, which may include, but are not restricted to, analyses of marketrisk, growth rate, revenue stream, discounted cash flow (DCF), EBITDA, EPS, cash flow (CF), free cash flow (FCF), EV/EBITDA, P/E, PE/growth, P/CF,P/FCF, premium (discount)/average group EV/EBITDA, premium (discount)/average group P/E, sum of the parts, net asset value, dividend returns,and return on equity (ROE) over the next 12 months.
Jefferies Franchise PicksJefferies Franchise Picks include stock selections from among the best stock ideas from our equity analysts over a 12 month period. Stock selectionis based on fundamental analysis and may take into account other factors such as analyst conviction, differentiated analysis, a favorable risk/rewardratio and investment themes that Jefferies analysts are recommending. Jefferies Franchise Picks will include only Buy rated stocks and the numbercan vary depending on analyst recommendations for inclusion. Stocks will be added as new opportunities arise and removed when the reason forinclusion changes, the stock has met its desired return, if it is no longer rated Buy and/or if it underperforms the S&P by 15% or more since inclusion.Franchise Picks are not intended to represent a recommended portfolio of stocks and is not sector based, but we may note where we believe a Pickfalls within an investment style such as growth or value.
Technology
Semiconductors
June 2, 2014
page 13 of 16 , Equity Analyst, (415) 229-1438, [email protected] Lipacis
Please see important disclosure information on pages 13 - 16 of this report.

Risk which may impede the achievement of our Price TargetThis report was prepared for general circulation and does not provide investment recommendations specific to individual investors. As such, thefinancial instruments discussed in this report may not be suitable for all investors and investors must make their own investment decisions basedupon their specific investment objectives and financial situation utilizing their own financial advisors as they deem necessary. Past performance ofthe financial instruments recommended in this report should not be taken as an indication or guarantee of future results. The price, value of, andincome from, any of the financial instruments mentioned in this report can rise as well as fall and may be affected by changes in economic, financialand political factors. If a financial instrument is denominated in a currency other than the investor's home currency, a change in exchange rates mayadversely affect the price of, value of, or income derived from the financial instrument described in this report. In addition, investors in securities suchas ADRs, whose values are affected by the currency of the underlying security, effectively assume currency risk.
Other Companies Mentioned in This Report• Advanced Micro Devices, Inc. (AMD: $3.97, BUY)• Altera Corp (ALTR: $33.11, HOLD)• Analog Devices, Inc. (ADI: $52.37, BUY)• Applied Materials, Inc. (AMAT: $20.52, BUY)• Avago Technologies (AVGO: $71.64, HOLD)• Broadcom Corporation (BRCM: $34.84, BUY)• Cavium Inc. (CAVM: $48.41, BUY)• EZchip Semiconductor Ltd. (EZCH: $24.57, HOLD)• Inphi Corporation (IPHI: $14.93, BUY)• Intel Corporation (INTC: $27.26, BUY)• KLA-Tencor Corporation (KLAC: $65.58, HOLD)• LAM Research Corporation (LRCX: $62.31, BUY)• Lattice Semiconductor Corporation (LSCC: $7.77, BUY)• Linear Technology (LLTC: $45.99, BUY)• M/A-COM Technology Solutions Holdings, Inc. (MTSI: $18.63, BUY)• Marvell Technology Group Ltd. (MRVL: $15.92, HOLD)• Maxim Integrated Products, Inc. (MXIM: $34.20, BUY)• Microchip Technology Inc. (MCHP: $47.25, BUY)• Micron Technology, Inc. (MU: $28.66, BUY)• NVIDIA Corporation (NVDA: $18.94, HOLD)• NXP Semiconductors NV (NXPI: $62.40, BUY)• ON Semiconductor Corporation (ONNN: $8.66, HOLD)• PMC-Sierra, Inc. (PMCS: $7.01, HOLD)• Rambus, Inc. (RMBS: $11.77, HOLD)• Samsung Electronics Co. Ltd. (005930 KS: KRW1,470,000, BUY)• SanDisk Corporation (SNDK: $97.15, BUY)• Spansion, Inc. (CODE: $19.80, HOLD)• Texas Instruments Incorporated (TXN: $46.99, BUY)• Xilinx Corp (XLNX: $46.37, HOLD)
Distribution of RatingsIB Serv./Past 12 Mos.
Rating Count Percent Count Percent
BUY 900 50.48% 241 26.78%HOLD 740 41.50% 122 16.49%UNDERPERFORM 143 8.02% 5 3.50%
Technology
Semiconductors
June 2, 2014
page 14 of 16 , Equity Analyst, (415) 229-1438, [email protected] Lipacis
Please see important disclosure information on pages 13 - 16 of this report.
Other Important Disclosures
Jefferies Equity Research refers to research reports produced by analysts employed by one of the following Jefferies Group LLC (“Jefferies”) groupcompanies:
United States: Jefferies LLC which is an SEC registered firm and a member of FINRA.
United Kingdom: Jefferies International Limited, which is authorized and regulated by the Financial Conduct Authority; registered in England andWales No. 1978621; registered office: Vintners Place, 68 Upper Thames Street, London EC4V 3BJ; telephone +44 (0)20 7029 8000; facsimile +44 (0)207029 8010.
Hong Kong: Jefferies Hong Kong Limited, which is licensed by the Securities and Futures Commission of Hong Kong with CE number ATS546; locatedat Suite 2201, 22nd Floor, Cheung Kong Center, 2 Queen’s Road Central, Hong Kong.
Singapore: Jefferies Singapore Limited, which is licensed by the Monetary Authority of Singapore; located at 80 Raffles Place #15-20, UOB Plaza 2,Singapore 048624, telephone: +65 6551 3950.
Japan: Jefferies (Japan) Limited, Tokyo Branch, which is a securities company registered by the Financial Services Agency of Japan and is a memberof the Japan Securities Dealers Association; located at Hibiya Marine Bldg, 3F, 1-5-1 Yuraku-cho, Chiyoda-ku, Tokyo 100-0006; telephone +813 52516100; facsimile +813 5251 6101.
India: Jefferies India Private Limited (CIN - U74140MH2007PTC200509), which is licensed by the Securities and Exchange Board of India as a MerchantBanker (INM000011443) and a Stock Broker with Bombay Stock Exchange Limited (INB011491033) and National Stock Exchange of India Limited(INB231491037) in the Capital Market Segment; located at 42/43, 2 North Avenue, Maker Maxity, Bandra-Kurla Complex, Bandra (East) Mumbai 400051, India; Tel +91 22 4356 6000.
This material has been prepared by Jefferies employing appropriate expertise, and in the belief that it is fair and not misleading. The information setforth herein was obtained from sources believed to be reliable, but has not been independently verified by Jefferies. Therefore, except for any obligationunder applicable rules we do not guarantee its accuracy. Additional and supporting information is available upon request. Unless prohibited by theprovisions of Regulation S of the U.S. Securities Act of 1933, this material is distributed in the United States ("US"), by Jefferies LLC, a US-registeredbroker-dealer, which accepts responsibility for its contents in accordance with the provisions of Rule 15a-6, under the US Securities Exchange Act of1934. Transactions by or on behalf of any US person may only be effected through Jefferies LLC. In the United Kingdom and European EconomicArea this report is issued and/or approved for distribution by Jefferies International Limited and is intended for use only by persons who have, or havebeen assessed as having, suitable professional experience and expertise, or by persons to whom it can be otherwise lawfully distributed. JefferiesInternational Limited has adopted a conflicts management policy in connection with the preparation and publication of research, the details of whichare available upon request in writing to the Compliance Officer. Jefferies International Limited may allow its analysts to undertake private consultancywork. Jefferies International Limited’s conflicts management policy sets out the arrangements Jefferies International Limited employs to manage anypotential conflicts of interest that may arise as a result of such consultancy work. For Canadian investors, this material is intended for use only byprofessional or institutional investors. None of the investments or investment services mentioned or described herein is available to other personsor to anyone in Canada who is not a "Designated Institution" as defined by the Securities Act (Ontario). In Singapore, Jefferies Singapore Limited isregulated by the Monetary Authority of Singapore. For investors in the Republic of Singapore, this material is provided by Jefferies Singapore Limitedpursuant to Regulation 32C of the Financial Advisers Regulations. The material contained in this document is intended solely for accredited, expert orinstitutional investors, as defined under the Securities and Futures Act (Cap. 289 of Singapore). If there are any matters arising from, or in connectionwith this material, please contact Jefferies Singapore Limited, located at 80 Raffles Place #15-20, UOB Plaza 2, Singapore 048624, telephone: +656551 3950. In Japan this material is issued and distributed by Jefferies (Japan) Limited to institutional investors only. In Hong Kong, this report isissued and approved by Jefferies Hong Kong Limited and is intended for use only by professional investors as defined in the Hong Kong Securities andFutures Ordinance and its subsidiary legislation. In the Republic of China (Taiwan), this report should not be distributed. The research in relation tothis report is conducted outside the PRC. This report does not constitute an offer to sell or the solicitation of an offer to buy any securities in the PRC.PRC investors shall have the relevant qualifications to invest in such securities and shall be responsible for obtaining all relevant approvals, licenses,verifications and/or registrations from the relevant governmental authorities themselves. In India this report is made available by Jefferies India PrivateLimited. In Australia this information is issued solely by Jefferies International Limited and is directed solely at wholesale clients within the meaning ofthe Corporations Act 2001 of Australia (the "Act") in connection with their consideration of any investment or investment service that is the subject ofthis document. Any offer or issue that is the subject of this document does not require, and this document is not, a disclosure document or productdisclosure statement within the meaning of the Act. Jefferies International Limited is authorised and regulated by the Financial Conduct Authorityunder the laws of the United Kingdom, which differ from Australian laws. Jefferies International Limited has obtained relief under Australian Securitiesand Investments Commission Class Order 03/1099, which conditionally exempts it from holding an Australian financial services licence under theAct in respect of the provision of certain financial services to wholesale clients. Recipients of this document in any other jurisdictions should informthemselves about and observe any applicable legal requirements in relation to the receipt of this document.
This report is not an offer or solicitation of an offer to buy or sell any security or derivative instrument, or to make any investment. Any opinion orestimate constitutes the preparer's best judgment as of the date of preparation, and is subject to change without notice. Jefferies assumes no obligationto maintain or update this report based on subsequent information and events. Jefferies, its associates or affiliates, and its respective officers, directors,and employees may have long or short positions in, or may buy or sell any of the securities, derivative instruments or other investments mentioned ordescribed herein, either as agent or as principal for their own account. Upon request Jefferies may provide specialized research products or servicesto certain customers focusing on the prospects for individual covered stocks as compared to other covered stocks over varying time horizons orunder differing market conditions. While the views expressed in these situations may not always be directionally consistent with the long-term viewsexpressed in the analyst's published research, the analyst has a reasonable basis and any inconsistencies can be reasonably explained. This materialdoes not constitute a personal recommendation or take into account the particular investment objectives, financial situations, or needs of individualclients. Clients should consider whether any advice or recommendation in this report is suitable for their particular circumstances and, if appropriate,seek professional advice, including tax advice. The price and value of the investments referred to herein and the income from them may fluctuate. Pastperformance is not a guide to future performance, future returns are not guaranteed, and a loss of original capital may occur. Fluctuations in exchange
Technology
Semiconductors
June 2, 2014
page 15 of 16 , Equity Analyst, (415) 229-1438, [email protected] Lipacis
Please see important disclosure information on pages 13 - 16 of this report.

rates could have adverse effects on the value or price of, or income derived from, certain investments. This report has been prepared independently ofany issuer of securities mentioned herein and not in connection with any proposed offering of securities or as agent of any issuer of securities. Noneof Jefferies, any of its affiliates or its research analysts has any authority whatsoever to make any representations or warranty on behalf of the issuer(s).Jefferies policy prohibits research personnel from disclosing a recommendation, investment rating, or investment thesis for review by an issuer priorto the publication of a research report containing such rating, recommendation or investment thesis. Any comments or statements made herein arethose of the author(s) and may differ from the views of Jefferies.
This report may contain information obtained from third parties, including ratings from credit ratings agencies such as Standard & Poor’s. Reproductionand distribution of third party content in any form is prohibited except with the prior written permission of the related third party. Third party contentproviders do not guarantee the accuracy, completeness, timeliness or availability of any information, including ratings, and are not responsible forany errors or omissions (negligent or otherwise), regardless of the cause, or for the results obtained from the use of such content. Third party contentproviders give no express or implied warranties, including, but not limited to, any warranties of merchantability or fitness for a particular purpose oruse. Third party content providers shall not be liable for any direct, indirect, incidental, exemplary, compensatory, punitive, special or consequentialdamages, costs, expenses, legal fees, or losses (including lost income or profits and opportunity costs) in connection with any use of their content,including ratings. Credit ratings are statements of opinions and are not statements of fact or recommendations to purchase, hold or sell securities. Theydo not address the suitability of securities or the suitability of securities for investment purposes, and should not be relied on as investment advice.
Jefferies research reports are disseminated and available primarily electronically, and, in some cases, in printed form. Electronic research issimultaneously available to all clients. This report or any portion hereof may not be reprinted, sold or redistributed without the written consent ofJefferies. Neither Jefferies nor any officer nor employee of Jefferies accepts any liability whatsoever for any direct, indirect or consequential damagesor losses arising from any use of this report or its contents.
For Important Disclosure information, please visit our website at https://javatar.bluematrix.com/sellside/Disclosures.action or call 1.888.JEFFERIES
© 2014 Jefferies Group LLC
Technology
Semiconductors
June 2, 2014
page 16 of 16 , Equity Analyst, (415) 229-1438, [email protected] Lipacis
Please see important disclosure information on pages 13 - 16 of this report.


![005014899 00304 - National Archives of Ireland576 WILLS AND MOORE James. Effects £123, MOORE James. [3171 Effects £78,740 14s. lid. MOORE James. [126] Effects £191, MOORE Jane.](https://static.fdocuments.us/doc/165x107/5e3ab50527fb205ece07a5d5/005014899-00304-national-archives-of-576-wills-and-moore-james-effects-123.jpg)