Moody's Approach to Rating Residential Mortgage Pass ... · Moody's Approach to Rating Residential...
12
STRUCTURED FINANCE Special Report Moody's Approach to Rating Residential Mortgage Pass-Through Securities CONTACTS: Jay A. Siegel Senior Analyst (212) 553-4927 Catherine E. Needham Managing Director (212) 553-7920 Linda A. Stesney Managing Director (212) 553-3691 Alicia J. Furman Investor Relations (212) 553-7941 CONTRIBUTORS: Jerome S. Fons Economist (212) 553-4131 James Schmidbauer Vice President (212) 553-7938 CONTENTS Summary: A Refined Approach for a Different Market Market Overview and Outlook Key Refinements to the Rating Approach The Rating Process Remains the Same Evaluating Credit Risk in Residential Mortgages Credit Support Calculations The Role of Performance Monitoring A New Model as a Tool in the Rating Process SUMMARY: A REFINED APPROACH FOR A DIFFERENT MARKET Since 1987, Moody's has rated over $470 billion of nonconforming one-to four-family residen- tial mortgage backed securities (MBS), which represent interests in more than 1,600 pools of mortgages. The composition and performance of these pools has changed dramatically since the market's inception, and new information and trends continue to emerge. Monitoring the performance of these pools presents the opportunity to re-evaluate our rating process. This experience is the foundation for now updating the approach to rating MBS Refinements to the rating process are especially critical as the private label market evolves away from its tradi- tional product types. This article summarizes the current thinking about the analysis of residential mortgages and explains how that emphasis has evolved through time. The analytic process acljusts to new products and patterns that emerge in the marketplace, but our goal is to analyze these developments within a consistent analytic framework. Monitoring efforts have shown that mortgage pools rated by Moody's have performed, on average, in line with our expectations. Some mortgage loans have proven to be riskier and more volatile than others, and some have outperformed initial expectations. Our rating experi- ence has sharpened our ability to discriminate between loan pools that are likely to perform poorly and those likely to perform very well. MARKET OVERVIEW AND OUTLOOK New Collateral Demands a Dynamic Approach Change has redrawn the face of the MBS market. A mortgage refinancing boom, spurred by the relatively low interest rates of 1993 and early 1994, was followed by a sharp drop in origi- nation volume. This decline raised competitive pressures which, in turn, caused originators to Moodys Investors Service Global Credit Research Confidential Treatment Requested by Moody's Investors Service CONFIDENTIAL & PROPRIETARY November 8, 1996 MIS-OCIE-RMBS-0028807 MOODYS-FCIC-0013453
Transcript of Moody's Approach to Rating Residential Mortgage Pass ... · Moody's Approach to Rating Residential...

STRUCTURED FINANCE Special Report
Moody's Approach to Rating Residential Mortgage Pass-Through Securities
CONTACTS:
Jay A. Siegel Senior Analyst (212) 553-4927
Catherine E. Needham Managing Director (212) 553-7920
Linda A. Stesney Managing Director (212) 553-3691
Alicia J. Furman Investor Relations (212) 553-7941
CONTRIBUTORS:
Jerome S. Fons Economist (212) 553-4131
James Schmidbauer Vice President (212) 553-7938
CONTENTS
Summary: A Refined Approach for a Different Market
Market Overview and Outlook
Key Refinements to the Rating Approach
The Rating Process Remains the Same
Evaluating Credit Risk in Residential Mortgages
Credit Support Calculations
The Role of Performance Monitoring
A New Model as a Tool in the Rating Process
SUMMARY: A REFINED APPROACH FOR A DIFFERENT MARKET Since 1987, Moody's has rated over $470 billion of nonconforming one-to four-family residen-tial mortgage backed securities (MBS), which represent interests in more than 1,600 pools of mortgages. The composition and performance of these pools has changed dramatically since the market's inception, and new information and trends continue to emerge. Monitoring the performance of these pools presents the opportunity to re-evaluate our rating process. This experience is the foundation for now updating the approach to rating MBS Refinements to the rating process are especially critical as the private label market evolves away from its traditional product types.
This article summarizes the current thinking about the analysis of residential mortgages and explains how that emphasis has evolved through time. The analytic process acljusts to new products and patterns that emerge in the marketplace, but our goal is to analyze these developments within a consistent analytic framework.
Monitoring efforts have shown that mortgage pools rated by Moody's have performed, on average, in line with our expectations. Some mortgage loans have proven to be riskier and more volatile than others, and some have outperformed initial expectations. Our rating experience has sharpened our ability to discriminate between loan pools that are likely to perform poorly and those likely to perform very well.
MARKET OVERVIEW AND OUTLOOK New Collateral Demands a Dynamic Approach Change has redrawn the face of the MBS market. A mortgage refinancing boom, spurred by the relatively low interest rates of 1993 and early 1994, was followed by a sharp drop in origination volume. This decline raised competitive pressures which, in turn, caused originators to
Moodys Investors Service Global Credit Research
Confidential Treatment Requested by Moody's Investors Service
CONFIDENTIAL & PROPRIETARY
November 8, 1996
MIS-OCIE-RMBS-0028807
MOODYS-FCIC-0013453

funnel riskier collateral into the secondary market. Originators have expanded their product base to include high loan-to-value loans, "B & C" credits, and niche products, such as loans with no debt service-to-income limitations. Another tier of issuers have demonstrated excellent collateral performance (with steady or even growing market shares) through strong collection efforts and superior underwriting processes.
The collateral underlying residential MBS rated by Moody's consists almost exclusively of "nonconforming" loans - that is, the mortgages do not meet the purchasing criteria of the large government-sponsored mortgage enterprises (GSEs), particularly the Federal Home Loan Mortgage Corporation (Freddie Mac) and the Federal National Mortgage Association (Fannie Mae). Generally, the GSEs will not purchase loans exceeding a given dollar amount (currently $207,000), loans made to borrowers with lower credit quality or troubled credit histories, or loans underwritten with reduced documentation. Because of their non-government affiliation, these MBS are referred to as "private label" securities.
The private label market provides a steady funding source for the nation's housing needs. Before this market developed, access to funding for certain home borrowers varied dramatically across the country. High cost sources, such as banks, thrifts, and specialized finance companies, dominated the landscape. Securitization of private label mortgages has helped reduce the borrowing costs of nonconforming home ownership to levels found in the government-subsidized lending market.
The Role of Ratings Remains the Same Investors look to the ratings process to instill discipline in the face of market pressure. In grading the relative credit quality of structured finance securities, we employ the same symbol system developed by John Moody in 1909. Moody's structured finance ratings address both frequency of default on the securities as well as severity of loss in the event of default. These two aspects of default playa particularly important role among structured securities and between structured and unsecured debts. The overall expected loss for a security of any rating should be the same, whether applied to an unsecured corporate instrument a senior class of an MBS transaction (where any losses would be of small magnitude), or a subordinate tranche.
The recent tilt in the mix of loan pools toward lower credit quality borrowers and the mounting evidence linking a borrower's credit profile to subsequent loan performance has caused us to find better measures of borrower credit quality and incorporate these into our analysis. We now give just as much weight to borrower quality measures as we do to the loan-to-value ratio. Also, we have raised the importance of correctly classifying orig-
Table 1 Comparison of Rating Approaches, 1990 vs. 1996
Expanding evidence concerning the performance of residential mortgages allows us to weigh different criteria when analyzing securities.
Revised Approach Original Approach* Ratings Independent! Targeted Toward Aa2 Rating Estimates Loss Distribution Directlv Considers Borrower Credit Profile Assumed "AU Qualitv Borrower Increases Emphasis on OriainatorlServicer Ad-Hoc Adiustment Recoanizes Reaional Economic Linkaaes Ad-Hoc Adiustment Formalizes Reaional Concentrations Adiusted for Zip Code Concentration Risk Sources Systematically Isolated Correlation Assumptions
, As presented in "Moody's Approach To Rating Residential Mortgage Pass-Throughs," Moody's Structured Finance, Research & Commentary, 1990.
following:
inators in terms of underwriting practices and historical loan performance.
KEY REFINEMENTS TO THE RATING APPROACH Over the past few years, a continuing stream of special reports has kept the market up to date on refinements to the MBS rating approach. This report presents an accumulation of these modifications, together with analytical revisions now considered in the rating committee process that had not yet been formalized and published. Table 1 summarizes the key refinements of the updated approach.
Those refinements include the
The revised approach is engineered from the ground up to identify the credit risk of a loan pool, regardless of the rating desired on a tranched security. For each pool, we transform loan-level default frequency and severity estimates into a pool-wide loss distribution characterized by a mean and standard deviation. The loss distribution pairs each possible lifetime loss outcome (expressed as a percentage of original pool balance) with the probability of observing that outcome. The estimated loss distribution provides a basis for determining the credit support necessary to achieve a given rating for a tranched security.
Our original published approach described how we modified a benchmark loan pool's credit support level, consistent with a Aa2 rating, based on the rated pool's characteristics. These adjustments to credit
2- Moodys Moody's Approach to Rating Residential Mortgage Pass-Through Securities
Confidential Treatment Requested by Moody's Investors Service
CONFIDENTIAL & PROPRIETARY
MIS-OCIE-RMBS-0028808
MOODYS-FCIC-0013454

support were called "factors," Certain factors remain in the revised approach, but they influence credit support levels only to the extent that they modify the estimated loss distribution through their impact on default frequency, severity or on loss volatility.
The revised approach incorporates borrower-specific risk measures, allowing for a wide range of borrower quality, Changes in borrower quality estimates can have a substantial impact on the credit support at all rating categories, In today's parlance, the original approach assumed that each loan was made to an "A" quality borrower, With the development of the market for "B & C" quality borrowers, however, we have been incorporating borrower classifications into our analysis, We have chosen to evaluate classifications utilized by market participants on a case-by-case basis rather than defining such borrower classifications, Moody's performance monitoring data demonstrates that "8 & e" quality loan pools have experienced loss and delinquency rates up to ten times higher than their "A" quality counterparts Indeed, we have seen exceptional performance in "A" quality loan pools from strong originators, The revision brings state and regional economic outlooks (as they pertain to housing markets) into the picture in a systematic fashion and addresses the diversification benefits achievable through certain combinations of property locations, Previously, we made ad-hoc adjustments for regional economic dependencies and concentrations, The revised approach better isolates each risk source, The original approach relied on correlation assumptions about the relationship between various risk factors and loan characteristics, The refined analysis reduces the likelihood of double counting for the same risk in the modeling process, For example, one may potentially overestimate the risk associated with ARM loans by attributing the higher losses historically experienced on this product solely to the product itself without also taking into account the average credit quality of borrowers participating in some of the earlier ARM programs,
THE RATING PROCESS REMAINS THE SAME The rating process begins with a review of an originator and servicer's operations and proceeds with an analysis of the characteristics of the loans in the pool, The analyst responsible for the transaction will work with a rating committee to arrive at enhancement levels consistent with the requested rating, Often, several iterations are needed as the issuer adjusts support levels and tranche sizes to achieve what it perceives to be the most efficient overall structure, Changes in the timing or priority of promised cash flows may be considered as well, Legal documents describing the rights of investors, structures, and cash flows are examined to insure that the transaction works as intended,
Once a rating has been assigned, Moody's monitors the status of each rated tranche and the performance of the underlying loan pool on a monthly basis, Moody's may adjust the rating of any certificate if subsequent events, such as a sharp increase in collateral losses, dictate a change,
How Data Sources Are Used We draw on historical data from many sources, beyond rated loan pools, to determine the relationship between loan characteristics and credit risk, Key data sources are the Mortgage Bankers Association; Fannie Mae and Freddie Mac; private mortgage insurers; and a database of rated loan pools tracked by Moody's, Default frequency and loss severity data were collected at the individual loan level as well as at the pool level, Historical home price data is supplied by Case Shiller Weiss, Inc, and Freddie Mac, Time-to-foreclosure estimates and economic indicators also playa major role in the analysis,
EVALUATING CREDIT RISK IN RESIDENTIAL MORTGAGES Translating Risk Elements to Expected Loss Outcomes In this section we discuss the various credit risk components of residential mortgage pass-through securities, We think of each loan characteristic as having an impact on lifetime loss distribution for a pool of loans, which is summarized by a loss outcome paired with the likelihood of observing that outcome,l Figure 7 plots the distribution of Moody's projected lifetime losses for all residential mortgage pools rated between 1987 and 1992, We selected pools closed before 1993 in order to best capture and estimate overall lifetime performance, The vertical axis, labeled frequency, is the number of pools in a particular loss bin, divided by the total number of rated pools,
1 Lifetime losses refer to the accumulated lifetime chargeoffs for a pool of loans, expressed as a fraction of the original pool balance, Before a residential home loan is charged off, it typically moves from delinquency status to foreclosure and then on to real estate owned (REO),
Moody's Approach to Rating Residential Mortgage Pass-Through Securities Moodys. 3
Confidential Treatment Requested MIS-OCIE-RMBS-0028809 by Moody's Investors Service
CONFIDENTIAL & PROPRIETARY MOODYS-FCIC-0013455
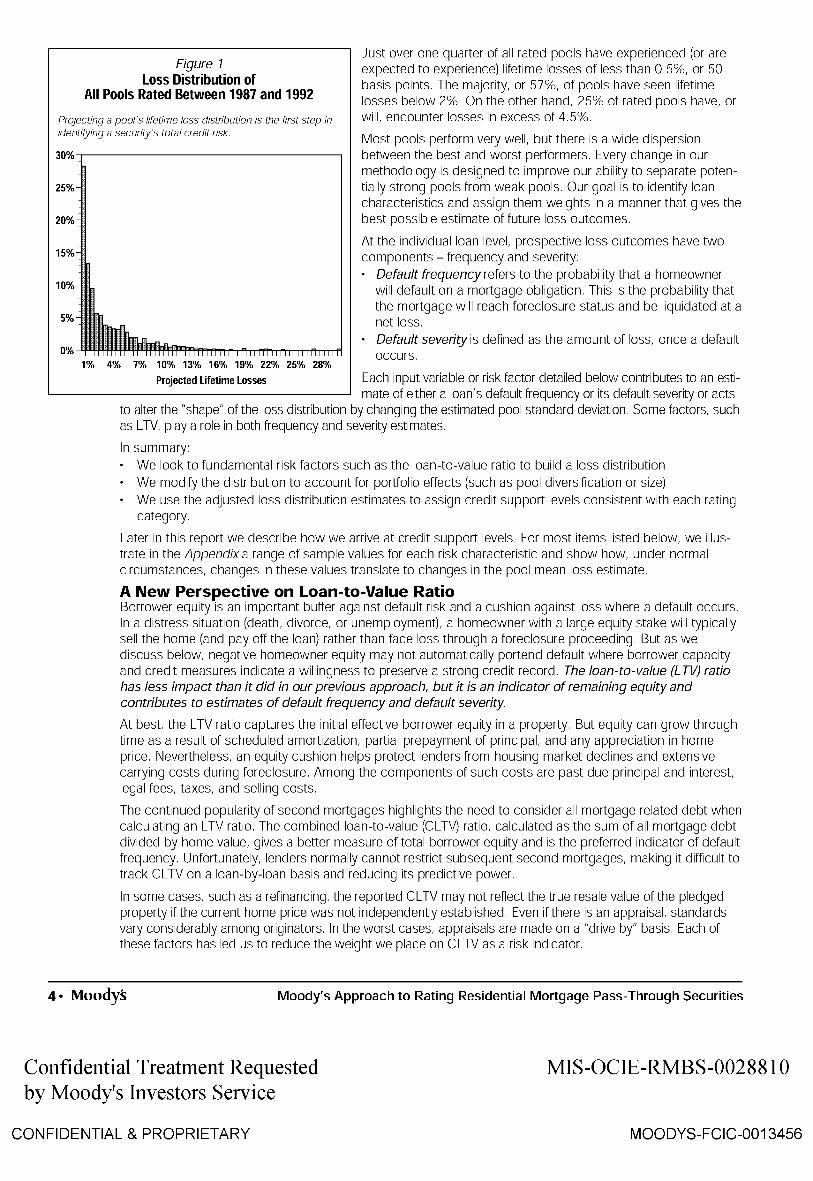
Figure 1 Loss Distribution of
All Pools Rated Between 1987 and 1992
Projecting a pool's lifetime loss distribution is the first step in identifying a security's total credit risk.
Just over one quarter of all rated pools have experienced (or are expected to experience) lifetime losses of less than 0.5%, or 50 basis points. The majority, or 57%, of pools have seen lifetime losses below 2%. On the other hand, 25% of rated pools have, or will, encounter losses in excess of 4.5%.
Most pools perform very well, but there is a wide dispersion between the best and worst performers. Every change in our methodology is designed to improve our ability to separate potentially strong pools from weak pools. Our goal is to identify loan characteristics and assign them weights in a manner that gives the best possible estimate of future loss outcomes.
5%
1% 4% 7% 10% 13% 16% 19% 22% 25% 28%
At the individual loan level, prospective loss outcomes have two components - frequency and severity:
Default frequency refers to the probability that a homeowner will default on a mortgage obligation. This is the probability that the mortgage will reach foreclosure status and be liquidated at a net loss. Default severity is defined as the amount of loss, once a default occurs.
Projected lifetime losses Each input variable or risk factor detailed below contributes to an esti-mate of either a loan's default frequency or its default severity or acts
to alter the "shape" of the loss distribution by changing the estimated pool standard deviation. Some factors, such as lTV, playa role in both frequency and severity estimates.
In summary: We look to fundamental risk factors such as the loan-to-value ratio to build a loss distribution We modify the distribution to account for portfolio effects (such as pool diversification or size) We use the adjusted loss distribution estimates to assign credit support levels consistent with each rating category.
later in this report we describe how we arrive at credit support levels. For most items listed below, we illustrate in the Appendix a range of sample values for each risk characteristic and show how, under normal circumstances, changes in these values translate to changes in the pool mean loss estimate.
A New Perspective on Loan-to-Value Ratio Borrower equity is an important buffer against default risk and a cushion against loss where a default occurs. In a distress situation (death, divorce, or unemployment), a homeowner with a large equity stake will typically sell the home (and payoff the loan) rather than face loss through a foreclosure proceeding. But as we discuss below, negative homeowner equity may not automatically portend default where borrower capacity and credit measures indicate a willingness to preserve a strong credit record. The loan-to-value (L TV) ratio has less impact than it did in our previous approach, but it is an indicator of remaining equity and contributes to estimates of default frequency and default severity.
At best the lTV ratio captures the initial effective borrower equity in a property. But equity can grow through time as a result of scheduled amortization, partial prepayment of principal, and any appreciation in home price. Nevertheless, an equity cushion helps protect lenders from housing market declines and extensive carrying costs during foreclosure. Among the components of such costs are past due principal and interest legal fees, taxes, and selling costs.
The continued popularity of second mortgages highlights the need to consider all mortgage related debt when calculating an lTV ratio. The combined loan-to-value (Cl TV) ratio, calculated as the sum of all mortgage debt divided by home value, gives a better measure of total borrower equity and is the preferred indicator of default frequency. Unfortunately, lenders normally cannot restrict subsequent second mortgages, making it difficult to track Cl TV on a loan-by-Ioan basis and reducing its predictive power.
In some cases, such as a refinancing, the reported Cl TV may not reflect the true resale value of the pledged property if the current home price was not independently established. Even if there is an appraisal, standards vary considerably among originators. In the worst cases, appraisals are made on a "drive by" basis. Each of these factors has led us to reduce the weight we place on Cl TV as a risk indicator.
4- Moodys Moody's Approach to Rating Residential Mortgage Pass-Through Securities
Confidential Treatment Requested by Moody's Investors Service
CONFIDENTIAL & PROPRIETARY
MIS-OCIE-RMBS-0028810
MOODYS-FCIC-0013456

Our view of the role of housing plays a part in our decision to downplay the importance of LTV as a risk indicator. An LTV-dominated model implicitly treats a home as a speculative asset. The borrower has an "option" to walk away from the home if its value falls below a "strike price," represented by the balance of the mortgage loan.
In our revised approach, we view a home as providing a "housing service" to the homeowner and his/her family. The cost of housing service depends on many variables, including the opportunity cost of renting. As such, we now place less reliance on LTV as the primary determinant of credit risk.
Borrower Risk Indicators Move to Center Stage As originations shift away from GSE borrower quality standards, borrower character and capacity to pay have risen to a central role in our rating approach. These aspects of borrower quality are typically demonstrated by consistent performance on all credit obligations. While there are many ways to assess a borrower's credit history, underwriters increasingly rely on automated approaches, usually a credit scoring system. We make distinctions between mortgage scoring and credit scoring systems:
Mortgage scoring systems are derived specifically for mortgage lending applications and include many variables beyond those found on a credit report. Many mortgage insurers and some mortgage originators have developed such mortgage scoring systems. Credit scoring systems are typically developed with an eye toward revolving retail-type credit risk rather than the larger and long term commitments associated with home mortgage lending. Nevertheless, we believe that even basic credit scores may be better predictors of mortgage defaults than past methods. 2
We tend to associate borrower risk with default frequency rather than severity of default. To incorporate a mortgage or credit score into our analysis, we estimate the relationship between the default frequency and the score values for a particular scoring system. To do this, we submit a blind pool of loans (with default outcomes known only by us) to the score provider and have the loans scored and then compare those scores with the default outcomes. In addition to estimating the relationship in the scoring system, it allows us to estimate the reliability of that relationship.
The capacity to pay is often measured by the borrower's debt-to-income ratio (OTI). The total debt-toincome ratio is a coverage ratio and is defined as monthly debt service costs (housing related, including insurance and taxes, as well as other indebtedness) divided by gross monthly income. Lower OTI values are meant to indicate a stronger cushion against unforeseen fluctuations in borrower income or outlays. But all coverage measures suffer in that they reflect the borrower's status at a single point in time and may not be predictive of future borrowing activity or income levels.
Many variations exist in the computation and reporting of a total debt-to-income ratio (such as the decision to include short-term debts, decisions regarding revolving debt and determination of mortgage debt service payments for teaser-rate ARMs). Part of an analyst'sjob is to understand the originator's computation practices and adjust reported ratios where appropriate.
Many lenders classify borrowers according to a letter-designated underwriting matrix. These risk gradations, typically based on a borrower's credit history, may also be indicative of borrower risk. Moody's assesses the rigor and predictability of risk grades through on-site visits and careful monitoring of performance data for each originator. Factors considered by originators in categorizing borrowers include the frequency, duration, and time since any mortgage delinquencies, performance on consumer credit loans, length of employment and income history. Post-mortgage debt to income (OTI) is also important. Past credit judgments and bankruptcies may be evaluated and used to further stratify the lowest quality borrowers.
Estimates of borrower risk can vary dramatically across individuals and, as mentioned above, borrower quality may be a more significant risk indicator than borrower equity. A "0" borrower with a 70 LTV loan poses a greater risk of default than an "A" borrower with an 85 LTV loan - notwithstanding the evidence that a properly maintained property with a 70 LTV loan will maintain some net equity, even in an economic downturn, and thus be worthwhile to sell rather than suffer foreclosure.
Originator Practices and Loan Programs Are Captured in the Revised Approach The predictive power of borrower quality measures and LTV depends in part on the accuracy of the submitted information. Therefore, it is important to examine the quality of originator practices, particularly efforts to verify data through appraisal, credit checks, and other means. One way to assess the quality of an originator's practices is to monitor the past performance of its loans. Indeed, the high variability in loan performance across originators cannot be explained solely by reported differences in underlying loan characteristics.
2 See "A Guide to Credit Scoring of Mortgage Loans," Moody's Structured Finance, May 23, 1996, for an in-depth look at the uses and limitations of scoring technology.
Moody's Approach to Rating Residential Mortgage Pass-Through Securities Moodys. 5
Confidential Treatment Requested MIS-OCIE-RMBS-0028811 by Moody's Investors Service
CONFIDENTIAL & PROPRIETARY MOODYS-FCIC-0013457

In recent years, there has been a decline in the average quality of mortgage loans being securitized in the private label market coupled with a decrease in homogeneity of borrower quality and product type. Our experience suggests that differences in originator practices and loan programs help explain this trend. We now summarize our view of each originator through a factor applied to the expected loss estimate. Among the most important of the model inputs, this scale factor is a shorthand way of indicating our view as to the overall quality of underwriting, origination, and servicing practices.
Moody's considers numerous aspects when determining the quality and performance of the originator, including:
Past performance of the originator's loans Underwriting guidelines for the mortgage loans and adherence to them Marketing of loans Credit checks made on borrowers Appraisal standards Quality and completeness of loan documentation Experience in origination of mortgages Collection practices Loan liquidation procedures
Amortization Schedule and Loan Seasoning A loan's interest rate and term determine the scheduled pace of principal retirement and borrower equity accumulation. The interest component of a fully amortizing loan is extremely high in the early years of loan life, which means that very little principal is initially retired. With seasoning, principal retirement increases substantially.
The shorter the loan maturity, the faster the rate of amortization. For example, a 10% mortgage with a 15-year term pays down nearly 5.5 times as much principal in the first five years as does a 10% 30-year mortgage. Moreover, the lower the coupon rate, the faster the rate of amortization. A 30-year mortgage with a 6% coupon pays down twice as much principal in the first five years as does a 10% coupon 30-year mortgage. The faster accumulation of equity means that the incentive to avoid default is increased, and any recovery upon foreclosure would be relatively higher.
In the absence of home value depreciation, seasoned loans will have lower effective L TVs because of scheduled amortization. Furthermore, clear patterns have been established linking default frequency to the age of a residential mortgage loan. Exceptions exist but defaults tend to be concentrated between years three and eight. Because of the cushion effect from the down payment and the borrower's satisfaction of underwriting criteria at the time of loan origination, homeowners typically will avoid default in the first few years after obtaining a home loan. Ensuing changes in the financial status of the borrower, however, may raise the risk of default in years three
Figure 2 lifetime Default Curve
30-Year Mortgage
through eight. But in later years, home price appreciation (along with scheduled amortization) may increase the equity cushion enough to prevent such changes from leading to a default.
The lifetime default curve for each mortgage term varies only slightly across different borrowers, product types, or originators.
We take into consideration housing market trends for seasoned loans in an effort to adjust for any home price depreciation that might have reduced borrower equity and increased default risk. On the other hand, a stable payment history through a depreciating market indicates a borrower's willingness to payoff creditors and may offset the risks raised by house price depreciation.
14%.---------------------------------~
12%
10%
8%
6%
4%
2%
Before any adjustments are made for home price changes, Moody's employs a term-specific lifetime default curve to capture seasoning effects upon both "core" default frequency and severity estimates (see Figure 2). The lifetime default curve, constructed from many data sources, is a schedule showing the percent of total defaults expected to be observed in each period of an individual loan's life. We have found that the lifetime default curve for each term varies only slightly across different program quality measures such as "A" or "B & C," product types such as ARMs versus fixed rate, and across originators.
2 4 6 8 10 12 14 16 18 20 22 24 26 28 30 We combine a core, or unadjusted, default rate, a default timing Years Since Origination curve, and a prepayment speed assumption into an estimate of
6· Moodys Moody's Approach to Rating Residential Mortgage Pass-Through Securities
Confidential Treatment Requested by Moody's Investors Service
CONFIDENTIAL & PROPRIETARY
MIS-OCIE-RMBS-0028812
MOODYS-FCIC-0013458
default frequency and default severity at every point over the remaining term of a loan. These assumptions provide a baseline expected loss estimate for each loan in a pool.
Prepayments A loan's coupon relative to prevailing interest rates is a key factor in a homeowner's decision to refinance debts and prepay a mortgage loan. The speed at which loans are prepaid has important implications for credit risk. For example, prepayment opportunities may be limited to borrowers with stronger credit records and larger equity cushions, concentrating high-risk loans within a collateral pool. Transactions with fixed amounts of credit support will be immunized against any such increase in relative loan risk, and in fact benefit to the extent that a borrower who might later default refinances out of the pool.
Time to Foreclose and Coupon Accrued interest, as a major component of carrying costs in the event of default, is a key component of the loss severity calculation. Securitization servicing standards give certificate holders uninterrupted cash flows even in the face of serious delinquencies, but liquidity advances are reimbursed from liquidation proceeds and thus contribute to ultimate loss levels.
The size of the servicer's claim for liquidity advances is related to the defaulted loan's coupon rate and the amount of time it takes to foreclose and dispose of the property and is limited to the amount deemed recoverable. The time to foreclose on a property varies substantially among states because of economic conditions, statutory notice requirements, limitations regarding the sale of foreclosed property, and rights of redemption. Based on the experience of several mortgage insurers, average time-to-foreclosures range from six months to more than two years, depending on the particular state. The longer it takes to foreclose on a defaulted loan, the greater the risk of an intervening drop in property value.
Disposition periods of real estate owned (REO) are more consistent from state to state, averaging six months. Several servicers have adopted strategies to reduce disposition times by encouraging short sales - an expedited process where a home is sold for less than the outstanding loan balance - and offering incentives for timely title transfers.
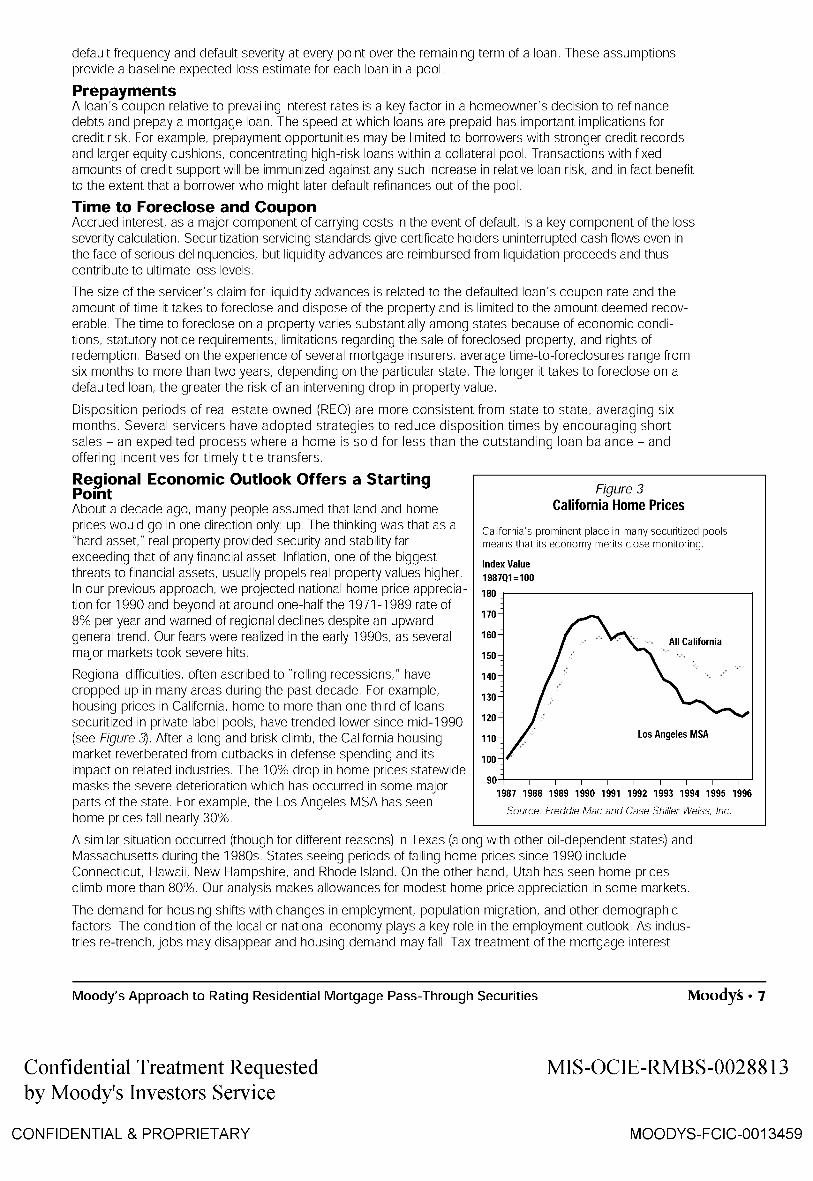
Regional Economic Outlook Offers a Starting POint About a decade ago, many people assumed that land and home
Figure 3 California Home Prices
prices would go in one direction only: up. The thinking was that as a California's prominent place in many securitized pools
"hard asset," real property provided security and stability far means that its economy merits close monitoring.
exceeding that of any financial asset. Inflation, one of the biggest Index Value
threats to financial assets, usually propels real property values higher. 1987Q1=100
In our previous approach, we projected national home price apprecia- 180-r--------------------,
tion for 1990 and beyond at around one-half the 1971-1989 rate of 8% per year and warned of regional declines despite an upward general trend. Our fears were realized in the early 1990s, as several major markets took severe hits.
Regional difficulties, often ascribed to "rolling recessions," have cropped up in many areas during the past decade. For example, housing prices in California, home to more than one third of loans
170
160
150
140
130
securitized in private label pools, have trended lower since mid-1990 120
110
100
All California
Los Angeles MSA (see Figure 3). After a long and brisk climb, the California housing market reverberated from cutbacks in defense spending and its impact on related industries. The 10% drop in home prices statewide masks the severe deterioration which has occurred in some major
90~-.--.-.--.--.-.--.-~-~
parts of the state. For example, the Los Angeles MSA has seen home prices fall nearly 30%.
1987 1988 1989 1990 1991 1992 1993 1994 1995 1996
Source: Freddie Mac and Case Shiller Weiss, Inc.
A similar situation occurred (though for different reasons) in Texas (along with other oil-dependent states) and Massachusetts during the 1980s. States seeing periods of falling home prices since 1990 include Connecticut, Hawaii, New Hampshire, and Rhode Island. On the other hand, Utah has seen home prices climb more than 80%. Our analysis makes allowances for modest home price appreciation in some markets.
The demand for housing shifts with changes in employment, population migration, and other demographic factors. The condition of the local or national economy plays a key role in the employment outlook. As industries re-trench, jobs may disappear and housing demand may fall. Tax treatment of the mortgage interest
Moody's Approach to Rating Residential Mortgage Pass-Through Securities Moodys. 7
Confidential Treatment Requested MIS-OCIE-RMBS-0028813 by Moody's Investors Service
CONFIDENTIAL & PROPRIETARY MOODYS-FCIC-0013459

deduction and capital gains may also influence housing demand. The supply of housing, though fixed in the short run, depends on the cost of items such as land, materials and labor used in the production of housing.
The nation's housing markets will continue to face challenges as: • The baby-boom generation ages and scales back its housing needs • Pressure on the incomes of home buying families prevent overspeculation in housing markets • Potential cuts in housing tax breaks and rising real estate taxes lower the benefits of home ownership
Housing Market Must Be Incorporated It is important to understand the economic prospects of a particular housing market and incorporate that outlook into the rating process. We employ economic models, designed to forecast future housing defaults based on current and past economic indicators, market intelligence, and collateral monitoring to confirm our assessment about the state of each market.
Our estimate of a particular area's economic prospects, updated at least annually, is represented by a factor that raises or lowers a loan's default frequency and severity estimate. All else equal, the stronger the outlook for a given housing market the lower the default frequency and severity for loans originated in that market.
Having said all of this, we recognize that economic forecasts are inherently subject to considerable error, particularly for obligations such as home mortgages with long-term default potential. Consequently, we have kept small the impact attributable to a particular state outlook.
Regional Diversification In most cases, the residential mortgage pools rated by Moody's are well diversified to the extent that they contain loans from different metropolitan statistical areas (MSAs), states, or regions of the country. This diversification provides protection for investors to the extent that housing markets across geographic regions rarely rise and fall in lock step. By combining a pool of loans from different areas of the country we minimize the uncertainty surrounding an estimated loss outcome. Conversely, a pool of loans with a concentration in a single MSA or state will have significant exposure to that area's economic shocks.
To capture the potential benefits of diversification, we have calculated a state-versus-state covariance matrix of residential mortgage defaults. This matrix, together with a vector of loan share (or weight) associated with each state, provides a measure of the relative economic diversity of a pool. That is, diversification (or lack thereon captures the uncertainty associated with a pool loss estimate but not the expected loss estimate itself.
We also measure concentration by grouping a pool's loans by metropolitan statistical areas (MSA) as well as by zip code. High or low concentrations by MSA or by zip code result in adjustments to the core standard deviation.
Property Type Property types can range from single-family detached homes to co-ops and condominiums. Compared to stand-alone structures, attached housing and multiunit properties tend to experience greater loss severity in the event of default. A higher severity results because these property types are less liquid than stand-alone homes and might have to remain on the market for a longer time. In a distress situation, this illiquidity could lead to higher carrying costs. Consequently, an adjustment is made for this added risk.
Comparability to Local Market A proxy for a property's liquidity is its price relative to other properties in the immediate vicinity. The higher its relative price, the more difficult it may be to sell (at a fair price) under stress situations. Illiquidity, in turn, negatively impacts default severity and, potentially, default frequency. We collect median home prices for each zip code and compare the selling (or appraised) price of a home to the median price within its own zip code. A high value for this ratio (greater than 300%) indicates a property that may face a more volatile demand and may possibly remain on the market for a longer time and incur higher maintenance costs.
Loan Type Remains an Important Factor As mentioned above, our traditional classifications by loan type (fixed-rate, ARM, etc.) appeared to overlap measures of borrower quality because of the types of programs historically offered. However, we recognize that adjustable-rate mortgage borrowers may face significantly higher monthly payments under certain interest rate scenarios. This exposure to payment shock could lead to a higher default frequency for ARM borrowers than has been observed, but to date, there have been only limited periods of interest rate increases since ARMs have emerged as a product type.
Moreover, some ARM borrowers are qualified at so-called teaser rates, reaching two or more percentage points below the stated fully indexed rate (the contract index rate plus a margin), exposing the borrower to payment shock in a stable or rising interest rate environment. Raising the ARM rate on a $100,000, 30-year mortgage
S· Moodys Moody's Approach to Rating Residential Mortgage Pass-Through Securities
Confidential Treatment Requested by Moody's Investors Service
CONFIDENTIAL & PROPRIETARY
MIS-OCIE-RMBS-0028814
MOODYS-FCIC-0013460

from 6% to 8% boosts the monthly payment from $599 to $734. For ARMs, we adjust upward the default frequency estimate in order to compensate for the added risk of payment shock.
Balloon Mortgage Instruments Balloon mortgages are loans that amortize as if they had a longer stated term, or pay no principal until maturity. Because they typically are used to qualify borrowers at lower monthly payments, balloon mortgages encounter higher loss rates than their fixed-rate counterparts. Repayment normally comes from a refinancing. And as long as financing is still available at maturity, there is little incremental risk between this loan type and a fully amortizing loan. But unforeseen circumstances, such as a job loss or a decline in property value, can arise which prevent refinancing criteria from being met.
Negatively Amortizing Loans Some ARM contracts intentionally limit scheduled payment increases (resulting from an increase in the index rate) in such a way as to cause the principal balance of the loan to grow for as long as the monthly payment is below the fully indexed amount. This capping feature can lead to an extension in the term of the loan. Absent other factors, the rising loan balance will increase LTV. The potential for negative amortization typically outweighs the benefits of reduced payment shock. Indeed, default rates for negatively amortizing loans have been among the highest of all rated loan types.
Loan Purpose Residential mortgage loans can be made to purchase a property, to refinance an existing mortgage, to release equity under an existing mortgage, to improve the home or for many other purposes. Because of differing historical performance patterns, we differentiate loans based upon their purpose. We have found that loans to purchase a home or to refinance at a lower rate have the lowest default frequency. Conversely, when equity is released through a cash-out refinance, default frequency rises. In these cases, the determination of property value is made by an appraiser. Borrowing against equity in a home may indicate that the borrower's actual income stream or other debt burdens are placing a greater strain on the borrower's overall finances than was anticipated at the time of original purchase of the home.
Owner Occupancy Improves Loan Performance We have found that properties purchased as the owner's primary residence have the lowest frequency of default. Intuitively, the primary residence provides a greater housing service to the owner than does a rental or second home and is therefore less likely to be subject to loss. Investor or rental properties rely on cash flows from parties who may not have the credit profile of the borrower, increasing the risk of default. Moreover, under financial stress, a borrower is likely to place retention and upkeep of the primary residence above that of other financial commitments, helping to limit the frequency of default and severity of loss in the event of default. We incorporate an occupancy status factor into the core default frequency calculation.
The Presence of Mortgage Insurance Many high LTV loans are made conditional upon some form of mortgage insurance. While not affecting the frequency of default mortgage insurance will decrease the severity of losses in the event of default. Mortgage insurance covers not only a portion of amounts payable under the mortgage but also all reasonable expenses to gain title to and sell the property (including legal and real estate expenses).
The amount of insurance coverage purchased frequently is higher for loans with small amounts of borrower equity. A recent trend is the emergence of deep mortgage insurance, which protects against property value declines of 35% for loans with L TVs between 85% and 95%. So long as foreclosure proceeds from the sale of the property securing such a loan equals or exceed 65% of the property's value when the loan was originated, any remaining shortfall would be covered by the mortgage insurer. Most often, this coverage would result in complete protection to the lender.
The benefit to investors of mortgage insurance is a function of the amount of coverage, the term of the insurance, and the credit quality of the mortgage insurer. We incorporate the coverage level directly into our calculation of loss severity in the event of default.
Pool Size Pool size plays an important role in shaping the pool loss distribution. While the mean, or expected loss for a pool, is not affected by the number of loans in the pool, a small number of loans will reduce the confidence level about that mean. In other words, the smaller the pool, the less certain we can be that the outcome will fall within a tight band around our expectations and boost the likelihood that it will fall far from our expectations simply because of chance. We scale the pool standard deviation in such a way as to give increasing benefit as the pool size increases.
Moody's Approach to Rating Residential Mortgage Pass-Through Securities Moodys. 9
Confidential Treatment Requested MIS-OCIE-RMBS-0028815 by Moody's Investors Service
CONFIDENTIAL & PROPRIETARY MOODYS-FCIC-0013461

CREDIT SUPPORT CALCULATIONS The rating of a pass-through certificate depends on a careful weighting of the characteristics of the loans in the submitted pool. The end result is a credit support level consistent with the desired rating category. We describe here the mechanics of credit support determination.
Lifetime Pool Losses Now the Focus The quantitative relationships linking loan characteristics to default frequency or severity have been derived from actual performance results and are expressed as functions, calculations, or multiplicative factors. This marks a departure from the original approach, where all risk acljustments took the form of multiplicative factors applied to a base credit support level.
The product of estimated frequency and severity gives an estimate of each loan's expected loss. The mean pool loss estimate is the total loss expected to occur over the life of the mortgage pool, expressed as a fraction of the original pool balance.
Because no economic model can completely describe all states of the world, we recognize that pool losses are best expressed as a distribution (such as that shown in Figure 7) rather than a simple point estimate, such as a mean. This is a richer way to express the inherent uncertainty surrounding an estimate of expected losses. Part of the uncertainty derives from the limited information provided by the loan underwriting process.
However, even with complete information, the dependence of loan performance on unpredictable exogenous factors - such as economic cycles and interest rate movements - creates systemic variance. One way to quantify the uncertainty surrounding a loss estimate is through the standard deviation of the loss distribution. A higher standard deviation for a loss distribution translates into a "fatter tail," and, all else equal, higher credit support at higher rating levels.
Determined by observing historical loss patterns, we estimate a core, or initial, pool loss standard deviation, given a calculated mean pool loss. The pool standard deviation is adjusted for portfolio effects, such as economic diversification, regional concentrations and the number of loans in the pool, to arrive at a final standard deviation for pool losses. Combined, the mean and standard deviation completely describe the overall distribution of pool losses when modeled as a lognormal distribution function. We have found that the lognormal distribution best approximates historical losses while being fairly easy to program.
Figure 4 Determining Credit Support
Changes in Yield
The estimated density function is the starting point for determining security ratings.
With the lifetime pool loss distribution in hand, we can determine the expected loss of any supported tranche. We do this by calculating the change in yield due to credit risk for each tranche, a technique that appeals to the way in which investors conceptualize and price for credit risk. 1
1
cs x -CS
Figure 4 shows the probability density function f(x) for a hypothetical pool of mortgage loans. Suppose a pool is assigned a credit support level, CS, expressed in dollar terms. Lifetime pool losses X (also in dollar terms) in excess of the credit support level is the difference XCS, which we could term "unsupported losses." The expected dollar loss for the supported tranche is the sum (across all possible loss outcomes) of the product of unsupported losses times the probability of those losses occurring.
L-________________________________ ~
By dividing this expected dollar loss by the size of the supported tranche, we have an estimate of lifetime losses, in percent terms. We also have a basis by which we can compare loss potential across security types.
The next step is to construct a par-valued phantom security with a coupon and term approximately equal to that of the rated certificate. By definition, the yield, or internal rate of return, of this phantom security is equal to the coupon rate of the pass-through security. We then apply losses to the promised cash flows of this phantom bond in percent terms equal to those calculated for the rated certificate. The maturity of the phantom bond will usually reflect an opinion about the timing of prepayments and losses for the rated security in question.
Holding its value at par, we calculate the internal rate of return for the bond with default losses. Because the cash flows can only be less than or equal to the default-free security, the bond's internal rate of return, or yield, will be less than or equal to the default-free yield. The difference is the basis point change in yield attributable to credit risk.
10· Moodys Moody's Approach to Rating Residential Mortgage Pass-Through Securities
Confidential Treatment Requested by Moody's Investors Service
CONFIDENTIAL & PROPRIETARY
MIS-OCIE-RMBS-0028816
MOODYS-FCIC-0013462
To achieve consistency with loss potential on all rated corporate bonds, we compiled a schedule of basis point changes paired with corresponding rating categories. Knowing the rating desired for the supported tranche, we can back into the credit support needed to achieve that rating. Typically, the support will depend on a subordinated or first-loss tranche, though many securitizations rely on a spread account or over -col later -alization. These support types are considered "internal" to the transaction.
Internally supported transactions may seek supplemental reliance from an "external" source of credit support. One type of externally supported transaction is a wrapped transaction in which a monoline insurance company whose financial strength rating is Aaa supplies a surety bond that ensures the full payment to investors of principal and interest upon default3 The default risk faced by investors in these transactions does not depend solely on mortgage assets. Instead, the pool's creditworthiness shifts to the guarantee issued by the monoline.
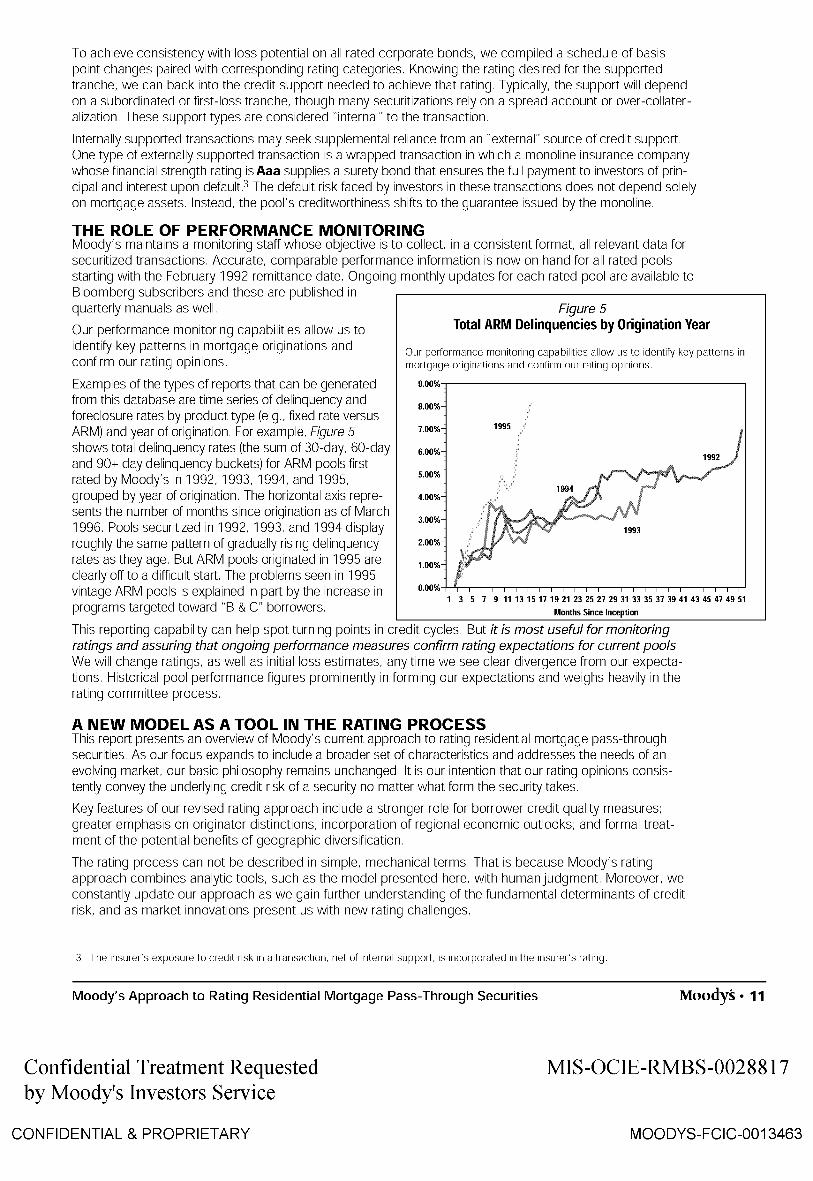
THE ROLE OF PERFORMANCE MONITORING Moody's maintains a monitoring staff whose objective is to collect in a consistent format all relevant data for securitized transactions. Accurate, comparable performance information is now on hand for all rated pools starting with the February 1992 remittance date. Ongoing monthly updates for each rated pool are available to Bloomberg subscribers and these are published in quarterly manuals as well.
Our performance monitoring capabilities allow us to identify key patterns in mortgage originations and confirm our rating opinions.
Examples of the types of reports that can be generated from this database are time series of delinquency and foreclosure rates by product type (e.g., fixed rate versus ARM) and year of origination. For example, Figure 5 shows total delinquency rates (the sum of 30-day, 60-day and 90+ day delinquency buckets) for ARM pools first rated by Moody's in 1992,1993,1994, and 1995, grouped by year of origination. The horizontal axis represents the number of months since origination as of March 1996. Pools securitized in 1992, 1993, and 1994 display roughly the same pattern of gradually rising delinquency rates as they age. But ARM pools originated in 1995 are clearly off to a difficult start. The problems seen in 1995 vintage ARM pools is explained in part by the increase in programs targeted toward "B & e" borrowers.
Figure 5 Total ARM Delinquencies by Origination Year
Our performance monitoring capabilities allow us to identify key patterns in mortgage originations and confirm our rating opinions.
9.00%
8.00%
7.00%
6.00%
5.00%
4.00%
3.00%
2.00%
1.00%
1995
1 3 5 7 9 11 13 15 17 19 21 23 25 27 29 31 33 35 37 39 41 43 45 47 49 51
Months Since Inception
This reporting capability can help spot turning points in credit cycles. But it is most useful for monitoring ratings and assuring that ongoing performance measures confirm rating expectations for current pools. We will change ratings, as well as initial loss estimates, any time we see clear divergence from our expectations. Historical pool performance figures prominently in forming our expectations and weighs heavily in the rating committee process.
A NEW MODEL AS A TOOL IN THE RATING PROCESS This report presents an overview of Moody's current approach to rating residential mortgage pass-through securities. As our focus expands to include a broader set of characteristics and addresses the needs of an evolving market our basic philosophy remains unchanged. It is our intention that our rating opinions consistently convey the underlying credit risk of a security no matter what form the security takes.
Key features of our revised rating approach include a stronger role for borrower credit quality measures; greater emphasis on originator distinctions; incorporation of regional economic outlooks; and formal treatment of the potential benefits of geographic diversification.
The rating process can not be described in simple, mechanical terms. That is because Moody's rating approach combines analytic tools, such as the model presented here, with human judgment. Moreover, we constantly update our approach as we gain further understanding of the fundamental determinants of credit risk, and as market innovations present us with new rating challenges.
3 The insurer's exposure to credit risk in a transaction, net of internal support. is incorporated in the insurer's rating.
Moody's Approach to Rating Residential Mortgage Pass-Through Securities Moodys. 11
Confidential Treatment Requested MIS-OCIE-RMBS-0028817 by Moody's Investors Service
CONFIDENTIAL & PROPRIETARY MOODYS-FCIC-0013463

Appendix Sensitivity Results
Loan and pool characteristics vary widely in their impact on our estimate of a pool's lifetime loss. For two representative pools, we show how the expected pool loss can change as we change each characteristic.
PooIA* Pool B** Case ................................................................. Mean.Po()I.L()ss(%) ............. %.c.h.ange ............. Mea.I1.P.()o.I.L()ss..(%) ............ %.c.h.a.nge. Baseline 0,82 2,96 LTV + 10 Points 1,39 +70% 4,76 +61% LTV -10 Points 0,52 -37% 1,95 -34% Coupon + 2 Points 0,96 +17% 3,3 + 11% Coupon - 2 Points 0,68 -17% 2,62 -11% Oterm & Rterm - 120 Months 0,62 -24% 2,25 -24% All Second Mortgages (w/junior LTV=10) 3.41 +316% 9,22 +211% All Single Family Homes 0,81 -1% 2,92 -1% All Condos 1,05 +28% 3,36 +14% All Owner Occupied 0,81 -1% 2,92 -1% All Rental Properties 1,21 +48% 4,37 +48% All Purchase Money Loans 0,81 -1% 2,52 -15% All Cash-Out Refi Loans 1,21 +48% 3,35 +13% All Fixed Rate Loans NA 2,56 -14% All ARMs (LiBOR) 0,94 +15% NA 5-Yrs Seasoning 0,56 -32% 2,03 -31% DTI = 25 0,58 -29% 1,66 -44% DTI = 50 1,31 +60% 3,73 +26% All "A" Quality Borrowers NA 1.44 -51% All "B" Quality Borrowers 1 ,08 +32% 3,5 +18% All "c" Quality Borrowers 1 ,63 +99% 4,39 +48%
Pool A consists of approximately 7 7 00 fixed-rate first mortgage loans to "A" borrowers as classified by a medium quality originator. The average debt-to-income ratio came in at 37%. The average combined L TV is 87 %, average original term is 359 months, average seasoning of 3 months.
Pool B consists of approximately 850 fixed-rate and adjustable loans of various quality grades as classified by a weak originator. The average debt-to-income ratio came in at 40%. The average combined L TV is 72%, average original term is 346 months with no seasoning.
Copyright 1996 by Moody's Investors Service, Inc, 99 Church Street, New York, New York 10007 All rights reserved ALL INFORMATION CONTAINED HEREIN IS COPYRIGHTED IN THE NAME OF MOODY'S INVESTORS SERVICE, INC ("MOODY'S"), AND NONE OF SUCH INFORMATION MAY BE COPIED OR OTHERWISE REPRODUCED, REPACKAGED, FURTHER TRANSMITTED, TRANSFERRED, DISSEMINATED, REDISTRIBUTED OR RESOLD, OR STORED FOR SUBSEQUENT USE FOR ANY SUCH PURPOSE, IN WHOLE OR IN PART, IN ANY FORM OR MANNER OR BY ANY MEANS WHATSOEVER, BY ANY PERSON WITHOUT MOODY'S PRIOR WRITTEN CONSENT All Information contained herein IS obtained by MOODY'S from sources believed by It to be accurate and reliable Because of the pOSSibility of human or mechanical error as well as other factors, however, such Information IS provided "as IS" without warranty of any kind and MOODY'S, In particular, makes no representation or warranty. express or Implied, as to the accuracy, timeliness, completeness, merchantability or fitness for any particular purpose of any such Information Under no circumstances shall MOODY'S have any liability to any person or entity for (a) any loss or damage In whole or In part caused by, resulting from, or relating to, any error (negligent or otherwise) or other circumstance or contingency within or outSide the control of MOODY'S or any of Its directors, officers, employees or agents In connection with the procurement. collection, compilation, analysIs, Interpretation, communication, publication or delivery of any such Information, or (b) any direct. Indirect. special, consequential, compensatory or Incidental damages whatsoever (Including without limitation, lost profits), even If MOODY'S IS advised In advance of the possibility of such damages, resulting from the use of or Inability to use, any such Information The credit ratings, If any, constituting part of the Information contained herein are, and must be construed solely as, statements of opinion and not statements of fact or recommendations to purchase, sell or hold any seCUrities NO WARRANTY, EXPRESS OR IMPLIED, AS TO THE ACCURACY, TIMELINESS, COMPLETENESS, MERCHANTABILITY OR FITNESS FOR ANY PARTICULAR PURPOSE OF ANY SUCH RATING OR OTHER OPINION OR INFORMATION IS GIVEN OR MADE BY MOODY'S IN ANY FORM OR MANNER WHATSOEVER Each rating or other opinion must be weighed solely as one factor In any Investment decIsion made by or on behalf of any user of the Information contained herein, and each such user must accordingly make ItS own study and evaluation of each security and of each Issuer and guarantor of, and each provider of credit support for, each security that It may consider purchasing, holding or * seiling Pursuant to Section 17(b) of the Securities Act of 1933, MOODY'S hereby discloses that most Issuers of debt seCUrities (Including corporate and municipal bonds, debentures, notes and commerCIi:: paper) and preferred stock rated by MOODY'S have, prior to assignment of any rating, agreed to pay to MOODY'S for appraisal and rating services rendered by It fees ranging from $1,000 to $350,00C
12- Moodys Moody's Approach to Rating Residential Mortgage Pass-Through Securities
Confidential Treatment Requested by Moody's Investors Service
CONFIDENTIAL & PROPRIETARY
MIS-OCIE-RMBS-0028818
MOODYS-FCIC-0013464