Montour Ash Area 3 2018 Annual ... - s3.amazonaws.comAA3/2018+Annual...Montour Ash Area 3 2018...
66
2018 GROUNDWATER MONITORING AND CORRECTIVE ACTION REPORT DISPOSAL AREA NO. 3 MONTOUR STEAM ELECTRIC STATION DERRY TOWNSHIP MONTOUR COUNTY, PENNSYLVANIA Prepared For: MONTOUR, LLC WASHINGTONVILLE, PENNSYLVANIA Prepared By: CIVIL & ENVIRONMENTAL CONSULTANTS, INC. PITTSBURGH, PENNSYLVANIA CEC Project 132-065.1203 JANUARY 31, 2019
Transcript of Montour Ash Area 3 2018 Annual ... - s3.amazonaws.comAA3/2018+Annual...Montour Ash Area 3 2018...

2018 GROUNDWATER MONITORING AND CORRECTIVE ACTION REPORT
DISPOSAL AREA NO. 3
MONTOUR STEAM ELECTRIC STATION DERRY TOWNSHIP
MONTOUR COUNTY, PENNSYLVANIA
Prepared For:
MONTOUR, LLC WASHINGTONVILLE, PENNSYLVANIA
Prepared By:
CIVIL & ENVIRONMENTAL CONSULTANTS, INC. PITTSBURGH, PENNSYLVANIA
CEC Project 132-065.1203
JANUARY 31, 2019

-i- 2018 GWMCA Report, A3 January 2019
TABLE OF CONTENTS
1.0 INTRODUCTION..............................................................................................................1
2.0 SITE OVERVIEW .............................................................................................................2 2.1 Background ............................................................................................................. 2 2.2 Geologic Setting...................................................................................................... 2 2.3 Hydrogeologic Setting ............................................................................................ 3
2.3.1 Conceptual Model ........................................................................................3 2.3.2 Hydrogeologic Characteristics .....................................................................4
3.0 EXISTING MONITORING NETWORK .......................................................................5
4.0 2017 SAMPLING SUMMARY .........................................................................................6 4.1 Statistical Evaluation .............................................................................................. 6 4.2 Final UPL Values .................................................................................................... 7 4.3 Final 2017 SSI Determination ................................................................................ 7
5.0 ALTERNATE SOURCE DEMONSTRATION ..............................................................9
6.0 2018 GROUNDWATER SAMPLING AND FINDINGS SUMMARY.......................10 6.1 Detection Monitoring Sampling Events................................................................ 10 6.2 March 2018 Analytical Results ............................................................................. 11 6.3 September 2018 Analytical Results ...................................................................... 11
7.0 RECORD KEEPING REQUIREMENTS .....................................................................12
8.0 REFERENCES .................................................................................................................15
FIGURES Figure 1 – Site Location Map – Area 3 Figure 2 – CCR Rule Groundwater Sampling Locations – Area 3
TABLES
Table 1 – 2018 Downgradient Groundwater Results Table 2 – 2018 Upgradient Groundwater Results
APPENDIX
Appendix A – Area 3 Alternate Source Demonstration Appendix B – Area 3 Trend Plots
-1- 2018 GWMCA Report, A3 January 2019
1.0 INTRODUCTION
The United States Environmental Protection Agency (USEPA) issued 40 C.F.R. § 257, Subpart D,
Disposal of Coal Combustion Residuals from Electric Utilities (CCR Rule) on April 17, 2015. The
CCR Rule regulates disposal of coal combustion residuals (CCR) in new and active landfills and
impoundments. Civil & Environmental Consultants, Inc. (CEC) has been engaged by Montour,
LLC to complete the 2018 Groundwater Monitoring and Corrective Action Report at Disposal
Area 3 (Site) of the Montour Steam Electric Station (Montour) as required by 40 C.F.R. §257.90(e)
of the CCR Rule. This document summarizes the monitoring activity in 2018, including sampling
events and any changes to the network. It is intended that this document will be placed in the
facility operating record as required by 40 C.F.R. §257.105(h)(1), as well as posted on the publicly
accessible website as required by 40 C.F.R. §257.107(h)(1).
-2- 2018 GWMCA Report, A3 January 2019
2.0 SITE OVERVIEW
2.1 BACKGROUND
Disposal Area No. 3 (Area 3), located south of the main generation station (Figure 1), is a residual
waste landfill constructed and operated under Residual Waste Permit #300987 issued by the
Pennsylvania Department of Environmental Protection. The landfill is used for the disposal of
plant-generated residual waste, including scrubber wastewater treatment plant sludge (sludge is a
mixture of calcium sulfate solids and precipitated heavy metals), fly ash, mill rejects, and various
sump sludges. The disposal area also receives resins, filter bags and construction and demolition
wastes. The existing disposal area was constructed beginning in September 1987 and completed
in March 1990.
Area 3 consists of a western half and an eastern half. Only the eastern half has been constructed to
date. It is unlikely that the western half will ever be constructed. The eastern half is constructed
with a geomembrane liner and leachate collection system. Leachate from the eastern half is drained
through a piping network above the liner that directs the leachate into a leachate collection basin
located southeast of Area 3. The leachate collection basin is also lined with a geomembrane liner
and covered with onsite low permeability silt-clay soils.
In addition to the monitoring requirements set forth by the CCR Rule, groundwater quality
continues to be monitored at Area 3 in accordance with the state residual waste permit. Monitoring
points associated with the permit include: underdrains, monitoring wells, and surface water
locations. Wells associated with the permit are sampled quarterly. Results are summarized in a
Form 14R quarterly report submitted to the state.
2.2 GEOLOGIC SETTING
The site is situated on the northern limb of a regional anticline. The shallowest bedrock formation
underlying Area 3 is the Devonian Age Marcellus Shale. The Marcellus Shale has an approximate
orientation of N45°W with a dip to the northeast of 5 to 8°. The competent shale bedrock is overlain

-3- 2018 GWMCA Report, A3 January 2019
by weathered bedrock that ranges in thickness from less than 1 foot to 10 feet. The weathered
bedrock is overlain by glacial till material consisting of silt, clay, and broken rock fragments.
2.3 HYDROGEOLOGIC SETTING
2.3.1 Conceptual Model
Topographically, the site lies within a regional basin with the highland ridges consisting of the
more resistant rock formations of an anticline. There is potential for an upward hydraulic gradient
in the general area of the site. The water table is within 10 feet of the ground surface.
The water-bearing zone directly below the site is unconfined. The overburden and the bedrock
zones are hydraulically well connected. Groundwater monitoring wells in the area typically have
screen intervals that intercept both the overburden material and the underlying bedrock.
A small tributary of Mud Creek separates the two halves of Area 3. This southeastward-flowing
tributary is redirected into two subsurface 48-inch diameter pipe conduits installed within Area 3.
The flow enters piping on the northwestern side of Area 3 and exits the piping at the southeastern
side of Area 3 (Figure 2).
The groundwater underlying Area 3 is shallow (less than 10 feet below the ground surface) and
occurs within bedrock or at the bedrock/overburden interface. Groundwater underdrains were
installed under Area 3, below the geomembrane liner, to drain the groundwater during seasonal
high levels and maintain the state requirement for an 8-foot separation between the liner and
groundwater. The groundwater underdrains are separate from the 48-inch diameter conduits,
however both systems discharge into same area, southeast of Area 3 (see Figure 2). The general
groundwater flow direction is to the south.

-4- 2018 GWMCA Report, A3 January 2019
2.3.2 Hydrogeologic Characteristics
Hydraulic gradients calculated from 2015 water levels range from 0.003 to 0.008, with an overall
average of 0.006. Hydraulic conductivity values for the site have been obtained from site specific
data collected as part of previous site evaluations. Hydraulic conductivities range between:
• 1.7xl0-6 cm/sec and 1.8xl0-8 cm/sec in soil,
• 2.2xl0-2 cm/sec to 5.0xl0-3 cm/sec in the upper weathered fractured shale,
• 3.0xl0-3 cm/sec to l.0xl0-4 cm/sec in fractured competent bedrock, and
• 1.7x10⁻⁶ cm/sec to 5.0xl0-7 cm/sec in competent shale with little to no fracturing.

-5- 2018 GWMCA Report, A3 January 2019
3.0 EXISTING MONITORING NETWORK
The groundwater monitoring system consists of six wells screened within the uppermost aquifer
that accurately represent both background groundwater quality and the quality of groundwater
passing the waste boundary of the CCR unit. The well locations are shown on Figure 2. A more
in-depth discussion of the monitoring network as well as the geologic and hydrologic setting is
provided in the Groundwater Monitoring System Certification (CEC, 2017(2)), as placed in the
operating record and posted to the Talen CCR Rule website. No additional wells were installed or
decommissioned in 2018. The table below summarizes all wells that are included within the CCR
Rule Groundwater Monitoring System.
CCR RULE GROUNDWATER MONITORING SYSTEM
Location Relative Location
Well Diameter (in.)
Bottom of Screen (ft-
bgs)
Screen Length (ft)
PZ3-31 Downgradient 2 17.7 9.5 MW-3-100 Downgradient 4 15 10 MW-3-101 Downgradient 4 15 10 MW-3-102 Downgradient 4 17 10 MW-3-103 Upgradient 4 15 10 MW-3-104 Upgradient 4 14 10
Based on existing groundwater contours, locations MW-3-103 and MW-3-104 will provide
upgradient water quality for groundwater flowing toward Area 3. The remaining wells, PZ3-31,
MW-3-100, MW-3-101, and MW-3-102, provide downgradient groundwater quality.

-6- 2018 GWMCA Report, A3 January 2019
4.0 2017 SAMPLING SUMMARY
The final four of the eight baseline sampling events were completed at Area 3 in 2017. The initial
detection monitoring sampling event then occurred in October 2017. The results from that
sampling event were provided in the 2017 Groundwater Monitoring and Corrective Action Report
(CEC, 2017(1)), however the determination of statistically significant increases (SSI) of
downgradient concentrations over background values was not finalized until January 15, 2018 and
therefore was not discussed in the 2017 report.
4.1 STATISTICAL EVALUATION
The baseline data was evaluated to determine the appropriate statistical method based on the data
statistical distribution. As was anticipated in the Detection Monitoring Statistical Methods
Certification (CEC, 2017(2)), Statistical Method 3 as described in §257.93(f) of the CCR Rule
was the final method chosen for Area 3. Method 3 is a tolerance or prediction interval procedure,
in which an interval for each constituent is established from the distribution of the baseline data,
and the level of each constituent in each compliance well during subsequent detection monitoring
events is compared to the upper tolerance limit (UTL) or upper prediction limit (UPL).
The background well data was first examined to determine if a straight comparison of background
to downgradient (interwell comparison) was appropriate. Preliminary evaluation of the
background data set indicated a lack of correlation between the water quality at the two background
locations (MW-3-100 and MW-3-101). In an attempt to further characterize regional background
water quality, regional background monitoring well MW-1-9 was included in the statistical
evaluation. The analysis of the combined background dataset (Area 3 and regional background
wells) utilized the USEPA-developed multi-variant evaluation technique, Fingerprint Analysis of
Leachate Contaminants (FALCON) (USEPA, 2014). FALCON uses fractional concentrations for
the Appendix III constituents to create a unique chemical fingerprint representative of water
quality at each location and then further create an average chemical fingerprint over time at each
location. The assessment showed a lack of correlation between the average fingerprints at the
background wells suggesting heterogeneity and supporting the use of an intrawell statistical

-7- 2018 GWMCA Report, A3 January 2019
approach to monitor for evidence of a release from Area 3. The FALCON evaluation of the three
background wells is described in more detail in the Alternate Source Demonstration; Disposal
Area 3 (CEC, 2018), in Appendix A.
4.2 FINAL UPL VALUES
UPL values were calculated for each parameter at each location based on the initial eight baseline
samplings events to establish baseline values. The final values are as follows:
CCR RULE APPENDIX III BASELINE VALUES
Parameter Units UPL Value PZ-3-31 MW-3-100 MW-3-101 MW-3-102 MW-3-103 MW-3-104
Boron, Total mg/L 0.100 0.525 0.075 0.184 0.123 0.038 Calcium, Total mg/L 171 293 124 235 176 38.7 Chloride mg/L 10.9 9.5 7.6 12.7 18.00 3.62 Fluoride mg/L 0.57 0.29 0.22 0.60 0.25 0.50 pH, laboratory S.U. 7.29 8.29 8.21 8.26 8.00 6.70 pH, field S.U. 7.79 7.23 7.10 7.39 6.99 6.20 Sulfate mg/L 438.4 682.0 227.7 457.0 145.8 199.0 Total Dissolved Solids mg/L 788 1290 436 1030 561 419
4.3 FINAL 2017 SSI DETERMINATION
SSIs were determined based upon comparison of the results from the initial Detection Monitoring
event (October 2017) to the UPL of the mean concentration detected in each well from the eight
rounds of baseline monitoring (intrawell analysis). Based upon the results from the first round of
Detection Monitoring, one or more SSIs were identified at the following locations: PZ-3-31 and
MW-3-100 as summarized below.

-8- 2018 GWMCA Report, A3 January 2019
SUMMARY OF OBSERVED SSIs AT AREA 3
OCTOBER 2017 DETECTION MONITORING EVENT
Appendix III Parameters
Monitoring Point Boron Calcium Chloride Fluoride pH Sulfate
Total Dissolved
Solids (TDS)
MW-3-100 X
MW-3-101
X
MW-3-102
PZ3-31
X – SSI Determined
The observed SSIs were suspected to be attributed to a source other than the Area 3 Landfill and
an Alternate Source Demonstration (CEC, 2018) was completed within 90 days of the SSI
determination in accordance with §257.94(e)(2).

-9- 2018 GWMCA Report, A3 January 2019
5.0 ALTERNATE SOURCE DEMONSTRATION
The Alternate Source Demonstration identified multiple lines of evidence that an alternate source
of CCR constituents resulted in a determination of SSIs in groundwater obtained from wells
downgradient of Area 3 including:
• Statistical evaluation anomalies,
• Lack of correlation attributable to mixing from a theoretical release of leachate and the
chemistry of downgradient wells,
• Seasonal variability of boron where concentrations rise above the UPL for MW-3-100 in
the fall months, but remain below the UPL for the remainder of the year.
• Laboratory issues due to variability in determination of LOQ values used for non-detects
for boron resulting in potential false positives.
The SSIs at Area 3 were determined to not be attributed to a release from the landfill and Area 3
remained in Detection Monitoring for 2018. See Alternate Source Demonstration; Disposal Area
3 (CEC, 2018), in Appendix A for more information.

-10- 2018 GWMCA Report, A3 January 2019
6.0 2018 GROUNDWATER SAMPLING AND FINDINGS SUMMARY
6.1 DETECTION MONITORING SAMPLING EVENTS
Semi-annual Detection Monitoring sampling events were performed between March 5 and 6, 2018
and September 14 and 20, 2018. All six locations were sampled and analyzed for Appendix III
parameters. Samples were collected per the Area 3 Groundwater Monitoring Program and
submitted to Hawk Mountain Laboratory, a National Environmental Laboratory Accreditation
Program (NELAP) accredited laboratory. The laboratory results were finalized on March 28, 2018
and October 9, 2018, respectively. Results for downgradient wells are provided in Table 1 and for
upgradient wells are provided in Table 2. The September sampling results at MW-3-102 for
calcium, sulfate, and total dissolved solids appeared abnormally high when compared to historical
concentrations. This is discussed further in Section 6.3, but MW-3-102 was resampled in
November 2018 to confirm the September sampling results.
A summary of the 2018 sampling events are listed below. No transition between CCR Rule
groundwater monitoring programs occurred in 2018.
2018 CCR RULE GROUNDWATER SAMPLING EVENTS
Location March 2018 Event
September 2018 Event
November 2018 Resample Event
Downgradient Well PZ3-31 3/6/2018 9/14/2018 None
MW-3-100 3/5/2018 9/20/2018 None MW-3-101 3/5/2018 9/20/2018 None MW-3-102 3/6/2018 9/14/2018 11/7/2018 Upgradient Wells MW-3-103 3/6/2018 9/18/2018 None MW-3-104 3/6/2018 9/17/2018 None

-11- 2018 GWMCA Report, A3 January 2019
6.2 MARCH 2018 ANALYTICAL RESULTS
A SSI evaluation was prepared based upon comparison of the results from the March 2018
Detection Monitoring event to the UPL of the mean concentration detected in each well from the
eight rounds of baseline monitoring. Based on the results, no SSIs were found. Sampling results
are provided in Tables 1 and 2.
6.3 SEPTEMBER 2018 ANALYTICAL RESULTS
A SSI evaluation was prepared based upon comparison of the results from the September 2018
Detection Monitoring event to the UPL of the mean concentration detected in each well from the
eight rounds of baseline monitoring. Based on the results, three SSIs were found at MW-3-102 for
calcium, sulfate, and total dissolved solids. These SSIs were believed to be an anomaly as the
concentrations were above historical levels. Trend plots are provided in Appendix B; the
concentrations for these constituents in MW-3-102 were over two times the historical values.
MW-3-102 was resampled in November 2018. Results from this sampling event were consistent
with historical concentrations and no SSIs were found. Therefore, the initial SSIs from the
September sampling event are not attributed to Area 3 and the CCR unit will remain in Detection
Monitoring. Sampling results are provided in Tables 1 and 2.

-12- 2018 GWMCA Report, A3 January 2019
7.0 PLANNED ACTIVITIES FOR 2019
This section discusses the groundwater monitoring and reporting activities anticipated at Area 3 in
2019.
January 2019: The 2018 Annual Groundwater Monitoring and Corrective Action Report will be
entered into the facility’s operating record.
March 2019: The 2018 Annual Groundwater Monitoring and Corrective Action Report will be
posted to the public internet site and a notification will be sent to the Pennsylvania Department of
Environmental Protection (PADEP).
March 2019: The first semi-annual groundwater monitoring event in 2019 will be conducted.
Detection Monitoring samples (i.e., Appendix III) will be collected during the event.
June 2019: Appendix III sample results collected in March 2019 will be evaluated for a
Statistically Significant Increase (SSI) over background.
September 2019: Amend Alternate Source Demonstration (ASD) certified by a Professional
Engineer if SSIs are detected in the March 2019 Sampling Event.
September 2019: The second semi-annual groundwater monitoring event in 2019 will be
conducted. Detection Monitoring samples (i.e., Appendix III) will be collected during the event
assuming no SSIs in the March 2019 or the ASD is negative/consistent with previous ASDs.
Assessment Monitoring samples (i.e., Appendix III and IV) will be collected if an alternative
source is not identified.
December 2019: Appendix III sample results collected in September 2019 will be evaluated for a
SSI over background. Note, if SSIs are detected in the September 2019 Sampling Event, an ASD
will be finalized by March 2020.

-13- 2018 GWMCA Report, A3 January 2019
December 2019: Preparation of the 2019 Annual Groundwater Monitoring and Corrective Action
Report will begin.

-14- 2018 GWMCA Report, A3 January 2019
8.0 RECORD KEEPING REQUIREMENTS
In accordance with §257.105(h) this document has been placed in Montour’s Operating Record.
This document will also be placed on the publicly accessible website, with a notification to be
provided to the Pennsylvania Department of Environmental Protection to comply with
§257.106(h) and §257.107(h) of the CCR Rule.

-15- 2018 GWMCA Report, A3 January 2019
9.0 REFERENCES
CEC, 2017(1). 2017 Groundwater Monitoring and Corrective Action Report, Disposal Area No.
3, Derry Township, Pennsylvania, Prepared for Talen Energy/Montour, LLC,
Washingtonville, Pennsylvania, Prepared by Civil & Environmental Consultants, Inc.,
Pittsburgh, Pennsylvania, CEC Project 132-065, January, 2017.
CEC, 2017(2). Groundwater Monitoring System Certification, Disposal Area No. 3, Derry
Township, Pennsylvania, Prepared for Talen Energy/Montour, LLC, Washingtonville,
Pennsylvania, Prepared by Civil & Environmental Consultants, Inc., Pittsburgh,
Pennsylvania, CEC Project 132-065, October, 2017.
CEC, 2017(3). Detection Monitoring Statistical Methods Certification, Disposal Area No. 3, Derry
Township, Pennsylvania, Prepared for Talen Energy/Montour, LLC, Washingtonville,
Pennsylvania, Prepared by Civil & Environmental Consultants, Inc., Pittsburgh,
Pennsylvania, CEC Project 132-065, October, 2017.
CEC, 2018. Alternate Source Demonstration, Disposal Area No. 3, Derry Township,
Pennsylvania, Prepared for Talen Energy/Montour, LLC, Washingtonville, Pennsylvania,
Prepared by Civil & Environmental Consultants, Inc., Pittsburgh, Pennsylvania, CEC
Project 132-065, April, 2018.
USEPA, 2014. Fingerprint Analysis of Contaminant Data: A Forensic Tool for Evaluating
Environmental Contamination, EPA/600/5-04/054

FIGURES

www.cecinc.com333 Baldwin Road - Pittsburgh, PA 15205-9072
412-429-2324 800-365-2324
DRAWN BY:DATE:
APPROVED BY:PROJECT NO:
FIGURE NO: 1
MONTOUR, LLCGROUNDWATER MONITORING ANDCORRECTIVE ACTION REPORTMONTOUR STEAM ELECTRIC STATIONWASHINGTONVILLE, PA
CBL1/4/2018 1 " = 4,000 '
SITE LOCATION MAP - AREA 3BJH HTW*
132-065.1203CHECKED BY:SCALE:
0 4,000 8,000SCALE IN FEET
REFERENCEUSGS TOPOGRAPHIC MAP/ ARCGIS MAP SERVICE: HTTP://GOTO.ARCGISONLINE.COM/MAPS/USA_TOPO_MAPS
* Hand signature on file
\\svr-pittsburgh\projects\2013\132-065\-GIS\Maps\Task_1203\Area_3\132065_FIG1_SITE_LOC.mxd 1/4/2018 4:17 PM (nhetrick)
SITE

!(
!(
!(
!(
!(
!(
DUAL 48" DIAMETER CONDUIT
AREA 3 - EAST
AREA 3 - WEST(NOT CONSTRUCTED)
UNNAMEDTRIBUTARY
PZ3-31
MW-3-104
MW-3-103
MW-3-102
MW-3-101
MW-3-100
www.cecinc.com333 Baldwin Road - Pittsburgh, PA 15205-9072
412-429-2324 800-365-2324
DRAWN BY:DATE:
APPROVED BY:PROJECT NO:
FIGURE NO: 2
MONTOUR, LLCGROUNDWATER MONITORING ANDCORRECTIVE ACTION REPORTMONTOUR STEAM ELECTRIC STATIONWASHINGTONVILLE, PA
NJH1/5/2018
CCR RULE GROUNDWATER SAMPLING LOCATIONS - AREA 3BJH
132-065.1203CHECKED BY:SCALE: 1 " = 300 '
LEGEND!( DOWNGRADIENT MONITORING POINT!( BACKGROUND MONITORING POINT
CREEKCONDUITAREA 3 BOUNDARY
REFERENCEGOOGLE EARTH PRO IMAGERYIMAGE DATE: 9/26/2014
0 300 600SCALE IN FEET
* Hand signature on file HTW*
\\svr-pittsburgh\projects\2013\132-065\-GIS\Maps\Task_1203\Area_3\132065_FIG2_MONITORING_LOCS_CCR.mxd 1/5/2018 11:35 AM (nhetrick)

TABLE 1
2018 DOWNGRADIENT GROUNDWATER RESULTS

Sample I.D.: PZ-3-31 PZ-3-31 MW-3-100 MW-3-100 MW-3-101 MW-3-101 MW-3-102 MW-3-102 MW-3-102*Parameter Date Collected: 3/6/2018 9/14/2018 3/5/2018 9/20/2018 3/5/2018 9/20/2018 3/6/2018 9/14/2018 11/7/2018Inorganics
Total MetalsBoron, Total mg/L 0.015 J < 0.00837 0.017 J 0.01 J 0.011 J 0.019 J 0.146 0.057 J 0.182Calcium, Total mg/L 94.8 94.6 162 165 77.5 112 135 312 136
Non-MetalsChloride mg/L 2.22 2.16 4.00 2.8 1.24 4.96 9.76 4.91 8.92Fluoride mg/L 0.290 J 0.26 0.170 J 0.23 0.200 0.24 0.510 0.3 0.51pH S.U. 4.50 H 4.85 H1 6.95 H 7.18 H1 6.72 H 6.95 H1 6.94 H 6.82 H1 7.39 H1Sulfate mg/L 278 237 227 228 138 149 167 603 209Total Dissolved Solids mg/L 460 447 586 611 293 414 522 1210 612
Field ParameterspH field reading (SM4500B) S.U. 4.16 4.45 6.29 6.54 6.01 6.54 7.06 6.74 7.06
Notes:Bolded values were detected at concentrations above laboratory reporting limits.-- Denotes parameter not run and/or sample not collectedH - Holding time for preparation or analysis exceeded; the recommend holding time for pH is 15 minutes in the field or as soon as possible for laboratory analysisJ - Analyte detected below the Quantitation Limit, the reported value is an estimate
DETECTION MONTIORING
TABLE 12018 FEDERAL CCR RULE DOWNGRADIENT RESULTS
ASH DISPOSAL LANDFILL AREA 3MONTOUR, LLC
WASHINGTONVILLE, PA

TABLE 2
2018 UPGRADIENT GROUNDWATER RESULTS

Sample I.D.: MW-3-103 MW-3-103 MW-3-104 MW-3-104Parameter Date Collected: 3/6/2018 9/18/2018 3/6/2018 9/17/2018Inorganics
Total MetalsBoron, Total mg/L 0.108 0.088 J 0.03 J 0.015 JCalcium, Total mg/L 120 135 16.1 25.3
Non-MetalsChloride mg/L 9.90 3.57 2.14 2.62Fluoride mg/L 0.170 J 0.19 J 0.180 J 0.17 JpH S.U. 6.71 H 6.96 H1 6.57 H 6.08 H1Sulfate mg/L 126 143 89.5 152Total Dissolved Solids mg/L 410 546 215 299
Field ParameterspH field reading (SM4500B) S.U. 5.78 6.95 5.48 5.85
Notes:Bolded values were detected at concentrations above laboratory reporting limits.-- Denotes parameter not run and/or sample not collectedH - Holding time for preparation or analysis exceeded; the recommend holding time for pH is 15 minutes in the field or as soon as possible for laboratory analysisJ - Analyte detected below the Quantitation Limit, the reported value is an estimate
DETECTION MONTIORING
TABLE 22018 FEDERAL CCR RULE UPGRADIENT RESULTS
ASH DISPOSAL LANDFILL AREA 3MONTOUR, LLC
WASHINGTONVILLE, PA

APPENDIX A
AREA 3 ALTERNATE SOURCE DEMONSTRATION

ALTERNATE SOURCE DEMONSTRATION DISPOSAL AREA 3
MONTOUR STEAM ELECTRIC STATION
DERRY TOWNSHIP MONTOUR COUNTY, PENNSYLVANIA
Prepared For: MONTOUR, LLC
WASHINGTONVILLE, PENNSYLVANIA
Prepared By: CIVIL & ENVIRONMENTAL CONSULTANTS, INC.
PITTSBURGH, PENNSYLVANIA
CEC Project 132-065.1202
APRIL 2018

-i- Area 3 ASD April 2018
TABLE OF CONTENTS
1.0 INTRODUCTION..............................................................................................................2
2.0 EXISTING CONDITIONS ...............................................................................................3 2.1 Site Conditions ........................................................................................................ 3 2.2 Monitoring Network ............................................................................................... 4
3.0 STATISTICALLY SIGNIFICANT INCREASE (SSI) DETERMINATION ..............5
4.0 LINES OF EVIDENCE .....................................................................................................6 4.1 Groundwater Constituent Analysis ......................................................................... 6 4.2 Seasonal Varibility .................................................................................................. 8 4.3 Laboratory Causes .................................................................................................. 9 4.4 Additional Considerations .................................................................................... 11
5.0 CONCLUSIONS ..............................................................................................................13
6.0 REFERENCES .................................................................................................................14
7.0 ALTERNATE SOURCE DEMONSTRATION CERTIFICATION ..........................15
FIGURES
Figure 1 – CCR Rule Groundwater Sampling Locations – Area 3 Figure 2 – CCR Rule Alternate Source Demonstration August 2017 Stiff Diagrams Figure 3 – Area 3 Piper Plot, CCR-Rule and Regional Monitoring Wells Averaged Over Past 9
Events, LD-3-1 Averaged Over Past 10 Years
APPENDIX Appendix A – FALCON Statistical Evaluation
Figure 1 – PZ-3-31 Analysis Figure 2 – MW-3-100 Analysis Figure 3 – MW-3-101 Analysis Figure 4 – MW-3-102 Analysis Figure 5 – MW-3-103 Analysis
Figure 6 – LD-3-1 Analysis Figure 7 – MW-3-104 Analysis Figure 8 – MW-1-9 Analysis Figure 9 – Fingerprint Summary

-2- Area 3 ASD April 2018
1.0 INTRODUCTION
The United States Environmental Protection Agency (USEPA) issued 40 C.F.R. § 257, Subpart D,
Disposal of Coal Combustion Residuals from Electric Utilities (CCR Rule; USEPA, 2015) on
April 17, 2015. The CCR Rule regulates disposal of coal combustion residuals (CCR) in new and
active landfills and impoundments. Civil & Environmental Consultants, Inc. (CEC) has been
engaged by Montour, LLC to complete the statistical analysis of CCR Rule, Detection Monitoring,
at Ash Landfill Disposal Area 3 (Area 3) of the Montour Steam Electric Station (Montour) as
required by the CCR Rule.
After statistical analysis of the initial Detection Monitoring sampling event performed in October
2017, a total of two Statistically Significant Increases (SSIs) for two of the Appendix III
constituents, were identified in two of the downgradient monitoring wells, on January 15, 2018.
Observed SSIs were suspected to be attributable to a source other than Area 3 based on a further
review of the data as compared to the landfill leachate data, the area wide data variability, and the
laboratory quality control information.
40 CFR § 257.94(e)(2) allows the owner or operator 90 days from the date of determination to
demonstrate that a source other than the CCR unit caused the SSI, or that the apparent SSI was
from a source other than the CCR unit, or resulted from errors in sampling, analysis, statistical
evaluation, or natural variation in groundwater quality. Pursuant to 40 CFR § 257.94(e)(2), the
following report is provided as a demonstration that the listed SSIs are due to alternate sources
including but not limited to regional groundwater heterogeneity, sampling and/or laboratory
causes, and seasonal variability. This report documents the findings of the Alternate Source
Demonstration (ASD) for Area 3.

-3- Area 3 ASD April 2018
2.0 EXISTING CONDITIONS
2.1 SITE CONDITIONS
Area 3 is located south of the main generation station and is a residual waste landfill constructed
and operated under Residual Waste Permit #300987 issued by the Pennsylvania Department of
Environmental Protection. The landfill is used for the disposal of plant-generated residual waste,
including scrubber wastewater treatment plant sludge (sludge is a mixture of calcium sulfate solids
and precipitated metals), fly ash, mill rejects, and various sump sludges. The disposal area also
receives resins, filter bags and construction and demolition wastes. The existing disposal area was
constructed beginning in September 1987 and completed in March 1990.
The shallowest bedrock formation underlying Area 3 is the Marcellus Shale. The competent shale
bedrock is overlain by weathered bedrock that ranges in thickness from less than 1 foot to 10 feet.
The weathered bedrock is overlain by glacial till material consisting of silt, clay, and broken rock
fragments.
Area 3 consists of a western half and an eastern half. Only the eastern half has been constructed to
date. It is unlikely that the western half will ever be constructed. The eastern half is constructed
with a geomembrane liner and leachate collection system. Leachate from the eastern half is drained
through a piping network above the liner that directs the leachate into a leachate collection basin
located southeast of Area 3. The leachate collection basin is also lined with a geomembrane liner
and covered with onsite low permeability silt-clay soils.
A small tributary of Mud Creek separates the two halves of Area 3. This southeastward-flowing
tributary is redirected into two subsurface 48-inch diameter pipe conduits installed within Area 3.
The flow enters piping on the northwestern side of Area 3 and exits the piping at the southeastern
side of Area 3 (Figure 1).
The groundwater underlying Area 3 is shallow (less than 10 feet below the ground surface) and
occurs within bedrock or at the bedrock/overburden interface. Groundwater underdrains were

-4- Area 3 ASD April 2018
installed under Area 3, below the geomembrane liner, to drain the groundwater during seasonal
high levels and maintain the state 8-feet separation requirement. The groundwater underdrains are
separate from the 48-inch diameter conduits, however both systems discharge into same area,
southeast of Area 3 (see Figure 1). The general groundwater flow direction is to the south.
2.2 MONITORING NETWORK
The CCR Rule groundwater monitoring system consists of six wells at appropriate locations and
depths to provide groundwater samples from the uppermost aquifer that accurately represent
background groundwater quality and the quality of groundwater passing the waste boundary of the
CCR unit. The monitoring network consists of one pre-existing well (PZ-3-31) and five new wells
installed in April 2016 to meet the requirements of the CCR Rule. The well locations are shown
on Figure 1. An in-depth discussion of the hydrogeology and geology can be found in the
Groundwater Monitoring System Certification for Area 3 (CEC, 2017), placed in the Montour
Operating Record in September 2017 and onto the publicly accessible internet site in October
2017.
CCR RULE GROUNDWATER MONITORING SYSTEM
Location Relative Location
Well Diameter
(in.)
Bottom of Screen (ft-
bgs)
Screen Length (ft.)
PZ-3-31 Downgradient 2 17.7 9.5 MW-3-100 Downgradient 4 15 10 MW-3-101 Downgradient 4 15 10 MW-3-102 Downgradient 4 17 10 MW-3-103 Upgradient 4 15 10 MW-3-104 Upgradient 4 14 10
Based on existing groundwater contours, monitoring wells MW-3-103 and MW-3-104 will
provide upgradient groundwater sampling locations for groundwater flowing toward Area 3. The
remaining wells, PZ-3-31, MW-3-100, MW-3-101, and MW-3-102, provide downgradient
groundwater sampling locations.
-5- Area 3 ASD April 2018
3.0 STATISTICALLY SIGNIFICANT INCREASE (SSI) DETERMINATION
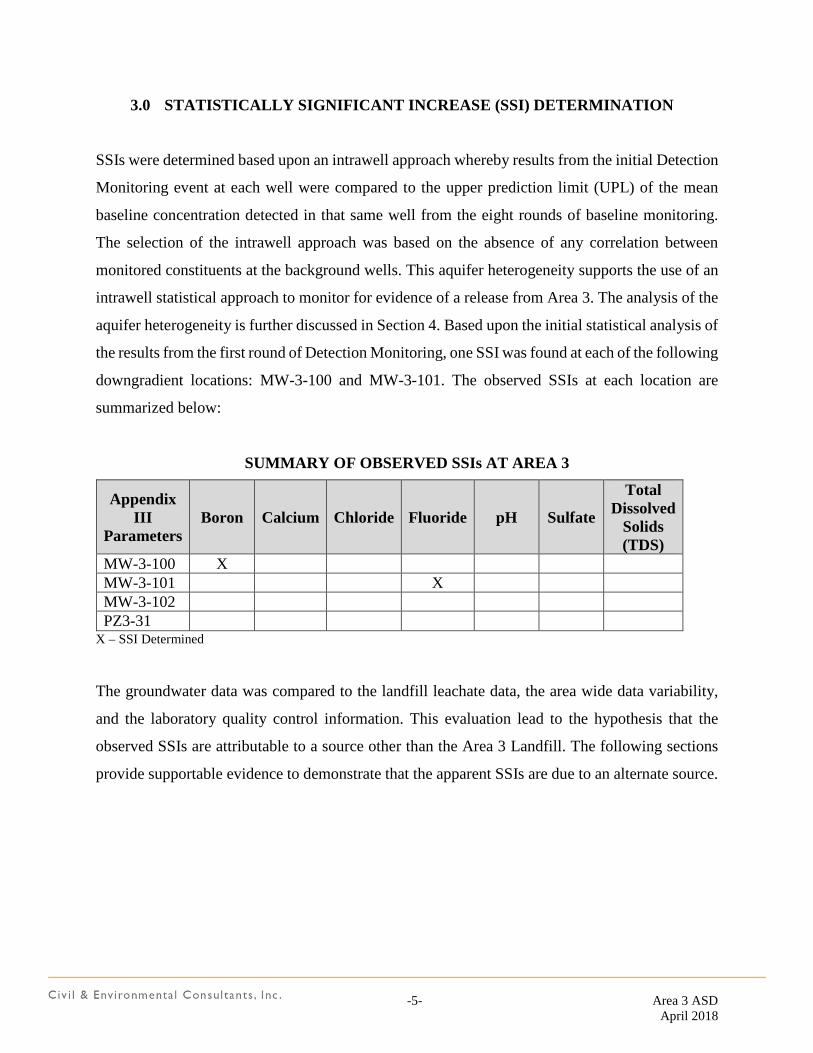
SSIs were determined based upon an intrawell approach whereby results from the initial Detection
Monitoring event at each well were compared to the upper prediction limit (UPL) of the mean
baseline concentration detected in that same well from the eight rounds of baseline monitoring.
The selection of the intrawell approach was based on the absence of any correlation between
monitored constituents at the background wells. This aquifer heterogeneity supports the use of an
intrawell statistical approach to monitor for evidence of a release from Area 3. The analysis of the
aquifer heterogeneity is further discussed in Section 4. Based upon the initial statistical analysis of
the results from the first round of Detection Monitoring, one SSI was found at each of the following
downgradient locations: MW-3-100 and MW-3-101. The observed SSIs at each location are
summarized below:
SUMMARY OF OBSERVED SSIs AT AREA 3
Appendix III
Parameters Boron Calcium Chloride Fluoride pH Sulfate
Total Dissolved
Solids (TDS)
MW-3-100 X
MW-3-101
X
MW-3-102
PZ3-31
X – SSI Determined
The groundwater data was compared to the landfill leachate data, the area wide data variability,
and the laboratory quality control information. This evaluation lead to the hypothesis that the
observed SSIs are attributable to a source other than the Area 3 Landfill. The following sections
provide supportable evidence to demonstrate that the apparent SSIs are due to an alternate source.

-6- Area 3 ASD April 2018
4.0 LINES OF EVIDENCE
Statistical methods such as those used to determine the SSIs are subject to false positive results,
where a value that is not a true exceedance may be flagged as such. In addition, there can be
multiple causes related to sampling, laboratory analysis, natural variation, and other anthropogenic
sources that can trigger an exceedance that is not due to a release from the monitored unit. For the
SSIs identified for the October 2017 Detection Sampling event, field sampling errors, laboratory
issues, regional groundwater heterogeneity, and statistical evaluation issues were determined
individually and in combination to assess the SSIs that were initially identified.
4.1 GROUNDWATER CONSTITUENT ANALYSIS
The initial review of the groundwater quality data from each well did not yield the expected
distribution of constituents around Area 3. Under normal conditions, the overall makeup of the
water quality data from upgradient wells are expected to be similar to each other in constituents
detected and their respective constituents’ ratios. If the downgradient wells are unaffected by the
landfill, the analytical results should appear similar to the upgradient wells. If the downgradient
wells are affected by the landfill, the analytical results are expected show similarities to the source
(landfill leachate) or to show some mixing effects of groundwater that would still preserve the
leachate constituent ratios. None of these scenarios were found at Area 3. No discernable groupings
of similar water quality composition could be determined that were consistent with the
groundwater flow directions and potential contaminant transport assumptions.
To further analyze and quantify the groundwater constituent makeup in the various areas around
Area 3, the USEPA-developed multi-variant evaluation technique, Fingerprint Analysis of
Leachate Contaminants (FALCON) was used (USEPA, 2014). FALCON was utilized to create a
multi-parameter chemical fingerprint of the CCR monitoring wells, background wells and leachate
data from Area 3. Although not an Area 3 CCR well, monitoring well MW-1-9 was also included
in the study and is categorized as a regional background well (Figure 2). MW-1-9 is a background
monitoring well for the nearby Basin 1 disposal area.

-7- Area 3 ASD April 2018
Fractional percentages of chemical constituent concentrations measured at each monitoring point
during the nine CCR monitoring events were used to create a distinctive chemical fingerprint at
each location. A regression analysis between each monitoring event was performed for each well
to demonstrate the reproducibility of the results over time and identify statistical outliers (including
those attributable to seasonal variability). Histogram plots of the derived fingerprints are presented
in figures 1 through 8 of Appendix A.
The average concentration of each constituent at each location was then used to create an average
typical fingerprint. The relationship between the distinctive fingerprint at each location versus all
of the other locations was quantified to estimate the likelihood of source mixing (Figure 9 of
Appendix A). The strength of the relationship between each monitoring point is represented by a
correlation coefficient (r2). Coefficient values close to 1.0 indicate the samples being compared
have a similar fingerprint. Similarly, r2 values <0.8 were considered to not correlate. The summary
table below compares each of the upgradient wells to each other, the landfill leachate (LD-3-1) to
all the monitoring wells, and the upgradient wells to the downgradient wells.
REGRESSION ANALYSIS BETWEEN AVERAGED WELL FINGERPRINTS
MW-3-103 MW-3-104 MW-1-9 LD-3-1
Upgradient Wells and Leachate
MW-3-103 1.0000 MW-3-104 0.5100 1.0000 MW-1-9 0.8600 0.3000 1.0000
LD-3-1 0.0300 0.2200 0.3000 1.0000
Downgradient Wells
MW-3-100 0.8900 0.7700 0.6100 0.0100 MW-3-101 0.7600 0.8500 0.4400 0.0300 MW-3-102 0.9800 0.6200 0.8500 0.1600
PZ-3-31 0.3300 0.9100 0.0200 0.1000
Notes: This color represents r2 values greater than 0.80
The FALCON process is discussed in greater detail in Appendix A along with the details of our
regression analysis of the average location fingerprints. The FALCON regressions analysis
(summarized in the table above) suggests two key findings for Area 3.

-8- Area 3 ASD April 2018
• Leachate (LD-1) fingerprint does not correlate with any of the CCR wells.
• Fingerprints of CCR-Rule background wells (MW-3-103 and MW-3-104) and the
regional background well (MW-1-9) do not correlate strongly with each other.
The lack of correlation between the leachate fingerprints and any of the regional or CCR
upgradient and downgradient monitoring wells serves as evidence against any leachate migration
from the landfill to groundwater. Similarly, the non-optimal correlation between the three
designated background wells suggests a degree of aquifer heterogeneity and supports the use of an
intrawell statistical approach to monitor for evidence of a release from Area 3. The data suggests
the recorded SSIs were likely derived from an alternate source and not the result of leachate
migration. This is a key line of evidence supporting an alternate source for the two observed SSIs.
4.2 SEASONAL VARIABILITY
Boron was identified as a SSI at MW-3-100. A time trend plot of boron results through the nine
sampling events suggests a significant seasonal variation and indicates the first Detection
Monitoring event (October 2017) appears to have been collected during the season when boron
results climax (See boron time-trend below). To further examine the seasonality hypothesis, MW-
3-100 was resampled during February 2018, in advance of the next Detection Monitoring event.
The results were significantly below the detected concentration in October 2017 as well as the
UPL and were consistent with the January 2017 result. This result confirms the seasonal pattern
that had previously been observed. The source of the seasonal variability at this location is
unknown, but the elevated boron result is not attributable to a release from the Area 3 landfill. This
is a key line of evidence supporting an alternate source.

-9- Area 3 ASD April 2018
Total boron time-trend for MW-3-100, showing seasonal variability in total boron
concentration.
4.3 LABORATORY CAUSES
Boron was identified as a SSI at MW-3-100. Boron was additionally detected at trace levels (below
the limit of quantitation (LOQ) but above the limit of detection (LOD)) at most upgradient and
downgradient locations. These trace detections have been reported by the laboratory and used in
the statistical evaluation of the sampling results.
For constituents being compared to baseline concentrations during Detection Monitoring,
precision is of upmost concern and proper establishment of the LOQ is necessary to minimize the
potential for introducing variability into reported results such that SSIs unrelated to a release from
the facility are triggered.
Non-detects are currently processed at the LOD and results between the LOD and LOQ are
considered estimated values subject to low precision. These estimated values have been included
in the statistical evaluation based upon the assumption that an estimated value is preferable to a
less than value. While laboratories will often set their LOQ at three to five times the LOD, for
boron the ratio of LOQ/LOD is nearly twelve for the third through ninth sampling events.
0
0.1
0.2
0.3
0.4
0.5
0.6
4/1/
2016
7/10
/201
6
10/1
8/20
16
1/26
/201
7
5/6/
2017
8/14
/201
7
11/2
2/20
17
3/2/
2018
Conc
entr
atio
n (m
g/L)
Date
MW-3-100, Total Boron
Boron, Total
UPL
-10- Area 3 ASD April 2018
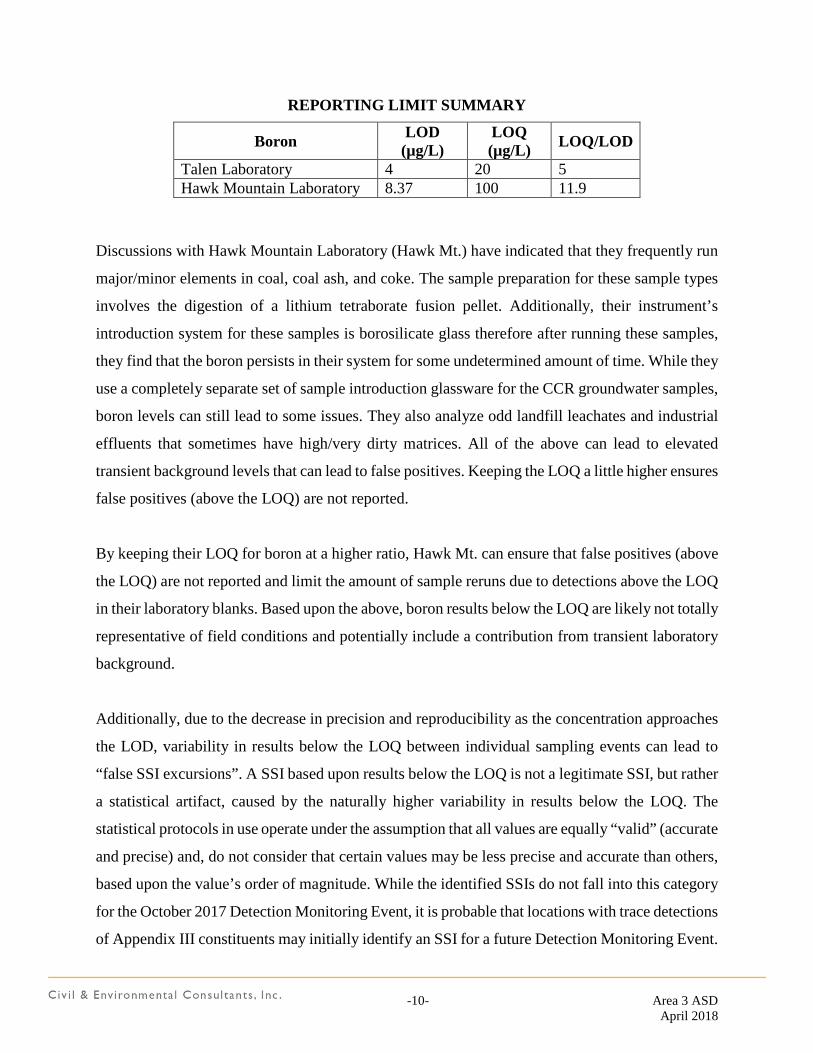
REPORTING LIMIT SUMMARY
Boron LOD (µg/L)
LOQ (µg/L) LOQ/LOD
Talen Laboratory 4 20 5 Hawk Mountain Laboratory 8.37 100 11.9
Discussions with Hawk Mountain Laboratory (Hawk Mt.) have indicated that they frequently run
major/minor elements in coal, coal ash, and coke. The sample preparation for these sample types
involves the digestion of a lithium tetraborate fusion pellet. Additionally, their instrument’s
introduction system for these samples is borosilicate glass therefore after running these samples,
they find that the boron persists in their system for some undetermined amount of time. While they
use a completely separate set of sample introduction glassware for the CCR groundwater samples,
boron levels can still lead to some issues. They also analyze odd landfill leachates and industrial
effluents that sometimes have high/very dirty matrices. All of the above can lead to elevated
transient background levels that can lead to false positives. Keeping the LOQ a little higher ensures
false positives (above the LOQ) are not reported.
By keeping their LOQ for boron at a higher ratio, Hawk Mt. can ensure that false positives (above
the LOQ) are not reported and limit the amount of sample reruns due to detections above the LOQ
in their laboratory blanks. Based upon the above, boron results below the LOQ are likely not totally
representative of field conditions and potentially include a contribution from transient laboratory
background.
Additionally, due to the decrease in precision and reproducibility as the concentration approaches
the LOD, variability in results below the LOQ between individual sampling events can lead to
“false SSI excursions”. A SSI based upon results below the LOQ is not a legitimate SSI, but rather
a statistical artifact, caused by the naturally higher variability in results below the LOQ. The
statistical protocols in use operate under the assumption that all values are equally “valid” (accurate
and precise) and, do not consider that certain values may be less precise and accurate than others,
based upon the value’s order of magnitude. While the identified SSIs do not fall into this category
for the October 2017 Detection Monitoring Event, it is probable that locations with trace detections
of Appendix III constituents may initially identify an SSI for a future Detection Monitoring Event.

-11- Area 3 ASD April 2018
This is a supporting line of evidence that trace or low level detections of boron are due to an
alternate source.
4.4 ADDITIONAL CONSIDERATIONS
Fluoride is identified as a SSI in MW-3-101 with an apparent increasing trend over the first nine
sampling events. However, neither boron nor sulfate, key coal ash indicators, have been identified
as an SSI at that location, nor do they show an increasing trend over the same time period. This
would be a supporting line of evidence that fluoride concentrations are not indicative of a release
from Area 3.
A Stiff diagram is a graphical representation of chemical analyses used to display the major ion
composition of a water sample. Constituent concentrations are converted to milliequivalents/liter
(meq/L) which accounts for the variability in ion charge. Cations are plotted on the left side of the
zero axis, and anions are plotted on the right side, such that the two sides of the diagram are
electrically neutral or “balanced”. Stiff diagrams are useful in making a rapid visual comparison
between water from different sources. The stiff diagram based upon August 2017 concentrations
at each location and the leachate are presented in Figure 2. The Stiff Diagrams confirm the
FALCON analysis determination of spatial heterogeneity in background locations and that the
leachate water quality appears significantly different than downgradient water quality. This is a
supporting line of evidence that SSIs are not due to a release from Area 3.
Piper diagrams (trilinear diagrams) are another form of graphical representation of the chemistry
of a water sample. A piper diagram is suitable for comparing the ionic composition of a set of
water samples and is useful for classifying the water types at various locations. A piper diagram
based upon average concentrations of the major constituents over the period of the nine sampling
events (or since 2010 for Leachate) is presented in Figure 3. Background wells MW-1-9, MW-3-
103 and downgradient well MW-3-102 classify as calcium/bicarbonate water sources, while the
other locations fall into the calcium/sulfate classification area. Neither the upgradient wells nor the
downgradient wells classify as the same type of water chemistry as is found in the Leachate as
presented in the 10-year average value plotted. The downgradient wells additionally do not plot

-12- Area 3 ASD April 2018
in-between the leachate data and the upgradient wells, as would be expected if there were mixing
of these two water sources. This is a supporting line of evidence that detected concentrations of
monitored constituents do not show any impacts from Area 3.

-13- Area 3 ASD April 2018
5.0 CONCLUSIONS
The preceding information serves as the ASD prepared in accordance with 40 CFR 257.94(e)(2)
and supports the position that the SSIs during the October 2017 monitoring period are not due to
a release from the CCR unit. Therefore, no further action (i.e., assessment monitoring) is warranted
and Montour Disposal Area No. 3 will remain in detection monitoring.

-14- Area 3 ASD April 2018
6.0 REFERENCES
CEC, 2017. Groundwater Monitoring System Certification, Disposal Area No. 3, Derry Township,
Pennsylvania, Prepared for Talen Energy/Montour, LLC, Washingtonville, Pennsylvania,
Prepared by Civil & Environmental Consultants, Inc., Pittsburgh, Pennsylvania, CEC
Project 132-065, October, 2017.
EPRI, 2017. Guidelines for Development of Alternative Source Demonstrations at Coal
Combustion Residual Sites. 3002010920. 132 pp.
USEPA, 2014. Fingerprint Analysis of Contaminant Data: A Forensic Tool for Evaluating
Environmental Contamination, EPA/600/5-04/054
USEPA, 2015. Disposal of Coal Combustion Residuals from Electric Utilities (CCR Rule) 40
C.F.R. § 257, Subpart D, April 17, 2015.

-15- Area 3 ASD April 2018
7.0 ALTERNATE SOURCE DEMONSTRATION CERTIFICATION
CCR Impoundment Information Name: Montour Disposal Area No. 3 Operator: Montour, LLC Address: 18 McMichael Road Washingtonville, PA 17884
Qualified Professional Engineer: Name: Rick Buffalini, P.E. Company: Civil & Environmental Consultants
I, Rick J. Buffalini, certify that this Alternate Source Demonstration for Montour Disposal Area No. 3 meets the requirements of the Coal Combustion Residual (CCR) rule 40 C.F.R. §257.94(e)(2). I am a duly licensed Professional Engineer under the laws of Pennsylvania.
Print Name: __Rick Buffalini ____________________________________________ Signature:
Date: ___April 11, 2018________________________________________________ License Number: PE 041196 My license renewal date is September 30, 2019
Qualified Professional Geologist: Name: H. Thomas Walsh, P.G.Company: Civil & Environmental Consultants
I, H. Thomas Walsh, certify that this Alternate Source Demonstration for Montour Disposal Area No. 3 meets the requirements of the Coal Combustion Residual (CCR) rule 40 C.F.R. §257.94(e)(2). I am a duly licensed Professional Geologist under the laws of Pennsylvania.
Print Name: ____H. Thomas Walsh__________________________________________ Signature:
Date: ___April 11, 2018_________________________________________________ License Number: PG 003251
My license renewal date is September 30, 2019

FIGURES

!(
!(
!(
!(
!(
!(
DUAL 48" DIAMETER CONDUIT
AREA 3 - EAST
AREA 3 - WEST(NOT CONSTRUCTED)
UNNAMEDTRIBUTARY
PZ3-31
MW-3-104
MW-3-103
MW-3-102
MW-3-101
MW-3-100
www.cecinc.com333 Baldwin Road - Pittsburgh, PA 15205-9072
412-429-2324 800-365-2324
DRAWN BY:DATE:
APPROVED BY:PROJECT NO:
FIGURE NO: 1NJH1/5/2018
CCR RULE GROUNDWATER SAMPLING LOCATIONS - AREA 3BJH
132-065.1203CHECKED BY:SCALE: 1 " = 300 '
LEGEND!( DOWNGRADIENT MONITORING POINT!( BACKGROUND MONITORING POINT
CREEKCONDUITAREA 3 BOUNDARY
REFERENCEGOOGLE EARTH PRO IMAGERYIMAGE DATE: 9/26/2014
0 300 600SCALE IN FEET
* Hand signature on file HTW*
\\svr-pittsburgh\projects\2013\132-065\-GIS\Maps\Task_1203\Area_3\132065_FIG2_MONITORING_LOCS_CCR.mxd 1/5/2018 11:35 AM (nhetrick)
ASHT ADILSEPNO ESNAEL RAGRYEA 3MONTOWUAR SSHTIENAGMT OENLEVICLTLREI, CP ASTATION

!(
!(
!(
!(
!(
!(
!(
!(
DUAL 48" DIAMETER CONDUIT
AREA 3 - EAST
AREA 3 - WEST(NOT CONSTRUCTED)
UNNAMEDTRIBUTARY
LD-3-1
MW-1-9
Tributary 18787 to Mud Creek
PZ3-31
MW-3-104MW-3-103
MW-3-102
MW-3-100
MW-3-101
www.cecinc.com333 Baldwin Road - Pittsburgh, PA 15205-9072
412-429-2324 800-365-2324
DRAWN BY:DATE:
APPROVED BY:PROJECT NO:
FIGURE NO: 2
TALEN ENERGYASH DISPOSAL AREA 3MONTOUR STEAM ELECTRIC STATIONWASHINGTONVILLE, PA
NJH/JLR3/29/2018
BJH132-065.1202
CHECKED BY:SCALE: 1 " = 600 '
LEGEND!( DOWNGRADIENT WELL!( BACKGROUND WELL!( REGIONAL BACKGROUND WELL!( LEACHATE
CREEKCONDUITAREA 3 BOUNDARY
REFERENCEARCGIS MAP SERVICE: ESRI WORLD IMAGERY,IMAGERY DATE: 2015.
0 600 1,200SCALE IN FEET
*
\\svr-pittsburgh\Projects\2013\132-065\-GIS\Maps\Task_1202\Area_3\132065_FIG1_MONITORING_LOCS_CCR.mxd 3/29/2018 4:03 PM (jrokosz)
CCR RULE ALTERNATE SOURCE DEMONSTRATIONAUGUST 2017 STIFF DIAGRAMS
oH
na nfilde signature HTW*
bhastings
Stamp
bhastings
Stamp
bhastings
Stamp
bhastings
Stamp
bhastings
Stamp
bhastings
Stamp
bhastings
Stamp
bhastings
Line
bhastings
Line
bhastings
Line
bhastings
Line
bhastings
Line
bhastings
Line
bhastings
Line
bhastings
Stamp
bhastings
Line

FIGURE 3 - Piper Plot showing Avg. Conc. of CCR Rule Wells and MW-1-9 from May 2016 to October 2017DESCRIPTION:
PROJECT: PROJECT NO:Ash Landfill 3 ASD 132-065
CLIENT: DATE:Talen Montour, LLC April 2018
and Leachate from 2010 to 2017
80 60 40 20 20 40 60 80
20
40
60
80
20
40
60
80
20
40
60
80
20
40
60
80
Ca Na+K Alk. Cl
Mg SO4
<=A
lk.
Na+
K=>
<=C
a + M
gCl +
SO
4=>
PZ-3-31
MW-3-100
MW-3-101
MW-3-102
LD-3-1
MW-3-103
MW-3-104
MW-1-9
PZ-3-31
MW-3-100
MW-3-101
MW-3-102
LD-3-1
MW-3-103
MW-3-104
MW-1-9

APPENDIX A
FALCON Statistical Evaluation

Explanation of the FALCON Statistical Evaluation
In response to the need to identify the source of contaminant plumes, EPA has developed an
empirical multi-variant contaminant fingerprinting process. The Fingerprint Analysis of Leachate
Contaminants (FALCON) process combines data for several contaminants to develop a distinctive
graphical fingerprint or multi-parameter chemical signature. These fingerprint patterns can be used
to characterize the source of a contaminant plume, differentiate the contaminant plume from
background conditions at the source, and monitor the migration of leachate into the environment.
The FALCON process was used to create a multi-parameter chemical fingerprint of the CCR
monitoring wells, background wells, and leachate data from Area 3. MW-1-9 (Basin 1) was also
included in the study and is categorized as a regional background well. The analysis included the
major constituents (calcium, sodium, magnesium plus potassium, chloride, sulfate and alkalinity)
as well as trace constituents (boron and lithium).
Ratios of concentrations of chemical constituents measured at each monitoring point during the
nine CCR monitoring events were used to create a distinctive chemical fingerprint for each
location. (see Figures 1 through 8). Individual constituent concentrations were normalized to the
total concentration of detected constituents to allow for comparisons between locations with
significantly different total dissolved solids levels (which is a measure of the constituent loading
at a given monitoring point).
A regression analysis between each monitoring event was performed on a well-by-well basis to
determine statistical outliers (including those attributable to seasonal variability) and establish
reproducibility of constituent concentrations over time. An average concentration for each
constituent at each monitoring location was calculated with the exclusion of any identified
statistical outliers. The average concentration and subsequent normalized fractional percentage
were then used to derive histogram plots or “fingerprints” for each location as shown in Figure 9.
The relationship between the distinctive fingerprint at each upgradient location and downgradient
location was determined to estimate the likelihood of an upgradient source mixing with the

downgradient water (See Summary Table in Figure 9). The strength of the relationship between
each source is represented by the correlation coefficient (r2). Based upon guidance provided in the
EPA document and EPRI guidance document on the use of FALCON as part of an Alternate
Source Demonstration at CCR sites the following interpretation was applied.
Values of r2 close to 1 would indicate the downgradient sample has a similar fingerprint to the
source water (i.e. background or leachate)., values below 0.8 were considered to not show a
correlation between the two locations and thus downgradient water quality was not impacted by
the upgradient source. The interwell evaluation was also examined to determine whether the
designated background wells (either individually or combined) could be used as representative of
regional groundwater quality. The results of our regression analysis of the fingerprints as presented
in Figure 9 suggests two key findings for Area 3.
• Leachate (LD-1) fingerprint shows no correlation with any of the CCR wells
(upgradient or downgradient).
• Background well (MW-1-9, MW-3-103, and MW-3-104) fingerprints do not correlate
well with each other.
The lack of correlation between leachate fingerprint and any of the CCR monitoring wells serves
as evidence against any leachate migration. Similarly, the absence of any correlation between the
designated background wells suggest aquifer heterogeneity and support the use of an intrawell
statistical approach to monitor for evidence of a release from Area 3. The data suggests the
recorded SSIs were likely derived from an alternate source and not the result of leachate migration.

FALCON SUMMARYALTERNATIVE SOURCE DEMONSTRATION
ASH LANDFILL 3MONTOUR, LLC
WASHINGTONVILLE, PA
5/16/2016 6/27/2016 8/16/2016 11/7/2016 2/14/2017 5/18/2017 6/21/2017 8/10/2017 10/10/2017Alkalinity, total as CaCO3 (mg/L) 20 26 65 103 20 1 10 10 24Boron, total (µg/L) 10 37 57 32 10 50 50 50 50Calcium, total (mg/L) 106 124 137 136 122 113 90 96 127Chloride, total as Cl (mg/L) 1.2 5.3 6.5 6.7 1.2 1.6 2.4 2.4 8.1Lithium, total (µg/L) 3.0 6.6 14.4 18.9 2.7 1.9 2.3 3.4 6.6Molybdenum, total (µg/L) 0.5 1.6 4.9 7.1 0.5 0.2 0.2 0.1 0.2Sulfate, as SO4 (mg/L) 349 370 358 356 390 317 310 313 375Magnesium + Potassium (mg/L) 14.0 19.7 21.0 20.9 14.9 13.5 13.7 15.5 20.6Sodium, Total (mg/L) 8.4 15.4 17.7 18.8 7.8 7.5 9.3 9.7 17.0
Sum of Constituents 512.1 605.8 682.2 699.6 569.1 505.7 488.2 500.2 629.0
5/16/2016 6/27/2016 8/16/2016 11/7/2016 2/14/2017 5/18/2017 6/21/2017 8/10/2017 10/10/20175/16/2016 1.0000 6/27/2016 0.9978 1.0000 8/16/2016 0.9883 0.9933 1.0000 11/7/2016 0.9765 0.9758 0.9902 1.0000 2/14/2017 0.9999 0.9979 0.9881 0.9758 1.0000 5/18/2017 0.9882 0.9952 0.9861 0.9558 0.9887 1.0000 6/21/2017 0.9900 0.9959 0.9876 0.9605 0.9896 0.9972 1.0000 8/10/2017 0.9906 0.9966 0.9884 0.9612 0.9904 0.9982 0.9999 1.0000
10/10/2017 0.9952 0.9994 0.9931 0.9718 0.9952 0.9974 0.9979 0.9985 1.0000 Average r2= 0.9909
Notes: values less than 0.80 r 2
Figure 1. PZ-3-31
Analytical Data
Regression Analysis Between CCR Monitoring Events
All show high r 2 (>0.8) demonstrating that results are consistent from event to event. Average value is appropriate to use.
0
0.1
0.2
0.3
0.4
0.5
0.6
0.7
0.8
0.9
1
May-16 Jun-16 Aug-16 Nov-16 Feb-17 May-17 Jun-17 Aug-17 Oct-17
Frac
tiona
l Con
cent
ratio
n
PZ 3-31 CCR Event Histogram
ALK B Ca Cl Li Mo SO4 Mg + K Na(Normalized to Sum)

FALCON SUMMARYALTERNATIVE SOURCE DEMONSTRATION
ASH LANDFILL 3MONTOUR, LLC
WASHINGTONVILLE, PA
5/16/2016 6/27/2016 8/16/2016 11/7/2016 2/14/2017 5/18/2017 6/21/2017 8/10/2017 10/10/2017Alkalinity, total as CaCO3 (mg/L) 275 287 253 232 241 248 245 253 240Boron, total (µg/L) 22 45 218 525 24 50 50 159 551Calcium, total (mg/L) 149 154 241 293 153 147 146 211 271Chloride, total as Cl (mg/L) 3.0 4.4 5.5 7.3 2.8 3.3 4.1 5.9 8.7Lithium, total (µg/L) 3.8 3.2 35.7 119.0 3.9 6.4 3.8 24.1 25.0Molybdenum, total (µg/L) 18.7 21.2 24.6 28.2 14.6 14.6 18.5 28.2 27.0Sulfate, as SO4 (mg/L) 193 218 453 682 223 209 221 311 613Magnesium + Potassium (mg/L) 15.6 17.3 25.4 34.6 16.5 17.1 17.9 24.3 33.4Sodium, Total (mg/L) 18.0 26.8 12.3 16.8 17.5 16.8 20.6 17.7 16.6
Sum of Constituents 698.6 776.5 1268.6 1937.9 696.2 712.2 726.9 1034.2 1785.7
5/16/2016 6/27/2016 8/16/2016 11/7/2016 2/14/2017 5/18/2017 6/21/2017 8/10/2017 10/10/20175/16/2016 1.0000 6/27/2016 0.9969 1.0000 8/16/2016 0.7864 0.8235 1.0000 11/7/2016 0.5148 0.5710 0.9251 1.0000 2/14/2017 0.9873 0.9904 0.8561 0.6032 1.0000 5/18/2017 0.9902 0.9966 0.8640 0.6279 0.9944 1.0000 6/21/2017 0.9859 0.9942 0.8763 0.6431 0.9959 0.9989 1.0000 8/10/2017 0.8844 0.9114 0.9770 0.8478 0.9250 0.9396 0.9444 1.0000
10/10/2017 0.5156 0.5741 0.9108 0.9875 0.5925 0.6272 0.6407 0.8472 1.0000 Average r2= 0.9544
Notes: values less than 0.80 r 2
Figure 2. MW-3-100
Analytical Data
Regression Analysis Between CCR Monitoring Events
Highlighted values are not included in the Average r 2 value. The calculated r 2 value is exclusive of documented high late summer/early fall seasonal variability.
Average r 2 value of non-high seasonal impacts shows event to event reproducabiity, which allows for use of adjusted average.
0
0.1
0.2
0.3
0.4
0.5
0.6
0.7
0.8
0.9
1
May-16 Jun-16 Aug-16 Nov-16 Feb-17 May-17 Jun-17 Aug-17 Oct-17
Frac
tiona
l Con
cent
ratio
n
MW-3-100 CCR Event Histogram
ALK B Ca Cl Li Mo SO4 Mg + K Na(Normalized to Sum)

FALCON SUMMARYALTERNATIVE SOURCE DEMONSTRATION
ASH LANDFILL 3MONTOUR, LLC
WASHINGTONVILLE, PA
5/16/2016 6/27/2016 8/16/2016 11/7/2016 2/14/2017 5/18/2017 6/21/2017 8/10/2017 10/10/2017Alkalinity, total as CaCO3 (mg/L) 87 120 150 152 64 49 70 122 138Boron, total (µg/L) 30 36 43 24 10 50 50 50 50Calcium, total (mg/L) 92 84 94 103 97 77 76 101 95Chloride, total as Cl (mg/L) 2.9 3.8 4.2 4.5 0.9 1.1 3.0 4.4 5.7Lithium, total (µg/L) 3.6 7.1 8.7 10.3 0.7 1.4 3.5 6.4 5.2Molybdenum, total (µg/L) 9.4 11.5 13.5 14.8 5.5 5.4 10.3 26.7 21.0Sulfate, as SO4 (mg/L) 172 146 142 153 204 170 154 141 154Magnesium + Potassium (mg/L) 10.7 12.0 12.5 12.7 9.2 10.5 10.9 14.0 13.0Sodium, Total (mg/L) 5.4 7.5 8.3 7.7 3.4 5.36 5.7 9.0 7.8
Sum of Constituents 413.7 428.1 475.9 482.1 394.7 363.6 383.2 474.5 489.9
5/16/2016 6/27/2016 8/16/2016 11/7/2016 2/14/2017 5/18/2017 6/21/2017 8/10/2017 10/10/20175/16/2016 1.0000 6/27/2016 0.9671 1.0000 8/16/2016 0.9185 0.9883 1.0000 11/7/2016 0.9319 0.9884 0.9931 1.0000 2/14/2017 0.9813 0.9045 0.8315 0.8608 1.0000 5/18/2017 0.9648 0.8846 0.8088 0.8127 0.9690 1.0000 6/21/2017 0.9861 0.9436 0.8887 0.8871 0.9638 0.9878 1.0000 8/10/2017 0.9537 0.9895 0.9844 0.9792 0.8817 0.8733 0.9363 1.0000
10/10/2017 0.9502 0.9961 0.9931 0.9860 0.8748 0.8650 0.9318 0.9954 1.0000 Average r2= 0.9478
Notes: values less than 0.80 r 2
Figure 3. MW-3-101
Analytical Data
Regression Analysis Between CCR Monitoring Events
All show high r 2 (>0.8) demonstrating that results are consistent from event to event. Average value is appropriate to use.
0
0.1
0.2
0.3
0.4
0.5
0.6
0.7
0.8
0.9
1
May-16 Jun-16 Aug-16 Nov-16 Feb-17 May-17 Jun-17 Aug-17 Oct-17
Frac
tiona
l Con
cent
ratio
n
MW3-101 CCR Event Histogram
ALK B Ca Cl Li Mo SO4 Mg + K Na(Normalized to Sum)

FALCON SUMMARYALTERNATIVE SOURCE DEMONSTRATION
ASH LANDFILL 3MONTOUR, LLC
WASHINGTONVILLE, PA
5/16/2016 6/27/2016 8/16/2016 11/7/2016 2/14/2017 5/18/2017 6/21/2017 8/10/2017 10/10/2017Alkalinity, total as CaCO3 (mg/L) 287 293 294 282 276 273 268 275 269Boron, total (µg/L) 124 139 126 162 152 64 136 151 159Calcium, total (mg/L) 119 106 235 105 115 172 116 132 114Chloride, total as Cl (mg/L) 6.1 5.7 7.1 6.4 7.6 10.8 8.8 7.3 10.2Lithium, total (µg/L) 22.6 18.9 21.0 18.2 17.9 16.1 17.9 20.5 19.1Molybdenum, total (µg/L) 6.6 6.2 5.9 6.4 4.5 3.9 5.2 7.0 2.0Sulfate, as SO4 (mg/L) 161 136 457 149 178 242 170 170 147Magnesium + Potassium (mg/L) 30.1 34.0 40.4 35.6 36.7 39.0 35.4 33.0 34.7Sodium, Total (mg/L) 13.9 15.6 12.8 15.6 15.0 14.7 15.4 16.2 15.8
Sum of Constituents 770.3 754.4 1199.3 780.2 802.7 835.5 772.7 811.9 770.8
5/16/2016 6/27/2016 8/16/2016 11/7/2016 2/14/2017 5/18/2017 6/21/2017 8/10/2017 10/10/20175/16/2016 1.0000 6/27/2016 0.9928 1.0000 8/16/2016 0.8134 0.7444 1.0000 11/7/2016 0.9874 0.9949 0.7616 1.0000 2/14/2017 0.9921 0.9861 0.8320 0.9931 1.0000 5/18/2017 0.9275 0.8781 0.9426 0.8684 0.9143 1.0000 6/21/2017 0.9961 0.9875 0.8376 0.9905 0.9990 0.9276 1.0000 8/10/2017 0.9935 0.9868 0.8276 0.9915 0.9975 0.9182 0.9980 1.0000
10/10/2017 0.9877 0.9924 0.7749 0.9986 0.9942 0.8777 0.9921 0.9950 1.0000 Average r2= 0.9622
Notes: values less than 0.80 r 2
Figure 4. MW-3-102
Analytical Data
Regression Analysis Between CCR Monitoring Events
Highlighted values are not included in the Average r 2 value because they are suspected outliers.
Average r 2 value shows event to event reproducabiity, which allows for use of adjusted average.
0
0.1
0.2
0.3
0.4
0.5
0.6
0.7
0.8
0.9
1
May-16 Jun-16 Aug-16 Nov-16 Feb-17 May-17 Jun-17 Aug-17 Oct-17
Frac
tiona
l Con
cent
ratio
n
MW-3-102 CCR Event Histogram
ALK B Ca Cl Li Mo SO4 Mg + K Na(Normalized to Sum)

FALCON SUMMARYALTERNATIVE SOURCE DEMONSTRATION
ASH LANDFILL 3MONTOUR, LLC
WASHINGTONVILLE, PA
5/16/2016 6/27/2016 8/16/2016 11/7/2016 2/14/2017 5/18/2017 6/21/2017 8/10/2017 10/10/2017Alkalinity, total as CaCO3 (mg/L) 134 152 147 164 174 185 182 181 136Boron, total (µg/L) 9120 10400 9840 10100 10600 9910 10800 10400 10700Calcium, total (mg/L) 568 560 547 561 541 520 546 497 537Chloride, total as Cl (mg/L) 104.0 168.0 125.0 156.0 243.0 157.0 146.0 202.0 102.0Lithium, total (µg/L) 1870.0 1970.0 1610.0 2210.0 1730.0 1620.0 2050.0 1700.0 2300.0Molybdenum, total (µg/L) 1820.0 1820.0 2020.0 2520.0 2260.0 2500.0 2280.0 2220.0 2790.0Sulfate, as SO4 (mg/L) 2440 2970 2470 2740 3880 2840 2910 3570 2450Magnesium + Potassium (mg/L) 183.7 195.3 175.4 195.7 198.3 193.0 233.0 212.0 189.7Sodium, Total (mg/L) 485.0 755.0 524.0 590.0 914.0 673.0 732.0 957.0 475.0
Sum of Constituents 16724.7 18990.3 17458.4 19236.7 20540.3 18598.0 19879.0 19939.0 19679.7
5/16/2016 6/27/2016 8/16/2016 11/7/2016 2/14/2017 5/18/2017 6/21/2017 8/10/2017 10/10/20175/16/2016 1.0000 6/27/2016 0.9990 1.0000 8/16/2016 0.9989 0.9982 1.0000 11/7/2016 0.9986 0.9961 0.9977 1.0000 2/14/2017 0.9926 0.9953 0.9928 0.9911 1.0000 5/18/2017 0.9968 0.9959 0.9984 0.9979 0.9951 1.0000 6/21/2017 0.9995 0.9990 0.9995 0.9987 0.9941 0.9984 1.0000 8/10/2017 0.9945 0.9969 0.9950 0.9932 0.9997 0.9967 0.9961 1.0000
10/10/2017 0.9965 0.9924 0.9963 0.9989 0.9846 0.9959 0.9967 0.9876 1.0000 Average r2= 0.9968
Notes: values less than 0.80 r 2
Figure 5. LD-3-1
Analytical Data
Regression Analysis Between CCR Monitoring Events
All show high r 2 (>0.8) demonstrating that results are consistent from event to event. Average value is appropriate to use.
0
0.1
0.2
0.3
0.4
0.5
0.6
0.7
0.8
0.9
1
May-16 Jun-16 Aug-16 Nov-16 Feb-17 May-17 Jun-17 Aug-17 Oct-17
Frac
tiona
l Con
cent
ratio
n
Leachate CCR Event Histogram
ALK B Ca Cl Li Mo SO4 Mg + K Na(Normalized to Sum)

FALCON SUMMARYALTERNATIVE SOURCE DEMONSTRATION
ASH LANDFILL 3MONTOUR, LLC
WASHINGTONVILLE, PA
5/16/2016 6/27/2016 8/16/2016 11/7/2016 2/14/2017 5/18/2017 6/21/2017 8/10/2017 10/10/2017Alkalinity, total as CaCO3 (mg/L) 319 318 314 309 153 304 299 303 302Boron, total (µg/L) 107 109 110 123 65 60 102 114 124Calcium, total (mg/L) 130 126 131 125 95 150 123 135 128Chloride, total as Cl (mg/L) 1.6 2.1 2.1 2.2 18.0 3.1 3.6 3.2 3.1Lithium, total (µg/L) 26.0 24.1 26.5 25.6 14.1 21.2 26.0 21.9 23.2Molybdenum, total (µg/L) 2.1 2.1 2.2 2.6 1.3 3.0 1.9 2.7 2.0Sulfate, as SO4 (mg/L) 135 137 132 126 137 128 135 130 117Magnesium + Potassium (mg/L) 20.8 20.6 21.0 20.4 17.7 23.2 21.9 23.3 21.6Sodium, Total (mg/L) 21.4 21.6 22.0 21.7 15.6 23.5 21.4 23.4 23.9
Sum of Constituents 762.8 760.5 760.8 755.5 516.2 715.5 733.8 756.5 744.8
5/16/2016 6/27/2016 8/16/2016 11/7/2016 2/14/2017 5/18/2017 6/21/2017 8/10/2017 10/10/20175/16/2016 1.0000 6/27/2016 0.9998 1.0000 8/16/2016 0.9999 0.9997 1.0000 11/7/2016 0.9977 0.9980 0.9985 1.0000 2/14/2017 0.9180 0.9198 0.9169 0.9080 1.0000 5/18/2017 0.9841 0.9817 0.9827 0.9716 0.9139 1.0000 6/21/2017 0.9997 0.9997 0.9994 0.9968 0.9271 0.9836 1.0000 8/10/2017 0.9987 0.9985 0.9993 0.9985 0.9209 0.9809 0.9983 1.0000
10/10/2017 0.9959 0.9959 0.9972 0.9994 0.9005 0.9702 0.9945 0.9980 1.0000 Average r2= 0.9810
Notes: values less than 0.80 r 2
Figure 6. MW-3-103
Analytical Data
Regression Analysis Between CCR Monitoring Events
All show high r 2 (>0.8) demonstrating that results are consistent from event to event. Average value is appropriate to use.
0
0.1
0.2
0.3
0.4
0.5
0.6
0.7
0.8
0.9
1
May-16 Jun-16 Aug-16 Nov-16 Feb-17 May-17 Jun-17 Aug-17
Frac
tiona
l Con
cent
ratio
n
MW-3-103 CCR Event Histogram
ALK B Ca Cl Li Mo SO4 Mg + K Na(Normalized to Sum)

FALCON SUMMARYALTERNATIVE SOURCE DEMONSTRATION
ASH LANDFILL 3MONTOUR, LLC
WASHINGTONVILLE, PA
5/16/2016 6/27/2016 8/16/2016 11/7/2016 2/14/2017 5/18/2017 6/21/2017 8/10/2017 10/10/2017Alkalinity, total as CaCO3 (mg/L) 47 42 40 43 40 41 31 48 61Boron, total (µg/L) 27 27 29 16 23 50 50 50 50Calcium, total (mg/L) 27 31 26 21 16 18 22 23 24Chloride, total as Cl (mg/L) 1.6 1.9 2.3 1.4 1.2 2.3 2.7 2.2 2.0Lithium, total (µg/L) 18.4 24.7 22.6 19.0 16.7 21.6 25.1 18.1 20.8Molybdenum, total (µg/L) 1.5 1.8 2.4 3.1 1.1 0.8 0.2 3.8 2.0Sulfate, as SO4 (mg/L) 112 157 132 97 73 90 134 106 89Magnesium + Potassium (mg/L) 12.9 18.7 15.0 12.0 9.8 11.6 15.2 13.7 11.1Sodium, Total (mg/L) 26.7 33.5 30.7 26.7 21.4 24.4 31.7 26.4 23.1
Sum of Constituents 273.5 338.3 300.3 239.3 202.6 259.1 500.7 290.7 282.1
5/16/2016 6/27/2016 8/16/2016 11/7/2016 2/14/2017 5/18/2017 6/21/2017 8/10/2017 10/10/20175/16/2016 1.0000 6/27/2016 0.9866 1.0000 8/16/2016 0.9911 0.9983 1.0000 11/7/2016 0.9940 0.9830 0.9849 1.0000 2/14/2017 0.9883 0.9558 0.9671 0.9841 1.0000 5/18/2017 0.9410 0.9124 0.9334 0.9110 0.9568 1.0000 6/21/2017 0.9595 0.9712 0.9796 0.9381 0.9403 0.9646 1.0000 8/10/2017 0.9682 0.9417 0.9582 0.9423 0.9740 0.9928 0.9709 1.0000
10/10/2017 0.9266 0.8645 0.8884 0.9011 0.9619 0.9716 0.8931 0.9719 1.0000 Average r2= 0.9662
Notes: values less than 0.80 r 2
Analytical Data
Regression Analysis Between CCR Monitoring Events
Figure 7. MW-3-104
All show high r 2 (>0.8) demonstrating that results are consistent from event to event. Average value is appropriate to use.
0
0.1
0.2
0.3
0.4
0.5
0.6
0.7
0.8
0.9
1
May-16 Jun-16 Aug-16 Nov-16 Feb-17 May-17 Jun-17 Aug-17 Oct-17
Frac
tiona
l Con
cent
ratio
n
MW-3-104 CCR Event Histogram
ALK B Ca Cl Li Mo SO4 Mg + K Na(Normalized to Sum)

FALCON SUMMARYALTERNATIVE SOURCE DEMONSTRATION
ASH LANDFILL 3MONTOUR, LLC
WASHINGTONVILLE, PA
5/16/2016 6/27/2016 8/16/2016 11/7/2016 2/14/2017 5/18/2017 6/21/2017 8/10/2017 10/10/2017Alkalinity, total as CaCO3 (mg/L) 169 172 161 151 157 159 158 162 158Boron, total (µg/L) 104 105 103 112 118 126 104 113 114Calcium, total (mg/L) 55 54 52 52 57 61 58 56 52Chloride, total as Cl (mg/L) 34.7 35.0 37.3 39.6 35.2 42.6 37.4 36.7 38.3Lithium, total (µg/L) 62.9 55.2 60.5 55.5 62.5 54.5 59.9 65.3 73.6Molybdenum, total (µg/L) 5.7 5.1 3.6 3.6 5.4 5.4 5.9 6.4 4.3Sulfate, as SO4 (mg/L) 53 53 45 47 52 52 52 51 50Magnesium + Potassium (mg/L) 21.9 21.9 21.5 20.6 23.5 23.4 22.2 23.1 22.5Sodium, Total (mg/L) 19.5 19.5 20.3 18.1 20.7 20.4 17.4 19.5 20.8
Sum of Constituents 524.9 520.4 504.1 499.3 530.8 543.9 514.7 533.0 533.7
5/16/2016 6/27/2016 8/16/2016 11/7/2016 2/14/2017 5/18/2017 6/21/2017 8/10/2017 10/10/20175/16/2016 1.0000 6/27/2016 0.9985 1.0000 8/16/2016 0.9983 0.9970 1.0000 11/7/2016 0.9909 0.9909 0.9944 1.0000 2/14/2017 0.9918 0.9902 0.9936 0.9981 1.0000 5/18/2017 0.9825 0.9845 0.9867 0.9977 0.9958 1.0000 6/21/2017 0.9982 0.9970 0.9976 0.9950 0.9953 0.9896 1.0000 8/10/2017 0.9967 0.9943 0.9978 0.9972 0.9984 0.9917 0.9982 1.0000
10/10/2017 0.9915 0.9859 0.9941 0.9935 0.9955 0.9855 0.9926 0.9972 1.0000 Average r2= 0.9950
Notes: values less than 0.80 r 2
Figure 8. MW-1-9 (Background Location for Basin 1)
Analytical Data
Regression Analysis Comparison
All show high r 2 (>0.8) demonstrating that results are consistent from event to event. Average value is appropriate to use.
0
0.1
0.2
0.3
0.4
0.5
0.6
0.7
0.8
0.9
1
May-16 Jun-16 Aug-16 Nov-16 Feb-17 May-17 Jun-17 Aug-17 Oct-17
Frac
tiona
l Con
cent
ratio
n
MW-1-9 CCR Event Histogram
ALK B Ca Cl Li Mo SO4 Mg + K Na(Normalized to Sum)

FALCON SUMMARYALTERNATIVE SOURCE DEMONSTRATION
ASH LANDFILL 3MONTOUR, LLC
WASHINGTONVILLE, PA
PZ-3-31 MW-3-100 MW-3-101 MW-3-102 LD-3-1 MW-3-103 MW-3-104 MW-1-9Alkalinity, total as CaCO3 (mg/L) 31 257 106 278 162 291 43 161Boron, total (µg/L) 39 81 38 136 10208 101 36 111Calcium, total (mg/L) 117 172 91 122 542 127 23 55Chloride, total as Cl (mg/L) 3.9 4.1 3.4 7.9 155.9 4.3 1.9 37.4Lithium, total (µg/L) 6.6 11.5 5.2 18.9 1895.6 23.2 20.8 61.1Molybdenum, total (µg/L) 1.7 20.1 13.1 5.2 2247.8 2.2 1.8 5.0Sulfate, as SO4 (mg/L) 349 261 160 169 2919 131 110 51Magnesium + Potassium (mg/L) 17.1 19.2 11.7 34.8 197.3 21.2 13.3 22.3Sodium, Total (mg/L) 12.4 18.5 6.8 15.3 678.3 21.6 27.2 19.7
Sum of Constituents 576.9 844.7 434.0 787.3 19005.1 722.9 277.5 522.8
MW-3-103 MW-3-104 MW-1-9 LD-3-1MW-3-103 1.0000MW-3-104 0.5100 1.0000MW-1-9 0.8600 0.3000 1.0000LD-3-1 0.0300 0.2200 0.3000 1.0000MW-3-100 0.8900 0.7700 0.6100 0.0100MW-3-101 0.7600 0.8500 0.4400 0.0300MW-3-102 0.9800 0.6200 0.8500 0.1600
PZ-3-31 0.3300 0.9100 0.0200 0.1000
Notes: values greater than 0.80 r 2
Leachate (LD-1) fingerprint shows no correlation with any of the CCR wells (upgradient or downgradient). Background well (MW-1-9, MW-3-103, and MW-3-104) fingerprints do not correlate well with each other.
Figure 9. All Wells
Averaged Analytical Data by Well
Upgradient Wells and Leachate
Downgradient Wells
Regression Analysis Between Averaged Well Fingerprints
0.000
0.100
0.200
0.300
0.400
0.500
0.600
0.700
0.800
0.900
1.000
PZ3-31 MW-3-100 MW-3-101 MW-3-102 LD-3-1 MW-3-103 MW3-104 MW-1-9
Frac
tiona
l Con
cent
ratio
n
Averaged Fingerprints of All Wells
Alk B Ca Cl Li Mo SO4 Mg+K Na(Normalized to Sum)

APPENDIX B
AREA 3 TIME TREND PLOTS

Talen EnergyMontour - Area No. 3 CCR - September 2018 Event
Boron, total [ug/l]
0
100
200
300
400
500
600
MW-3-100
MW-3-101
MW-3-102
MW-3-103 (BG)
MW-3-104 (BG)
PZ3-31

Talen EnergyMontour - Area No. 3 CCR - September 2018 Event
Calcium, total [mg/l]
0
50
100
150
200
250
300
350
MW-3-100
MW-3-101
MW-3-102
MW-3-103 (BG)
MW-3-104 (BG)
PZ3-31

Talen EnergyMontour - Area No. 3 CCR - September 2018 Event
Chloride, total as Cl [mg/l]
0
2
4
6
8
10
12
14
16
18
20
MW-3-100
MW-3-101
MW-3-102
MW-3-103 (BG)
MW-3-104 (BG)
PZ3-31

Talen EnergyMontour - Area No. 3 CCR - September 2018 Event
Fluoride, total as F [mg/l]
0.0
0.1
0.2
0.3
0.4
0.5
0.6
MW-3-100
MW-3-101
MW-3-102
MW-3-103 (BG)
MW-3-104 (BG)
PZ3-31

Talen EnergyMontour - Area No. 3 CCR - September 2018 Event
pH, lab [s.u.]
3.0
3.5
4.0
4.5
5.0
5.5
6.0
6.5
7.0
7.5
8.0
MW-3-100
MW-3-101
MW-3-102
MW-3-103 (BG)
MW-3-104 (BG)
PZ3-31

Talen EnergyMontour - Area No. 3 CCR - September 2018 Event
Sulfate, as SO4 [mg/l]
0
100
200
300
400
500
600
700
800
MW-3-100
MW-3-101
MW-3-102
MW-3-103 (BG)
MW-3-104 (BG)
PZ3-31

Talen EnergyMontour - Area No. 3 CCR - September 2018 Event
Total Dissolved Solids [mg/l]
0
200
400
600
800
1000
1200
1400
MW-3-100
MW-3-101
MW-3-102
MW-3-103 (BG)
MW-3-104 (BG)
PZ3-31

Talen EnergyMontour - Area No. 3 CCR - September 2018 Event
pH, field [s.u.]
3.0
3.5
4.0
4.5
5.0
5.5
6.0
6.5
7.0
7.5
8.0
MW-3-100
MW-3-101
MW-3-102
MW-3-103 (BG)
MW-3-104 (BG)
PZ3-31