MONTHLY TRADING BULLETIN - bahrainbourse.com · €BATELCO €ALBH 2,944,089,290 1,088,021,271...
14
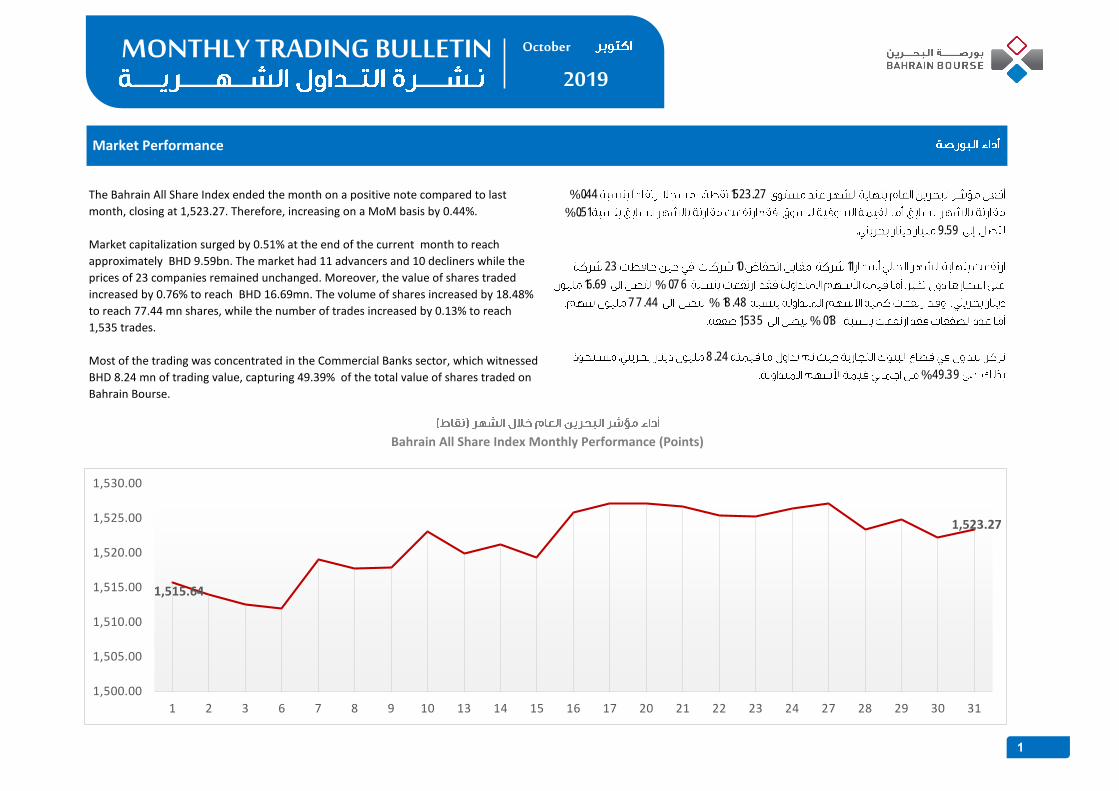
اكتوبرOctober Bahrain All Share Index Monthly Performance (Points) Market Performance The Bahrain All Share Index ended the month on a positive note compared to last month, closing at 1,523.27. Therefore, increasing on a MoM basis by 0.44%. Market capitalization surged by 0.51% at the end of the current month to reach approximately BHD 9.59bn. The market had 11 advancers and 10 decliners while the prices of 23 companies remained unchanged. Moreover, the value of shares traded increased by 0.76% to reach BHD 16.69mn. The volume of shares increased by 18.48% to reach 77.44 mn shares, while the number of trades increased by 0.13% to reach 1,535 trades. Most of the trading was concentrated in the Commercial Banks sector, which witnessed BHD 8.24 mn of trading value, capturing 49.39% of the total value of shares traded on Bahrain Bourse. 1523.27 0.44 % 0.51 % 9.59 11 10 23 0.76 % 16.69 18.48 % 77.44 0.13 % 1,535 8.24 49.39 % 1,515.64 1,523.27 1,500.00 1,505.00 1,510.00 1,515.00 1,520.00 1,525.00 1,530.00 1 2 3 6 7 8 9 10 13 14 15 16 17 20 21 22 23 24 27 28 29 30 31 1 MONTHLY TRADING BULLETIN October 2019
Transcript of MONTHLY TRADING BULLETIN - bahrainbourse.com · €BATELCO €ALBH 2,944,089,290 1,088,021,271...
اكتوبر
October
Bahrain All Share Index Monthly Performance (Points)
Market Performance
The Bahrain All Share Index ended the month on a positive note compared to last
month, closing at 1,523.27. Therefore, increasing on a MoM basis by 0.44%.
Market capitalization surged by 0.51% at the end of the current month to reach
approximately BHD 9.59bn. The market had 11 advancers and 10 decliners while the
prices of 23 companies remained unchanged. Moreover, the value of shares traded
increased by 0.76% to reach BHD 16.69mn. The volume of shares increased by 18.48%
to reach 77.44 mn shares, while the number of trades increased by 0.13% to reach
1,535 trades.
Most of the trading was concentrated in the Commercial Banks sector, which witnessed
BHD 8.24 mn of trading value, capturing 49.39% of the total value of shares traded on
Bahrain Bourse.
1523.270.44%
0.51%
9.59
111023
0.76%16.69
18.48%77.44
0.13%1,535
8.24
49.39%
1,515.64
1,523.27
1,500.00
1,505.00
1,510.00
1,515.00
1,520.00
1,525.00
1,530.00
1 2 3 6 7 8 9 10 13 14 15 16 17 20 21 22 23 24 27 28 29 30 31
1
MONTHLY TRADING BULLETIN October
2019

13.91
-7.51
Bahrain Bourse Indices
Index (Current Month)Index
(Previous Month)Change (Points) MOM Change (%) YTD Change (%)
% %
Bahrain Islamic Index 761.25 750.12 11.13 1.48
Bahrain All Share Index 1,523.27 1,516.53 6.74 0.44
23 19 4
725,470
Total Trading Days
Average Value of Shares (BD) 871,543 -146,073
Daily Trading Averages
%
21.05
-16.76
Current Month Previous Month Change Change (%)
Trading Summary Market Breadth
3,366,762
67
Average Volume of Shares
Average no. of transactions
3,439,890
81
-73,128
-14
-2.13
-17.28
Market Capitalization (US $)
Value of Shares Traded (BD)
Volume of Shares Traded
Number of Transactions
Market Capitalization (BD) 9,587,605,255
25,431,313,674
16,685,811
77,435,518
1,535
11
10
23
0
44
Advancers
Decliners
Unchanged
IPO
Total Companies
2
MONTHLY TRADING BULLETIN October
2019

3,950,671 31,150,5332,769,729 12,903,367
2,496,194 11,727,399
1,712,222 4,527,581
1,206,257 4,439,065
Total 12,135,072 Total 64,747,945
% Top Advancers & Top Decliners (%)
BBK
BATELCO
SALAM
23.6816.60
14.96
10.26
7.23
Market at a Glance
Most Active Companies
In Terms of Value In Terms of Volume
% From Total
MarketValue (BD)Company
AUBGFH 16.66
15.14
5.85
5.73
72.73
Company Volume% From Total
Market
83.62
GFHSALAM
AUB
BBK
BATELCO
40.23
11.36%
5.49% 5.06% 4.90%3.09%
-3.13%
-8.00% -8.11%-10.00%
-19.92%(0.25)
(0.20)
(0.15)
(0.10)
(0.05)
0.00
0.05
0.10
0.15
APMTB SALAM BNH ZAINBH BARKA BKIC KHCB BANADER BASREC NHOTEL
3
MONTHLY TRADING BULLETIN October
2019
Total
11.357.51
6.75
6.31
62.62
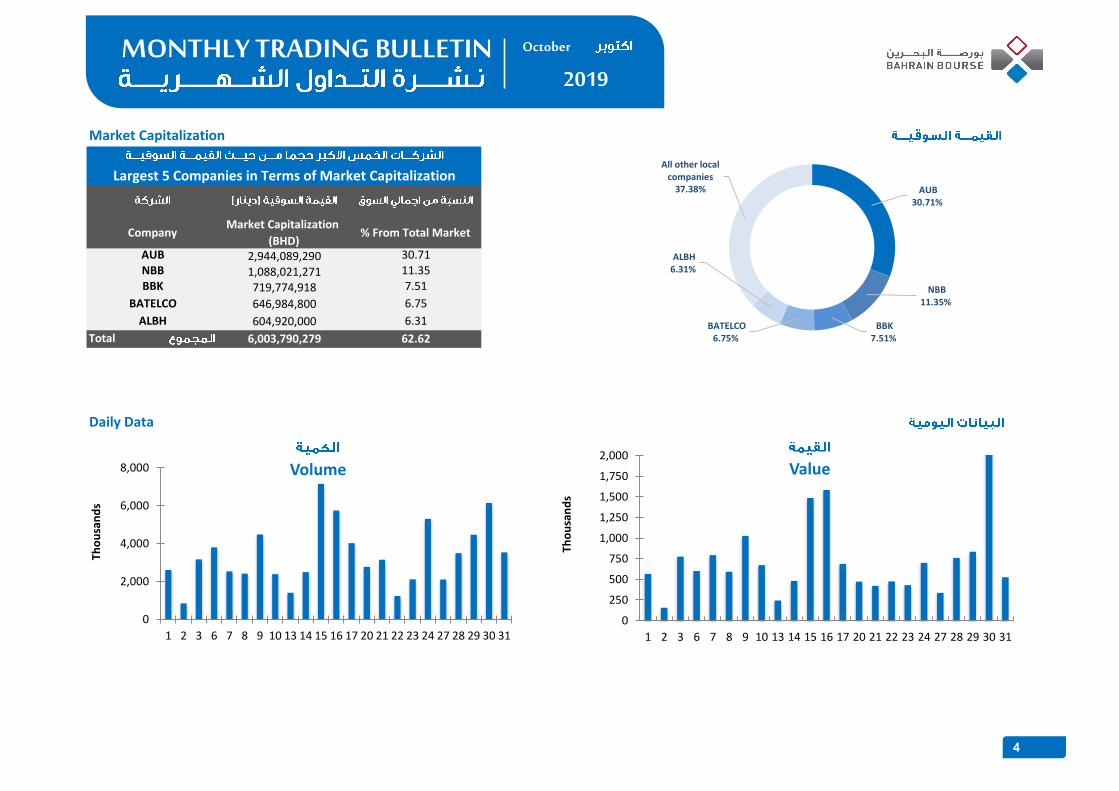
Daily Data
AUB NBB BBK
BATELCO
ALBH
2,944,089,2901,088,021,271719,774,918
646,984,800
604,920,000
Market Capitalization
Largest 5 Companies in Terms of Market Capitalization
CompanyMarket Capitalization
(BHD)% From Total Market
6,003,790,279
30.71
AUB 30.71%
NBB 11.35%
BBK 7.51%
BATELCO 6.75%
ALBH 6.31%
All other local companies
37.38%
4
MONTHLY TRADING BULLETIN October
2019
0
250
500
750
1,000
1,250
1,500
1,750
2,000
1 2 3 6 7 8 9 10 13 14 15 16 17 20 21 22 23 24 27 28 29 30 31
Tho
usa
nd
s
Value
0
2,000
4,000
6,000
8,000
1 2 3 6 7 8 9 10 13 14 15 16 17 20 21 22 23 24 27 28 29 30 31
Tho
usa
nd
s
Volume

.
Total 77,435,518 16,685,811 1,535
31/10/2019 1,523.27 3,537,397 525,903 47
29/10/2019 1,524.77 4,463,567 834,454 85
30/10/2019 1,522.14 6,146,320 2,053,925 53
27/10/2019 1,527.13 2,107,527 336,094 46
28/10/2019 1,523.32 3,497,273 761,847 64
23/10/2019 1,525.18 2,113,522 430,358 38
24/10/2019 1,526.44 5,305,294 700,391 88
21/10/2019 1,526.64 3,147,636 421,030 48
22/10/2019 1,525.30 1,233,943 477,396 50
17/10/2019 1,527.12 4,028,636 688,313 100
20/10/2019 1,527.13 2,772,916 472,613 65
15/10/2019 1,519.37 7,153,693 1,487,701 10416/10/2019 1,525.85 5,748,713 1,582,897 88
13/10/2019 1,519.85 1,406,947 244,109 48
14/10/2019 1,521.20 2,499,098 481,640 67
09/10/2019 1,517.92 4,485,095 1,027,833 75
10/10/2019 1,523.04 2,397,282 674,022 84
07/10/2019 1,519.04 2,538,444 794,280 63
08/10/2019 1,517.72 2,419,952 592,387 70
03/10/2019 1,512.55 3,166,832 775,496 64
06/10/2019 1,511.99 3,805,701 601,283 84
50565,9362,608,2911,515.6401/10/201902/10/2019 1,513.93 851,439 155,901 54
Bahrain Bourse Daily Data for the Month
Trading Dates Bahrain All Share Index Volume of Shares Traded Value of Shares Traded No. of Transactions
5
MONTHLY TRADING BULLETIN October
2019

Hotels & Tourism 2,255.38 2,378.12 (122.74) (5.16)
18.84
(28.58)
(15.77)
Services 1,445.39 1,425.62 19.77 1.39
Industrial 686.27 706.87 (20.60) (2.91)
(14.37)
Commercial Banks 3,571.17 3,537.67 33.50 0.95
Investment 703.01 702.48 0.53 0.08
Insurance 1,387.18 1,385.94 1.24 0.09
%
(%) YTD Change
28.93
4.95
Previous MonthCurrent Month
Trading by Nationality
Sectors at a Glance
Indices (Points)
Sectors
(%) MOM Change
%
MOM Change (points)
Bahraini
بحريني77.27%
Other Nationalities
أخرىجنسيات
22.73%
Volume
Bahraini
بحريني70.29%
Other Nationalities
أخرىجنسيات
29.71%
Value
6
MONTHLY TRADING BULLETIN October
2019

0.00
0.00
Total Market 16,685,811 16,559,310 0.76 100
0.853,745,155 3,540,529
0.00
NM
0
109,076
0
0
141,663 68,953 105.45
161,678 80,000 102.10
1.32
0.97
Commercial Banks 8,241,324 10,326,771 (20.19) 49.39
Investment 3,554,994 1,901,019 87.00 21.31
Sectors
%%
Current Month Previous Month (%) MOM ChangeWeight from Current
Month (%)
5.78 22.45840,997 532,963 57.80 5.04
Total Market 9,587,605,255 9,538,604,827 0.51 100
Hotels & Tourism
Trading Value (BD)
1.010.220.091.39(2.91)
54.3923.291.40
13.136.47
5,214,706,9682,233,164,861134,195,150
1,258,879,278620,356,626
126,302,371
5,162,520,9762,228,206,325134,075,875
1,241,653,078638,972,673
133,175,901
%
(%) MOM Change
(5.16)
Market Capitalization (BD)
Sectors %
Weight from Current
Month (%)Current Month Previous Month
Commercial BanksInvestmentInsuranceServices
Industrial
InsuranceServices
IndustrialHotels & Tourism
Non-Bahraini
Closed
7
MONTHLY TRADING BULLETIN October
2019

11.621,972,299 1,225,964 60.88 2.55
Hotels & Tourism 492,792 199,210 147.37 0.64
Commercial Banks 32,371,920 36,169,095 (10.50) 41.81Investment 33,080,974 17,278,625 91.46
9,001,365 9,857,862 (8.69)
Trading Volume (Shares)
ServicesIndustrial
Total Market
Sectors
%%
Current Month Previous Month (%) MOM ChangeWeight from Current
Month (%)
42.72Insurance 516,168 262,352 96.75 0.67
Non-Bahraini 0 0 0.00 0.00
Closed 0 364,802 NM 0.00
77,435,518 65,357,910 18.48 100
Number of Transactions
Sectors
%%
Current Month Previous Month (%) MOM ChangeWeight from Current
Month (%)Commercial Banks 677 797 (15.06) 44.10
Investment 192 231 (16.88) 12.51Insurance 28 21 33.33 1.82
Services 467 419 11.46 30.42
Industrial 126 51 147.06 8.21
Hotels & Tourism 45 13 246.15 2.93
Total Market 1,535 1,533 0.13 100
Non-Bahraini 0 0 0.00 0.00
Closed 0 1 NM 0.00
8
MONTHLY TRADING BULLETIN October
2019

AUB 11,727,399 3,950,671 199 $0.890 0.010 $0.250 $0.905 $0.870 19
SALAM 12,903,367 1,206,257 234 BHD 0.096 0.005 BHD 0.100 BHD 0.098 BHD 0.090 23
BISB 1,353,371 164,565 29 BHD 0.122 0.000 BHD 0.100 BHD 0.123 BHD 0.120 15
BBK 4,527,581 2,496,194 120 BHD 0.555 0.010 BHD 0.100 BHD 0.555 BHD 0.540 23
ITHMR 619,960 15,230 14 $0.063 (0.002) $0.250 $0.063 $0.063 9
KHCB 704,819 32,870 33 BHD 0.046 (0.004) BHD 0.100 BHD 0.049 BHD 0.045 11
NBB 535,423 375,539 48 BHD 0.705 0.001 BHD 0.100 BHD 0.705 BHD 0.700 19
32,371,920 8,241,324 677
BARKA 401,436 44,874 25 $0.300 0.009 $1.000 $0.300 $0.292 8
ABC 755,760 133,307 13 $0.469 0.003 $1.000 $0.469 $0.466 9
BCFC 713,274 588,449 41 BHD 0.825 0.000 BHD 0.100 BHD 0.827 BHD 0.820 16
BMB 0 0 0 $0.043 0.000 $0.250 - - 0
ESTERAD 57,749 9,379 11 BHD 0.162 0.000 BHD 0.100 BHD 0.162 BHD 0.162 6
GFH 31,150,533 2,769,729 101 $0.236 (0.002) $0.265 $0.238 $0.232 21
INOVEST 0 0 0 $0.235 0.000 $0.400 - - 0
INVCORP 2,222 9,257 1 $11.050 0.000 $2.500 $11.050 $11.050 1
TAIB 0 0 0 $2.740 0.000 $1.000 - - 0
UGH 0 0 0 $1.240 0.000 $0.500 - - 0
UGIC 0 0 0 BHD 0.100 0.000 BHD 0.100 - - 0
33,080,974 3,554,994 192
Monthly Trading Activity
SYMBOLTotal Volume
of Shares
Traded
COMPANY
Ahli United Bank
Al Salam Bank
Bahrain Islamic Bank
BBK
Ithmaar Holding B.S.C.
Total Value of
Shares Traded
No. of
TransactionsClosing Price Change MoM Par Value High Low
No. of Trading
Days
INOVEST
Investcorp Holding
Taib Bank
United Gulf Holding Company
United Gulf Investment Co.
Investment Sector
Khaleeji Commercial Bank
National Bank of Bahrain
Commercial Banks Sector
Al Baraka Banking Group
Arab Banking Corporation
Bahrain Commercial Facilities Co.
Bahrain Middle East Bank
Esterad Investment Co.
GFH Financial Group
9
MONTHLY TRADING BULLETIN October
2019

SOLID 0 0 0 BHD 0.220 0.000 BHD 0.100 - - 0
ARIG 15,863 1,549 3 $0.285 0.000 $1.000 - - 1
BKIC 180,004 55,762 9 BHD 0.310 (0.010) BHD 0.100 BHD 0.310 BHD 0.310 6
BNH 320,301 84,352 16 BHD 0.270 0.013 BHD 0.100 BHD 0.270 BHD 0.260 10
TAKAFUL 0 0 0 BHD 0.090 0.000 BHD 0.100 - - 0
516,168 141,663 28
APMTB 626,686 729,135 73 BHD 1.225 0.125 BHD 0.100 BHD 1.240 BHD 1.095 20
CPARK 56,834 7,045 6 BHD 0.122 0.000 BHD 0.100 BHD 0.122 BHD 0.122 3
CINECO Bahrain Cinema Co. 92,757 68,149 15 BHD 0.750 0.000 BHD 0.100 BHD 0.750 BHD 0.690 6
DUTYF Bahrain Duty Free Shop Complex 810,203 626,819 15 BHD 0.780 0.000 BHD 0.100 BHD 0.780 BHD 0.766 9
BASREC Bahrain Ship Repairing & Eng. Co. 12,672 13,344 5 BHD 1.053 (0.117) BHD 0.100 BHD 1.053 BHD 1.053 2
BATELCO Bahrain Telecommunications Co. 4,439,065 1,712,222 142 BHD 0.389 0.004 BHD 0.100 BHD 0.389 BHD 0.383 23
BMMI BMMI 239,796 189,469 16 BHD 0.792 0.000 BHD 0.100 BHD 0.792 BHD 0.790 5
NASS Nass Corporation BSC. 799,559 77,482 35 BHD 0.096 (0.003) BHD 0.100 BHD 0.099 BHD 0.094 11
SEEF Seef Properties 1,241,906 249,755 126 BHD 0.202 0.001 BHD 0.100 BHD 0.202 BHD 0.200 23
TRAFCO Trafco Group 4,451 1,347 3 BHD 0.310 0.000 BHD 0.100 - - 2
ZAINBH Zain Bahrain 677,436 70,389 31 BHD 0.107 0.005 BHD 0.100 BHD 0.107 BHD 0.102 15
Services Sector 9,001,365 3,745,155 467
ALBH Aluminium Bahrain 1,903,804 823,677 113 BHD 0.426 (0.013) BHD 0.100 BHD 0.438 BHD 0.426 19
BFM Bahrain Flour Mills Co. 10,225 3,260 5 BHD 0.320 0.000 BHD 0.100 - - 4
POLTRY Delmon Poultry Co. 58,270 14,060 8 BHD 0.240 (0.005) BHD 0.100 BHD 0.245 BHD 0.240 4
Industrial Sector 1,972,299 840,997 126
APM Terminals Bahrain B.S.C.
Arab Insurance Group
Total Volume
of Shares
Traded
Total Value of
Shares Traded
No. of
TransactionsClosing Price Change MoM Par Value High Low
No. of Trading
Days
SYMBOL COMPANY
Solidarity Bahrain
Insurance Sector
Bahrain Kuwait Insurance Co.
Bahrain National Holding
Takaful International Co.
Bahrain Car Parks Co.
10
MONTHLY TRADING BULLETIN October
2019

FAMILY Bahrain Family Leisure Co. 1,214 89 1 BHD 0.081 0.000 BHD 0.100 - - 1
BANADER Banader Hotels Co. 75,746 2,661 6 BHD 0.034 (0.003) BHD 0.100 BHD 0.034 BHD 0.034 4
GHG Gulf Hotels Group 380,373 151,659 27 BHD 0.400 0.000 BHD 0.100 BHD 0.403 BHD 0.396 8
NHOTEL National Hotels Co. 35,459 7,269 11 BHD 0.205 (0.051) BHD 0.100 BHD 0.205 BHD 0.205 1
Hotel & Tourism Sector 492,792 161,678 45
BMUSC Bank Muscat 0 0 0 BHD 0.915 0.000 OMR 0.100 - - 0
Non-Bahraini Companies 0 0 0
SICO-C SICO B.S.C. 0 0 0 BHD 0.155 0.000 BHD 0.100 - - 0
UPI United Papers Industries 0 0 0 BHD 0.299 0.000 BHD 0.100 - - 0
Closed Companies 0 0 0
Total Market 77,435,518 16,685,811 1,535
Total Value of
Shares Traded
No. of
TransactionsClosing Price Change MoM Par Value High Low
No. of Trading
Days
SYMBOL COMPANYTotal Volume
of Shares
Traded
11
MONTHLY TRADING BULLETIN October
2019

10.72 5.62 0.13
11.03 3.65 0.57
11.27 0.00 0.13
9.91 7.21 0.35
NM 0.00 0.02
66.67 0.00 0.07
14.10 3.55 0.03
11.90 5.06 0.16
Al Baraka Banking Group 3.78 10.00 0.03
Arab Banking Corporation 6.70 6.40 0.02
Bahrain Commercial Facilities Co. 5.81 5.45 0.35
Bahrain Middle East Bank 5.31 0.00 0.00
Esterad Investment Co. 46.42 0.00 0.04
GFH Financial Group 7.33 3.39 0.85
INOVEST 4.75 8.51 0.00
Investcorp Holding 7.52 2.71 0.00
Taib Bank NM 0.00 0.00
United Gulf Holding Company B.S.C 139.96 0.00 0.00
United Gulf Investment Co. NM 0.00 0.00
Investment Sector 8.03 3.63 0.16
2.22
1.35
7.51
0.75
0.50
11.35
54.39
2,944,089,290
212,722,879
129,815,148
719,774,918
71,983,463
48,300,000
1,088,021,271
5,214,706,968
0.21
549,888,430
1.76
0.18
0.24
3.42
0.26
3.48
1.21
5.34
30.71
1.47
5.74
2,215,863,320
1,064,058,587
1,296,891,745
3,030,755,027
1,050,000,000
1,543,292,583
18,975,305,543
8,774,444,2811.73
0.69
1.10
1.44
1.58
0.43
2.29
1.60
0.38
1,242,879,755
3,110,000,000
Commercial Banks Sector
Financial Ratios
Company/SectorP/E Ratio
(Times)
%
Dividend
Yield
Price to Book Value
(Times)
%
Share
Turnover
Issued and Fully Paid
Shares
Weight from Total
Market Capitalisation
(%)
Total Market Capitalisation (BD)
0.66
200,000,000
9,870,566,068
168,454,688
17,200,000
22,680,000
327,563,803
25,383,462
333,268,000
116,068,211
512,088,567
20,000,000
2,233,164,861
Ahli United Bank
Al Salam Bank
Bahrain Islamic Bank
BBK
Ithmaar Holding B.S.C.
Khaleeji Commercial Bank
National Bank of Bahrain
140,569,700
204,187,500
400,000,000
140,000,000
3,681,650,441
286,511,225
80,000,000
112,362,496
412,974,651
0.24
23.29
1.14
0.56
0.70
0.76
0.49
0.72
NM
3.73
0.68
12
MONTHLY TRADING BULLETIN October
2019

11.45 5.68 0.00
NM 0.00 0.01
14.09 4.84 0.13
9.18 5.56 0.26
10.54 0.00 0.00
11.58 4.10 0.11
10.56 8.90 0.66
12.20 4.10 0.05
14.15 6.67 0.11
14.72 6.41 0.56
6.27 4.75 0.06
12.92 7.07 0.26
12.98 6.31 0.16
4.85 5.21 0.37
8.51 7.43 0.27
12.92 5.81 0.01
7.64 4.67 0.18
11.70 6.91 0.30
10.14 0.00 0.14
6.67 3.13 0.04
18.46 2.08 0.19
10.06 0.07 0.14Industrial Sector 0.56 1,476,041,777 620,356,626 6.47
Bahrain Flour Mills Co. 0.42 24,832,500 7,946,400 0.08
Delmon Poultry Co. 0.57
39,376,000 0.41368,000,000
0.74 0.22
Bahrain Telecommunications Co. 1.39 1,663,200,000 646,984,800 6.75
BMMI 1.62 146,428,549 115,971,411 1.21
31,209,277 7,490,226 0.08
Services Sector 1.21 3,383,316,219 1,258,879,278 13.13
Aluminium Bahrain 0.56 1,420,000,000 604,920,000 6.31
Trafco Group 0.93 80,675,052 25,009,266 0.26
Zain Bahrain 0.55
Company/SectorP/E Ratio
(Times)
Dividend
Yield
Price to Book Value
(Times)
Share
Turnover
Issued and Fully Paid
SharesTotal Market Capitalisation (BD)
Weight from Total
Market Capitalisation
(%)
0.14
Bahrain Cinema Co. 0.79 82,623,450 61,967,588 0.65
Bahrain Duty Free Shop Complex 2.17 142,271,938 110,972,112 1.16
0.34
Takaful International Co. 0.83 85,000,000 7,650,000 0.08
Insurance Sector 0.67 687,175,000 134,195,150 1.40
0.28
Arab Insurance Group 0.29 220,000,000 23,637,900 0.25
Bahrain Kuwait Insurance Co. 1.23 143,000,000 44,330,000 0.46
19,800,000
0.34 220,000,000 21,120,000 0.22
Seef Properties 0.62 460,000,000 92,920,000 0.97
20,849,400
1.15
% %
Solidarity Bahrain B.S.C 1.02 120,000,000 26,400,000
Bahrain National Holding 0.62 119,175,000 32,177,250
Bahrain Car Parks Co. 1.00 110,317,230 13,458,702
4.72 90,000,000 110,250,000APM Terminals Bahrain B.S.C.
Bahrain Ship Repairing & Eng. Co.
Nass Corporation
13
MONTHLY TRADING BULLETIN October
2019

Bahrain Family Leisure Co. NM 0.00 0.49
Banader Hotels Co. NM 0.00 1.10
Gulf Hotels Group 12.90 7.50 0.79
National Hotels Co. 20.50 0.00 0.30
Hotel & Tourism Sector 14.29 5.39 0.60
Total Market 10.63 4.64 1.05
N/A: Not Available N/A
NM: Not Meaningful NM
Gulf Securities Company 601 19.58
TAIB Securities 0 0.00
SICO B.S.C. (C ) 1,403 45.70
Al Ahlia Bahrain B.S.C 195 6.35
Ahli United Bank 76 2.48
Global Investment House 0 0.00
BBK 249 8.11
Mubasher Financial Services 248 8.08
United Gulf Bank B.S.C 5 0.16
Tradeline Securities W.L.L 4 0.13
Abdulla J. Zain Al-Abedeen 58 1.89
Nasser Abbas Khosrou 231 7.52
3,070 100
Total Value (BD)
10,997,282
0
Brokers
Weight from Total Market
Capitalisation (%)
0.03
0.08
0.94
0.26
1.32
100
Issued and Fully Paid
Shares
Total Market
Capitalisation (BD)
3,240,000
7,803,051
90,397,945
24,861,375
126,302,371
40,000,000
616,771,363
35,009,175,970
0.00
4.44
4.99
0.05
0.01
1.32
1.76
100.00
71,555,755
7,611,678
1,972,319
0
9,188,167
5,510,629
32.95
Weight from Total
Market (%)
0.00
46.20
4.91
1.27
0.00
5.93
2.46
100
588,684
33,371,622Total Brokers Activity
15,993,658
1,469,577
709,665
0
1,483,240
1,665,405
18,322
4,934
440,856
3,802,683
154,871,036
34.04
0.00
47.93
4.40
2.13
0
Weight from Total
Market (%)Total Volume (Shares)
52,713,415
54,000
66,122
2,396,268
3.56
0.03
0.04
1.55
Weight from Total
Market (%)No. of Transactions
0.13
0.17 9,587,605,255
229,501,500
225,994,863
121,275,000
0.03
0.17
0.03
Company/SectorP/E Ratio
(Times)
%
Dividend
Yield
Price to
Book
Value
(Times)
%
Share Turnover
0.00
Brokers Activity (Buy & Sell)
14
MONTHLY TRADING BULLETIN October
2019