![Monthly Monetary Trends [St. Louis Fed]](https://static.fdocuments.us/doc/165x107/577d21cc1a28ab4e1e95e8c6/monthly-monetary-trends-st-louis-fed.jpg)
MONTHLY REVIEW - Minneapolis Fed
8
MILLION DOLLARS 1600 1200 800 400 0 17-- L.. 1939 40 41 `MUTUAL SAVINGS BK. DEPOSITS I L J J 1 1 42 '43 44 '45 '46 '47 '48 '49 US. SAVING S ' . ;01*.EOMMERCIAL BANK TIME DEPOSITS ,, .,'? SAVITHSAR A.E180/ :.N .,,,r0SIA AV /NGS LIFE INSURANCE LQUIjIE LONG-TERM LIQUID SAVINGS OF INDIVIDUALS Ninth District States, 1939-49* ALL MAJOR FORMS of savings have grown substantially in the last 10 years. By the end of 1949 their total topped $5 billion. *Includes Minnesota, Montana, North Dakota and South Dakota, Val. 10 MONTHLY REVIEW of Ninth District Agricultural and Business Conditions FEDERAL RESERVE BANK OF MINNEAPOLIS JULY 31, 1950 9 g4at. Serial No. 7 District Savings Quadruple in Decade At Year-End, Ninth District Residents Had Bulk of Nest-Egg in U. S. Savings Bonds, Life Insurance Equities, and Bank Time Deposits FELLING increased financial se- curity as well as potential buying power, a record backlog of savings has been amassed by people of the Ninth district in the last decade. That there has been a savings bonanza—even while we were pur- chasing more goods and services than ever before—is shown by an analysis of individuals' long-term liquid sav- ings in financial institutions and in holdings of U. S. savings bonds.* At the end of 1949, residents of the Ninth district had accumulated an estimated $5,158,000,000 in com- mercial and mutual savings bank time deposits, life insurance equities, share capital of savings and loan associa- tions, postal savings, and U. S. sav- ings bonds.' Of the district total, Minnesota savers had claim to $3,374,000,000, North Dakotans owned $634,000,000, South Dakotans $583,000,000, and Montanans $568,000,000' Per capita figures—savings divided by population----showed average hold- ings per Ninth district citizen to be $1,086 at the end of last year. In Min- nesota the average per individual was $1,133, in Montana $1,089, in North Dakota $1,047, and in South Dakota $899. For the United States the per capita estimate of individuals' long-term liquid savings last year was $1,137. RATE OF SAVING SLACKENED IN POSTWAR Every year since 1939, total accu- mulated long-term savings have scaled a new peak. However, since *For a more detailed discussion of U. S. Sav- ing bonds, see Monthly Review, Federal Reserve Hank of Minneapolis, May 31, 1959, p. 49. Estimates of long-term liquid savings in the four complete states in the Ninth district were prepared by the Research department of the Federal Reserve Bank of Minneapolis. Detailed sources may be obtained upon request. Estimates for the portions of Michigan and Wisconsin included in the Ninth district are not available. 'State figures do not necessarily add to dis- trict totals because of rounding. By JUDITH A. WEISS the end of World War II the yearly net additions to the savings pile have fallen off steadily. In other words, while savings have continued to grow without pause, the rate of increase has been slowing down. This was what most observers ex- petted. As a matter of fact, it was predicted that after the war the rate of saving would fall off far more rapidly than it has. Incomes jumped dramatically dur- ing the war, while goods were scarce. Consequently, savings grew at an astronomical pace as people laid away idle funds in financial institutions and to an even greater extent in U. S.
Transcript of MONTHLY REVIEW - Minneapolis Fed

MILLIONDOLLARS
1600
1200
800
400
0 17-- L..
1939 40 41
`MUTUAL SAVINGS BK. DEPOSITSI L J J 1 1 42 '43 44 '45 '46 '47 '48 '49
US. SAVING S
'.;01*.EOMMERCIAL BANK TIME DEPOSITS
,,
.,'? SAVITHSARA.E180/:.N.,,,r0SIA AV /NGS
LIFE INSURANCELQUIjIE
LONG-TERM LIQUID SAVINGS OF INDIVIDUALSNinth District States, 1939-49*
ALL MAJOR FORMS of savings have grown substantially in the last
10 years. By the end of 1949 their total topped $5 billion.
*Includes Minnesota, Montana, North Dakota and South Dakota,
Val. 10
MONTHLY REVIEWof Ninth District Agricultural and Business Conditions
FEDERAL RESERVE BANK OF MINNEAPOLIS
JULY 31, 1950
9 g4at.
SerialNo. 7
District Savings Quadruple in Decade
At Year-End, Ninth District Residents Had
Bulk of Nest-Egg in U. S. Savings Bonds, Life
Insurance Equities, and Bank Time Deposits
FELLING increased financial se-curity as well as potential buying
power, a record backlog of savingshas been amassed by people of theNinth district in the last decade.
That there has been a savingsbonanza—even while we were pur-chasing more goods and services thanever before—is shown by an analysisof individuals' long-term liquid sav-ings in financial institutions and inholdings of U. S. savings bonds.*
At the end of 1949, residents ofthe Ninth district had accumulatedan estimated $5,158,000,000 in com-mercial and mutual savings bank timedeposits, life insurance equities, sharecapital of savings and loan associa-tions, postal savings, and U. S. sav-ings bonds.'
Of the district total, Minnesotasavers had claim to $3,374,000,000,North Dakotans owned $634,000,000,South Dakotans $583,000,000, andMontanans $568,000,000'
Per capita figures—savings dividedby population----showed average hold-ings per Ninth district citizen to be$1,086 at the end of last year. In Min-nesota the average per individual was$1,133, in Montana $1,089, in NorthDakota $1,047, and in South Dakota$899.
For the United States the per capitaestimate of individuals' long-termliquid savings last year was $1,137.
RATE OF SAVINGSLACKENED IN POSTWAR
Every year since 1939, total accu-mulated long-term savings havescaled a new peak. However, since
*For a more detailed discussion of U. S. Sav-ing bonds, see Monthly Review, Federal ReserveHank of Minneapolis, May 31, 1959, p. 49.
Estimates of long-term liquid savings in thefour complete states in the Ninth district wereprepared by the Research department of theFederal Reserve Bank of Minneapolis. Detailedsources may be obtained upon request.
Estimates for the portions of Michigan andWisconsin included in the Ninth district arenot available.
'State figures do not necessarily add to dis-trict totals because of rounding.
By JUDITH A. WEISS
the end of World War II the yearlynet additions to the savings pile havefallen off steadily. In other words,while savings have continued to growwithout pause, the rate of increasehas been slowing down.
This was what most observers ex-
petted. As a matter of fact, it waspredicted that after the war the rateof saving would fall off far morerapidly than it has.
Incomes jumped dramatically dur-ing the war, while goods were scarce.Consequently, savings grew at anastronomical pace as people laid awayidle funds in financial institutions andto an even greater extent in U. S.
U 5.
POSTAL SAVINGS
MUTUAL SAV. BK. DEP.
■SAV. & LOAN SHARES
COML. BK. DEPOSITS
.LIFE INS. EQUITIES
U.S. SAVINGS BONDS
MINN. MONT.
PER CENTOF" TOTAL100-
90-
80-
70•
60-
SO-
40-
30-
20-
10-
0
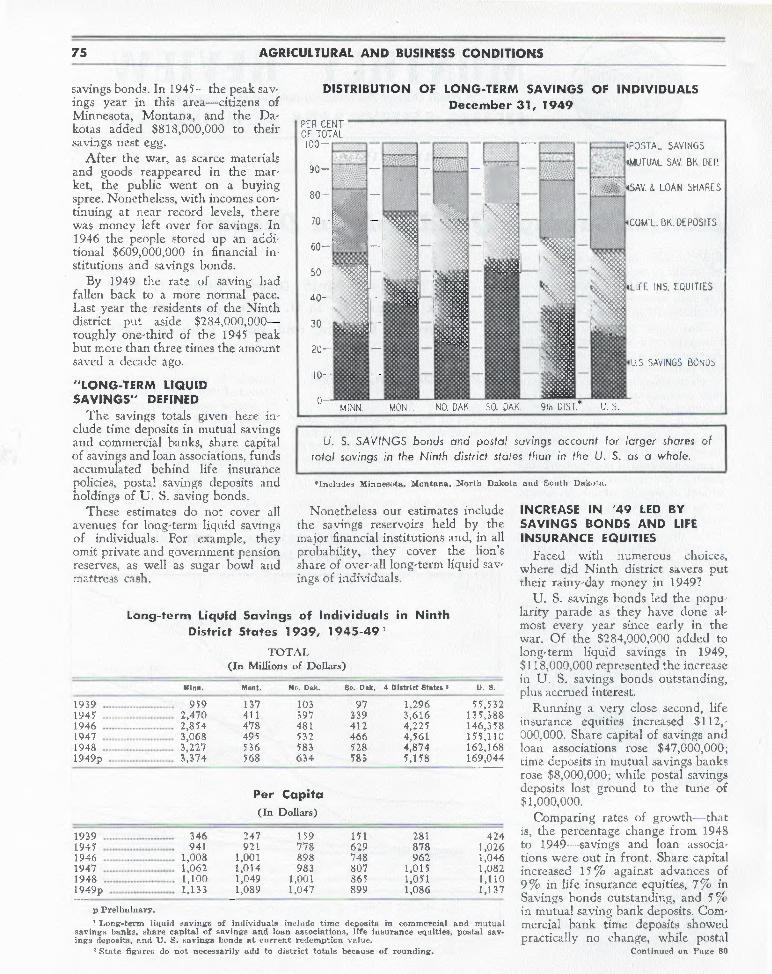
DISTRIBUTION OF LONG-TERM SAVINGS OF INDIVIDUALSDecember 31, 1949
U. S. SAVINGS bonds and postal savings account tor larger shares oftotal savings in the Ninth district states than in the U. S. as a whole.
■ Includes Minnesota, Montana, North Dakota and South Dakota.
Long-term Liquid Savings of Individuals in NinthDistrict States 1939, 1945-49'
TOTAL(In Millions of Dollars)
Minn. Mont. No. Dok. So. Disk. 4 District States' U. 8.
1939 959 137 103 97 1,296 55,5321945 2,470 411 397 339 3,616 135,3881946 2,854 478 481 412 4,225 146,3581947 3,068 495 532 466 4,561 155,1101948 3,227 536 583 528 4,874 162,1681949p 3,374 568 634 583 5,158 169,044
Per Capita(In Dollars)
1939 346 247 159 151 281 4241945 941 921 778 629 878 1,0261946 1,008 1,001 898 '748 962 1,046194'7 1,062 1,014 983 807 1,015 1,0821948 1,100 1,049 1,001 865 1,051 1,1101949p 1,133 1,089 1,047 899 1,086 1,137
p Preliminary.
Long-term liquid savings of individuals include time deposits in commercial and mutualsavings banks, share capital of savings and loan associations, life insurance equities, postal sav-ings deposits, and 15. S. savings bonds at current redemption value.
'State figures do not necessarily add to district totals because of rounding.
75 AGRICULTURAL AND BUSINESS CONDITIONS
savings bonds. In 1945-the peak sav-ings year in this area-citizens ofMinnesota, Montana, and the Da-kotas added $818,000,000 to theirsavings nest egg.
After the war, as scarce materialsand goods reappeared in the mar-ket, the public went on a buyingspree. Nonetheless, with incomes con-tinuing at near record levels, therewas money left over for savings. In1946 the people stored up an addi-tional $609,000,000 in financial in-stitutions and savings bonds.
By 1949 the rate of saving hadfallen back to a more normal pace.Last year the residents of the Ninthdistrict put aside $284,000,000-roughly one-third of the 1945 peakbut more than three times the amountsaved a decade ago.
"LONG-TERM LIQUIDSAVINGS" DEFINED
The savings totals given here in-clude time deposits in mutual savingsand commercial banks, share capitalof savings and loan associations, fundsaccumulated behind life insurancepolicies, postal savings deposits andholdings of U. S. saving bonds.
These estimates do not cover allavenues for long-term liquid savingsof individuals. For example, theyomit private and government pensionreserves, as well as sugar bowl andmattress cash.
INCREASE IN '49 LED BYSAVINGS BONDS AND LIFEINSURANCE EQUITIES
Faced with numerous choices,where did Ninth district savers puttheir rainy-day money in 1949?
U. S. savings bonds led the popu-larity parade as they have done al-most every year since early in thewar. Of the $284,000,000 added tolong-term liquid savings in 1949,$118,000,000 represented the increasein U. S. savings bonds outstanding,plus accrued interest.
Running a very close second, lifeinsurance equities increased $112,-000,000. Share capital of savings andloan associations rose $47,000,000;time deposits in mutual savings banksrose $8,000,000; while postal savingsdeposits lost ground to the tune of$1,000,000.
Comparing rates of growth•thatis, the percentage change from 1948to 1949--savings and loan associa-tions were out in front. Share capitalincreased 15% against advances of9% in life insurance equities, 7% inSavings bonds outstanding, and 5%in mutual saving hank deposits. Com-mercial bank time deposits showedpractically no change, while postal
Continued on Page 80
Nonetheless our estimates includethe savings reservoirs held by themajor financial institutions and, in allprobability, they cover the lion'sshare of over-all long-term liquid sav-ings of individuals.

WHOLESALE PRICE INDEXJan. 1, 1949, to July 1, 1950
An commodities, 1926 100
PER CENT
150
160
NINT FEDERAL RESERVE DIS
SINESS,
usiness Reflects International DevelopmentsSCARE
buying induced by fear ofSCARE possible shortages resulting from
international developments appearsto be affecting the same items whichpeople had difficulty obtaining dur-ing World War II, according to re,ports from Ninth district merchantsand bankers.
These reports indicate the areapicture is not much different from thenational. For the nation as a wholeas well as the district, stepped-uppurchases of numerous types of com-modities have been superimposed onan economy already straining to sat,isfy a high level of consumer demand.
It is a well-known fact that a shiftfrom a peacetime to a wartime basisin the early Forties was made whenthere was considerable slack in theeconomy. The essential difference be-tween that situation and the one nowconfronting us is that today nationaldefense necessitates rising expendi-tures in a period of existing inflation.
Although there were rumors ofpossible shortages in some lines ear-lier, scare buying did not begin untilthe news of the invasion of SouthKorea broke on June 25. Consequent-ly, June figures on business condi•tions reflect primarily trends prior torepercussions of the war.
LAG IN RURAL DEPARTMENTSTORE SALES OVERCOME
For the second consecutive month,Ninth district department store salesexceeded the dollar volume for cor-responding months in 1949. Saleswere 3% larger in May and 5%larger in June.
In previous months, departmentstore sales in industrial, raining, andlarger distributing centers, comparedwith last year's sales in the samemonths, were substantially betterthan those in the agricultural areas.Sales in the latter areas rose materi,ally in June, no doubt reflecting therise in farm income as a result ofhigher farm product prices.
For example, June sales in SouthDakota were equal to the dollarvolume of a year ago. In Montana,sales were down only 1% and only3% in North Dakota. Thus sales inthese areas in June were catching up
with last year's volume. In the largemetropolitan centers — Minneapolis,St. Paul, Duluth, and Superior—sales were 6% above last year's fig-ures. From these percentages it isevident that department store salesin the agricultural areas rose signifi-cantly during June, thereby ap-proaching the performance of theurban areas.
Prior to the advent of scare buy-ing, department stores and furniturestores were experiencing the second-ary effect of the residential housingboom. The sale of house furnishingswas high in June. The sale of tele-vision sets was especially high inthe Twin Cities metropolitan areawithin range of television stations.
New passenger car sales have beenhigh since the first of the year. Forinstance, during May over one andone-half times as many new cars wereregistered in South Dakota and inMinnesota as in the same monthof last year. The sudden surge in thedemand for new cars, stemming fromfear that automobile plants may beconverted to production of war equip,ment, has lessened trade-in value ofused cars. At the same time, cashvalue of the better used cars hasstrengthened.
or r .T. .T. ill 1 I IT: IT, IT!JFLI JAJJASONDJFMAMJ,111•50WD
1049 1950
THE GRADUAL DECLINE inprices was reversed in January ofthis year. Since April, prices hoverisen significantly, reflecting thestrong consumer demand.
Source: Bureau of Labor Statistics, Depart-ment otpLatx)r.
Ninth district experiences scarebuying in some commodities.
Rise in farm income improvesretail sales in rural areas.
Credit figures in continued highsales of durable goods.
Or Construction boom explainslarge rise in employmentfigures.
SALES FOR RECENT WEEKSREFLECT SCARE BUYING
For the four weeks ending July 22,covering the first four weeks of scarebuying, department store sales were23% higher than sales in the corres-ponding weeks of last year. The largeincrease reflects the tremendous de,mand for merchandise originatingfrom fear of shortages.
Stocks held by department storesin this district have been rising slow-ly since the first of the year. After anadjustment was made for the usualseasonal fluctuations, stocks held atthe end of May were 10% higherand at the end of June were 4%higher than at the end of last De-cember.
In some communities in recentmonths, the stocks held by a fewstores had begun to appear quite highin relation to volume of sales. How-ever, with the recent turn of events,such merchants now find themselvesin a favorable position.
CREDIT KEEPS CONSUMERPURCHASES HIGH
Credit in a large measure has sup-ported the purchase of automobiles,household appliances, and other dur-able goods. A small sample of de-partment stores in this district re•vealed that instalment and charge ac-count sales have been rising muchfaster than cash sales.
In commercial banks of this dis-trict, instalment loans have been ris-ing steadily. At the end of June, theamount outstanding aggregated ap-proximately $200 million as comparedwith $176 million at the end of lastDecember.
ContiFtuea an Next Page

77 AGRICULTURAL AND BUSINESS CONDITIONS
A similar expansion has takenplace in the amount of loans out-standing at industrial loan companies,small loan companies, and creditunions. At the end of June, theamount of loans outstanding at fed-eral and state credit unions in thisdistrict was one-fifth larger than atthe end of December. In the sameperiod, loans at small loan companiesincreased by 13% and by 6% at in-dustrial loan companies.
URBAN EMPLOYMENTAT HIGH LEVEL
According to the estimates avail-able on employment, the economy isoperating close to maximum capacity.In all states of this district, employ-ment in non-agricultural industrieshas surpassed the comparable em-ployment of a year ago.
In Montana, employment in non-agricultural industries during Junereached 155,000, which was 2.6%more than the number employed lastyear, according to the latest reportissued by the Unemployment Corn'pensation Commission of Montana.
In Minnesota, the total numberemployed was also higher than a yearago, but the percentage increase wassmall due to a delayed vegetable can-ning season. As reported by the
Index of Department StoreSales by Cities
(Unadjusted 1935-39 100)
June iPercent Change 2Juno Jan.-June
MINNESOTADuluth-Superior 289 + 4 — 3Fairmont 292 +13 — 5Mankato 245 + 7 — 4Minneapolis 297 + 7 + 3Rochester 226 — 4 — 8St. Cloud 287 + 6 —10St. Paul 255 + 6 — 0Willmar 307 +21 — 5Winona 276 +15 — 1
MONTANAGreat Falls 286 —13 ---10
NORTH DAKOTABismarck 315 + 3 —14Grand Forks 321 + 3 —10Minot 291 — 4 — 8Valley City 206 — 3 —17
SOUTH DAKOTAAberdeen 382 + 2 —16Rapid City 357 + 8 — 4Sioux Falls 332 — 0 — 9Yankton 258 + 2 —10
WISCONSINLaCrosse 255 + 9 — 4' Based on daily average sales.= Based on total dollar volume of sales. Per-
centage comparison Is with the same period ayear a go.
Northwest Business Indexes(Adjusted for Seasonal Variations-1935.39=100)
June '50 May '50 June '49 lune '46
Bank Debits-93 Cities 347 343 322 342Bank Debits—Farming Centers 410 406 394 417
Ninth District Department Store Sales 288p 268 266 288City Department Store Sales 298p 296 279 299Country Department Store Sales 277p 239 252 278
Ninth District Department Store Stocks 305p 322 301 326City Department Store Stocks 270p 281 257 2'73Country Department Store Stocks 334p 356 337 369
Country Lumber Sales 1'77p 148p 148 150
Miscellaneous Carloadings 143 113 128 134Total Carloadings (excl. Misc.) 111 109 123 121
Farm Prices (Minn. unadj.) 241 239 236 304
p—preliminary.
Sales at Ninth District Department Stares*
Moof jlousnee 11 995409
Number of Storessnowing
1151: Increase D ecrease
Total District 105 98 115 139Mpls., St. Paul, Dul.•Sup 106 101 21 9Country Stores 101 92 94 130
Minnesota (City and Country) 106 101 50 40Minnesota ('Country) 103 94 31 33
Central 100 89 2 5Northeastern 100 96 1 4Red River Valley 98 88 2 2South Central 105 93 '7 7South eastern 105 92 4 3Southwestern 106 96 15 12
Montana 99 96 15 16Mountains 104 95 4 7Plains 97 96 11 9
North Dakota 97 87 11 37North Central 97 88 1 8Northwestern 95 92 0 6Red River Valley 98 88 7 11Southeastern 95 80 3 10Southwestern (2) (2) ••.. ...•
Red River Valley-Minn. & N. D 98 88 9 13South Dakota 100 89 1'7 26
Southeastern 99 90 5 9Other Eastern 101 87 10 15Western 104 91 2 2
Wisconsin and Michigan 106 95 20 18Northern Wisconsin 101 98 6 8West Central Wisconsin 105 95 6 6Upper Peninsula Michigan 109 94 8 4
''Percentages are based on dollar volume of sales.June 1950 compared with June 1949.Not shown, but included in totals. Insufficient number reporting.
the Canyon Ferry site near Helena,and installation of a third generatorat the Fort Peck Dam have addedmaterially to the total number of con-struction workers in Montana. Underconstruction in North Dakota on theMissouri river is the Garrison dam,and being built in South Dakota onthe same river are the Fort Randalland Oahe darns.
The expansion in construction ac-tivity this year in these states, as in
Concluded on Page 79
Minnesota Division of EmploymentSecurity, the pea crop was small anddelayed this year, whereas in 1949the crop was large and was packed inJune.
CONSTRUCTION CAUSE OFLARGE EMPLOYMENT RISE
In the western part of the district,as many workers are employed onconstruction work as are employedin factories. Dam construction at theHungry Horse site near Kalispell, at

3939-4B 1049 1950 1939-48 1949 1950 1939-44 1949 1950
Thousand acres Bushels Thousand bushels
IVIinnesota 1,094 1,105 807 17.3 15.5 14.0 18,809 17,128 11,298North Dakota 6,734 7,374 6,047 15.1 10.5 11.5 102,415 77,427 69,540South Dakota 2,552 3,512 2,563 12.5 8.0 9.0 32,673 28,096 23,067Montana 2,603 3,792 3,602 15.5 10.5 17.0 40,301 39,816 61,234
4-States 12,983 15,783 13,018 15.0 10.3 13.0 194,198 162,467 165,139Source: "Crop Production"--,Yuly 11, 1950.
ii Vgn
NINTH FEDERAL RESERVE DISTRICT
7
AGRICULTURE
Larger Area Crop Production Probable in '50UE largely to increased businessactivity and rising employment,
prices of farm products have dis-played unusual strength this springand early summer. The future trendin farm prices is uncertain, but un-settled markets may be expected forNinth district farm products in thenext several months. This is why:
(1) The advent of military opera-tions has changed the picture ma,terially. Whether the Korean actionis settled as a minor incident, or ex-pands to world proportions, the eco-nomic picture is different from whatit was prior to June 27. A war psy,chology has developed which is likelyto exert a strong influence on farmmarkets.
(2) Billions of dollars of additionalmilitary spending may be required.Military operations require tremen-dous supplies of all kinds. These re-quirements will be placed on aneconomy already running at near-capacity production.
(3) Should the war be intensified,businessmen may find it necessaryto change buying and spending pat-terns to fit a return to wartime con-trols. Farmers may anticipate higherprices and thus delay marketings.This would cause scarcities and priceswould rise, at least temporarily.
One should remember, however,that food of all kinds is abundant atthe present time. In fact, enormoussurpluses of many farm productsexist.
Food production this year may beabout the same as last year if rainfallduring the next few weeks is normal.The Department of Agriculture esti-mated in early July that total cropproduction may be less than in eitherof the last two years, but above therecent 10-year average. The acreageallotment program is the chief reasonfor the expected decline in crop pro-duction for the country as a whole.
Offsetting the expected decrease inover-all crop production is a sub-stantial increase in production of live-stock and livestock products this year.Both meat and dairy products arelikely to be in substantially largersupply. However, on a per capitabasis they should show little change.
In view of continued over-all highfood production and existing sur-pluses, it seems there is little reasonfor people to hoard food in expec-tation of short supplies and highly in-flated food prices in the current cropyear.
CROP PROSPECTS GOODIN NINTH DISTRICT
Based on the crop reports as ofJuly 1, 1950, and of field observationsup to mid-July, production of princi-pal crops such as wheat, corn, oats,barley, and hay in the Ninth districtmay be somewhat larger than it wasin 1949.
Spring wheat acreage was reduced18% from last year in line with theacreage allotment program. But lastyear there was serious drouth in theimportant spring wheat-producingareas. Cool, wet weather the first partof July has been perfect and yieldsper acre are expected to be higherthis year compared with 1949.
Weather conditions have beensuch this spring and summer thatwheat is unusually well-rooted. It isin good position now to withstandsome drouth and hot winds if theyshould occur. As a result, springwheat production may even exceedlast year. (See table.)
Corn is another crop whereacreage allotments have reduced thetotal acres planted, but actual produc-tion may nearly equal that of lastyear. Cool weather in early July hasretarded corn growth, and unless wehave a long, frost-free fall there maybe considerable immature corn thisyear.
Oats, barley, and soybeans are onan expanded acreage this year,principally because of acreage re-
AereegeHarvested For
Average !sanest
Despite acreage allotments forsome grains, favorable Julyweather made district produc-tion estimates equal to orabove a year ago.War fears change farm eco-nomic outlook.
Small-grain production mayexceed that of 1949.
► Much soft corn probable, un-less frosts come late.
Hay production is ample fornext winter's needs.
strictions on wheat and corn. Pro-duction of these crops, based on July1 conditions, is likely to exceed thatof last year by a substantial amount,according to the Department of Agri-culture.
Soybean acreage, particularly, hasSeen a tremendous expansion thisyear. It doubled in both North andSouth Dakota and increased almost50% in Minnesota.
The biggest acreage cut for a ma-jor crop in this district in 1950 basedon July 1 government estimates wasin flax. The anticipated reduction isdue principally to a sharp cut inflax price support levels. Last-minutechanges in farmers' actual plantings,however, may see more flax actuallyplanted than the July 1 figures indi-cate. Thus district flax productionthis year may be somewhat largerthan was expected from farmers'earlier reports on intentions to plant.
CROP AND PASTURECONDITIONS VARY WIDELY
As usual in the great sprawlingarea of the Ninth district, there is agreat difference in crop conditions. In
Spring Wheat Other Than DurumYield per acre
Productionindl- Indi•
Average
Oateel
Average rated

AGRICULTURAL AND ESS CONDITIONS
June ISCommodity and Unit 1937-41 Ava.
June 151949
June 151959
Parity PricesUnited StatesJune 15. 1950
CropsWheat, bushel $0.76 $ 1.93 $ 2.00 $ 2.21Corn, bushel .61 1.09 1.42 1.60Oats, bushel .30 .52 .75 ,948Potatoes, bushel .61 1.5'5 1.35 1.75
Livestock and Livestock Productsflogs, 100 lbs. 7.51 17.93 17.17 19.20Beef Cattle, 100 lbs. 7.30 20,56 23.74 17.30Veal Calves, 100 lbs. 8.36 24.13 26.91 19.40Lambs, 100 lbs. 8.00 22.92 23.91 19.10Wool, lb. .26 .49 .5'7 .913Milk, wholesale, 100 lbs. 1.44 2.93 2.93 .441Butterfat, lb. .29 .62 .64 .706Chicken, live, lb. .124 .212 .178 .291Eggs, doz. .156 .393 .261 .511
eral, the northern half of thestrict has had ample to excessaunts of rainfall. In the southern
ctions rainfall has been relativelyht
Crop conditions were abnormal inmuch of this northern section of thedistrict during the spring season.Seeding was delayed and farmers hadto shift cropping in some places.Floods in the Red River Valley wereserious this spring and some of theheavy soils near the river will remainidle this year.
Almost the entire state of Montanahas experienced near ideal late springand early summer growing con-ditions. Range grass is lush and graincrops are making rapid development.If dry, hot winds do not occur in lateJuly or August, the state should haveat least a 5'0% larger grain cropcompared with last year.
South Dakota and southwesternMinnesota have been in the least fa-vored position up to about mid-Julyin relation to rainfall. Rains have beenfairly general since then, but much ofthe small grain is on short straw andyields may be relatively low.
HAY CROP MUCH LARGERHay production in 1949 was sub-
stantially below average. To makematters worse, we had a long, coldwinter with much snow, especially in
the northern part of the district. Asa result, many farmers and ranchersran out of hay. Hay prices sky-rocketed.
Prospects for hay production thisseason are good. The Department ofAgriculture estimates that 151/2 mil-lion tons of hay may be produced inthe four full states of the Ninth dis,trict this year, compared with only131/4 million last year and the recent10-year average of about 15 milliontons. Cutting of hay on uplands isreported as general in recent weeks,so there should be adequate hay tocarry livestock through next winter.
DISTRICT GRAIN STOCKSSHOW REDUCTION
Carryover of grain stocks on Ninthdistrict farms is sh.LrpI y lower com-pared with a year ago. This is partlya reflection of the smaller grain cropof 1949. It also reflects the decliningtrend in grain prices and the effortsof farmers to sell before prices shoulddecline still further. Also, the long,hard winter caused heavy consump-tion of feed grains by an increasingnumber of livestock on farms.
National totals for farm and fornon-farm grain stocks are up froma year ago. END
Ave e Prices Received by Farmers in the Ninth District*
*Source: "Agricultural Prices"-June 50, 1950.The term parity an applied to the price of an agricultural commodity is that price which
will give to the commodity a purchasing power equivalent to the average purchasing power ofthe commodity in the bane period, 151044.
BUSINESS REFLECTS'INTERNATIONALDEVELOPMENTS
Continued from Page 77
the eastern states of this district istraced, however, to the boom in resi-dential and public building. In May1949, contracts awarded for resi-dential building in this district totaledalmost $11 million, while in May ofthis year they totaled over $21 mil-lion, or almost double the amountin 1949.
Contracts awarded for other typesof construction totaled $211/2 mil-lion in May 1949 and $321/2 millionin May of this year. This representsan increase of 50%. A large part ofthis construction is public building-namely, public and private schools,co/lege s, universities, hospitals,
lurches, and state and municipalgs.
CREDIT TERMS TIGHTENEDTO PREVENT PRICE RISE
Since the economy is now operat-ing close to full capacity, the pro-duction of war materials and equip-ment cannot be superimposed on theproduction of civilian goods as wasdone at the beginning of World WarII without dislocation of industriesand strong inflationary pressures.Consequently, to prevent a rapid risein prices, it appears necessary to re-duce the civilian demand for cam,modities by tightening credit terms.
On July 19, the Veterans admin-istration raised requirements for theguarantee or insurance of mortgageloans. A veteran purchasing a housenow is required to make a 5% downpayment. Furthermore, a veteran towhom a VA loan has been grantedcannot request an additional amountof credit.
On August 1, the Fedc1-.:1 Iiouqingadministration tightened terms of in-surance on mortgage loans. A downpayment of 10% is required on TitleI loans, which comprise repair andmodernization loans. The appraisalvalue of houses now is based on con-struction cost as of July 1. Creditloaned on appraisal value has beenreduced by 5'% . Maximum amountloaned on a single dwelling househas been reduced from $16,000 to$14,000.
Prices in general have been risingsince the latter half of April. On theaccompanying chart there has beenplotted an index of wholesale pricesfrom January 1, 1949, to July of thisyear. The low point in the price levelin this period occurred in December,1949. In subsequent months therewas a slight stiffening in prices untilthe latter part of April, when prices,bcgan to rise noticeably. END
is
a Si

NINTH FEDERAL RESERVE DISTRICT 80
DISTRICT SAVINGQUADRUPLE IN DECADE
Continued from Page 75
savings slipped off about 1%.
SAVINGS ROSE SHARPLYIN THE FORTIES
For every savings medium, 1939to 1949 was a decade of growth. U. S.Savings bonds staged the most phe-nomenal increase. Today Ninth dis-trict citizens hold almost 50 times asmany savings bonds as they did 10years ago.
Today, however, Series E, F, and Gbonds, which were introduced in1941, make up the bulk of the sav-ings bonds outstanding. In 1939 hold-ings consisted of earlier series whichhad first been offered to the publiconly four years previously.
For every dollar invested in sharecapital of savings and loan associa-tions in 1939, today there are roughlyfour dollars. Savings accumulated be-hind life insurance have more thandoubled in the past 10 years. Postalsavings deposits and time depositsin mutual savings and commercialbanks have grown about 175% since1939.
Total accumulated savings of peo-ple living in the Ninth district statesgrew from $1,296,000,000 a decadeago to $5,158,000,000 at the end of1949--a gain of almost 300%. Percapita total savings rose 285% from$281 to $1,086.
These increases are indeed strik-ing. However, the real value of sav-ings—how much goods each dollarwill buy—has not increased as sharp-ly. In terms of 1939 dollars, last year'sper capita savings were worth $647.This means the real purchasing powerof our district's long-term liquid sav-ings increased 130% in the past 10years.
DISTRICT SAVINGS PATTERNVARIES FROM U.S.
Savings habits of Ninth districtresidents are somewhat different fromthose in the U. S. as a whole. Ap-parently savings bonds and postalsavings have a stronger foothold inthis section of the country than inother areas.
Montanans and Dakotans have in-vested roughly half of their totallong-term liquid savings in U. S say-
ings bonds, while nationally savingsbonds have attracted less than 30%of the total. (See chart.) In Minne-sota the share of total savings goingto savings bonds is about the same asthe U. S. average.
Per capita holdings of U. S. sav-ings bonds in the Ninth districtstates last year were $403, comparedwith national per capita holdings of$327.
Postal savings deposits in all fourstates get a bigger slice of the totalsavings pie than in the nation as awhole. Accounting for 2% of totalsavings nationally, postal savings rep-resent twice that in our district states.Residents of this area have depositedan average of $44 in postal savingsas compared with a national averageof $23.
Minnesotans have deposited aboutone-fourth of their total long-termliquid savings in commercial bank
June BankingDevelopmentsTOTAL earning assets of district
member banks showed little changeduring June as increases in loans andholdings of securities other than U. S.governments were offset by liquida-tions of U. S. government issues. Onthe liability side, demand deposits incity banks rose somewhat, whilecountry bank demand deposits heldsteady.
Loans increased $18 million in dis-trict member banks during June—up $11 million in city banks and $7million in country banks. Totalling$976 million at the end of the month,loans in Ninth district member bankswere 14% higher than a year ago.
Demand for bank credit so far in1950 has been greater than that ofthe first six months of last year. Thetable below shows changes in loansfrom the end of December to mid-July in 1949 and 1950 in Ninth dis-trict city banks.
Reflecting in part the accumulationof inventories, commercial loans haveincreased this year, whereas a yearago such credit declined as business-men liquidated inventories and paidoff bank loans. The figures also re-flect the increased tempo of realestate and consumer lending thisyear compared to last.
time accounts. Nationally, commer-cial banks claim only one-fifth of in-dividuals' savings, and in Montanaand the Dakotas time deposits accountfor about 17% of the total.
Savings and loan associations havebeen making headway in Minnesota.Last year residents of this state in-vested 9% of their long-term liquidsavings in savings and loan sharecapital, compared with a nationalaverage of 7%. The portion of totalsavings of Montanans and Dakotansflowing to savings and loan associa-tions, however, was considerably lessthan the U. S. average.
People throughout the nation haveput about 30% of their total nestegg in life insurance equities. Fallingshort of the national average, Ninthdistrict residents have about one-fourth of their savings in funds ac-cumulated behind life insurancepolicies. END
Twenty Weekly ReportingMember Banks
Changes in Millions of $
Changes In Millions of $12/28/49 12/29/48
to to7/12/50 7/13/49
Loans (grossComm., Ind., Ag $ 18 $ 27Real Estate + 14 + 2On Securities + 1 0To Banks — 7 0Other (largely
consumer) ± 25 + 8
Total $ + 51 $ 17
Government security holdingsof Ninth district banks declined $26million in June—down $17 million incity banks and $9 million in countrybanks. In country banks governmentbonds were liquidated primarily tomeet increased loan demand, whilein city banks funds obtained from thesale or redemption of Treasury issueswere used to purchase securities otherthan U. S. government, to pay offborrowings, and to increase balancesat other banks, as well as to meetloan demand.
In the 20 reporting banks certifi-cates of indebtedness bore the bruntof the decline in government securi-ties. The decrease in the C. I. port-folios was offset, in part, by addi-tions to note holdings, reflecting the
81 AGRICULTURAL AND BUSINESS CONDITIONS
exchange on June 1 and July 1 ofmaturing certificates for new 13-month 11/4% notes.
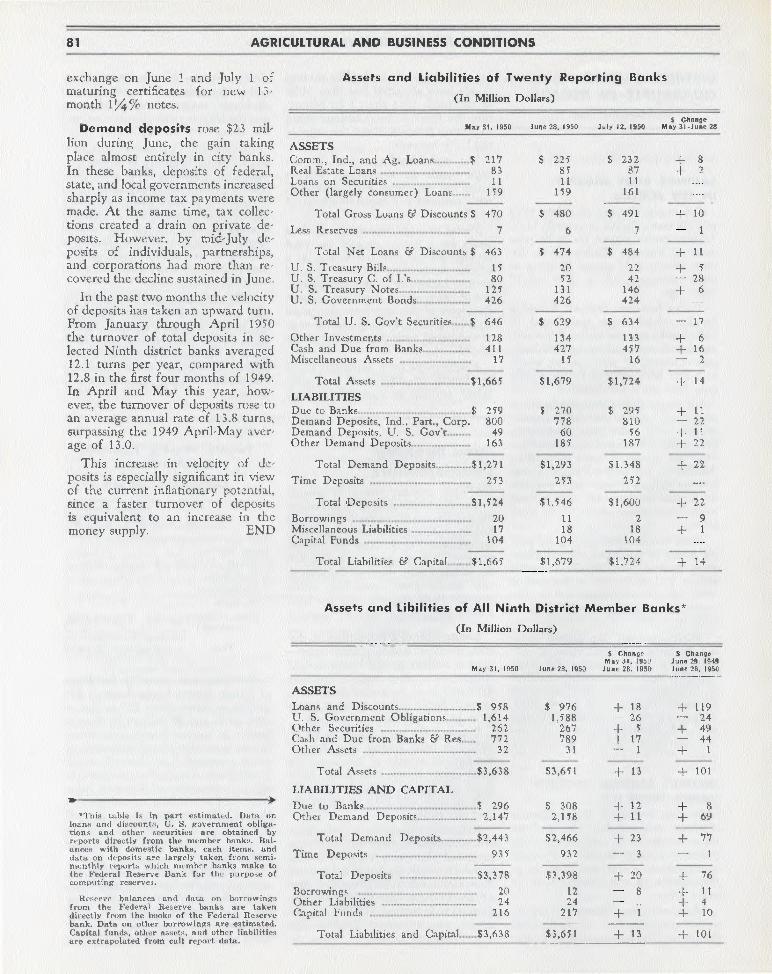
Demand deposits rose $23 mil-lion during June, the gain takingplace almost entirely in city banks.In these banks, deposits of federal,state, and local governments increasedsharply as income tax payments weremade. At the same time, tax collec-tions created a drain on private de-posits. However, by mid-July de-posits of individuals, partnerships,and corporations had more than re-covered the decline sustained in June.
In the past two months the velocityof deposits has taken an upward turn.From January through April 1950the turnover of total deposits in se-lected Ninth district banks averaged12.1 turns per year, compared with12.8 in the first four months of 1949.In April and May this year, how-ever, the turnover of deposits rose toan average annual rate of 13.8 turns,surpassing the 1949 April-May aver-age of 13.0.
This increase in velocity of de-posits is especially significant in viewof the current inflationary potential,since a faster turnover of depositsis equivalent to an increase in themoney supply. END
Assets and Liabilities of Twenty Reporting Banks
(In Million Dollars)
May 31, 1950 June 22. 1950 July 12, 1950$ Change
May 31-June 28
ASSETSComm., Ind., and Ag. Loans $ 217 $ 225 $ 232 + 8Real Estate Loans 83 87 ± 2Loans on Securities 11 11 11Other (largely consumer) Loans 159 159 161
Total Gross Loans el Discounts $ 470 $ 480 $ 491 + 10
Less Reserves 7 6 7 — 1
Total Net Loans Ei Discounts $ 463 $ 474 $ 484 + 11
U. S. Treasury Bills 15 20 22 + 5U. S. Treasury C. of L's 80 52 42 — 28U. S. Treasury Notes 125 131 146 ± 6U. S. Government Bonds 426 426 424
Total U. S. Gov't Securities $ 646 $ 629 $ 634 — 17
Other Investments 128 134 133 + 6Cash and Due from Banks 411 427 457 + 16Miscellaneous Assets 17 15 16 -- 2
Total Assets $1,665 $1,679 $1,724 -I- 14
LIABILITIESDue to Banks $ 259 $ 270 $ 295 + 11Demand Deposits, Ind., Part., Corp. 800 778 810 — 22Demand Deposits, U. S. Gov't 49 60 56 -I- 11Other Demand Deposits 163 185 187 + 22
Total Demand Deposits $1,271 $1,293 $1,348 + 22
Time Deposits 253 253 25'2
Total Deposits $1,524 $1,546 $1,600 + 22
Borrowings 20 11 2 9Miscellaneous Liabilities 17 18 18 + 1Capital Funds 104 104 104
Total Liabilities et? Capital $1,665 $1,679 $1,724 + 14
Assets and Libilities of All Ninth District Member Banks*
(In Million Dollars)
'This table i., in part estimated. Data onloans and discounts, U. S. government obliga-tions and other securities are obtained byreports directly from the member banks. Bal-ances with domestic banks, cash items, anddata on deposits are largely taken from semi-monthly report:, which member banks make tothe Federal Reserve Bank for the purpose ofcomputing reserves.
Reserve balances and data on borrowingsfrom the Federal Reserve banks are takendirectly from the books of the Federal Reservebank. Data on other borrowings are estimated.Capital funds, other assets, and other liabilitiesare extrapolated from call report data.
May 31. 1950 June 28. 1950
ChangeMay 31, 1959
June 28. 1950
$ ChangeJune 29, 1949June 28. 1950
ASSETSLoans and Discounts $ 958 $ 976 + 18 + 119U. S. Government Obligations 1,614 1,588 -- 26 — 24Other Securities 262 267 + 5 + 49Cash and Due from Banks & Res '772 789 + 17 — 44Other Assets 32 31 -- 1 1
Total Assets $3,638 $3,651 + 13 + 101
LIABILITIES AND CAPITAL
Due to Banks $ 296 $ 308 + 12 + 8Other Demand Deposits 2,147 2,158 + 11 + 69
Total Demand Deposits $2,443 $2,466 + 23 + 77
Time Deposits 935 932 -- 3 — 1
Total Deposits $3,378 $3,398 + 20 + 76
Borrowings 20 12 8Other Liabilities 24 24 + 4Capital Funds 216 217 -I-- 1 + 10
Total Liabilities and Capital $3,638 $3,651 + 13 + 101