Monthly Labor Review: The labor market in 2009: recession ... · U.S. Labor Market, 2009 4 Monthly...
20
Monthly Labor Review • March 2010 3 U.S. Labor Market, 2009 The labor market in 2009: recession drags on In 2009, the unemployment rate reached double digits, the employment-population ratio fell sharply, and the numbers of unemployed, discouraged workers, and involuntary part-timers rose Steven F. Hipple Steven F. Hipple is an economist in the Division of Labor Force Statistics in the Office of Em- ployment and Unemployment Statistics of the Bureau of Labor Statistics. E-mail: [email protected] T he United States economy was in a recession when 2009 began. e National Bureau of Economic Re- search (NBER) had designated December 2007 as the beginning of the recession, and labor market conditions had deteriorated throughout 2008. 1 e financial crisis in the fall of 2008 had resulted in steep de- clines in employment and sharp increases in unemployment that carried into the first part of 2009. Although job losses moder- ated as the year progressed, the number of unemployed people age 16 and over stood at 15.4 million in the fourth quarter of 2009. e unemployment rate, already high by historical standards at the beginning of the year, reached 10.0 percent during the last quarter of 2009, higher than at any time since the early 1980s. (See chart 1.) e unemployment rate for men, 11.2 per- cent in the fourth quarter of 2009, was the highest in the history of the series, which began in 1948. e number of employed people age 16 and over, as measured by the Current Pop- ulation Survey (CPS), was 138.1 million in the fourth quarter of 2009, 5.8 million lower than a year earlier. 2 e over-the- year percentage decline in employment (4.0 percent) was the largest on record. (For a comparison of the employment measures available from the CPS with those from the Current Employment Statistics survey, see the box on page 5.) Reflecting the sharp de- crease in employment, the employment-pop- ulation ratio dropped by 2.9 percentage points over the year, to 58.4 percent in the fourth quarter of 2009. (See chart 2.) e decline in the employment-population ratio during 2009 was the largest over-the-year decrease in the history of the series, which dates back to 1948. Although unemployment rose and employ- ment declined in 2009, the decrease in labor force participation was relatively small. 3 e labor force participation rate fell by 1.0 percent- age point over the year, to 64.9 percent in the fourth quarter of 2009. Unemployment levels and rates among people in the central working age group (25 to 54 years) rose sharply during 2009; men in this age group experi- enced larger increases in unemployment and greater declines in employment than did their female coun- terparts. In 2009, more than two-thirds of the labor force was composed of people in the cen- tral working age group (25 to 54 years). In the fourth quarter of 2009, the unemployment rate for this group was 9.0 percent, up from 6.0 per- cent in the fourth quarter of 2008; the fourth- quarter 2009 rate was the highest in the history of the series, which began in 1948. e number of unemployed people age 25 to 54 years, 9.3 million in the fourth quarter of 2009, had risen by 3.1 million from the previous year. Among 25- to 54-year-olds, the unemployment rate for men jumped by 3.6 percentage points over
Transcript of Monthly Labor Review: The labor market in 2009: recession ... · U.S. Labor Market, 2009 4 Monthly...

Monthly Labor Review • March 2010 3
U.S. Labor Market, 2009
The labor market in 2009:recession drags on
In 2009, the unemployment rate reached double digits, the employment-population ratio fell sharply, and the numbers of unemployed, discouraged workers, and involuntary part-timers rose
Steven F. Hipple
Steven F. Hipple is an economist in the Division of Labor Force Statistics in the Office of Em-ployment and Unemployment Statistics of the Bureau of Labor Statistics. E-mail: [email protected]
The United States economy was in a recession when 2009 began. The National Bureau of Economic Re-
search (NBER) had designated December 2007 as the beginning of the recession, and labor market conditions had deteriorated throughout 2008.1 The financial crisis in the fall of 2008 had resulted in steep de-clines in employment and sharp increases in unemployment that carried into the first part of 2009. Although job losses moder-ated as the year progressed, the number of unemployed people age 16 and over stood at 15.4 million in the fourth quarter of 2009. The unemployment rate, already high by historical standards at the beginning of the year, reached 10.0 percent during the last quarter of 2009, higher than at any time since the early 1980s. (See chart 1.) The unemployment rate for men, 11.2 per-cent in the fourth quarter of 2009, was the highest in the history of the series, which began in 1948.
The number of employed people age 16 and over, as measured by the Current Pop-ulation Survey (CPS), was 138.1 million in the fourth quarter of 2009, 5.8 million lower than a year earlier.2 The over-the-year percentage decline in employment (4.0 percent) was the largest on record. (For a comparison of the employment measures available from the CPS with those from the Current Employment Statistics survey, see
the box on page 5.) Reflecting the sharp de-crease in employment, the employment-pop-ulation ratio dropped by 2.9 percentage points over the year, to 58.4 percent in the fourth quarter of 2009. (See chart 2.) The decline in the employment-population ratio during 2009 was the largest over-the-year decrease in the history of the series, which dates back to 1948.
Although unemployment rose and employ-ment declined in 2009, the decrease in labor force participation was relatively small.3 The labor force participation rate fell by 1.0 percent-age point over the year, to 64.9 percent in the fourth quarter of 2009.
Unemployment levels and rates among people in the central working age group (25 to 54 years) rose sharply during 2009; men in this age group experi-enced larger increases in unemployment and greater declines in employment than did their female coun-terparts. In 2009, more than two-thirds of the labor force was composed of people in the cen-tral working age group (25 to 54 years). In the fourth quarter of 2009, the unemployment rate for this group was 9.0 percent, up from 6.0 per-cent in the fourth quarter of 2008; the fourth-quarter 2009 rate was the highest in the history of the series, which began in 1948. The number of unemployed people age 25 to 54 years, 9.3 million in the fourth quarter of 2009, had risen by 3.1 million from the previous year. Among 25- to 54-year-olds, the unemployment rate for men jumped by 3.6 percentage points over
U.S. Labor Market, 2009
4 Monthly Labor Review • March 2010
the year, to 9.9 percent in the fourth quarter of 2009, while the rate for women increased by 2.4 percentage points, to 7.9 percent. (See table 1.)
During 2009, employment among people age 25 to 54 dropped by 4.0 million, hitting 94.1 million in the fourth quarter. As one might expect, the large increase in the number of unemployed men coincided with a significant decrease in the number who were employed and a drop in their employ-ment-population ratio. Employment among men in the 25- to 54-year-old group declined by 2.5 million, and this decline accounted for more than three-fifths of the total decline in the employment of people age 25 to 54. By the fourth quarter of 2009, the employment-population ratio for men age 25 to 54, at 80.6 percent, was the lowest on record and had fallen by 3.9 percentage points over the year. By comparison, the number of employed women age 25 to 54 fell by 1.5 mil-lion over the year, and their employment-population ratio fell by 2.3 percentage points, to 69.4 percent. Much of the large decline in the employment of men can be attributed to their concentration in more cyclically sensitive occupations, such as construction and extraction occupations and production occupations.4
In 2009, young workers were affected by poor labor market con-ditions more than were workers age 55 and over. The num-
ber of employed teenagers—people age 16 to 19—fell by 864,000 over the year, and their employment-population ratio fell by 4.8 percentage points—to 26.1 percent. By the end of 2009, the teen employment-population ratio was the lowest in the history of the series, which began in 1948. Many teens withdrew from the labor force in 2009; the teen labor force participation rate fell by 3.1 percent-age points to a record-low 35.8 percent. The number of unemployed teenagers—those without a job but actively looking for work—rose by 289,000, raising the teen un-employment rate from 20.5 percent in the fourth quarter of 2008 to 27.2 percent a year later, its highest level on re-cord. (See table 1.) Teen employment losses during 2009 were concentrated in retail trade industries.
The decrease in teen employment reflects a marked de-cline in the demand for young workers—a phenomenon that is typical during recessions. Teens generally have less experience and fewer skills than do older workers, and, dur-ing labor market downturns, teens are often the first to be released when employers cut payrolls. The sharp decline in labor force participation among teens in 2009 suggests that many of these youth have reacted to such difficulties by leaving the labor force, possibly to pursue higher education. Indeed, the proportion of high school graduates who enroll in college continued to rise. In addition, teens may be fac-
12
10
8
6
4
2
0
Chart 1. Unemployment rate for persons 16 years and older, seasonally adjusted, quarterly averages, 1969–2009
Percent12
10
8
6
4
2
0
Percent
NOTE: Shaded areas represent recessions as designated by the National Bureau of Economic Research (NBER). The NBER has not yet determined an endpoint for the recession that began in December 2007.
SOURCE: Bureau of Labor Statistics, Current Population Survey.
1969 1972 1975 1978 1981 1984 1987 1990 1993 1996 1999 2002 2005 2008

Monthly Labor Review • March 2010 5
ing greater competition from other groups for entry-level positions.5
The employment of young adults (age 20 to 24) also declined in 2009, falling by 1.0 million. The proportion of these young adults who were employed fell by 5.5 percent-age points, to 60.2 percent. The unemployment rate for people age 20 to 24 rose during 2009, increasing by 4.2 percentage points, to 15.7 percent.
Adults age 55 and over were not immune to the effects of a recession: their unemployment rate rose by 2.3 per-centage points, reaching 7.1 percent in the fourth quar-ter of 2009.6 However, in contrast to the employment of younger workers, employment among adults age 55 and
over edged up in 2009, and their labor force participation rate held steady at about 40 percent. (See table 1.)
All the major race and ethnicity groups were adversely affected by weak labor market conditions. Unemployment rates for all the major race and ethnicity groups rose sharply in 2009, and, by the fourth quarter, rates for all groups were at or near record highs. The over-the-year increases in un-employment rates were largest for Blacks and Hispanics, whose rates jumped by 4.2 and 3.9 percentage points, re-spectively, to 15.8 percent for Blacks and 12.9 percent for Hispanics. The fourth-quarter 2009 unemployment rate for Whites, 9.2 percent, was 2.9 percentage points higher
The Bureau of Labor Statistics produces two monthly employment series that are independently obtained: the estimate of total nonfarm jobs, derived from the Current Employment Statistics (CES) survey, also called the es-tablishment or payroll survey; and the estimate of total civilian employment, based on the Current Population Survey (CPS), also called the household survey. The two surveys use different definitions of employment, as well as different survey and estimation methods. The CES survey is a survey of employers that provides a measure of the number of payroll jobs in nonfarm industries. The CPS is a survey of households that provides a measure of employed people age 16 years and older in the civil-ian noninstitutional population. Employment estimates from the CPS give information about workers in both the agricultural and nonagricultural sectors and in all types of work arrangements: workers with wage and salary jobs (including employment in a private household), those en-gaging in self-employment, and those doing unpaid work for at least 15 hours a week in a business or farm operated by a family member. CES payroll employment estimates are restricted to nonagricultural wage and salary jobs and exclude private household workers. As a result, employ-ment estimates from the CPS are higher than those from the CES survey. In the CPS, however, employed people are counted only once, regardless of whether they hold more than one job during the survey reference period. By contrast, because the CES survey counts the number of jobs rather than the number of people, each nonfarm job is counted once, even when two or more jobs are held by the same person.
The reference periods for the surveys also differ. In the CPS, the reference period is the calendar week that includes the 12th day of the month. In the CES survey, employers report the number of workers on their payrolls for the pay period that includes the 12th of the month. Because pay periods vary in length among employers and may be longer than 1 week, the CES employment esti-mates can reflect longer reference periods.
For purposes of comparison, however, some adjust-ments can be made to CPS employment estimates to make them more similar in definitional scope to CES employment figures. BLS routinely carries out these ad-justments to evaluate how the two employment series are tracking. The long-term trends in the two surveys’ em-ployment measures are quite comparable. Nonetheless, throughout the history of the surveys, there have been periods when the short-term trends diverged or when growth in one series significantly outpaced growth in the other. For example, following the end of the 2001 recession, CPS employment began to trend upward while CES employment continued to decline for a number of months.
BLS publishes a monthly report with the latest trends and comparisons of employment as measured by the CES survey and the CPS. (See “Employment from the BLS household and payroll surveys: summary of recent trends” (Bureau of Labor Statistics), on the Internet at www.bls.gov/web/ces_cps_trends.pdf.) This report includes a summary of possible causes of differences in the surveys’ employment trends, as well as links to additional research on the topic.
The CPS and the CES survey

U.S. Labor Market, 2009
6 Monthly Labor Review • March 2010
than a year earlier. The unemployment rate for Asians in the last quarter of 2009, 7.7 percent (not seasonally ad-justed), had risen by 3.1 percentage points over the year. (See table 1.)
Employment among all the major race and ethnicity groups fell sharply during 2009. The number of employed Blacks fell by 5.7 percent; this compares with a decline of 3.8 percent for Whites and 2.6 percent for Hispanics. For all three groups, the over-the-year percentage declines in employment were the largest on record. For Asians, employment fell by 4.2 percent during 2009 (not season-ally adjusted). The employment decrease among Blacks in 2009 was concentrated in manufacturing. A large propor-tion (two-thirds) of the employment decline among His-panics was in construction.
Reflecting the large declines in employment among the race and ethnicity groups, the employment-popula-tion ratios for all these groups dropped sharply during 2009. The employment-population ratio for Blacks fell by 3.9 percentage points, hitting 52.1 percent in the fourth quarter of 2009. The ratio for Hispanics declined by 3.0 percentage points, to 58.8 percent, and the ratio for Whites fell by 2.7 percentage points, to 59.3 per-cent. During 2009, the employment-population ratio for Asians declined by 3.0 percentage points, to 60.2 percent
(not seasonally adjusted) in the last quarter of the year.
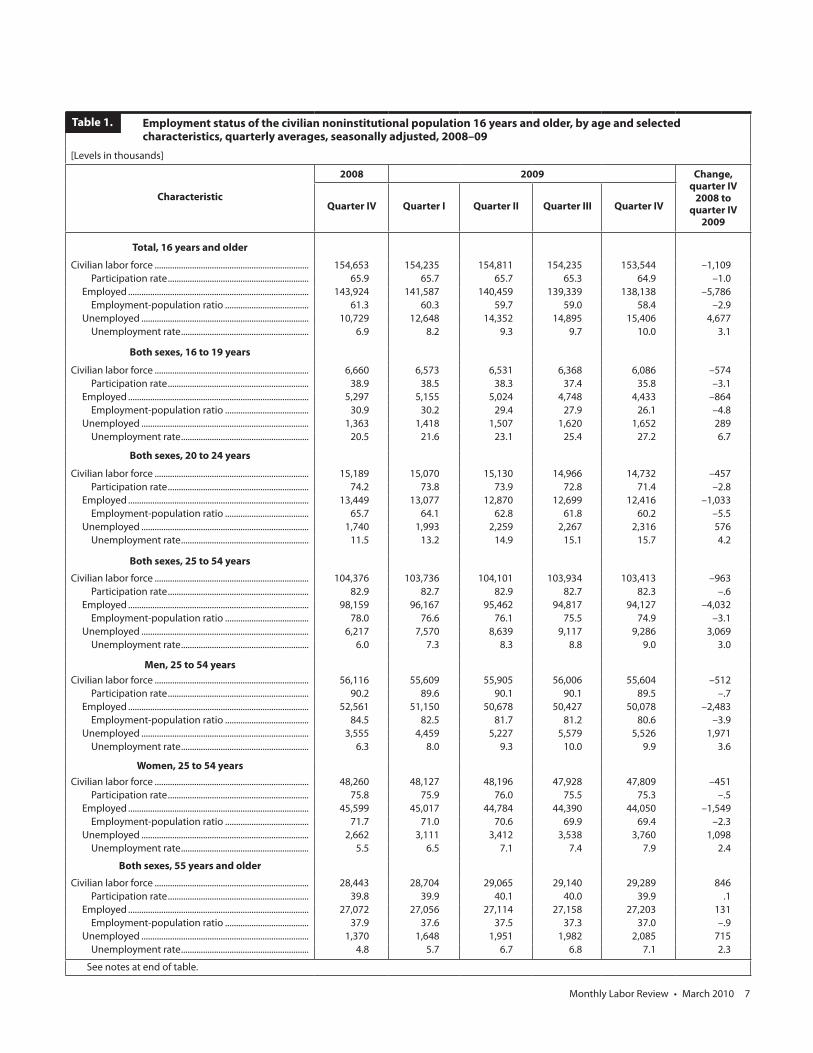
In 2009, less educated workers were affected by poor labor market conditions more than their counterparts with higher levels of education. People with less education started the year 2009 with higher unemployment rates and expe-rienced larger increases in unemployment than did their more educated counterparts. Among people age 25 and over, the unemployment rate for those with less than a high school diploma jumped by 4.5 percentage points, reaching 15.3 percent in the fourth quarter of 2009. The over-the-year increases in unemployment rates were also large for high school graduates without any college edu-cation and for those with some college or an associate's degree, whose rates increased by 3.6 and 3.4 percentage points, respectively, to 10.7 percent for high school grad-uates without any college and 9.0 percent for those with some college. Among college graduates, the unemploy-ment rate rose by 1.5 percentage points, to 4.9 percent. (See chart 3.)
The employment-population ratio dropped at all lev-els of educational attainment in 2009. The over-the-year decline was largest for people with some college or an as-sociate’s degree, whose ratio fell by 3.3 percentage points, to 64.3 percent in the fourth quarter of 2009. During
Chart 2. Labor force participation rate and employment-population ratio, seasonally adjusted, quarterly averages, 1999–2009
Percent70
68
66
64
62
60
58
56
Percent
NOTE: Shaded areas represent recessions as designated by the National Bureau of Economic Research (NBER). The NBER has not yet determined an endpoint for the recession that began in December 2007.
SOURCE: Bureau of Labor Statistics, Current Population Survey.
Labor force participation rate
Employment-population ratio
1999 2000 2001 2002 2003 2004 2005 2006 2007 2008 2009
70
68
66
64
62
60
58
56
Monthly Labor Review • March 2010 7
Employment status of the civilian noninstitutional population 16 years and older, by age and selected characteristics, quarterly averages, seasonally adjusted, 2008–09
[Levels in thousands]
Characteristic
2008 2009 Change, quarter IV
2008 toquarter IV
2009Quarter IV Quarter I Quarter II Quarter III Quarter IV
Total, 16 years and older
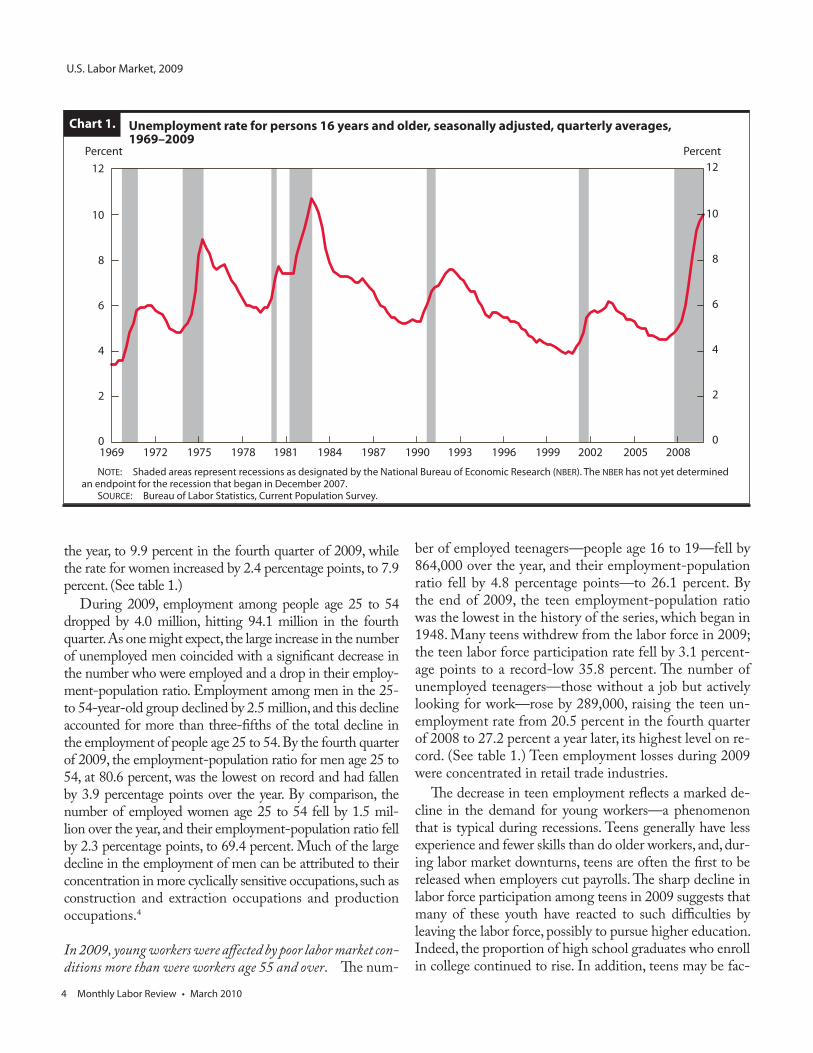
Civilian labor force ...................................................................... 154,653 154,235 154,811 154,235 153,544 –1,109 Participation rate ................................................................ 65.9 65.7 65.7 65.3 64.9 –1.0 Employed .................................................................................. 143,924 141,587 140,459 139,339 138,138 –5,786 Employment-population ratio ...................................... 61.3 60.3 59.7 59.0 58.4 –2.9 Unemployed ............................................................................ 10,729 12,648 14,352 14,895 15,406 4,677 Unemployment rate .......................................................... 6.9 8.2 9.3 9.7 10.0 3.1
Both sexes, 16 to 19 years
Civilian labor force ...................................................................... 6,660 6,573 6,531 6,368 6,086 –574 Participation rate ................................................................ 38.9 38.5 38.3 37.4 35.8 –3.1 Employed .................................................................................. 5,297 5,155 5,024 4,748 4,433 –864 Employment-population ratio ...................................... 30.9 30.2 29.4 27.9 26.1 –4.8 Unemployed ............................................................................ 1,363 1,418 1,507 1,620 1,652 289 Unemployment rate .......................................................... 20.5 21.6 23.1 25.4 27.2 6.7
Both sexes, 20 to 24 years
Civilian labor force ...................................................................... 15,189 15,070 15,130 14,966 14,732 –457 Participation rate ................................................................ 74.2 73.8 73.9 72.8 71.4 –2.8 Employed .................................................................................. 13,449 13,077 12,870 12,699 12,416 –1,033 Employment-population ratio ...................................... 65.7 64.1 62.8 61.8 60.2 –5.5 Unemployed ............................................................................ 1,740 1,993 2,259 2,267 2,316 576 Unemployment rate .......................................................... 11.5 13.2 14.9 15.1 15.7 4.2
Both sexes, 25 to 54 years
Civilian labor force ...................................................................... 104,376 103,736 104,101 103,934 103,413 –963 Participation rate ................................................................ 82.9 82.7 82.9 82.7 82.3 –.6 Employed .................................................................................. 98,159 96,167 95,462 94,817 94,127 –4,032 Employment-population ratio ...................................... 78.0 76.6 76.1 75.5 74.9 –3.1 Unemployed ............................................................................ 6,217 7,570 8,639 9,117 9,286 3,069 Unemployment rate .......................................................... 6.0 7.3 8.3 8.8 9.0 3.0
Men, 25 to 54 yearsCivilian labor force ...................................................................... 56,116 55,609 55,905 56,006 55,604 –512 Participation rate ................................................................ 90.2 89.6 90.1 90.1 89.5 –.7 Employed .................................................................................. 52,561 51,150 50,678 50,427 50,078 –2,483 Employment-population ratio ...................................... 84.5 82.5 81.7 81.2 80.6 –3.9 Unemployed ............................................................................ 3,555 4,459 5,227 5,579 5,526 1,971 Unemployment rate .......................................................... 6.3 8.0 9.3 10.0 9.9 3.6
Women, 25 to 54 yearsCivilian labor force ...................................................................... 48,260 48,127 48,196 47,928 47,809 –451 Participation rate ................................................................ 75.8 75.9 76.0 75.5 75.3 –.5 Employed .................................................................................. 45,599 45,017 44,784 44,390 44,050 –1,549 Employment-population ratio ...................................... 71.7 71.0 70.6 69.9 69.4 –2.3 Unemployed ............................................................................ 2,662 3,111 3,412 3,538 3,760 1,098 Unemployment rate .......................................................... 5.5 6.5 7.1 7.4 7.9 2.4
Both sexes, 55 years and older
Civilian labor force ...................................................................... 28,443 28,704 29,065 29,140 29,289 846 Participation rate ................................................................ 39.8 39.9 40.1 40.0 39.9 .1 Employed .................................................................................. 27,072 27,056 27,114 27,158 27,203 131 Employment-population ratio ...................................... 37.9 37.6 37.5 37.3 37.0 –.9 Unemployed ............................................................................ 1,370 1,648 1,951 1,982 2,085 715 Unemployment rate .......................................................... 4.8 5.7 6.7 6.8 7.1 2.3
See notes at end of table.
Table 1.

U.S. Labor Market, 2009
8 Monthly Labor Review • March 2010
2009, the employment-population ratio for people with a high school diploma but no higher education fell by 3.0 percentage points, to 55.0 percent, and the ratio for those with less than a high school diploma fell by 2.9 percent-age points, to 39.3 percent. The ratio for college graduates fell to 73.6 percent, 1.5 percentage points lower than a year earlier.
The severe labor market downturn has caused height-ened interest in the job market prospects of young adults, especially those with recent college degrees.7 The follow-ing text tabulation shows unemployment rates (not sea-sonally adjusted) by educational attainment for people age
20 to 24 who were not enrolled in school.
Unemployment rates (in percent) Quarter IV, Quarter IV, 2008 2009 ChangeLess than a high school diploma ........................ 25.2 27.8 2.6High school diploma, no college ..................... 13.9 21.0 7.1Some college or associate's degree ........................... 8.9 13.1 4.2Bachelor’s degree or higher ........................... 6.4 8.6 2.2
In the fourth quarter of 2009, among people age 20
Continued—Employment status of the civilian noninstitutional population 16 years and older, by age and selected characteristics, quarterly averages, seasonally adjusted, 2008-09
[Levels in thousands]
Characteristic
2008 2009 Change, quarter IV
2008 to quarter IV
2009
Quarter IV Quarter I Quarter II Quarter III Quarter IV
WhiteCivilian labor force ...................................................................... 125,968 125,673 126,174 125,844 125,143 –825 Participation rate ................................................................ 66.2 66.0 66.2 65.9 65.3 –.9 Employed .................................................................................. 118,017 116,266 115,483 114,661 113,587 -4,430 Employment-population ratio ...................................... 62.0 61.1 60.6 60.0 59.3 –2.7 Unemployed ............................................................................ 7,952 9,406 10,691 11,182 11,556 3,604 Unemployment rate .......................................................... 6.3 7.5 8.5 8.9 9.2 2.9
Black or African American
Civilian labor force ...................................................................... 17,769 17,659 17,725 17,567 17,592 –177 Participation rate ................................................................ 63.4 62.9 62.9 62.1 61.9 –1.5 Employed .................................................................................. 15,703 15,312 15,078 14,906 14,808 –895 Employment-population ratio ...................................... 56.0 54.5 53.5 52.7 52.1 –3.9 Unemployed ............................................................................ 2,066 2,347 2,648 2,661 2,784 718 Unemployment rate .......................................................... 11.6 13.3 14.9 15.1 15.8 4.2
Asian¹Civilian labor force ...................................................................... 7,166 7,073 7,207 7,248 7,098 –68 Participation rate ................................................................ 66.2 65.7 66.4 66.6 65.3 –.9 Employed .................................................................................. 6,839 6,614 6,689 6,686 6,549 –290 Employment-population ratio ...................................... 63.2 61.5 61.7 61.4 60.2 –3.0 Unemployed ............................................................................ 326 460 517 561 549 223 Unemployment rate .......................................................... 4.6 6.5 7.2 7.7 7.7 3.1
Hispanic or Latino ethnicity
Civilian labor force ...................................................................... 22,111 22,120 22,404 22,434 22,487 376 Participation rate ................................................................ 67.9 68.1 68.4 67.9 67.5 –.4 Employed .................................................................................. 20,114 19,723 19,687 19,585 19,586 –528 Employment-population ratio ...................................... 61.8 60.7 60.1 59.3 58.8 –3.0 Unemployed ............................................................................ 1,997 2,397 2,716 2,850 2,901 904 Unemployment rate .......................................................... 9.0 10.8 12.1 12.7 12.9 3.9
¹ Data for Asians are not seasonally adjusted.
NOTE: Beginning in 2008, data reflect revised population controls. Esti-mates for race and Hispanic ethnicity do not sum to totals because data are
not presented for all races and because persons of Hispanic ethnicity may be of any race and are also included in the race groups.
SOURCE: Bureau of Labor Statistics, Current Population Survey.
Table 1.
Monthly Labor Review • March 2010 9
to 24, unemployment rates ranged from a low of 8.6 per-cent for people with a college degree to a high of 27.8 percent for those with less than a high school diploma. The deterioration in labor market conditions in 2009 af-fected young adults at all levels of educational attainment. The unemployment rates of all education-based groups of people age 20 to 24 rose by 2 percentage points or more between the fourth quarter of 2008 and the fourth quarter of 2009. The largest increase—7.1 percentage points—oc-curred for people with a high school diploma but no col-lege education. Although the rise in the unemployment rate for people with less than a high school diploma was relatively small, this group continued to register the high-est unemployment rate of all the educational attainment categories.
The numbers of job losers and long-term unemployed rose sharply in 2009. As is typical during recessions, nearly all of the increase in unemployment during 2009 oc-curred among people who had recently lost their jobs. The number of people who were unemployed because they had lost their jobs rose by 3.7 million in 2009, to 10.0 million. (See table 2.) The majority of the over-the-year rise in job losers occurred in the first half of 2009. There are two major subcategories of job losers—those
on temporary layoff (expecting recall) and those who are not on temporary layoff. The latter subcategory is further divided into two groups: permanent job losers and per-sons who completed temporary jobs. The vast majority of the increase among those not on temporary layoff oc-curred among permanent job losers, who rose in number by 3.1 million to reach 6.9 million in the fourth quarter of 2009.
Also contributing to the over-the-year rise in total unemployment was an increase of 621,000 in the num-ber of unemployed reentrants; their number rose to 3.3 million in the fourth quarter of 2009. The number of un-employed new entrants to the labor force, 1.2 million in the fourth quarter of 2009, had risen by 424,000 over the year. In 2009, there was little change in the number of unemployed job leavers—people who quit or otherwise terminated their employment voluntarily and immedi-ately began looking for work. (See chart 4 and table 2.)
About 5.9 million people had been jobless for at least 27 weeks as of the last quarter of 2009, an increase of 3.5 million from a year earlier.8 These long-term unemployed people made up a much larger proportion of the total un-employed in 2009 than they had the previous year: 38.2 percent in the fourth quarter of 2009, up from 22.2 per-cent a year earlier. (See chart 5.) By the end of 2009, the
Chart 3. Unemployment rate by educational attainment for persons 25 years and older, seasonally adjusted, quarter IV 2008 and quarter IV 2009
Percent16
14
12
10
8
6
4
2
0
Percent
SOURCE: Bureau of Labor Statistics, Current Population Survey.
Total, 25 and older Less than a high school High school diploma, Some college or Bachelor’s degree diploma no college associate’s degree or higher
16
14
12
10
8
6
4
2
0
Quarter IV 2008Quarter IV 2009

U.S. Labor Market, 2009
10 Monthly Labor Review • March 2010
share of the unemployed accounted for by the long-term jobless was the largest on record. Moreover, the number of people unemployed 52 weeks or longer—3.2 million in the fourth quarter of 2009—was 2½ times higher than the level a year earlier.
The sharp rise in unemployment is reflected in labor force sta-tus flows. Each month, BLS reports on the number of people employed, unemployed, or not in the labor force as measured by the CPS. The net changes in the num-ber of people employed and unemployed from month to month are important gauges of the health of the U.S.
labor market. A great deal more churning underlies the relatively small net changes that typically occur. Millions of people move between employment and unemployment each month, and millions of others leave the labor mar-ket altogether. Labor force flows data show that, since the onset of the recession, 16.6 million people, representing 7 percent of the population, changed their labor force status in an average month.9
A greater understanding of the increase in unemploy-ment in 2009 can be obtained by examining the updated status (employed, unemployed, or not in the labor force) of people who were unemployed. Chart 6 shows the pro-
Unemployed persons by reason and duration of unemployment, quarterly averages, seasonally adjusted, 2008–09
[Levels in thousands]
Reason and duration
2008 2009 Change, quarter IV
2008 to quarter IV
2009Quarter IV Quarter I Quarter II Quarter III Quarter IV
Reason for unemployment
Job losers and persons who completed temporary jobs ............................................................. 6,253 7,855 9,286 9,866 9,976 3,723
On temporary layoff ................................................... 1,441 1,523 1,740 1,764 1,592 151 Not on temporary layoff ........................................... 4,812 6,332 7,545 8,102 8,383 3,571 Permanent job losers ............................................... 3,725 5,056 6,101 6,641 6,872 3,147 Persons who completed temporary jobs ......... 1,116 1,355 1,382 1,393 1,485 369Job leavers ......................................................................... 956 872 873 862 923 –33Reentrants .......................................................................... 2,717 2,907 3,216 3,285 3,338 621New entrants ..................................................................... 794 896 955 1,075 1,218 424
Percent distribution:Job losers and persons who completed
temporary jobs ............................................................. 58.3 62.7 64.8 65.4 64.5 6.2 On temporary layoff ................................................... 13.4 12.2 12.1 11.7 10.3 –3.1 Not on temporary layoff ........................................... 44.9 50.5 52.7 53.7 54.2 9.3Job leavers ......................................................................... 8.9 7.0 6.1 5.7 6.0 –2.9Reentrants .......................................................................... 25.3 23.2 22.4 21.8 21.6 –3.7New entrants ..................................................................... 7.4 7.2 6.7 7.1 7.9 .5
Duration of unemployment
Less than 5 weeks ............................................................ 3,234 3,437 3,218 3,037 2,945 –2895 to 14 weeks .................................................................... 3,319 3,872 4,085 3,823 3,558 23915 weeks or longer .......................................................... 4,210 5,315 7,051 8,024 8,916 4,706 15 to 26 weeks ................................................................ 1,844 2,350 2,986 2,877 3,033 1,189 27 weeks or longer........................................................ 2,365 2,965 4,065 5,148 5,884 3,519
Mean duration, in weeks .............................................. 19.4 20.2 23.0 25.7 28.3 8.9
Median duration, in weeks ........................................... 10.3 11.3 15.4 16.4 19.9 9.6
Percent distribution:Less than 5 weeks ............................................................ 30.1 27.2 22.4 20.4 19.1 –11.05 to 14 weeks .................................................................... 30.8 30.7 28.5 25.7 23.1 –7.715 weeks or longer .......................................................... 39.1 42.1 49.1 53.9 57.8 18.7 15 to 26 weeks ................................................................ 17.1 18.6 20.8 19.3 19.7 2.6 27 weeks or longer........................................................ 22.2 23.5 28.3 34.6 38.2 16.0
SOURCE: Bureau of Labor Statistics, Current Population Survey.
Table 2.

Monthly Labor Review • March 2010 11
portion of unemployed people who found employment, the share remaining unemployed, and the proportion who left the labor force. The data indicate that, from the fourth quarter of 2008 to the fourth quarter of 2009, unemployed people continued to be less likely to find employment and much more likely to remain unemployed. The share of unemployed people who remained unemployed from one month to the next rose from 58.2 percent in December 2008 to 65.7 percent in December 2009, the highest pro-portion in the history of the series, which began in 1990. The sharp increase in the proportion of people remaining unemployed during 2009 coincides with a sharp rise in the share of the unemployed accounted for by the long-term unemployed (those unemployed for 27 weeks or more). During 2009, the proportion of unemployed people find-ing employment or exiting the labor force continued to trend down. In fact, at the end of 2009, the likelihood that an unemployed person would find employment was the lowest on record.
The number of people who worked part time for economic rea-sons rose in the first half of 2009 and then leveled off. The number of people who worked part time for economic reasons, a measure also known as involuntary part time, was 9.2 million in the fourth quarter of 2009, 1.8 mil-
lion higher than a year earlier. (See chart 7.) Involuntary part-time workers are people who would prefer to work full time but cannot because of slack work or business conditions, or because they are only able to find part-time work. Involuntary part-time employment was on an upward trend during all of 2008, a trend that continued through the first half of 2009. As is typical during job market downturns, most of the rise in involuntary part time work occurred among those who cited slack work or business conditions as their reason for working part time rather than those who could find only part-time work.10
In 2009, the number of people who wanted a job but were not in the labor force increased, as did the number of discouraged workers. The category “not in the labor force” consists of people who are neither employed nor unemployed. In the fourth quarter of 2009, there were 83.5 million people who were not in the labor force. (See table 3.) Of those who were not in the labor force, about two in five were age 65 or over.
The number of people who were not in the labor force but who wanted a job—though they were not currently looking for one—was 5.7 million in the fourth quarter of 2009, up by 707,000 from a year earlier. Among those 5.7 million, 2.4 million had looked at some time in the previ-
Chart 4. Reasons for unemployment, seasonally adjusted, quarterly averages, 1990–2009
Thousands of persons12,000
10,000
8,000
6,000
4,000
2,000
0
Thousands of persons
Job losersReentrants
1990 1991 1992 1993 1994 1995 1996 1997 1998 1999 2000 2001 2002 2003 2004 2005 2006 2007 2008 2009
NOTE: Shaded areas represent recessions as designated by the National Bureau of Economic Research (NBER). The NBER has not yet determined an endpoint for the recession that began in December 2007.
SOURCE: Bureau of Labor Statistics, Current Population Survey.
Job leavers
New entrants
12,000
10,000
8,000
6,000
4,000
2,000
0

U.S. Labor Market, 2009
12 Monthly Labor Review • March 2010
ous 12 months and were available to work. This group is referred to as "persons marginally attached to the labor force."11 In the fourth quarter of 2009, the number of such people was 563,000 higher than it had been a year earlier. Some of the marginally attached were not looking for a job at the time of the survey specifically because they be-lieved that there were no jobs available for them. These "discouraged workers" numbered 866,000 in the fourth quarter of 2009, up by 288,000 from a year earlier.
All of the alternative measures of labor underutilization rose in 2009. A number of indicators of labor underuti-lization are constructed from CPS data. Known as U-1 through U-6, these measures provide information on the degree to which labor resources are underutilized.12 Like the unemployment rate, the other measures tend to show cyclical patterns. U-1 shows the number of people unem-ployed 15 weeks or longer as a percent of the labor force, and U-2 presents job losers and persons who completed temporary jobs as a percent of the labor force. U-3 is the official unemployment rate. Measures U-4 through U-6 include increasingly broader groups of people who may be underutilized in the labor market. U-4 adds discouraged workers to U-3, U-5 adds all other persons marginally at-tached to the labor force to U-4, and U-6 adds involun-
tary part-time workers to U-5. In 2009, U-4 rose to 10.5 percent, U-5 to 11.4 percent, and U-6 to 17.3 percent. By the end of 2009, the U-4, U-5, and U-6 measures were the highest in the history of the series, which began in 1994. (See chart 8.)
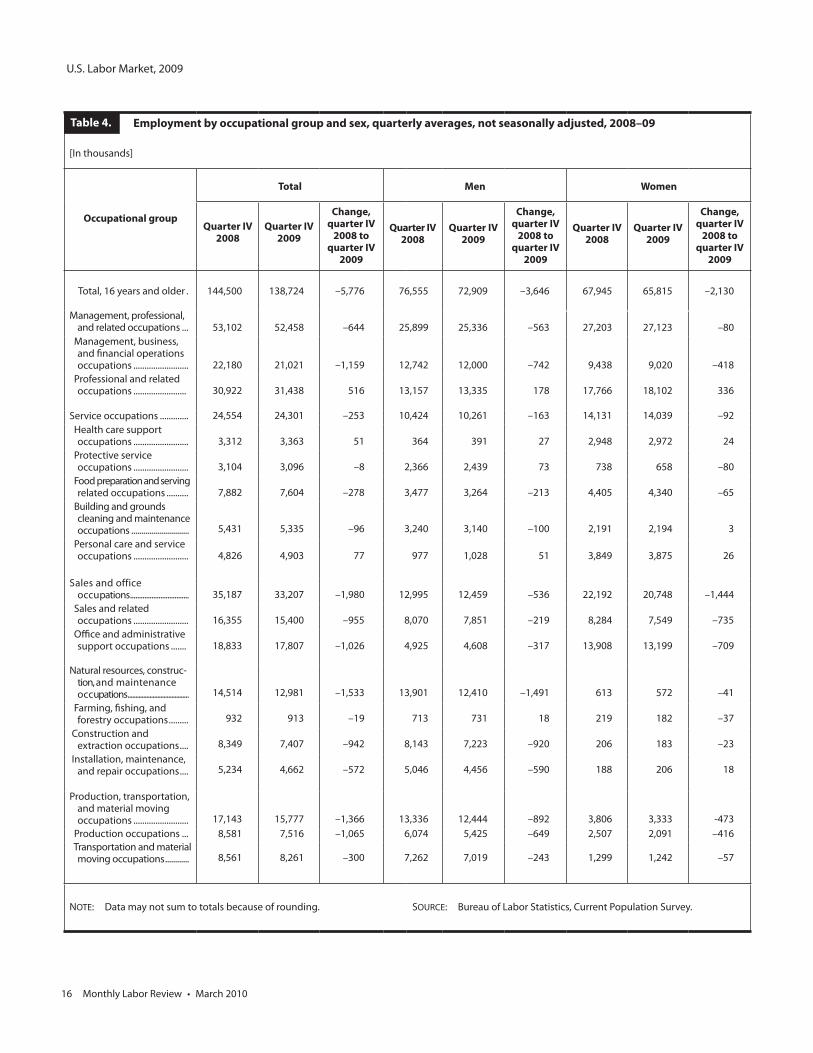
Employment in nearly all occupational groups continued to fall in 2009; unemployment rates for all these groups rose sharply over the year. During 2009, nearly all of the occupational groups shown in table 4 recorded large losses in employ-ment. Among the occupational groups, the largest employ-ment declines in 2009 occurred in sales and office occu-pations—1.0 million in office and administrative support occupations and 955,000 in sales and related occupations. (The data in this section are not seasonally adjusted.) Large employment declines also occurred in construction and ex-traction occupations and in production occupations, which dropped by 942,000 and 1.1 million, respectively, by the last quarter of 2009. Among the occupational groups shown in table 4, construction and extraction occupations and pro-duction occupations recorded the largest over-the-year per-centage declines in employment—11.3 and 12.4 percent, respectively. Employment in management, professional, and related occupations fell by 644,000, with a decline in management, business, and financial operations occupa-
Chart 5. Long-term unemployed as a percent of total unemployed, seasonally adjusted, quarterly averages, 1990–2009
Percent45
40
35
30
25
20
15
10
5
0
Percent
NOTE: Shaded areas represent recessions as designated by the National Bureau of Economic Research (NBER). The NBER has not yet determined an endpoint for the recession that began in December 2007.
SOURCE: Bureau of Labor Statistics, Current Population Survey.
1990 1991 1992 1993 1994 1995 1996 1997 1998 1999 2000 2001 2002 2003 2004 2005 2006 2007 2008 2009
45
40
35
30
25
20
15
10
5
0

Monthly Labor Review • March 2010 13
Chart 6. Percent of the unemployed finding employment, remaining unemployed, or leaving the labor force, seasonally adjusted 3-month moving average, April 1990 to December 2009
Percent Percent
Leaving the labor force
Remaining unemployed
706560
55
50
45
40
35
30
25
20
15
10
50
NOTE: Shaded areas represent recessions as designated by the National Bureau of Economic Research (NBER). The NBER has not yet determined an endpoint for the recession that began in December 2007.
SOURCE: Bureau of Labor Statistics, Current Population Survey.
1990 1991 1992 1993 1994 1995 1996 1997 1998 1999 2000 2001 2002 2003 2004 2005 2006 2007 2008 2009
706560
55
50
45
40
35
30
25
20
15
10
50
Finding employment
Thousands of persons Thousands of persons
Part time for economic reasons
Chart 7. Persons employed part time for economic reasons, seasonally adjusted, quarterly averages, 1969–2009
9,600
8,400
7,200
6,000
4,800
3,600
2,400
1,200
0
NOTE: Shaded areas represent recessions as designated by the National Bureau of Economic Research (NBER). The NBER has not yet determined an endpoint for the recession that began in December 2007. Beginning in 1994, data are affected by the redesign of the Current Population Survey (denoted by the vertical black line) and therefore are not strictly comparable with data from previous years.
SOURCE: Bureau of Labor Statistics, Current Population Survey.
1969 1971 1973 1975 1977 1979 1981 1983 1985 1987 1989 1991 1993 1995 1997 1999 2001 2003 2005 2007 2009
Slack work
Could only find part-time work
9,600
8,400
7,200
6,000
4,800
3,600
2,400
1,200
0

U.S. Labor Market, 2009
14 Monthly Labor Review • March 2010
tions more than offsetting an increase among professional and related occupations. Within service occupations, small employment increases in health care support occupa-tions (51,000) and personal care and service occupations (77,000) were more than offset by a decline of 278,000 in food preparation occupations.
For the majority of occupational groups, employment losses among men were larger than those of women. Em-ployment among men in management, business, and finan-cial operations occupations fell by 742,000, accounting for nearly two-thirds of the job losses in those occupations. In construction and extraction occupations, where men make up the vast majority of workers, men’s employment fell by 920,000; this decline represents virtually all the losses in those occupations. The employment of men in production occupations fell by 649,000, the majority of losses in those occupations. In office and administrative support occupa-tions, a group in which women make up the majority of workers, women’s employment declined by 709,000. Both men and women had employment increases in professional and related occupations, with gains of 178,000 and 336,000, respectively. For both men and women, employment increas-es in professional and related occupations were concentrated in health care practitioner and technical occupations.
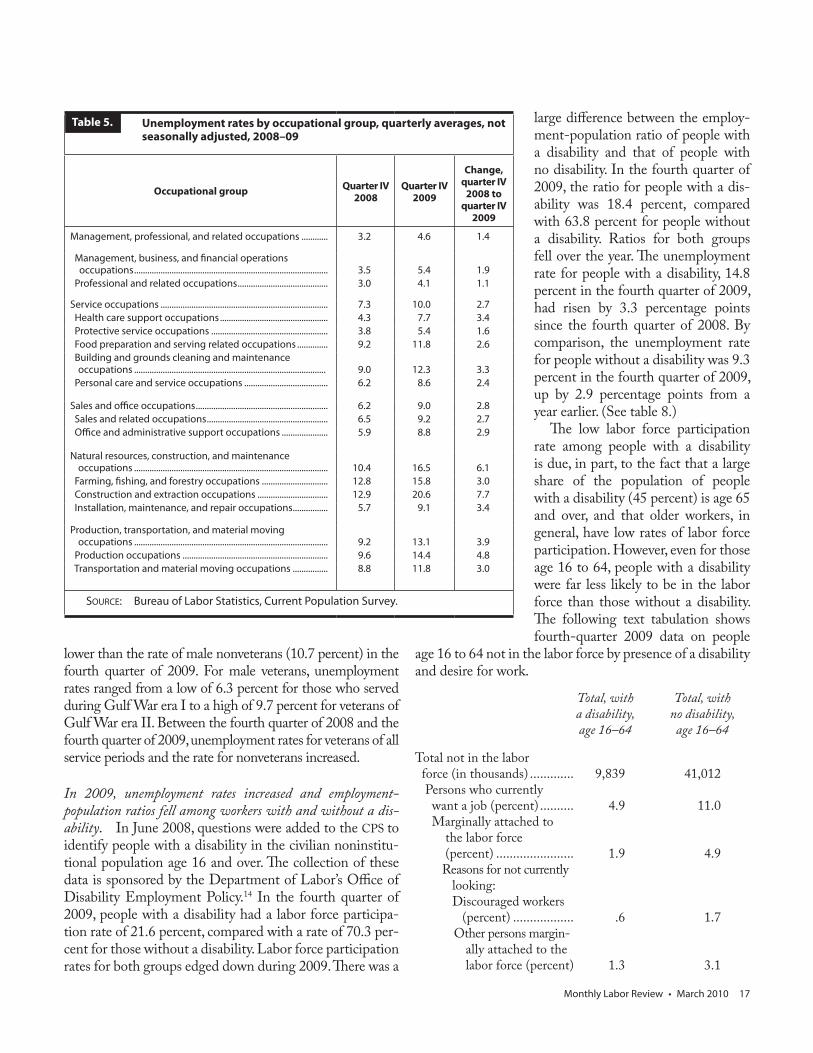
Not surprisingly, unemployment rates for nearly all of the occupational groups in table 5 rose sharply during 2009. The greater impact of the economic decline on men can be attributed mainly to the concentration of men in occupations that are more sensitive to cyclical changes in economic conditions—for example, construction and ex-traction, and production. In 2009, men accounted for 84
percent of employment in these two occupational groups, compared with 49 percent of employment in management, professional, and related occupations. The largest increases in unemployment rates of all the occupational groups in table 5 were for construction and extraction occupations and for production occupations, which reached 20.6 per-cent and 14.4 percent, respectively, in the fourth quarter of 2009. In contrast, the increases in unemployment rates among managers and professionals were much smaller; the rate for management, business, and financial operations occupations rose by 1.9 percentage points, to 5.4 percent, while that for professional and related occupations rose by 1.1 percentage points, to 4.1 percent. Service occupa-tions registered a 2.7-percentage-point increase, reaching an unemployment rate of 10.0 percent by the last quarter of 2009.
Median weekly earnings for full-time wage and salary work-ers increased in 2009, and inflation—as measured by the Consumer Price Index—edged down. From 2008 to 2009, median usual weekly earnings rose by 2.4 percent, to $739. (The data in this section are annual averages, not quarterly data.) Over the year, the Consumer Price Index for All Ur-ban Consumers (CPI-U) edged down by 0.4 percent. The over-the-year increase in median weekly earnings was the smallest since 2005. From 2008 to 2009, weekly earnings at the 90th percentile increased by 3.0 percent—to $1,744—while those at the 10th percentile edged up by 1.2 percent, to $350. During the same period, median weekly earnings for men and women grew at about the same rate—2.6 percent and 3.0 percent, respectively. The ratio of women’s
Persons not in the labor force, quarterly averages, not seasonally adjusted, 2008–09
[In thousands]
Category
2008 2009 Change, quarter IV
2008 to quarter IV
2009Quarter IV Quarter I Quarter II Quarter III Quarter IV
Total not in the labor force ....................................... 80,164 81,253 80,762 81,170 83,450 3,286 Persons who currently want a job ....................... 5,019 5,663 6,311 5,874 5,726 707 Marginally attached to the labor force1 .......... 1,831 2,096 2,159 2,257 2,394 563 Discouraged workers2 ..................................... 578 717 775 753 866 288 Other persons marginally attached to the labor force3 ....................................................... 1,253 1,379 1,384 1,504 1,528 275
1 Data refer to persons who want a job, have searched for work during the previous 12 months, and were available to take a job during the reference week, but had not looked for work in the past 4 weeks.
2 Includes those who did not actively look for work in the previous 4 weeks for reasons such as “thinks no work available,” “could not find work,” “lacks schooling or training,” “employer thinks too young or old,”
and other types of discrimination.3 Includes those who did not actively look for work in the previous
4 weeks for such reasons as school or family responsibilities, ill health, and transportation problems, as well as a number for whom the reason for nonparticipation was not determined.
SOURCE: Bureau of Labor Statistics, Current Population Survey.
Table 3.

Monthly Labor Review • March 2010 15
earnings to men’s earnings was 80.2 percent in 2009. Over time, the earnings gap between the sexes has narrowed con-siderably: in 1979, women’s earnings were 62.3 percent of men’s earnings. (See table 6 and chart 9.)
Among the major race and ethnicity groups, earnings increases from 2008 to 2009 were relatively small. For Asians and Hispanics, earnings increases were 2.2 percent and 2.3 percent, respectively. For both Whites and Blacks, earnings rose by 2.0 percent.
Workers age 25 and over with at least a bachelor’s degree continued to have the highest median earnings among the education groups in table 6, $1,137 in 2009. This group had a 2.0 percent increase in earnings over the previous year’s es-timate—the largest among all four educational-attainment categories. Workers with some college or an associate’s de-gree experienced an earnings increase of 0.6 percent, to $726. Earnings of high school graduates with no college rose by 1.3 percent, to $626. For workers without a high school diploma, earnings edged up by 0.2 percent, to $454. (See table 6.)
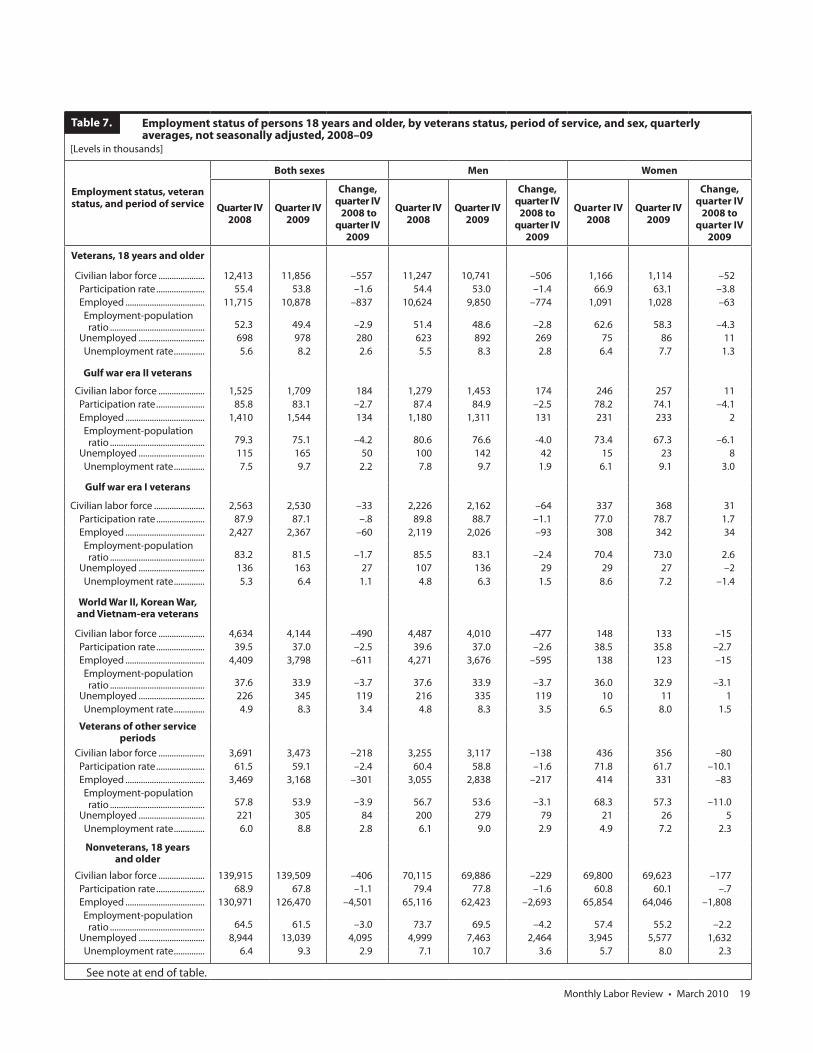
In 2009, unemployment rates for veterans of all periods of ser-vice rose, as did the rate for nonveterans. In the CPS, veter-ans are defined as men and women who have previously served on active duty in the U.S. Armed Forces and who
were civilians at the time of the survey. In the fourth quar-ter of 2009, 22.0 million men and women in the civilian noninstitutional population age 18 and over were veter-ans. Veterans are more likely than nonveterans to be men, white, and older. In part, this reflects the characteristics of veterans who served during World War II, the Korean War, and the Vietnam era. Veterans who served during these wars account for about one-half of the veteran pop-ulation. A total of 5.0 million veterans served during Gulf War era I (August 1990 to August 2001) or Gulf War era II (September 2001 to present).13 Another 5.9 million served outside the designated wartime periods.
Overall, 53.0 percent of male veterans age 18 and over were in the labor force in the fourth quarter of 2009, com-pared with 77.8 percent of their nonveteran counterparts. This difference in participation rates reflects the older age profile of male veterans, who are much more likely than nonveterans to be age 55 or over. For both male veterans and male nonveterans, labor force participation fell during 2009. Reflecting the sharp decline in employment, employ-ment-population ratios for veterans of all service periods and the ratio for nonveterans fell during 2009. (See table 7.)
The unemployment rate of male veterans (8.3 percent) was
Chart 8. Measures of labor underutilization, U-1 to U-6, seasonally adjusted, quarterly averages, 1994–2009
Percent Percent
20
18
16
14
12
10
8
6
4
2
01994 1995 1996 1997 1998 1999 2000 2001 2002 2003 2004 2005 2006 2007 2008 2009
20
18
16
14
12
10
8
6
4
2
0
NOTE: Shaded areas represent recessions as designated by the National Bureau of Economic Research (NBER). The NBER has not yet determined an endpoint for the recession that began in December 2007. U-3 is the official unemployment rate.
SOURCE: Bureau of Labor Statistics, Current Population Survey.
U-6
U-3
U-5U-4
U-1
U-2
U.S. Labor Market, 2009
16 Monthly Labor Review • March 2010
Employment by occupational group and sex, quarterly averages, not seasonally adjusted, 2008–09
[In thousands]
Occupational group
Total Men Women
Quarter IV 2008
Quarter IV 2009
Change, quarter IV
2008 to quarter IV
2009
Quarter IV 2008
Quarter IV 2009
Change, quarter IV
2008 to quarter IV
2009
Quarter IV 2008
Quarter IV 2009
Change,quarter IV
2008 to quarter IV
2009
Total, 16 years and older . 144,500 138,724 –5,776 76,555 72,909 –3,646 67,945 65,815 –2,130
Management, professional, and related occupations ... 53,102 52,458 –644 25,899 25,336 –563 27,203 27,123 –80
Management, business, and financial operations occupations ......................... 22,180 21,021 –1,159 12,742 12,000 –742 9,438 9,020 –418
Professional and related occupations ........................ 30,922 31,438 516 13,157 13,335 178 17,766 18,102 336
Service occupations ............. 24,554 24,301 –253 10,424 10,261 –163 14,131 14,039 –92 Health care support
occupations ......................... 3,312 3,363 51 364 391 27 2,948 2,972 24 Protective service
occupations ......................... 3,104 3,096 –8 2,366 2,439 73 738 658 –80 Food preparation and serving
related occupations .......... 7,882 7,604 –278 3,477 3,264 –213 4,405 4,340 –65 Building and grounds
cleaning and maintenance occupations ............................. 5,431 5,335 –96 3,240 3,140 –100 2,191 2,194 3
Personal care and service occupations ......................... 4,826 4,903 77 977 1,028 51 3,849 3,875 26
Sales and office occupations ................................. 35,187 33,207 –1,980 12,995 12,459 –536 22,192 20,748 –1,444
Sales and related occupations ......................... 16,355 15,400 –955 8,070 7,851 –219 8,284 7,549 –735
Office and administrative support occupations ....... 18,833 17,807 –1,026 4,925 4,608 –317 13,908 13,199 –709
Natural resources, construc-tion, and maintenance occupations ....................................... 14,514 12,981 –1,533 13,901 12,410 –1,491 613 572 –41
Farming, fishing, and forestry occupations ......... 932 913 –19 713 731 18 219 182 –37
Construction and extraction occupations .... 8,349 7,407 –942 8,143 7,223 –920 206 183 –23
Installation, maintenance, and repair occupations .... 5,234 4,662 –572 5,046 4,456 –590 188 206 18
Production, transportation, and material moving occupations ......................... 17,143 15,777 –1,366 13,336 12,444 –892 3,806 3,333 -473
Production occupations ... 8,581 7,516 –1,065 6,074 5,425 –649 2,507 2,091 –416 Transportation and material
moving occupations ............ 8,561 8,261 –300 7,262 7,019 –243 1,299 1,242 –57
NOTE: Data may not sum to totals because of rounding. SOURCE: Bureau of Labor Statistics, Current Population Survey.
Table 4.
Monthly Labor Review • March 2010 17
lower than the rate of male nonveterans (10.7 percent) in the fourth quarter of 2009. For male veterans, unemployment rates ranged from a low of 6.3 percent for those who served during Gulf War era I to a high of 9.7 percent for veterans of Gulf War era II. Between the fourth quarter of 2008 and the fourth quarter of 2009, unemployment rates for veterans of all service periods and the rate for nonveterans increased.
In 2009, unemployment rates increased and employment-population ratios fell among workers with and without a dis-ability. In June 2008, questions were added to the CPS to identify people with a disability in the civilian noninstitu-tional population age 16 and over. The collection of these data is sponsored by the Department of Labor’s Office of Disability Employment Policy.14 In the fourth quarter of 2009, people with a disability had a labor force participa-tion rate of 21.6 percent, compared with a rate of 70.3 per-cent for those without a disability. Labor force participation rates for both groups edged down during 2009. There was a
large difference between the employ-ment-population ratio of people with a disability and that of people with no disability. In the fourth quarter of 2009, the ratio for people with a dis-ability was 18.4 percent, compared with 63.8 percent for people without a disability. Ratios for both groups fell over the year. The unemployment rate for people with a disability, 14.8 percent in the fourth quarter of 2009, had risen by 3.3 percentage points since the fourth quarter of 2008. By comparison, the unemployment rate for people without a disability was 9.3 percent in the fourth quarter of 2009, up by 2.9 percentage points from a year earlier. (See table 8.)
The low labor force participation rate among people with a disability is due, in part, to the fact that a large share of the population of people with a disability (45 percent) is age 65 and over, and that older workers, in general, have low rates of labor force participation. However, even for those age 16 to 64, people with a disability were far less likely to be in the labor force than those without a disability. The following text tabulation shows fourth-quarter 2009 data on people
age 16 to 64 not in the labor force by presence of a disability and desire for work.
Total, with Total, with a disability, no disability, age 16–64 age 16–64
Total not in the labor force (in thousands) ............. 9,839 41,012 Persons who currently want a job (percent) .......... 4.9 11.0 Marginally attached to the labor force (percent) ....................... 1.9 4.9 Reasons for not currently looking: Discouraged workers (percent) .................. .6 1.7 Other persons margin- ally attached to the labor force (percent) 1.3 3.1
Unemployment rates by occupational group, quarterly averages, not seasonally adjusted, 2008–09
Occupational group Quarter IV 2008
Quarter IV 2009
Change, quarter IV
2008 to quarter IV
2009
Management, professional, and related occupations ............ 3.2 4.6 1.4
Management, business, and financial operations occupations ........................................................................................ 3.5 5.4 1.9 Professional and related occupations ......................................... 3.0 4.1 1.1
Service occupations ............................................................................ 7.3 10.0 2.7 Health care support occupations ................................................. 4.3 7.7 3.4 Protective service occupations ..................................................... 3.8 5.4 1.6 Food preparation and serving related occupations .............. 9.2 11.8 2.6 Building and grounds cleaning and maintenance
occupations ....................................................................................... 9.0 12.3 3.3 Personal care and service occupations ...................................... 6.2 8.6 2.4
Sales and office occupations ............................................................ 6.2 9.0 2.8 Sales and related occupations ....................................................... 6.5 9.2 2.7 Office and administrative support occupations ..................... 5.9 8.8 2.9
Natural resources, construction, and maintenance occupations ........................................................................................ 10.4 16.5 6.1
Farming, fishing, and forestry occupations .............................. 12.8 15.8 3.0 Construction and extraction occupations ................................ 12.9 20.6 7.7 Installation, maintenance, and repair occupations ................ 5.7 9.1 3.4
Production, transportation, and material moving occupations ........................................................................................ 9.2 13.1 3.9
Production occupations .................................................................. 9.6 14.4 4.8 Transportation and material moving occupations ................ 8.8 11.8 3.0
SOURCE: Bureau of Labor Statistics, Current Population Survey.
Table 5.

U.S. Labor Market, 2009
18 Monthly Labor Review • March 2010
Regardless of disability status, only a small minority of people not in the labor force wanted a job at the time of the survey; 11.0 percent of non-participants without a disability and 4.9 percent of those with a disability wanted a job. People with a disability were less likely than those without a disability to be classified as persons marginally attached to the labor force or as discouraged workers.
Both foreign- and native-born people were adversely affected by poor labor market conditions. In the fourth quarter of 2009, foreign-born workers made up 15.7 percent of the U.S. ci-vilian labor force age 16 and over.The foreign born are people who reside in the United States but who were born outside the country or one of its out-lying areas to parents who were not U.S. citizens.The foreign born include legally admitted immigrants, refu-gees, and temporary residents such as students and temporary workers, as
Median usual weekly earnings of full-time wage and salary workers by selected characteristics, annual averages, 2008–09
Characteristic 2008 2009Percent change, 2008–09
Total, 16 years and older ............................................. $722 $739 2.4
CPI-U (1982–84 = 100) .................................................. 215.3 214.5 –.4
Men .................................................................................. $798 $819 2.6 Women ............................................................................ 638 657 3.0
White ................................................................................ 742 757 2.0 Men ................................................................................ 825 845 2.4 Women .......................................................................... 654 669 2.3
Black or African American ........................................ 589 601 2.0 Men. ............................................................................... 620 621 .2 Women .......................................................................... 554 582 5.1
Asian................................................................................. 861 880 2.2 Men ................................................................................ 966 952 –1.4 Women .......................................................................... 753 779 3.5
Hispanic or Latino ethnicity..................................... 529 541 2.3 Men ................................................................................ 559 569 1.8 Women .......................................................................... 501 509 1.6
Total, 25 years and older ............................................. 761 774 1.7 Less than a high school diploma ............................ 453 454 .2 High school diploma, no college ........................... 618 626 1.3 Some college or associate’s degree ...................... 722 726 .6 Bachelor's degree or higher, total ......................... 1,115 1,137 2.0
SOURCE: Bureau of Labor Statistics, Current Population Survey and Consumer Price Index.
Table 6.
Women’s median usual weekly earnings as a percent of men’s, full-time wage and salary workers, annual averages, 1979–2009
Percent Percent85
80
75
70
65
60
55
50
SOURCE: Bureau of Labor Statistics, Current Population Survey.
1979 1982 1985 1988 1991 1994 1997 2000 2003 2006 2009
85
80
75
70
65
60
55
50
Chart 9.
Monthly Labor Review • March 2010 19
Employment status of persons 18 years and older, by veterans status, period of service, and sex, quarterly averages, not seasonally adjusted, 2008–09
[Levels in thousands]
Employment status, veteran status, and period of service
Both sexes Men Women
Quarter IV 2008
Quarter IV 2009
Change, quarter IV 2008 to
quarter IV 2009
Quarter IV 2008
Quarter IV 2009
Change, quarter IV
2008 to quarter IV
2009
Quarter IV 2008
Quarter IV 2009
Change, quarter IV
2008 to quarter IV
2009
Veterans, 18 years and older
Civilian labor force ..................... 12,413 11,856 –557 11,247 10,741 –506 1,166 1,114 –52 Participation rate ...................... 55.4 53.8 –1.6 54.4 53.0 –1.4 66.9 63.1 –3.8 Employed .................................... 11,715 10,878 –837 10,624 9,850 –774 1,091 1,028 –63 Employment-population ratio ........................................... 52.3 49.4 –2.9 51.4 48.6 –2.8 62.6 58.3 –4.3 Unemployed .............................. 698 978 280 623 892 269 75 86 11 Unemployment rate .............. 5.6 8.2 2.6 5.5 8.3 2.8 6.4 7.7 1.3
Gulf war era II veterans
Civilian labor force ..................... 1,525 1,709 184 1,279 1,453 174 246 257 11 Participation rate ...................... 85.8 83.1 –2.7 87.4 84.9 –2.5 78.2 74.1 –4.1 Employed .................................... 1,410 1,544 134 1,180 1,311 131 231 233 2 Employment-population ratio ........................................... 79.3 75.1 –4.2 80.6 76.6 -4.0 73.4 67.3 –6.1 Unemployed .............................. 115 165 50 100 142 42 15 23 8 Unemployment rate .............. 7.5 9.7 2.2 7.8 9.7 1.9 6.1 9.1 3.0
Gulf war era I veterans
Civilian labor force ....................... 2,563 2,530 –33 2,226 2,162 –64 337 368 31 Participation rate ...................... 87.9 87.1 –.8 89.8 88.7 –1.1 77.0 78.7 1.7 Employed .................................... 2,427 2,367 –60 2,119 2,026 –93 308 342 34 Employment-population ratio ........................................... 83.2 81.5 –1.7 85.5 83.1 –2.4 70.4 73.0 2.6 Unemployed .............................. 136 163 27 107 136 29 29 27 –2 Unemployment rate .............. 5.3 6.4 1.1 4.8 6.3 1.5 8.6 7.2 –1.4
World War II, Korean War, and Vietnam-era veterans
Civilian labor force ..................... 4,634 4,144 –490 4,487 4,010 –477 148 133 –15 Participation rate ...................... 39.5 37.0 –2.5 39.6 37.0 –2.6 38.5 35.8 –2.7 Employed .................................... 4,409 3,798 –611 4,271 3,676 –595 138 123 –15 Employment-population ratio ........................................... 37.6 33.9 –3.7 37.6 33.9 –3.7 36.0 32.9 –3.1 Unemployed .............................. 226 345 119 216 335 119 10 11 1 Unemployment rate .............. 4.9 8.3 3.4 4.8 8.3 3.5 6.5 8.0 1.5
Veterans of other service periods
Civilian labor force ..................... 3,691 3,473 –218 3,255 3,117 –138 436 356 –80 Participation rate ...................... 61.5 59.1 –2.4 60.4 58.8 –1.6 71.8 61.7 –10.1 Employed .................................... 3,469 3,168 –301 3,055 2,838 –217 414 331 –83 Employment-population ratio ........................................... 57.8 53.9 –3.9 56.7 53.6 –3.1 68.3 57.3 –11.0 Unemployed .............................. 221 305 84 200 279 79 21 26 5 Unemployment rate .............. 6.0 8.8 2.8 6.1 9.0 2.9 4.9 7.2 2.3
Nonveterans, 18 years and older
Civilian labor force ..................... 139,915 139,509 –406 70,115 69,886 –229 69,800 69,623 –177 Participation rate ...................... 68.9 67.8 –1.1 79.4 77.8 –1.6 60.8 60.1 –.7 Employed .................................... 130,971 126,470 –4,501 65,116 62,423 –2,693 65,854 64,046 –1,808 Employment-population ratio ........................................... 64.5 61.5 –3.0 73.7 69.5 –4.2 57.4 55.2 –2.2 Unemployed .............................. 8,944 13,039 4,095 4,999 7,463 2,464 3,945 5,577 1,632 Unemployment rate .............. 6.4 9.3 2.9 7.1 10.7 3.6 5.7 8.0 2.3
See note at end of table.
Table 7.

U.S. Labor Market, 2009
20 Monthly Labor Review • March 2010
Employment status of the civilian noninstitutional population, by sex, age, and disability status, quarterly averages, not seasonally adjusted, 2008–09
[Levels in thousands]
Employment status, sex, and age
Persons with a disability Persons with no disability
Quarter IV 2008
Quarter IV 2009
Change, quarter IV
2008 to quarter IV
2009
Quarter IV2008
Quarter IV 2009
Change, quarter IV
2008 to quarter IV
2009
Total, 16 years and older
Civilian labor force ....................................... 6,234 5,830 –404 148,427 147,459 –968 Participation rate ........................................ 23.1 21.6 –1.5 71.4 70.3 –1.1 Employed ...................................................... 5,518 4,967 –551 138,983 133,757 –5,226 Employment-population ratio ............ 20.4 18.4 –2.0 66.9 63.8 –3.1 Unemployed ................................................ 717 863 146 9,444 13,702 4,258 Unemployment rate ................................ 11.5 14.8 3.3 6.4 9.3 2.9
Men, 16 to 64 years
Civilian labor force ....................................... 2,884 2,637 -247 76,030 75,222 –808 Participation rate ........................................ 38.8 36.4 -2.4 84.4 82.8 –1.6 Employed ...................................................... 2,518 2,205 -313 70,661 67,250 –3,411 Employment-population ratio ............ 33.9 30.4 -3.5 78.5 74.1 –4.4 Unemployed ................................................ 366 432 66 5,369 7,972 2,603 Unemployment rate ................................ 12.7 16.4 3.7 7.1 10.6 3.5
Women, 16 to 64 years
Civilian labor force ....................................... 2,464 2,352 –113 66,853 66,379 –474 Participation rate ........................................ 32.4 31.0 –1.4 72.5 71.5 –1.0 Employed ...................................................... 2,162 2,003 –159 63,027 61,000 –2,027 Employment-population ratio ............ 28.5 26.4 –2.1 68.3 65.7 –2.6 Unemployed ................................................ 302 349 47 3,827 5,379 1,552 Unemployment rate ................................ 12.3 14.8 2.5 5.7 8.1 2.4
Both sexes, 65 years and older
Civilian labor force ....................................... 886 840 –46 5,544 5,858 314 Participation rate ........................................ 7.4 6.9 –.5 21.7 22.4 .7 Employed ...................................................... 838 759 –79 5,295 5,507 212 Employment-population ratio ............ 7.0 6.2 –.8 20.7 21.1 .4 Unemployed ................................................ 48 81 33 249 351 102 Unemployment rate ............................. 5.4 9.7 4.3 4.5 6.0 1.5
NOTE: A person with a disability has at least one of the following conditions: deafness or serious difficulty hearing; blindness or serious dif-ficulty seeing, even with glasses; serious difficulty concentrating, remem-bering, or making decisions because of a physical, mental, or emotional condition; serious difficulty walking or climbing stairs; difficulty dressing
or bathing; or difficulty doing errands alone such as visiting a doctor’s of-fice or shopping because of a physical, mental, or emotional condition. Updated population controls are introduced annually with the release of January data.
SOURCE: Bureau of Labor Statistics, Current Population Survey.
Table 8.
Continued—Employment status of persons 18 years and older, by veterans status, period of service, and sex, quarterly averages, not seasonally adjusted, 2008–09
NOTE: Veterans served on active duty in the U.S. Armed Forces and were not on active duty at the time of the survey. Nonveter-ans never served on active duty in the U.S. Armed Forces. Veterans could have served anywhere in the world during these periods of service: Gulf War era II (September 2001-present), Gulf War era I (August 1990–August 2001), Vietnam era (August 1964–April 1975), Korean War (July 1950–January 1955), World War II (December 1941–December 1946), and other service periods (all other time
periods). Veterans who served in more than one wartime period are classified only in the most recent one. Veterans who served during one of the selected wartime periods and another period are classi-fied only in the wartime period. Updated population controls are introduced annually with the release of January data.
SOURCE: Bureau of Labor Statistics, Current Population Survey.
Table 7.
Monthly Labor Review • March 2010 21
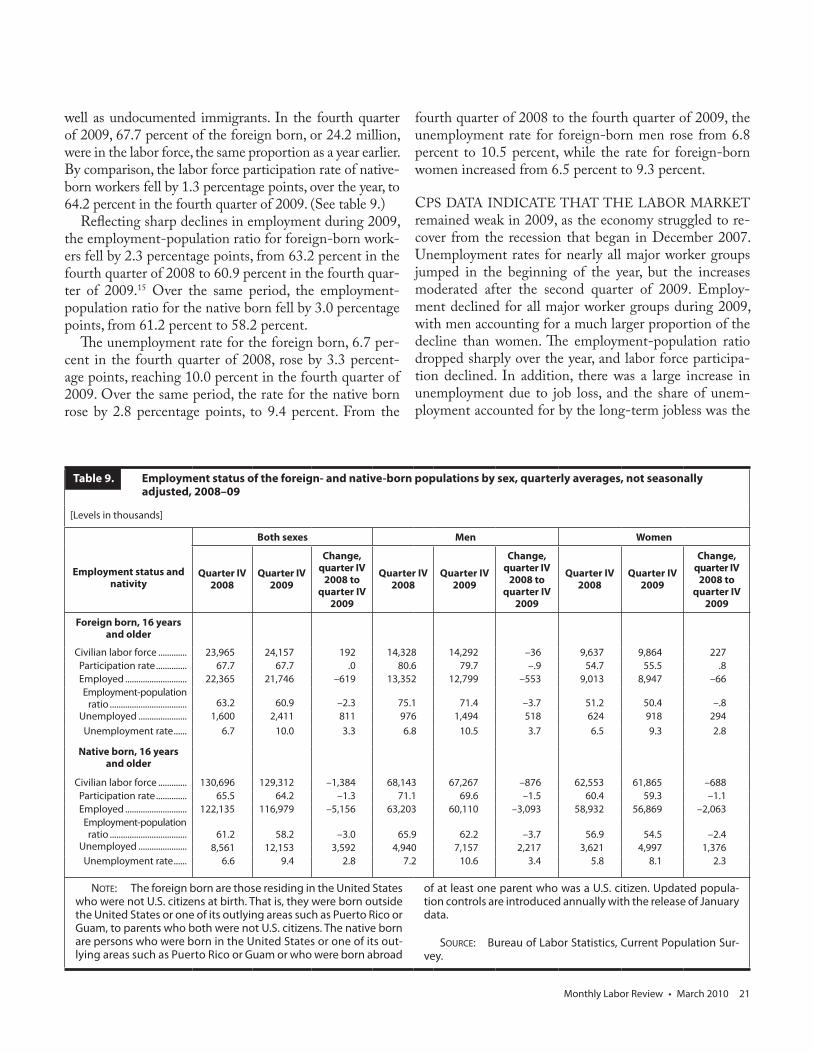
well as undocumented immigrants. In the fourth quarter of 2009, 67.7 percent of the foreign born, or 24.2 million, were in the labor force, the same proportion as a year earlier. By comparison, the labor force participation rate of native-born workers fell by 1.3 percentage points, over the year, to 64.2 percent in the fourth quarter of 2009. (See table 9.)
Reflecting sharp declines in employment during 2009, the employment-population ratio for foreign-born work-ers fell by 2.3 percentage points, from 63.2 percent in the fourth quarter of 2008 to 60.9 percent in the fourth quar-ter of 2009.15 Over the same period, the employment-population ratio for the native born fell by 3.0 percentage points, from 61.2 percent to 58.2 percent.
The unemployment rate for the foreign born, 6.7 per-cent in the fourth quarter of 2008, rose by 3.3 percent-age points, reaching 10.0 percent in the fourth quarter of 2009. Over the same period, the rate for the native born rose by 2.8 percentage points, to 9.4 percent. From the
Employment status of the foreign- and native-born populations by sex, quarterly averages, not seasonally adjusted, 2008–09
[Levels in thousands]
Employment status and nativity
Both sexes Men Women
Quarter IV 2008
Quarter IV 2009
Change, quarter IV
2008 to quarter IV
2009
Quarter IV 2008
Quarter IV 2009
Change, quarter IV
2008 to quarter IV
2009
Quarter IV 2008
Quarter IV 2009
Change, quarter IV
2008 to quarter IV
2009
Foreign born, 16 years and older
Civilian labor force ............. 23,965 24,157 192 14,328 14,292 –36 9,637 9,864 227 Participation rate .............. 67.7 67.7 .0 80.6 79.7 –.9 54.7 55.5 .8 Employed ............................ 22,365 21,746 –619 13,352 12,799 –553 9,013 8,947 –66 Employment-population ratio ................................... Unemployed ......................
63.2 60.9 –2.3 75.1 71.4 –3.7 51.2 50.4 –.81,600 2,411 811 976 1,494 518 624 918 294
Unemployment rate ...... 6.7 10.0 3.3 6.8 10.5 3.7 6.5 9.3 2.8
Native born, 16 years and older
Civilian labor force ............. 130,696 129,312 –1,384 68,143 67,267 –876 62,553 61,865 –688 Participation rate .............. 65.5 64.2 –1.3 71.1 69.6 –1.5 60.4 59.3 –1.1 Employed ............................ 122,135 116,979 –5,156 63,203 60,110 –3,093 58,932 56,869 –2,063 Employment-population ratio ................................... Unemployed ......................
61.2 58.2 –3.0 65.9 62.2 –3.7 56.9 54.5 –2.48,561 12,153 3,592 4,940 7,157 2,217 3,621 4,997 1,376
Unemployment rate ...... 6.6 9.4 2.8 7.2 10.6 3.4 5.8 8.1 2.3
NOTE: The foreign born are those residing in the United States who were not U.S. citizens at birth. That is, they were born outside the United States or one of its outlying areas such as Puerto Rico or Guam, to parents who both were not U.S. citizens. The native born are persons who were born in the United States or one of its out-lying areas such as Puerto Rico or Guam or who were born abroad
of at least one parent who was a U.S. citizen. Updated popula-tion controls are introduced annually with the release of January data.
SOURCE: Bureau of Labor Statistics, Current Population Sur-vey.
Table 9.
fourth quarter of 2008 to the fourth quarter of 2009, the unemployment rate for foreign-born men rose from 6.8 percent to 10.5 percent, while the rate for foreign-born women increased from 6.5 percent to 9.3 percent.
CPS DATA INDICATE THAT THE LABOR MARKET remained weak in 2009, as the economy struggled to re-cover from the recession that began in December 2007. Unemployment rates for nearly all major worker groups jumped in the beginning of the year, but the increases moderated after the second quarter of 2009. Employ-ment declined for all major worker groups during 2009, with men accounting for a much larger proportion of the decline than women. The employment-population ratio dropped sharply over the year, and labor force participa-tion declined. In addition, there was a large increase in unemployment due to job loss, and the share of unem-ployment accounted for by the long-term jobless was the

U.S. Labor Market, 2009
22 Monthly Labor Review • March 2010
largest on record. The number of people employed part time for economic reasons also continued to grow in 2009, although the pace of the increase slowed as the year pro-
gressed. Median weekly earnings for full-time wage and salary workers rose slightly in 2009, while the rate of in-flation edged down.
Notes1 The NBER, the generally recognized arbiter of recessions in the
United States, has designated December 2007 as the beginning of the most recent recession. The NBER has not yet determined an endpoint for the most recent recession.
2 The data in this article are based on information collected in the CPS, which is a survey of about 60,000 households nationwide; the CPS is sponsored jointly by the Bureau of Labor Statistics and the Census Bureau. (For more information about the CPS, see the box on page 5.) Although the CPS is a monthly survey, the data analyzed throughout this article are seasonally adjusted quarterly averages, unless otherwise noted. All over-the-year changes—unless otherwise noted—are com-parisons of fourth-quarter data from 2008 with those from 2009.
3 The labor force participation rate is the civilian labor force as a percent of the civilian noninstitutional population. The labor force is the sum of the employed and unemployed. (A person cannot be con-sidered “unemployed” if he or she is not in the labor force.)
4 For additional analysis of the impact of recessions on various de-mographic groups, see Kristie M. Engemann and Howard J. Wall, “The Effects of Recessions Across Demographic Groups,” Federal Reserve Bank of St. Louis Review, January/February 2010, pp. 1–26; on the In-ternet at http://research.stlouisfed.org/publications/review/10/01/Engemann.pdf (visited Feb. 18, 2010).
5 For more information on teen school enrollment and employ-ment, see Teresa L. Morisi’s forthcoming article in the Monthly Labor Review. See also Teresa L. Morisi, “Youth enrollment and employment during the school year,” Monthly Labor Review, February 2008, pp. 51–63; on the Internet at www.bls.gov/opub/mlr/2008/02/art3full.pdf (visited Feb. 18, 2010). In a recent study, Christopher L. Smith finds evidence that the recent increase in immigration of lower skilled people has had a greater impact on native youth employment than on the employment of native adults. See Christopher L. Smith, “The Impact of Low-Skilled Immigration on the Youth Labor Market,” Fi-nance and Economics Discussion Series, 2010–03, (Federal Reserve Board, December 2009); on the Internet at www.federalreserve.gov/pubs/feds/2010/201003/201003pap.pdf (visited Feb. 19, 2010). Another study, whose findings stand in contrast to those of Smith, estimates the effects of immigration on the productivity, the capital intensity, and the skill bias of U.S. State economies. The author finds that immigrants do not crowd out natives with regard to employment. Moreover, the au-thor finds that immigrants increased total factor productivity and de-creased capital intensity and the skill bias of production technologies. See Giovanni Peri, The Effect of Immigration on Productivity: Evidence from US States, Working Paper 15507 (National Bureau of Economic Research, November 2009).
6 For additional analysis of recent trends in the labor force status of older workers, see Emy Sok, “Record unemployment among older workers does not keep them out of the job market,” Issues in Labor Statistics, Summary 10–04 (Bureau of Labor Statistics, March 2010), on the Internet at www.bls.gov/opub/ils/pdf/opbils81.pdf (visited Mar. 31, 2010).
7 A recent study examined the labor market experiences of white male college graduates who entered the labor market during a reces-sion. The author found that the labor market consequences of graduat-ing college during an economic downturn were large, negative, and persistent. See Lisa B. Kahn, “The Long-Term Labor Market Conse-quences of Graduating College in a Bad Economy,” Labour Economics, forthcoming.
8 Duration of joblessness is the length of time (through the current reference week) that people classified as unemployed have been look-ing for work. This measure refers to the current spell of unemployment rather than to the duration of a completed spell.
9 For more information on labor force flows, including analysis of recent data, see Harley J. Frazis and Randy E. Ilg, “Trends in labor force flows during recent recessions,” Monthly Labor Review, April 2009, pp. 3–18; on the Internet at www.bls.gov/opub/mlr/2009/04/art1full.pdf (visited Feb. 18, 2010).
10 For additional information on people working part time for eco-nomic reasons, see Emy Sok, “Involuntary part-time work on the rise,” Issues in Labor Statistics, Summary 08–08 (Bureau of Labor Statistics, December 2008); on the Internet at www.bls.gov/opub/ils/pdf/op-bils71.pdf (visited Feb. 18, 2010).
11 For additional analysis of marginally attached and discouraged workers, see Sharon Cohany, “Ranks of Discouraged Workers and Others Marginally Attached to the Labor Force Rise During Re-cession,” Issues in Labor Statistics, Summary 09-04 (Bureau of Labor Statistics, April 2009); on the Internet at www.bls.gov/opub/ils/pdf/opbils74.pdf (visited Feb. 18, 2010).
12 For further information on the measures of labor underutiliza-tion, see Steven E. Haugen, “Measures of Labor Underutilization from the Current Population Survey,” Working Paper 424 (Bureau of Labor Statistics, March 2009); on the Internet at www.bls.gov/osmr/pdf/ec090020.pdf (visited Feb. 18, 2010).
13 Veterans who served in more than one wartime period are classi-fied only in the most recent one.
14 For more information about the CPS data on people with a dis-ability, see “Frequently asked questions about disability data” on the BLS Web site at www.bls.gov/cps/cpsdisability_faq.htm (visited Feb. 18, 2010).
15 In a recent report, Pia M. Orrenius and Madeline Zavodny analyze labor market data on the foreign and native born over the 1994–2009 period. The authors find that economic outcomes of the foreign born in the short run are more strongly tied to the business cy-cle than those of their native-born counterparts. See Pia M. Orrenius and Madeline Zavodny, Tied to the Business Cycle: How Immigrants Fare in Good and Bad Economic Times (Washington, DC, Migration Policy Institute, November 2009); on the Internet at www.migrationpolicy.org/pubs/orrenius-Nov09.pdf (visited Feb. 18, 2010).