Monthly Digest of Statistics Singapore February 2012
125
Transcript of Monthly Digest of Statistics Singapore February 2012


MONTHLY DIGEST OF STATISTICS SINGAPORE, FEBRUARY 2012ISSN 0037-5640
© Department of Statistics, Ministry of Trade & Industry, Republic of Singapore All rights reserved. No part of this publication may be reproduced in any material form
(including photocopying or storing it in any medium by electronic means and whether or not
transiently or incidentally to some other use of this publication) without the prior written
permission of the copyright owner except in accordance with the provisions of the Copyright
Act (Cap. 63). Application for the copyright owner's written permission to reproduce any part of
this publication should be addressed to:
Chief Statistician
Department of Statistics
Ministry of Trade & Industry
100 High Street #05-01
The Treasury
Singapore 179434
Republic of Singapore
Statistical activities conducted by the Singapore Department of Statistics are governed by the provisions of the Statistics Act (Cap. 317). The Act guarantees the confidentiality of information collected from individuals and companies. It spells out the legislative authority and responsibility of the Chief Statistician. The Act is available in the Department’s Website (www.singstat.gov.sg).
Nurasikin
Typewritten Text
Nurasikin
Typewritten Text
Nurasikin
Typewritten Text
nurasikin
Typewritten Text
nurasikin
Typewritten Text
nurasikin
Typewritten Text
nurasikin
Typewritten Text
nurasikin
Typewritten Text
nurasikin
Typewritten Text
nurasikin
Typewritten Text

i
PREFACE Archival records showed that monthly indicators on Singapore were available as far back as 1932 under different publication titles. Since January 1962, a consolidated volume was published under the title of The Monthly Digest of Statistics. This present publication contains a wide range of current statistical information on the Singapore economy and society. Monthly or quarterly data for most series are presented for the latest six time periods. Annual figures for the past two years are also included wherever possible. The contents of the Monthly Digest are continually reviewed. Additional data series of interest are included as and when appropriate. Revisions and improvements made to current series of data are also reflected in the latest editions of the publication.
In addition to this Monthly Digest, the Department disseminates official statistics on Singapore through a variety of electronic services. These include the Statistics Singapore Website, SingStat Time Series Online and SingStat Express. Internet users can access the latest issue of the Monthly Digest via the SingStat website. For users who have specific data needs, the Department's Statistical Information Services offers personalized assistance on cost-recovery basis. The data series in the Monthly Digest are compiled by the Singapore Department of Statistics, other government departments and statutory boards and private organisations. I would like to express my appreciation to all the organisations that have contributed to the publication. Wong Wee Kim Chief Statistician Singapore

Our Vision A National Statistical System of Quality, Integrity and Expertise.
Our Mission
We Provide Reliable, Relevant and Timely Statistics
to Support Singapore’s Social and Economic Development.
Our Guiding Principles
Professionalism & Expertise
We adhere to professional ethics and proficiently produce quality statistics that comply with international concepts and best practices.
Relevance We constantly innovate our processes and
produce statistics that meet users’ needs.
Accessibility We make our statistics readily available.
Confidentiality
We protect the confidentiality of information provided to us.
Timeliness & Reliability
We produce statistics that users can depend on and disseminate them at the earliest possible date while maintaining data quality.
Cost Effectiveness
We use resources effectively, minimising respondent burden and leveraging on administrative data.
ii

iii
Monthly Digest of Statistics Singapore
CONTENTS Page
Preface i Notes on Changes and Revisions x Statistical Tables 1 Climate and Air Quality 1 Population 3 Labour and Productivity 9 National Income and Balance of Payments 14 Business Expectations 19 Business Formation and Cessation 21 Manufacturing 23 Construction and Real Estate 26 Services 33 External Trade 39 Transport and Communications 51 Tourism 62 Finance 66 Public Finance 77
Prices 83 Health 103 Community Services 104 Culture and Recreation 106 Miscellaneous 108
Information Dissemination Services 110
LIST OF TABLES BY SECTION Page
iv
Climate and Air Quality 1.1 Air Temperature and Sunshine 1 1.2 Mean Relative Humidity and Rainfall 1 1.3 Air Pollution Levels 2 Population 2.1 Population and Growth Rate 3 2.2 Singapore Residents by Age Group, Ethnic Group and Sex, End June 2011 4 2.3 Live-births by Ethnic Group and Sex 6 2.4 Live-births by Birth Order 6 2.5 Deaths by Ethnic Group and Sex 7 2.6 Infant Deaths by Ethnic Group 7 2.7 Marriages Registered under the Women’s Charter by Ethnic Group of Couple 8 2.8 Marriages Registered under the Administration of Muslim Law Act by Ethnic Group of Couple 8 Labour and Productivity 3.1 Employment Services 9 3.2 Changes in Labour Productivity by Industry 10 3.3 Average Monthly Nominal Earnings Per Employee by Industry 11 3.4 Average Monthly Recruitment Rate by Industry and Occupational Group 12 3.5 Average Monthly Resignation Rate by Industry and Occupational Group 13 National Income and Balance of Payments 4.1 Gross Domestic Product by Industry 14 4.2 Expenditure on Gross Domestic Product 15 4.3 Gross Fixed Capital Formation 15 4.4 Gross Domestic Product Deflators by Industry 16 4.5 Balance of Payments 17 Business Expectations 5.1 Business Expectations for the Manufacturing Sector 19 5.2 Business Expectations for the Services Sector 20

Page
v
Business Formation and Cessation 6.1 Formation of Companies by Industry 21 6.2 Cessation of Companies by Industry 21 6.3 Formation of Businesses by Industry 22 6.4 Cessation of Businesses by Industry 22 Manufacturing 7.1 Index of Industrial Production 23 7.2 Investment Commitments in Manufacturing and Services 25 7.3 Indices of Unit Business Cost and Unit Labour Cost 25 Construction and Real Estate 8.1 Contracts Awarded and Progress Payments Certified 26 8.2 Available and Vacant Private Residential Properties 27 8.3 Supply of Private Residential Properties in the Pipeline by Development Status 28 8.4 Approval, Construction Commencement and Completion of Private Residential Properties 28 8.5 Available and Vacant Executive Condominiums and Supply of Executive Condominiums in the Pipeline by Development Status 29 8.6 Available and Vacant Commercial and Industrial Properties 30 8.7 Supply of Commercial and Industrial Properties in the Pipeline by Development Status 31 8.8 Approval, Construction Commencement and Completion of Commercial and Industrial Developments 32 Services 9.1 Retail Sales Index 33 9.2 Food & Beverage Services Index 35 9.3 Domestic Wholesale Trade Index 36 9.4 Foreign Wholesale Trade Index 37 9.5 Business Receipts Index for Services Industries 38 External Trade 10.1 External Trade by Type 39 10.2 Imports by Major Region/Country 41 10.3 Exports by Major Region/Country 42 10.4 Imports by Commodity Section 43 10.5 Exports by Commodity Section 45 10.6 Domestic Exports by Commodity Section 47 10.7 Re-Exports by Commodity Section 49

Page
vi
Transport and Communications 11.1 Sea Cargo and Shipping Statistics 51 11.2 Civil Aircraft Arrivals/Departures, Passengers and Mail 51 11.3 Air Cargo Discharged by Region/Country of Origin 52 11.4 Air Cargo Loaded by Region/Country of Destination 53 11.5 Air Passenger Arrivals by Region/Country of Embarkation 54 11.6 Air Passenger Departures by Region/Country of Disembarkation 55 11.7 Motor Vehicle Population by Type of Vehicle 56 11.8 Motor Vehicle Population by Vehicle Quota Category 56 11.9 New Registration of Motor Vehicles by Vehicle Quota Category 57 11.10 Motor Vehicles De-Registered by Vehicle Quota Category 57 11.11 Motor Vehicle Quota, Quota Premium and Prevailing Quota Premium 58 11.12 Road Casualties 59 11.13 Postal Articles Handled and Telecommunications 60 11.14 Total SMS Messages 61 Tourism 12.1 International Visitor Arrivals by Region/Country of Residence 62 12.2 International Visitor Arrivals by a) Sex and b) Age Group 63 12.3 International Visitor Arrivals by Length of Stay 64 12.4 Outbound Departures of Singapore Residents by Mode of Transport 64 12.5 Gazetted Hotel Statistics 65 Finance 13.1 Currency in Circulation 66 13.2 Money Supply 66 13.3 Monetary Survey 67 13.4 Domestic Interest Rates 67 13.5 Exchange Rates 68 13.6 Official Foreign Reserves 68 13.7 Assets of Domestic Banking Units 69 13.8 Liabilities of Domestic Banking Units 70 13.9 Loans and Advances of Domestic Banking Units to Non-Bank Customers by Industry 71 13.10 Assets and Liabilities of Asian Currency Units 72 13.11 Assets of Finance Companies 72 13.12 Liabilities of Finance Companies 73 13.13 Assets and Liabilities of Domestic and Asian Currency Unit Operations of Merchant Banks 73

Page
vii
Finance (continued) 13.14 Pledges at Pawnshops 74 13.15 Central Provident Fund Contributions, Withdrawals and Amount Due to Members 75 13.16 Turnover on the Singapore Exchange (Equities) 76 Public Finance 14.1 Government Finance 77 14.2 Government Debt 77 14.3 Government Operating Revenue 78 14.4 Government Operating Expenditure 79 14.5 Government Development Expenditure 80 14.6 Duty-Paid Releases of Liquors 81 14.7 Duty-Paid Releases of Tobacco and Petroleum 82 Prices 15.1 Consumer Price Index 83 15.2 Consumer Price Index for Households in Different Income Groups 87 15.3 Price Indices of Selected Consumer Items 88 15.4 Average Retail Prices of Selected Items 89 15.5 Domestic Supply Price Index 91 15.6 Singapore Manufactured Products Price Index 93 15.7 Import Price Index 95 15.8 Export Price Index 97 15.9 Construction Materials Market Prices 99 15.10 Price Index of Housing & Development Board Resale Flats 100 15.11 Private Property Price Index by Type of Property 100 15.12 Price Indices of Non-Landed Private Residential Properties by Locality and Completion Status 101 15.13 Commercial Property Rental Index by Type of Property 102 Health 16.1 Hospital Admissions and Public Sector Outpatient Attendances 103 16.2 Admissions to Public Sector Hospitals 103

Page
viii
Community Services 17.1 Number and Capacity of Child Care Centres 104 17.2 Enrolment in Child Care Centres by Type of Programme and Organisation 104 17.3 Public Assistance Recipients by Category 105 17.4 Residents in Old Folk’s Homes by Type of Organisation and Sex 105 Culture and Recreation 18.1 Attendances at Cinemas and Visitors to Places of Interest 106 18.2 Utilisation of Sports Facilities 107 Miscellaneous 19.1 Electricity Generation and Sales 108 19.2 Gas Sales 108 19.3 Livestock Slaughtered and Fish Supply and Wholesale 109 19.4 Number of Bankruptcy Petitions, Orders Made and Discharges 109

ix
NOTATION p preliminary na not available - nil or negligible nec not elsewhere classified nes not elsewhere specified NOTES Figures may not add up to totals due to rounding. Some figures, particularly those for the most recent time periods, are
provisional and may be subject to revision in later issues. Values are shown in Singapore dollars (unless otherwise stated) OTHER REFERENCE A companion book, “Yearbook of Statistics Singapore, 2011”, is published by
the Singapore Department of Statistics. The Yearbook contains brief notes on coverage, definitions and data sources for each topic and annual data for ten years ago and the latest six years.
x
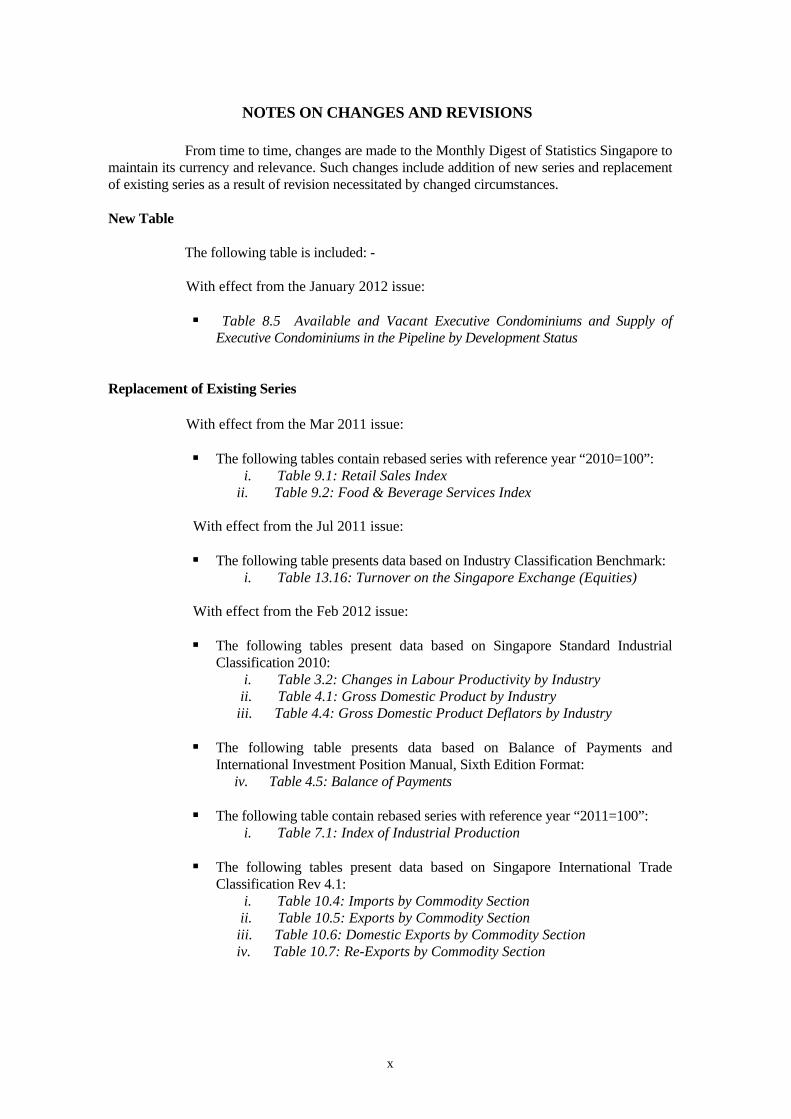
NOTES ON CHANGES AND REVISIONS
From time to time, changes are made to the Monthly Digest of Statistics Singapore to maintain its currency and relevance. Such changes include addition of new series and replacement of existing series as a result of revision necessitated by changed circumstances. New Table The following table is included: - With effect from the January 2012 issue:
Table 8.5 Available and Vacant Executive Condominiums and Supply of Executive Condominiums in the Pipeline by Development Status
Replacement of Existing Series With effect from the Mar 2011 issue:
The following tables contain rebased series with reference year “2010=100”: i. Table 9.1: Retail Sales Index ii. Table 9.2: Food & Beverage Services Index
With effect from the Jul 2011 issue:
The following table presents data based on Industry Classification Benchmark: i. Table 13.16: Turnover on the Singapore Exchange (Equities)
With effect from the Feb 2012 issue:
The following tables present data based on Singapore Standard Industrial Classification 2010:
i. Table 3.2: Changes in Labour Productivity by Industry ii. Table 4.1: Gross Domestic Product by Industry iii. Table 4.4: Gross Domestic Product Deflators by Industry The following table presents data based on Balance of Payments and
International Investment Position Manual, Sixth Edition Format: iv. Table 4.5: Balance of Payments The following table contain rebased series with reference year “2011=100”: i. Table 7.1: Index of Industrial Production The following tables present data based on Singapore International Trade
Classification Rev 4.1: i. Table 10.4: Imports by Commodity Section ii. Table 10.5: Exports by Commodity Section iii. Table 10.6: Domestic Exports by Commodity Section iv. Table 10.7: Re-Exports by Commodity Section

xi
Other Changes With effect from the June 2011 issue:
Table 11.3: Air Cargo Discharged by Region/Country of Region Table 11.4: Air Cargo Loaded by Region/Country of Destination: ‘Vietnam’ has been added. ‘‘West Asia” has been renamed to “Middle East”. Data breakdown for selected countries have been discontinued.
Table 11.5: Air Passenger Arrivals by Region/Country of Embarkation Table 11.6: Air Passenger Departures by Region/Country of Disembarkation ‘‘West Asia” has been renamed to “Middle East”
With effect from the Oct 2011 issue: Table 1.3: Air Pollution Levels: “PM10 (µg/m3) (mean)” has been added.
Table 17.2: Enrolment in Child Care Centres by Type of Programme and
Organisation: “Voluntary” and “PAP Community Foundation” have been added.
With effect from the Jan 2012 issue: Table 11.12: Road Casualties: “Others”, “Others : Fatalities” and “Others :
Injured” have been added.
Table 15.1: Consumer Price Index Table15.2: Consumer Price Index for Households in Different Income Groups: “Consumer Price Index : All Items less Imputed Rentals on Owner-Occupied Accommodation” has been added.
With effect from the Feb 2012 issue: Table 19.3: Livestock Slaughtered and Fish Supply and Wholesale: “Fish
Supply: Imports” and “Fish Supply: Exports” have been revised based on Singapore International Trade Classification Rev 4.1.
Climate and Air Quality
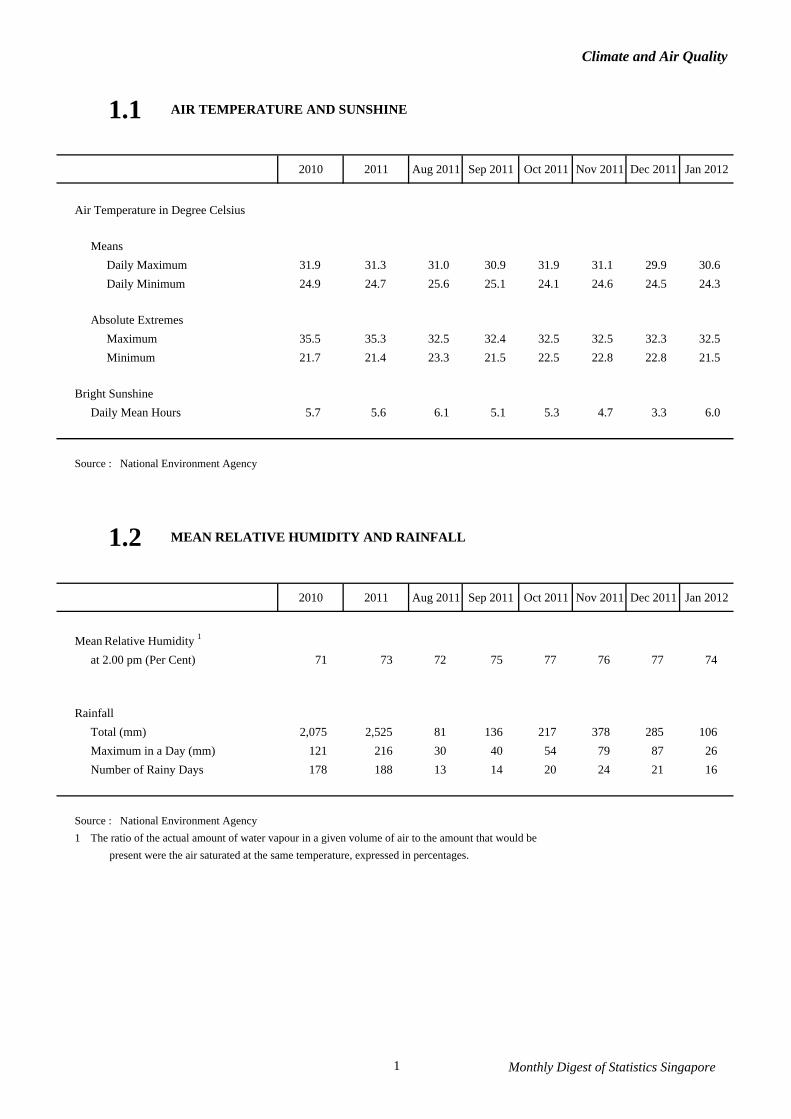
1.1 AIR TEMPERATURE AND SUNSHINE
2010 2011 Aug 2011 Sep 2011 Oct 2011 Nov 2011 Dec 2011 Jan 2012
Air Temperature in Degree Celsius
MeansDaily Maximum 31.9 31.3 31.0 30.9 31.9 31.1 29.9 30.6 Daily Minimum 24.9 24.7 25.6 25.1 24.1 24.6 24.5 24.3
Absolute ExtremesMaximum 35.5 35.3 32.5 32.4 32.5 32.5 32.3 32.5 Minimum 21.7 21.4 23.3 21.5 22.5 22.8 22.8 21.5
Bright SunshineDaily Mean Hours 5.7 5.6 6.1 5.1 5.3 4.7 3.3 6.0
Source : National Environment Agency
1.2 MEAN RELATIVE HUMIDITY AND RAINFALL
2010 2011 Aug 2011 Sep 2011 Oct 2011 Nov 2011 Dec 2011 Jan 2012
Mean Relative Humidity 1
at 2.00 pm (Per Cent) 71 73 72 75 77 76 77 74
RainfallTotal (mm) 2,075 2,525 81 136 217 378 285 106 Maximum in a Day (mm) 121 216 30 40 54 79 87 26 Number of Rainy Days 178 188 13 14 20 24 21 16
Source : National Environment Agency1 The ratio of the actual amount of water vapour in a given volume of air to the amount that would be
present were the air saturated at the same temperature, expressed in percentages.
1 Monthly Digest of Statistics Singapore

Climate and Air Quality
1.3 AIR POLLUTION LEVELS
2010 2011 Aug 2011 Sep 2011 Oct 2011 Nov 2011 Dec 2011 Jan 2012
Sulphur Dioxide (µg / m3 ) (mean) 11 10 14 18 13 8 6 7
Nitrogen Dioxide (µg / m3 ) (mean) 23 25 31 33 30 25 22 19
PM 10 (µg / m3 ) 1
(2nd Maximum 24-hourly mean) 127 76 49 74 54 34 40 42
(mean) 26 27 32 34 26 21 23 23
Carbon Monoxide (mg / m3 ) 2.2 2.0 1.6 1.9 1.6 1.4 1.1 1.2 (2nd Maximum 8-hourly mean)
Ozone (µg / m3 ) 129 110 74 70 76 78 83 97 (4th Maximum 8-hourly mean)
Source : National Environment AgencyNotes : United States Environmental Protection Agency (USEPA) Standards for Air Quality
Sulphur Dioxide ≤ 80 µg/m3 (annual mean)
Nitrogen Dioxide ≤ 100 µg/m3 (annual mean)
PM 10 (Particulate Matter ≤ 10 microns ) ≤ 150 µg/m3 (2nd Maximum 24-hourly mean)
Carbon Monoxide ≤ 10 mg/m3 (2nd Maximum 8-hourly mean)
Ozone ≤ 147 µg/m3 (4th Maximum 8-hourly mean)
All measurements of air quality are corrected to reference temperature of 25oC and pressure of 760 mm of mercury.
2 Monthly Digest of Statistics Singapore
Population
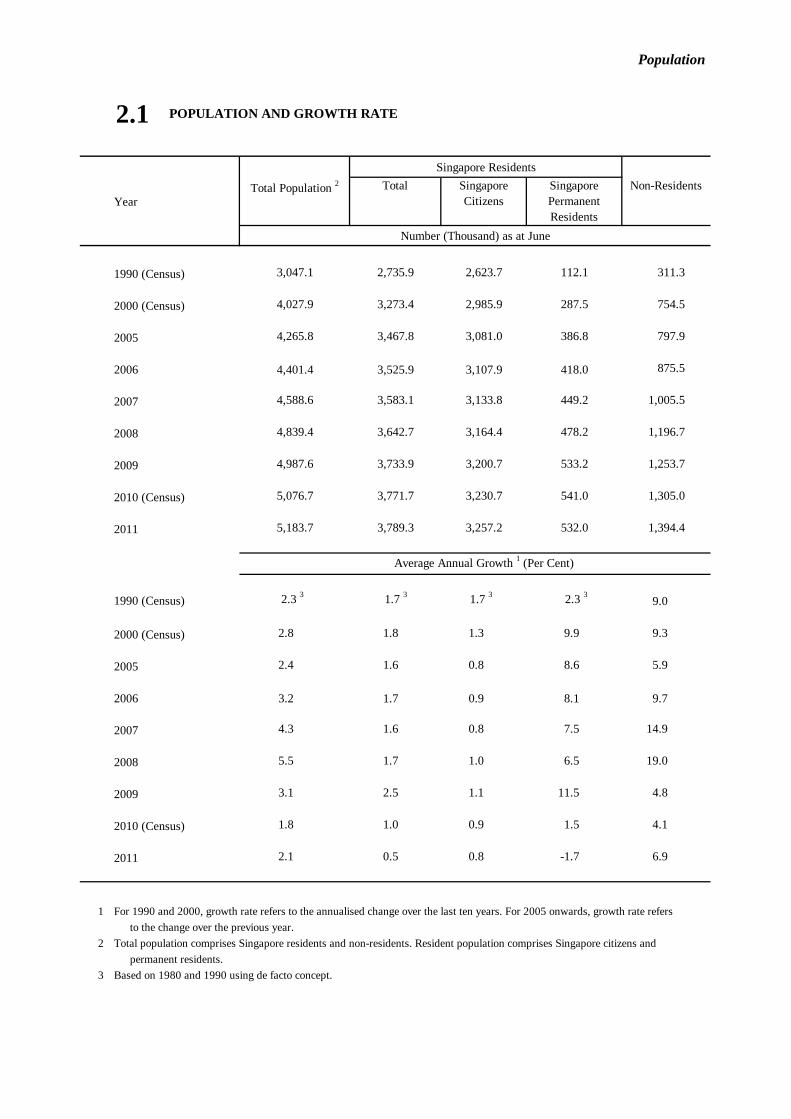
2.1 POPULATION AND GROWTH RATE
YearTotal Population 2 Total Singapore
CitizensSingapore Permanent Residents
Non-Residents
Number (Thousand) as at June
1990 (Census) 3,047.1 2,735.9 2,623.7 112.1 311.3
2000 (Census) 4,027.9 3,273.4 2,985.9 287.5 754.5
2005 4,265.8 3,467.8 3,081.0 386.8 797.9
2006 4,401.4 3,525.9 3,107.9 418.0 875.5
2007 4,588.6 3,583.1 3,133.8 449.2 1,005.5
2008 4,839.4 3,642.7 3,164.4 478.2 1,196.7
2009 4,987.6 3,733.9 3,200.7 533.2 1,253.7
2010 (Census) 5,076.7 3,771.7 3,230.7 541.0 1,305.0
2011 5,183.7 3,789.3 3,257.2 532.0 1,394.4
Average Annual Growth 1 (Per Cent)
1990 (Census) 2.3 3 1.7 3 1.7 3 2.3 3 9.0
2000 (Census) 2.8 1.8 1.3 9.9 9.3
2005 2.4 1.6 0.8 8.6 5.9
2006 3.2 1.7 0.9 8.1 9.7
2007 4.3 1.6 0.8 7.5 14.9
2008 5.5 1.7 1.0 6.5 19.0
2009 3.1 2.5 1.1 11.5 4.8
2010 (Census) 1.8 1.0 0.9 1.5 4.1
2011 2.1 0.5 0.8 -1.7 6.9
1 For 1990 and 2000, growth rate refers to the annualised change over the last ten years. For 2005 onwards, growth rate refers to the change over the previous year.
2 Total population comprises Singapore residents and non-residents. Resident population comprises Singapore citizens andpermanent residents.
3 Based on 1980 and 1990 using de facto concept.
Singapore Residents

Population
2.2 SINGAPORE RESIDENTS BY AGE GROUP, ETHNIC GROUP
AND SEX, END JUNE 2011
Ethnic Group / Sex Total 0 - 4 5 - 9 10 - 14 15 - 19 20 - 24 25 - 29 30 - 34 35 - 39
Total 3,789.3 188.2 208.1 240.5 260.7 255.1 262.6 297.6 316.2 Males 1,868.2 95.9 106.0 123.4 132.6 128.2 127.1 141.9 154.1 Females 1,921.1 92.4 102.1 117.1 128.2 126.8 135.5 155.6 162.1
Chinese 2,808.3 126.4 135.7 164.7 183.7 181.8 188.7 215.3 231.7 Males 1,375.7 64.8 69.5 85.0 93.8 91.7 92.0 102.1 110.4 Females 1,432.6 61.6 66.2 79.7 89.9 90.2 96.7 113.2 121.3
Malays 506.6 31.4 35.3 42.6 47.7 46.2 38.7 31.0 32.2 Males 252.2 16.1 18.2 22.1 24.5 23.6 19.6 15.0 15.6 Females 254.4 15.3 17.1 20.5 23.2 22.6 19.2 16.0 16.6
Indians 349.0 22.0 26.9 24.1 22.8 21.8 26.8 36.2 35.5 Males 180.5 10.9 13.4 12.1 11.3 10.8 12.4 18.5 20.2 Females 168.5 11.1 13.5 12.0 11.5 11.1 14.4 17.7 15.3
Others 125.3 8.4 10.3 9.1 6.5 5.2 8.4 15.0 16.8 Males 59.7 4.1 5.0 4.3 2.9 2.2 3.2 6.3 7.9 Females 65.6 4.3 5.3 4.8 3.6 3.0 5.3 8.7 9.0
Note : Singapore resident population comprises Singapore citizens and permanent residents.
Thousand
4 Monthly Digest of Statistics Singapore

Population
2.2 SINGAPORE RESIDENTS BY AGE GROUP, ETHNIC GROUP
AND SEX, END JUNE 2011 (continued)
Thousand
Ethnic Group / Sex 40 - 44 45 - 49 50 - 54 55 - 59 60 - 64 65 - 69 70 - 74 75 - 79 80 - 84 85 & over
Total 306.6 324.0 308.1 260.7 208.2 112.4 100.1 66.9 42.1 31.1 Males 150.7 163.0 155.4 130.7 102.8 54.1 46.1 29.1 16.6 10.2 Females 155.9 161.0 152.7 130.0 105.4 58.3 53.9 37.8 25.6 20.9
Chinese 225.7 240.9 237.7 209.0 171.1 94.8 84.4 54.9 35.1 26.9 Males 108.4 120.1 119.1 104.7 84.5 45.7 38.9 23.9 13.2 8.0 Females 117.3 120.8 118.6 104.3 86.6 49.1 45.4 31.0 21.9 18.8
Malays 35.7 44.3 39.6 29.6 20.5 9.7 8.9 7.1 3.8 2.2 Males 17.4 21.9 19.8 14.4 9.8 4.4 4.1 2.9 1.7 1.0 Females 18.4 22.4 19.8 15.1 10.7 5.3 4.8 4.1 2.1 1.1
Indians 30.5 27.8 23.5 17.5 13.2 6.4 5.6 4.1 2.6 1.7 Males 17.8 15.2 12.5 8.9 6.5 3.1 2.5 1.9 1.4 1.0 Females 12.7 12.6 10.9 8.5 6.7 3.3 3.1 2.2 1.2 0.6
Others 14.7 10.9 7.4 4.6 3.3 1.5 1.2 0.9 0.6 0.4 Males 7.2 5.8 4.0 2.6 2.0 0.9 0.6 0.4 0.3 0.2 Females 7.5 5.1 3.4 2.0 1.3 0.6 0.6 0.5 0.4 0.3
Note : Singapore resident population comprises Singapore citizens and permanent residents.
5 Monthly Digest of Statistics Singapore

Population
2.3 LIVE-BIRTHS BY ETHNIC GROUP AND SEX
Ethnic Group / Sex 2010 2011 Aug 2011 Sep 2011 Oct 2011 Nov 2011 Dec 2011 Jan 2012
Total 37,967 39,630 3,328 3,552 3,424 3,620 3,495 3,103 Males 19,643 20,429 1,711 1,892 1,734 1,845 1,799 1,607 Females 18,323 19,201 1,617 1,660 1,690 1,775 1,696 1,496
Chinese 23,303 24,681 2,102 2,195 2,135 2,286 2,218 1,889 Males 12,099 12,872 1,114 1,187 1,086 1,185 1,180 972 Females 11,204 11,809 988 1,008 1,049 1,101 1,038 917
Malays 5,711 5,719 484 507 511 498 472 486 Males 2,961 2,883 240 261 268 244 240 250 Females 2,749 2,836 244 246 243 254 232 236
Indians 4,285 4,378 349 429 337 403 405 345 Males 2,168 2,247 169 227 170 206 189 171 Females 2,117 2,131 180 202 167 197 216 174
Others 4,668 4,852 393 421 441 433 400 383 Males 2,415 2,427 188 217 210 210 190 214 Females 2,253 2,425 205 204 231 223 210 169
Source : Registry of Births and DeathsNote : Data prior to 2011 are based on date of occurrence while those for 2011 are based on date of registration.
Figures for males and females may not add up to the total due to sex not reported.
2.4 LIVE-BIRTHS BY BIRTH ORDER
Birth Order 2010 2011 2010 Q3 2010 Q4 2011 Q1 2011 Q2 2011 Q3 2011 Q4
Total 1 37,967 39,630 9,631 9,592 9,163 9,873 10,055 10,539
1st 18,130 19,040 4,644 4,641 4,495 4,637 4,793 5,115
2nd 13,404 14,082 3,378 3,326 3,165 3,541 3,670 3,706
3rd 4,615 4,732 1,145 1,145 1,060 1,252 1,199 1,221
4th 1,296 1,281 344 337 322 314 299 346
5th 367 331 85 104 82 86 70 93
6th & Over 155 164 35 39 39 43 24 58
Source : Registry of Births and Deaths Note : Data prior to 2011 are based on date of occurrence while those for 2011 are based on date of registration. 1 Includes birth order not stated.
Number
Number
6 Monthly Digest of Statistics Singapore

Population
2.5 DEATHS BY ETHNIC GROUP AND SEX
Ethnic Group / Sex 2010 2011 Aug 2011 Sep 2011 Oct 2011 Nov 2011 Dec 2011 Jan 2012
Total 17,610 17,956 1,451 1,386 1,474 1,484 1,444 1,528 Males 9,682 9,786 790 747 826 784 778 834 Females 7,926 8,170 661 639 648 700 666 694
Chinese 13,349 13,503 1,071 1,060 1,103 1,107 1,086 1,185 Males 7,244 7,250 578 566 597 592 578 635 Females 6,105 6,253 493 494 506 515 508 550
Malays 2,535 2,598 230 211 199 222 209 194 Males 1,381 1,370 114 109 119 102 114 106 Females 1,153 1,228 116 102 80 120 95 88
Indians 1,282 1,396 107 91 128 118 106 112 Males 795 876 72 59 83 69 62 69 Females 487 520 35 32 45 49 44 43
Others 444 459 43 24 44 37 43 37 Males 262 290 26 13 27 21 24 24 Females 181 169 17 11 17 16 19 13
Source : Registry of Births & DeathsNote : Figures for males and females may not add up to the total due to sex not reported.
Data are based on date of registration.
2.6 INFANT DEATHS BY ETHNIC GROUP
Ethnic Group 2010 2011 Aug 2011 Sep 2011 Oct 2011 Nov 2011 Dec 2011 Jan 2012
Total 100 96 7 10 6 10 7 4
Chinese 52 51 3 7 4 6 4 3
Malays 23 29 1 1 1 3 2 -
Indians 15 8 3 1 - 1 - -
Others 10 8 - 1 1 - 1 1
Source : Registry of Births & DeathsNote : Data are based on date of registration.
Number
Number
7 Monthly Digest of Statistics Singapore

Population
2.7 MARRIAGES REGISTERED UNDER THE WOMEN'S CHARTER
BY ETHNIC GROUP OF COUPLE
Ethnic Group of Couple 2010 2011 Aug 2011 Sep 2011 Oct 2011 Nov 2011 Dec 2011 Jan 2012
Total 20,230 22,840 936 2,107 2,322 3,154 2,386 1,515
Chinese 14,535 16,499 525 1,634 1,778 2,468 1,803 1,019
Indians 799 879 48 58 52 113 78 70
Others 1 1,346 1,495 108 86 123 147 142 136
Inter-Ethnic 2 3,550 3,967 255 329 369 426 363 290
Source : Registry of MarriagesNote : Excludes marriages previously solemnized under religious and customary rites.1 "Others" comprises couples of the same ethnicity from other ethnic groups besides Chinese and Indians,
namely Malays, Eurasians, Caucasians and other ethnicities as one single ‘Others’ group.E.g. Eurasian-Eurasian, Caucasian-Caucasian, Others-Others
2 "Inter-Ethnic" marriages refer to marriages where both the groom and bride are of different ethnicity.E.g. Indian-Chinese, Eurasian-Caucasian, Chinese-Malay, Chinese-Others
2.8 MARRIAGES REGISTERED UNDER THE ADMINISTRATION OF MUSLIM LAW ACT
BY ETHNIC GROUP OF COUPLE
Ethnic Group of Couple 2010 2011 Aug 2011 Sep 2011 Oct 2011 Nov 2011 Dec 2011 Jan 2012
Total 4,133 4,418 81 251 458 562 663 298
Malays 2,381 2,635 47 139 273 346 400 159
Indians 174 178 2 15 14 17 28 9
Others 1 200 184 4 15 21 26 29 9
Inter-Ethnic 2 1,378 1,421 28 82 150 173 206 121
Source : Registry of Muslim Marriages1 "Others" comprises Muslim couples of the same ethnicity from other ethnic groups besides Malays and Indians,
namely Chinese, Eurasians, Caucasians, and other ethnicities as one single ‘Others’ group.E.g. Eurasian-Eurasian, Caucasian-Caucasian, Others-Others
2 "Inter-Ethnic" marriages refer to marriages where both the groom and bride are of different ethnicity.E.g. Malay-Indian, Malay-Chinese, Indian-Others
Number
Number
8 Monthly Digest of Statistics Singapore

Labour and Productivity
3.1 EMPLOYMENT SERVICES
2010 2011 Aug 2011 Sep 2011 Oct 2011 Nov 2011 Dec 2011 Jan 2012
Job Seekers Attended toTotal 99,608 100,504 8,181 9,096 8,918 8,605 7,425 7,285
Males 49,614 47,197 3,818 4,307 4,247 4,159 3,774 3,533 Females 49,994 53,307 4,363 4,789 4,671 4,446 3,651 3,752
Job Seekers Given Job Referrals 55,821 44,450 3,444 4,103 3,389 3,794 3,078 3,136
Males 29,010 23,223 1,864 2,201 1,705 2,011 1,760 1,617 Females 26,811 21,227 1,580 1,902 1,684 1,783 1,318 1,519
Job Seekers Placed in Employment 17,732 14,223 1,192 1,331 1,145 1,358 1,223 1,254
Males 9,450 7,487 622 732 599 699 693 678 Females 8,282 6,736 570 599 546 659 530 576
Source : Singapore Workforce Development Agency (WDA)Note : Data are based on date of data entry.
WDA, which was set up in September 2003, has take over from Ministry of Manpower (MOM) on the provisionof employment services. Henceforth, local job seekers can approach the career centres located at theCommunity Development Councils (CDCs), which are collaborations between WDA and the CDCs, as well as e2i,which is operated by the National Trade Union Congress (NTUC) and a partner of WDA in the provision ofemployment services. The figures on employment services above are the results of the collective efforts of the CDC career centres and e2i.
Number
9 Monthly Digest of Statistics Singapore
Labour and Productivity
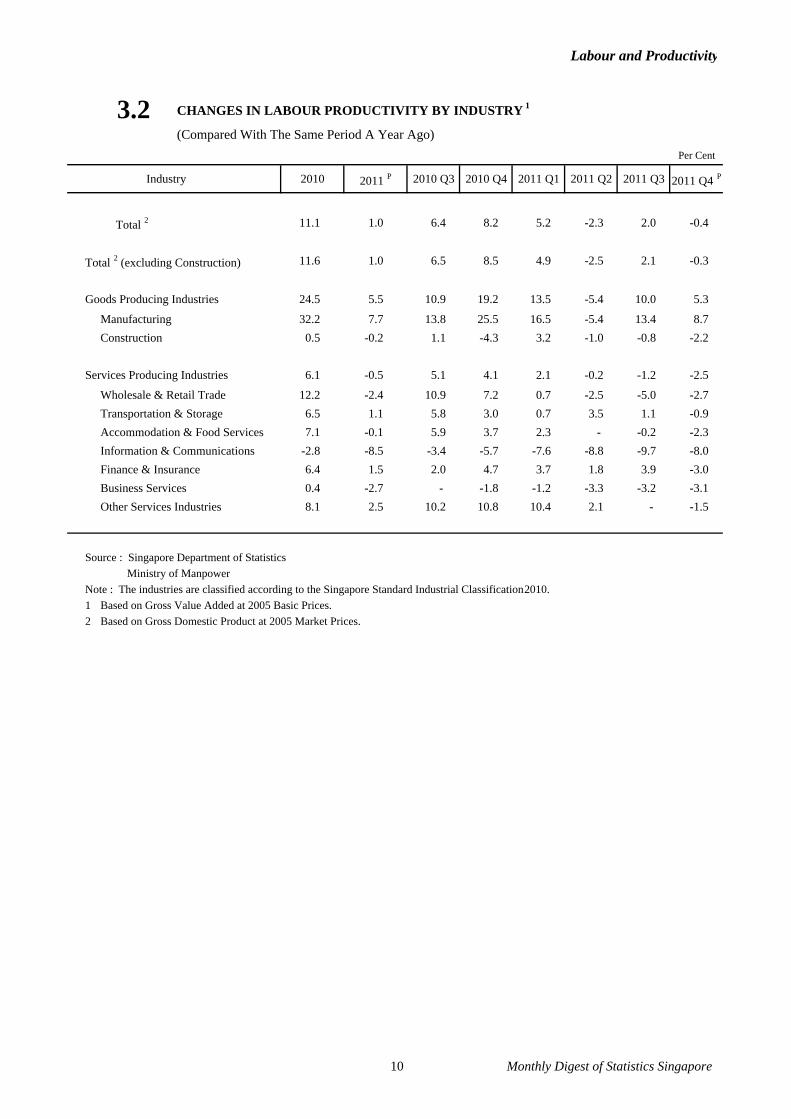
3.2 CHANGES IN LABOUR PRODUCTIVITY BY INDUSTRY 1
(Compared With The Same Period A Year Ago)Per Cent
Industry 2010 2011 P 2010 Q3 2010 Q4 2011 Q1 2011 Q2 2011 Q3 2011 Q4 P
Total 2 11.1 1.0 6.4 8.2 5.2 -2.3 2.0 -0.4
Total 2 (excluding Construction) 11.6 1.0 6.5 8.5 4.9 -2.5 2.1 -0.3
Goods Producing Industries 24.5 5.5 10.9 19.2 13.5 -5.4 10.0 5.3
Manufacturing 32.2 7.7 13.8 25.5 16.5 -5.4 13.4 8.7 Construction 0.5 -0.2 1.1 -4.3 3.2 -1.0 -0.8 -2.2
Services Producing Industries 6.1 -0.5 5.1 4.1 2.1 -0.2 -1.2 -2.5
Wholesale & Retail Trade 12.2 -2.4 10.9 7.2 0.7 -2.5 -5.0 -2.7 Transportation & Storage 6.5 1.1 5.8 3.0 0.7 3.5 1.1 -0.9 Accommodation & Food Services 7.1 -0.1 5.9 3.7 2.3 - -0.2 -2.3 Information & Communications -2.8 -8.5 -3.4 -5.7 -7.6 -8.8 -9.7 -8.0 Finance & Insurance 6.4 1.5 2.0 4.7 3.7 1.8 3.9 -3.0 Business Services 0.4 -2.7 - -1.8 -1.2 -3.3 -3.2 -3.1 Other Services Industries 8.1 2.5 10.2 10.8 10.4 2.1 - -1.5
Source : Singapore Department of Statistics Ministry of Manpower
Note : The industries are classified according to the Singapore Standard Industrial Classification 2010.1 Based on Gross Value Added at 2005 Basic Prices.2 Based on Gross Domestic Product at 2005 Market Prices.
10 Monthly Digest of Statistics Singapore

Labour and Productivity
3.3 AVERAGE MONTHLY NOMINAL EARNINGS PER EMPLOYEE BY INDUSTRY
Dollars
Industry 2010 2011 2010 Q3 2010 Q4 2011 Q1 2011 Q2 2011 Q3 2011 Q4
Total 4,089 4,334 3,754 4,474 4,677 4,048 3,956 4,655
Manufacturing 4,264 4,484 3,880 4,741 4,881 4,064 4,059 4,931 Construction 3,118 3,268 2,877 3,250 3,571 3,040 3,004 3,457 Services 4,131 4,383 3,802 4,515 4,713 4,119 4,012 4,689
Wholesale & Retail Trade 3,548 3,758 3,318 3,918 3,904 3,510 3,499 4,118 Transportation & Storage 3,931 4,222 3,728 4,285 4,305 3,858 4,086 4,640 Accommodation & Food Services 1,493 1,546 1,443 1,495 1,634 1,471 1,475 1,605 Information & Communications 5,350 5,604 5,073 5,621 5,601 5,638 5,317 5,859 Financial & Insurance Services 7,663 8,170 6,872 7,477 9,978 7,566 7,223 7,910 Real Estate Services 3,094 3,380 2,841 3,560 3,739 3,034 3,057 3,690 Professional Services 4,991 5,199 4,712 5,292 5,303 5,041 4,875 5,577 Administrative & Support
Services 2,548 2,630 2,388 2,686 2,775 2,517 2,496 2,732 Community, Social & Personal
Services 4,295 4,604 3,814 5,182 4,881 4,292 4,042 5,201
Source : Ministry of Manpower Central Provident Fund Board
Note : Average monthly nominal earnings are computed using data from the CPF Board. They include bonuses, if any, but exclude employers' CPF contributions. Data pertain to all full-time and part-time employees who contributeto the CPF. Data exclude all identifiable self-employed persons.
From 2010, workers are classified using the employer's Unique Entity Number (UEN). Wage data may not be strictlycomparable with previous years.
Data are classified according to the Singapore Standard Industrial Classification (SSIC) 2010.
11 Monthly Digest of Statistics Singapore

Labour and Productivity
3.4 AVERAGE MONTHLY RECRUITMENT RATE BY INDUSTRY AND
OCCUPATIONAL GROUP
Per Cent
2009 2010 2010 Q2 2010 Q3 2010 Q4 2011 Q1 2011 Q2 2011 Q3
Total 2.2 2.8 2.9 3.0 2.6 2.6 2.8 3.0
IndustryManufacturing 1.5 2.0 2.2 2.2 1.7 1.9 2.1 2.3 Construction 2.5 2.5 2.5 2.6 2.5 2.5 3.0 2.9 Services 2.4 3.1 3.3 3.3 2.9 2.8 3.0 3.3
Wholesale & Retail Trade 2.6 3.6 4.0 3.6 3.2 3.0 3.3 3.3 Transport & Storage 1.5 2.3 2.6 2.5 2.1 2.2 2.5 2.6 Hotels & Restaurants 3.8 4.7 4.7 5.0 5.2 4.4 5.0 4.9 Information & Communications 1.9 3.0 3.4 3.2 2.9 2.7 3.0 3.1 Financial Services 1.7 2.7 3.0 3.4 2.3 2.3 2.8 2.9 Real Estate & Leasing Services 3.4 4.7 4.5 3.9 4.1 4.2 4.0 3.7 Professional Services 2.6 3.0 3.5 3.3 2.3 2.4 2.6 3.4 Administrative & Support
Services 4.3 5.0 5.1 5.2 5.0 4.9 4.9 5.3 Community, Social & Personal
Services 1.8 1.8 1.9 2.2 1.5 1.8 1.9 2.2
Others 1 3.0 2.7 2.2 3.1 2.8 3.0 3.4 2.9
Occupational GroupProfessionals, Managers,
Executives & Technicians 1.6 2.2 2.4 2.6 1.8 2.0 2.2 2.6 Clerical, Sales & Service Workers 3.1 4.0 4.2 4.0 4.0 3.6 4.0 3.9 Production & Transport Operators,
Cleaners & Labourers 2.3 2.7 2.7 2.8 2.5 2.7 2.8 2.9
Source : Ministry of ManpowerNote : Data pertain to both public and private sectors. For the private sector, only establishments
with at least 25 employees are included.Data are classified according to the Singapore Standard Industrial Classification (SSIC) 2005.
1 Includes Agriculture, Fishing, Quarrying, Utilities and Sewerage & Waste Management.
12 Monthly Digest of Statistics Singapore

Labour and Productivity
3.5 AVERAGE MONTHLY RESIGNATION RATE BY INDUSTRY AND
OCCUPATIONAL GROUP
Per Cent
2009 2010 2010 Q2 2010 Q3 2010 Q4 2011 Q1 2011 Q2 2011 Q3
Total 1.8 2.0 2.2 2.1 1.8 2.0 2.1 2.1
IndustryManufacturing 1.5 1.5 1.8 1.7 1.2 1.6 1.7 1.8 Construction 1.7 1.8 2.0 1.7 1.6 1.6 2.0 1.8 Services 1.9 2.3 2.5 2.4 2.0 2.2 2.3 2.3
Wholesale & Retail Trade 2.4 2.9 3.4 2.8 2.2 2.7 2.5 2.6 Transport & Storage 1.2 1.6 1.8 1.7 1.3 1.6 1.6 1.8 Hotels & Restaurants 3.9 4.1 4.0 4.4 3.8 4.1 4.4 4.3 Information & Communications 1.5 2.0 2.3 2.2 1.7 1.6 1.9 2.0 Financial Services 1.2 1.6 1.9 1.9 1.4 1.2 1.8 1.7 Real Estate & Leasing Services 2.7 3.0 3.1 3.1 3.0 3.0 3.2 3.0 Professional Services 1.6 1.8 2.1 1.9 1.6 1.6 2.0 2.0 Administrative & Support
Services 3.4 4.0 4.4 4.2 3.9 4.1 4.1 4.0 Community, Social & Personal
Services 1.0 1.2 1.2 1.3 0.9 1.2 1.3 1.3
Others 1 2.0 2.7 1.6 3.6 2.9 3.3 2.5 2.4
Occupational GroupProfessionals, Managers,
Executives & Technicians 1.1 1.4 1.6 1.6 1.2 1.3 1.5 1.6 Clerical, Sales & Service Workers 2.7 3.1 3.3 3.2 2.8 3.1 3.2 3.2 Production & Transport Operators,
Cleaners & Labourers 1.9 2.1 2.3 2.1 1.8 2.1 2.2 2.1
Source : Ministry of ManpowerNote : Data pertain to both public and private sectors. For the private sector, only establishments
with at least 25 employees are included.Data are classified according to the Singapore Standard Industrial Classification (SSIC) 2005.
1 Includes Agriculture, Fishing, Quarrying, Utilities and Sewerage & Waste Management.
13 Monthly Digest of Statistics Singapore
National Income and Balance of Payments
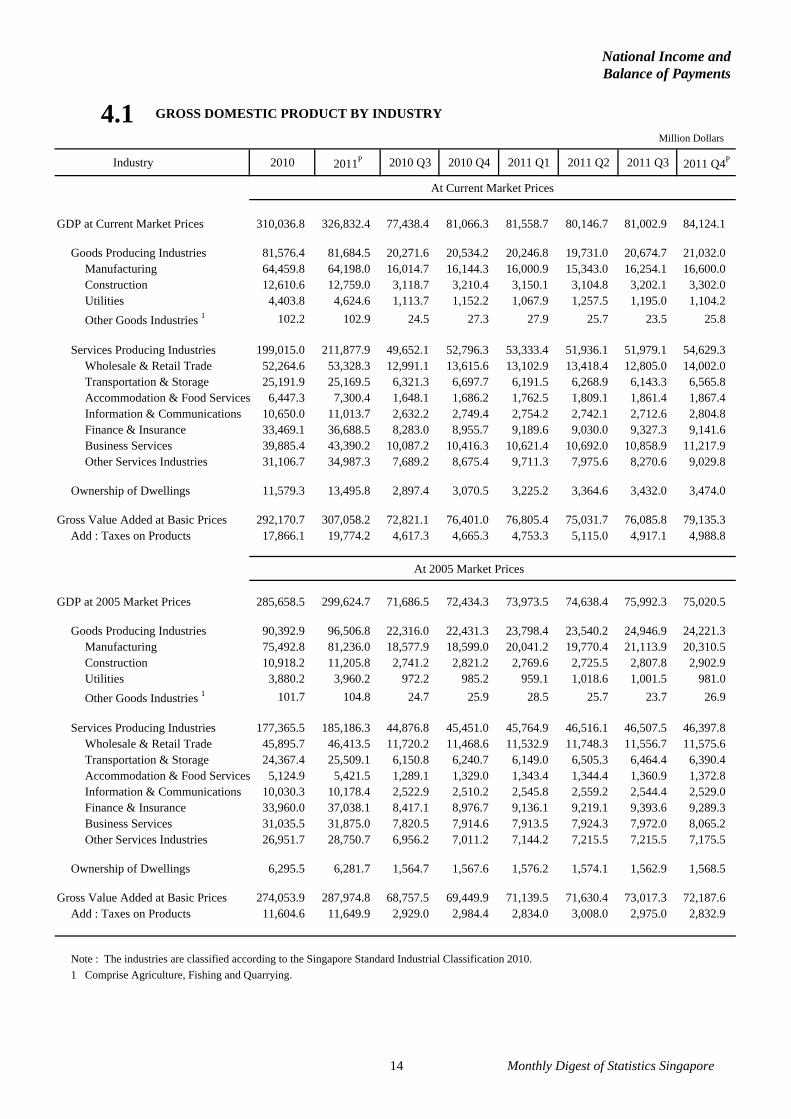
4.1 GROSS DOMESTIC PRODUCT BY INDUSTRY
Industry 2010 2011P 2010 Q3 2010 Q4 2011 Q1 2011 Q2 2011 Q3 2011 Q4P
At Current Market Prices
GDP at Current Market Prices 310,036.8 326,832.4 77,438.4 81,066.3 81,558.7 80,146.7 81,002.9 84,124.1
Goods Producing Industries 81,576.4 81,684.5 20,271.6 20,534.2 20,246.8 19,731.0 20,674.7 21,032.0 Manufacturing 64,459.8 64,198.0 16,014.7 16,144.3 16,000.9 15,343.0 16,254.1 16,600.0 Construction 12,610.6 12,759.0 3,118.7 3,210.4 3,150.1 3,104.8 3,202.1 3,302.0 Utilities 4,403.8 4,624.6 1,113.7 1,152.2 1,067.9 1,257.5 1,195.0 1,104.2 Other Goods Industries 1 102.2 102.9 24.5 27.3 27.9 25.7 23.5 25.8
Services Producing Industries 199,015.0 211,877.9 49,652.1 52,796.3 53,333.4 51,936.1 51,979.1 54,629.3 Wholesale & Retail Trade 52,264.6 53,328.3 12,991.1 13,615.6 13,102.9 13,418.4 12,805.0 14,002.0 Transportation & Storage 25,191.9 25,169.5 6,321.3 6,697.7 6,191.5 6,268.9 6,143.3 6,565.8 Accommodation & Food Services 6,447.3 7,300.4 1,648.1 1,686.2 1,762.5 1,809.1 1,861.4 1,867.4 Information & Communications 10,650.0 11,013.7 2,632.2 2,749.4 2,754.2 2,742.1 2,712.6 2,804.8 Finance & Insurance 33,469.1 36,688.5 8,283.0 8,955.7 9,189.6 9,030.0 9,327.3 9,141.6 Business Services 39,885.4 43,390.2 10,087.2 10,416.3 10,621.4 10,692.0 10,858.9 11,217.9 Other Services Industries 31,106.7 34,987.3 7,689.2 8,675.4 9,711.3 7,975.6 8,270.6 9,029.8
Ownership of Dwellings 11,579.3 13,495.8 2,897.4 3,070.5 3,225.2 3,364.6 3,432.0 3,474.0
Gross Value Added at Basic Prices 292,170.7 307,058.2 72,821.1 76,401.0 76,805.4 75,031.7 76,085.8 79,135.3 Add : Taxes on Products 17,866.1 19,774.2 4,617.3 4,665.3 4,753.3 5,115.0 4,917.1 4,988.8
At 2005 Market Prices
GDP at 2005 Market Prices 285,658.5 299,624.7 71,686.5 72,434.3 73,973.5 74,638.4 75,992.3 75,020.5
Goods Producing Industries 90,392.9 96,506.8 22,316.0 22,431.3 23,798.4 23,540.2 24,946.9 24,221.3 Manufacturing 75,492.8 81,236.0 18,577.9 18,599.0 20,041.2 19,770.4 21,113.9 20,310.5 Construction 10,918.2 11,205.8 2,741.2 2,821.2 2,769.6 2,725.5 2,807.8 2,902.9 Utilities 3,880.2 3,960.2 972.2 985.2 959.1 1,018.6 1,001.5 981.0 Other Goods Industries 1 101.7 104.8 24.7 25.9 28.5 25.7 23.7 26.9
Services Producing Industries 177,365.5 185,186.3 44,876.8 45,451.0 45,764.9 46,516.1 46,507.5 46,397.8 Wholesale & Retail Trade 45,895.7 46,413.5 11,720.2 11,468.6 11,532.9 11,748.3 11,556.7 11,575.6 Transportation & Storage 24,367.4 25,509.1 6,150.8 6,240.7 6,149.0 6,505.3 6,464.4 6,390.4 Accommodation & Food Services 5,124.9 5,421.5 1,289.1 1,329.0 1,343.4 1,344.4 1,360.9 1,372.8 Information & Communications 10,030.3 10,178.4 2,522.9 2,510.2 2,545.8 2,559.2 2,544.4 2,529.0 Finance & Insurance 33,960.0 37,038.1 8,417.1 8,976.7 9,136.1 9,219.1 9,393.6 9,289.3 Business Services 31,035.5 31,875.0 7,820.5 7,914.6 7,913.5 7,924.3 7,972.0 8,065.2 Other Services Industries 26,951.7 28,750.7 6,956.2 7,011.2 7,144.2 7,215.5 7,215.5 7,175.5
Ownership of Dwellings 6,295.5 6,281.7 1,564.7 1,567.6 1,576.2 1,574.1 1,562.9 1,568.5
Gross Value Added at Basic Prices 274,053.9 287,974.8 68,757.5 69,449.9 71,139.5 71,630.4 73,017.3 72,187.6 Add : Taxes on Products 11,604.6 11,649.9 2,929.0 2,984.4 2,834.0 3,008.0 2,975.0 2,832.9
Note : The industries are classified according to the Singapore Standard Industrial Classification 2010.1 Comprise Agriculture, Fishing and Quarrying.
Million Dollars
14 Monthly Digest of Statistics Singapore

National Income andBalance of Payments
4.2 EXPENDITURE ON GROSS DOMESTIC PRODUCT
(At 2005 Market Prices)
2010 2011P 2010 Q3 2010 Q4 2011 Q1 2011 Q2 2011 Q3 2011 Q4P
Total 285,658.5 299,624.7 71,686.5 72,434.3 73,973.5 74,638.4 75,992.3 75,020.5
Private Consumption Expenditure 103,449.1 107,724.8 25,499.9 27,264.3 25,573.6 27,361.4 26,998.0 27,791.8
Government Consumption Expenditure 28,881.3 29,138.6 6,910.1 7,594.5 9,928.2 5,057.5 7,000.9 7,152.0
Gross Fixed Capital Formation 69,100.8 71,364.2 17,490.7 17,827.3 16,186.2 18,497.5 18,891.7 17,788.8
Changes in Inventories -7,670.0 -3,995.5 -2,868.7 -4,534.6 -1,665.9 1,748.6 -1,838.0 -2,240.2
Net Exports of Goods & Services 97,432.5 100,743.7 26,115.6 25,766.8 25,210.5 23,083.5 26,478.2 25,971.5
Exports of Goods & Services 666,347.4 683,488.3 173,455.5 171,697.6 166,048.6 169,284.0 174,856.8 173,298.9
Less : Imports of Goods & Services 568,914.9 582,744.6 147,339.9 145,930.8 140,838.1 146,200.5 148,378.6 147,327.4
Statistical Discrepancy -5,535.2 -5,351.1 -1,461.1 -1,484.0 -1,259.1 -1,110.1 -1,538.5 -1,443.4
4.3 GROSS FIXED CAPITAL FORMATION
(At 2005 Market Prices)
2010 2011P 2010 Q3 2010 Q4 2011 Q1 2011 Q2 2011 Q3 2011 Q4P
Total 69,100.8 71,364.2 17,490.7 17,827.3 16,186.2 18,497.5 18,891.7 17,788.8
Construction & Works 35,135.5 35,647.8 8,791.9 8,852.6 8,823.5 8,931.2 8,913.7 8,979.4
Residential Buildings 16,073.9 16,164.8 4,134.7 4,265.0 4,117.5 4,180.9 4,003.3 3,863.1
Non-Residential Buildings 13,085.5 13,205.4 3,175.6 3,087.0 3,129.3 3,272.7 3,321.5 3,481.9
Other Construction & Works 5,976.1 6,277.6 1,481.6 1,500.6 1,576.7 1,477.6 1,588.9 1,634.4
Transport Equipment 6,775.3 7,868.2 1,540.4 1,879.8 1,144.6 2,423.9 2,617.7 1,682.0
Machinery, Equipment & Software 27,190.0 27,848.2 7,158.4 7,094.9 6,218.1 7,142.4 7,360.3 7,127.4
Million Dollars
Million Dollars
15 Monthly Digest of Statistics Singapore

National Income andBalance of Payments
4.4 GROSS DOMESTIC PRODUCT DEFLATORS BY INDUSTRY
(2005 = 100)
Industry 2010 2011P 2010 Q3 2010 Q4 2011 Q1 2011 Q2 2011 Q3 2011 Q4P
GDP at Market Prices 108.5 109.1 108.0 111.9 110.3 107.4 106.6 112.1
Goods Producing Industries 90.2 84.6 90.8 91.5 85.1 83.8 82.9 86.8 Manufacturing 85.4 79.0 86.2 86.8 79.8 77.6 77.0 81.7 Construction 115.5 113.9 113.8 113.8 113.7 113.9 114.0 113.7 Utilities 113.5 116.8 114.6 117.0 111.3 123.5 119.3 112.6
Other Goods Industries 1 100.5 98.2 99.2 105.4 97.9 100.0 99.2 95.9
Services Producing Industries 112.2 114.4 110.6 116.2 116.5 111.7 111.8 117.7 Wholesale & Retail Trade 113.9 114.9 110.8 118.7 113.6 114.2 110.8 121.0 Transportation & Storage 103.4 98.7 102.8 107.3 100.7 96.4 95.0 102.7 Accommodation & Food Services 125.8 134.7 127.8 126.9 131.2 134.6 136.8 136.0 Information &
Communications 106.2 108.2 104.3 109.5 108.2 107.1 106.6 110.9 Finance & Insurance 98.6 99.1 98.4 99.8 100.6 97.9 99.3 98.4 Business Services 128.5 136.1 129.0 131.6 134.2 134.9 136.2 139.1 Other Services Industries 115.4 121.7 110.5 123.7 135.9 110.5 114.6 125.8
Ownership of Dwellings 183.9 214.8 185.2 195.9 204.6 213.7 219.6 221.5
Gross Value Added at Basic Prices 106.6 106.6 105.9 110.0 108.0 104.7 104.2 109.6 Add : Taxes on Products 154.0 169.7 157.6 156.3 167.7 170.0 165.3 176.1
Note : The industries are classified according to the Singapore Standard Industrial Classification 2010.1 Comprise Agriculture, Fishing and Quarrying.
16 Monthly Digest of Statistics Singapore

National Income and Balance of Payments
4.5 BALANCE OF PAYMENTS
2010 2011P 2010 Q3 2010 Q4 2011 Q1 2011 Q2 2011 Q3 2011 Q4P
A Current Account Balance 75,686.7 71,679.5 21,544.8 20,918.7 18,277.4 16,939.0 19,396.6 17,066.5
Goods Balance 86,033.6 84,840.5 22,893.8 22,626.1 21,344.4 19,086.6 21,536.4 22,873.1 Exports of Goods 505,937.3 540,049.1 131,068.1 129,310.2 130,741.5 134,287.5 136,577.2 138,442.9 Imports of Goods 419,903.7 455,208.6 108,174.3 106,684.1 109,397.1 115,200.9 115,040.8 115,569.8
Services Balance 2,083.9 2,319.8 1,243.3 726.2 510.3 205.8 1,477.9 125.8 Exports of Services 136,367.6 142,868.0 34,760.9 34,940.8 34,953.7 35,562.2 36,574.7 35,777.4
Maintenance & RepairServices 8,479.9 9,496.4 1,968.6 1,955.3 2,093.7 2,406.3 2,699.9 2,296.5
Transport 51,969.7 53,850.2 13,304.3 13,132.7 13,141.3 13,553.6 13,718.5 13,436.8 Travel 19,270.4 22,627.2 5,374.2 5,338.6 5,396.1 5,409.0 6,012.0 5,810.1 Insurance 4,408.9 3,730.6 1,206.7 780.2 1,227.8 916.7 804.2 781.9 Government Goods &
Services 349.7 362.9 87.8 87.6 89.7 90.8 91.4 91.0 Construction 1,656.3 1,700.0 415.8 428.0 420.2 413.5 425.9 440.4 Financial 16,421.8 16,152.2 3,885.3 4,656.3 3,914.9 4,080.8 4,025.6 4,130.9 Telecommunications,
Computer &Information 4,694.0 4,757.8 1,194.6 1,200.6 1,187.4 1,181.8 1,190.6 1,198.0
Charges for the Use of Intellectual Property 1,434.5 1,543.6 353.0 353.5 380.8 375.6 401.2 386.0
Personal, Cultural & Recreational 686.5 732.4 177.2 178.6 182.0 183.8 183.8 182.8
Other Business Services 26,995.9 27,914.7 6,793.4 6,829.4 6,919.8 6,950.3 7,021.6 7,023.0
Imports of Services 134,283.7 140,548.2 33,517.6 34,214.6 34,443.4 35,356.4 35,096.8 35,651.6 Maintenance & Repair
Services 761.7 754.6 214.3 192.0 202.6 184.0 199.3 168.7 Transport 41,278.4 44,177.3 10,351.4 10,573.1 10,781.2 11,417.2 10,837.9 11,141.0 Travel 25,402.3 26,543.4 6,172.7 6,897.1 6,162.5 6,744.4 6,477.7 7,158.8 Insurance 5,459.5 4,243.9 1,438.6 1,188.8 1,251.4 1,057.5 1,028.1 906.9 Government Goods &
Services 261.3 261.6 56.7 74.6 96.4 49.5 50.9 64.8 Construction 674.6 692.2 169.4 174.3 171.1 168.3 173.5 179.3 Financial 3,486.5 3,268.8 890.5 851.6 832.0 816.4 842.6 777.8 Telecommunications,
Computer &Information 3,997.0 4,026.8 1,021.8 1,023.6 1,007.9 999.6 1,007.9 1,011.4
Charges for the Use of Intellectual Property 19,135.6 20,591.3 4,709.0 4,714.5 5,079.9 5,011.3 5,351.8 5,148.3
Personal, Cultural & Recreational 604.6 644.9 156.0 157.3 160.3 161.8 161.8 161.0
Other Business Services 33,222.2 35,343.4 8,337.2 8,367.7 8,698.1 8,746.4 8,965.3 8,933.6
Primary Income Balance -5,390.4 -7,038.8 -801.7 -575.5 -1,492.5 -320.0 -1,424.7 -3,801.6 Primary Income Receipts 84,491.4 85,527.4 21,887.5 22,763.0 20,695.5 22,448.3 21,973.9 20,409.7 Primary Income Payments 89,881.8 92,566.2 22,689.2 23,338.5 22,188.0 22,768.3 23,398.6 24,211.3
Secondary Income Balance -7,040.4 -8,442.0 -1,790.6 -1,858.1 -2,084.8 -2,033.4 -2,193.0 -2,130.8 General Government (Net) -287.2 -292.7 -69.7 -61.8 -118.3 -42.2 -71.1 -61.1 Other Sectors (Net) -6,753.2 -8,149.3 -1,720.9 -1,796.3 -1,966.5 -1,991.2 -2,121.9 -2,069.7
Million Dollars
17 Monthly Digest of Statistics Singapore
National Income and Balance of Payments
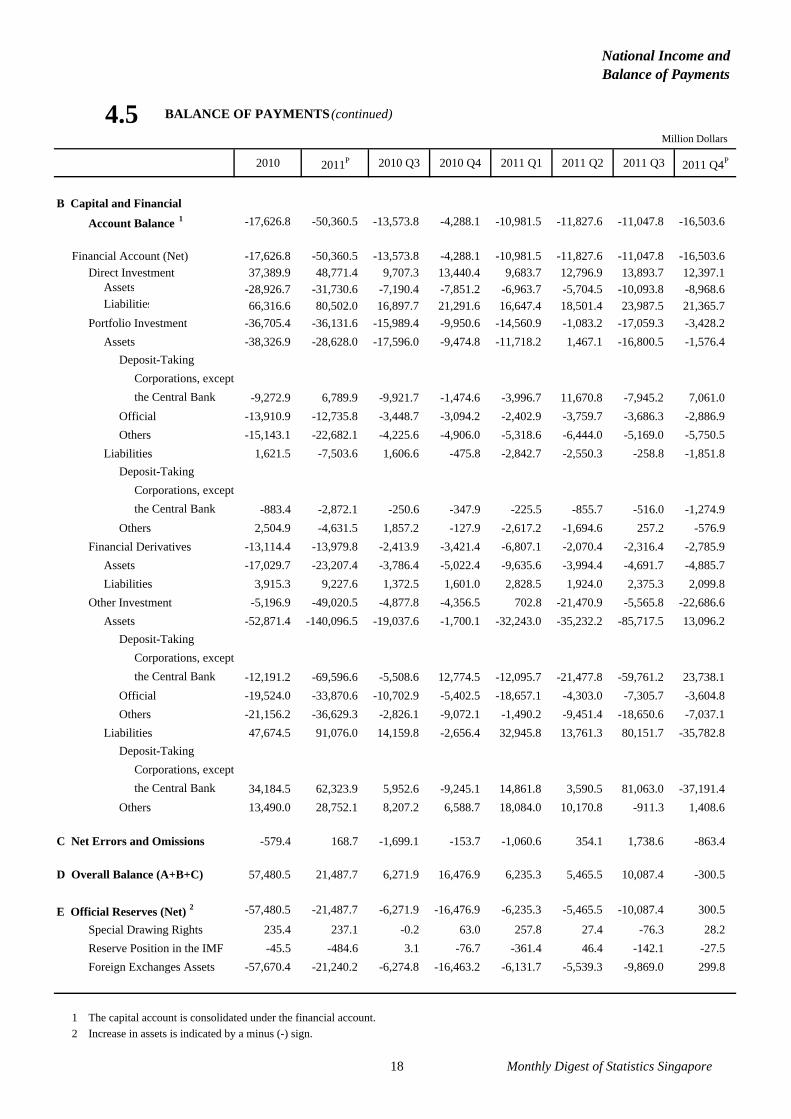
4.5 BALANCE OF PAYMENTS (continued)
2010 2011P 2010 Q3 2010 Q4 2011 Q1 2011 Q2 2011 Q3 2011 Q4P
B Capital and Financial
Account Balance 1 -17,626.8 -50,360.5 -13,573.8 -4,288.1 -10,981.5 -11,827.6 -11,047.8 -16,503.6
Financial Account (Net) -17,626.8 -50,360.5 -13,573.8 -4,288.1 -10,981.5 -11,827.6 -11,047.8 -16,503.6 Direct Investment 37,389.9 48,771.4 9,707.3 13,440.4 9,683.7 12,796.9 13,893.7 12,397.1
Assets -28,926.7 -31,730.6 -7,190.4 -7,851.2 -6,963.7 -5,704.5 -10,093.8 -8,968.6 Liabilities 66,316.6 80,502.0 16,897.7 21,291.6 16,647.4 18,501.4 23,987.5 21,365.7
Portfolio Investment -36,705.4 -36,131.6 -15,989.4 -9,950.6 -14,560.9 -1,083.2 -17,059.3 -3,428.2 Assets -38,326.9 -28,628.0 -17,596.0 -9,474.8 -11,718.2 1,467.1 -16,800.5 -1,576.4
Deposit-TakingCorporations, exceptthe Central Bank -9,272.9 6,789.9 -9,921.7 -1,474.6 -3,996.7 11,670.8 -7,945.2 7,061.0
Official -13,910.9 -12,735.8 -3,448.7 -3,094.2 -2,402.9 -3,759.7 -3,686.3 -2,886.9 Others -15,143.1 -22,682.1 -4,225.6 -4,906.0 -5,318.6 -6,444.0 -5,169.0 -5,750.5
Liabilities 1,621.5 -7,503.6 1,606.6 -475.8 -2,842.7 -2,550.3 -258.8 -1,851.8 Deposit-Taking
Corporations, exceptthe Central Bank -883.4 -2,872.1 -250.6 -347.9 -225.5 -855.7 -516.0 -1,274.9
Others 2,504.9 -4,631.5 1,857.2 -127.9 -2,617.2 -1,694.6 257.2 -576.9 Financial Derivatives -13,114.4 -13,979.8 -2,413.9 -3,421.4 -6,807.1 -2,070.4 -2,316.4 -2,785.9
Assets -17,029.7 -23,207.4 -3,786.4 -5,022.4 -9,635.6 -3,994.4 -4,691.7 -4,885.7 Liabilities 3,915.3 9,227.6 1,372.5 1,601.0 2,828.5 1,924.0 2,375.3 2,099.8
Other Investment -5,196.9 -49,020.5 -4,877.8 -4,356.5 702.8 -21,470.9 -5,565.8 -22,686.6 Assets -52,871.4 -140,096.5 -19,037.6 -1,700.1 -32,243.0 -35,232.2 -85,717.5 13,096.2
Deposit-TakingCorporations, exceptthe Central Bank -12,191.2 -69,596.6 -5,508.6 12,774.5 -12,095.7 -21,477.8 -59,761.2 23,738.1
Official -19,524.0 -33,870.6 -10,702.9 -5,402.5 -18,657.1 -4,303.0 -7,305.7 -3,604.8 Others -21,156.2 -36,629.3 -2,826.1 -9,072.1 -1,490.2 -9,451.4 -18,650.6 -7,037.1
Liabilities 47,674.5 91,076.0 14,159.8 -2,656.4 32,945.8 13,761.3 80,151.7 -35,782.8 Deposit-Taking
Corporations, exceptthe Central Bank 34,184.5 62,323.9 5,952.6 -9,245.1 14,861.8 3,590.5 81,063.0 -37,191.4
Others 13,490.0 28,752.1 8,207.2 6,588.7 18,084.0 10,170.8 -911.3 1,408.6
C Net Errors and Omissions -579.4 168.7 -1,699.1 -153.7 -1,060.6 354.1 1,738.6 -863.4
D Overall Balance (A+B+C) 57,480.5 21,487.7 6,271.9 16,476.9 6,235.3 5,465.5 10,087.4 -300.5
E Official Reserves (Net) 2 -57,480.5 -21,487.7 -6,271.9 -16,476.9 -6,235.3 -5,465.5 -10,087.4 300.5
Special Drawing Rights 235.4 237.1 -0.2 63.0 257.8 27.4 -76.3 28.2 Reserve Position in the IMF -45.5 -484.6 3.1 -76.7 -361.4 46.4 -142.1 -27.5 Foreign Exchanges Assets -57,670.4 -21,240.2 -6,274.8 -16,463.2 -6,131.7 -5,539.3 -9,869.0 299.8
1 The capital account is consolidated under the financial account.2 Increase in assets is indicated by a minus (-) sign.
Million Dollars
18 Monthly Digest of Statistics Singapore

Business Expectations
5.1 BUSINESS EXPECTATIONS FOR THE MANUFACTURING SECTOR
(Forecast For The Next Quarter)Net Weighted Balance In Percentage Terms
2010 Q3 2010 Q4 2011 Q1 2011 Q2 2011 Q3 2011 Q4
General Business Expectations 1 +3 +20 +12 +12 -10 -11
Numbers Employed +8 +10 +11 +10 -2 -2
New Orders Received -5 +19 +17 +11 -12 -9
Output -1 +17 +10 +14 -16 -7
Deliveries Overseas -5 +16 +15 +8 -11 -5
Stock of Finished Goods -10 -4 -1 +1 -18 -3
Average Selling Prices -18 -5 -12 -8 -13 -14
Source : Economic Development Board Note :
A plus sign indicates a net upward trend and a minus sign denotes a net downward trend.1 For next 6 months.
"Net weighted balance" is the difference between the weighted percentages of "ups" and "downs".
19 Monthly Digest of Statistics Singapore

Business Expectations
5.2 BUSINESS EXPECTATIONS FOR THE SERVICES SECTOR
(Forecast For The Next Quarter)Net Weighted Balance In Percentage Terms
2010 Q3 2010 Q4 2011 Q1 2011 Q2 2011 Q3 2011 Q4
Wholesale & Retail Trade
General Business Expectations 1 +37 +18 +15 +25 +3 -20Employment +20 +13 +12 +21 +8 -3Operating Receipts +35 +17 +17 +30 +11 -11Ending Stocks of Merchandise +12 +12 -2 +9 -2 -1
Transport & Storage
General Business Expectations 1 +22 -3 +5 +15 -14 -14Employment +14 +17 +12 +4 -1 -3Operating Receipts +15 -1 +8 +3 -3 -19
Accommodation & Food Services
General Business Expectations 1 +40 +25 +31 +45 +34 -28Employment +52 +11 +26 +34 +48 -12Operating Receipts +50 +10 +37 +46 +46 -38Ending Stocks of Merchandise +20 +12 +13 +22 +14 +4
Information & Communications
General Business Expectations 1 +21 -2 +12 +23 +4 -16Employment +4 +5 +10 +11 +2 -1Operating Receipts +14 -2 +15 +17 +11 -14
Financial & Insurance
General Business Expectations 1 +34 +47 +38 +20 -36 -52Employment +39 +38 +38 +33 -6 -17Operating Receipts +28 +27 +48 +32 -26 -28Deposits of Non-bank Customers +33 +31 +50 +37 -6 +20Loans & Advances to
Non-bank Customers +39 +36 +48 +39 -2 -11
Real Estate
General Business Expectations 1 -6 +7 +2 - -35 -60Employment +2 +6 -6 +11 - -10Operating Receipts +1 -3 +1 +1 -3 -28
Business Services Excluding Real Estates
General Business Expectations 1 +12 +18 +14 +10 -5 -15Employment +14 +14 +21 +5 - -2Operating Receipts +11 +14 +17 +17 -4 -6
Recreation, Community & Personal Services 2
General Business Expectations 1 - - +22 +24 +7 +9
Employment - - +25 +33 +15 +2
Operating Receipts - - +21 +25 +22 +12
Note : A plus sign indicates a net upward trend and a minus sign denotes a net downward trend.
1 For next 6 months.2 Comprises education, health & social services, arts, entertainment & recreation and other service activities.
"Net weighted balance" is the difference between the weighted percentages of "ups" and "downs".
20 Monthly Digest of Statistics Singapore

Business Formation and Cessation
6.1 FORMATION OF COMPANIES BY INDUSTRY
Industry 2009 2010 Jun 2011 Jul 2011 Aug 2011 Sep 2011 Oct 2011 Nov 2011
Total 26,414 29,798 2,748 2,949 2,539 2,653 2,556 2,700
Manufacturing 1,321 1,352 116 140 115 110 108 115 Construction 1,455 1,674 152 172 136 145 116 155 Wholesale & Retail Trade 7,268 7,779 740 755 640 701 695 689 Transportation & Storage 1,110 1,163 92 105 105 101 89 94 Accommodation &
Food Service Activities 1,443 1,451 134 146 107 143 130 136 Information & Communications 1,708 2,123 209 224 218 208 192 204 Financial & Insurance Activities 3,115 4,419 431 434 365 434 353 429 Real Estate Activities 526 828 88 77 60 52 81 72 Professional, Scientific &
Technical Activities 4,315 4,639 404 478 392 388 396 414 Administrative & Support
Service Activities 1,223 1,551 154 151 141 118 132 156 Education, Health & Social Services 1,292 1,472 119 136 137 137 153 128 Arts, Entertainment, Recreation &
Other Service Activities 1,421 1,077 76 99 86 88 83 79 Others 217 270 33 32 37 28 28 29
Source : Accounting and Corporate Regulatory Authority Note : The industries are classified according to the Singapore Standard Industrial Classification 2010.
6.2 CESSATION OF COMPANIES BY INDUSTRY
Industry 2009 2010 Jun 2011 Jul 2011 Aug 2011 Sep 2011 Oct 2011 Nov 2011
Total 22,396 15,129 1,761 2,401 1,351 1,206 1,128 1,229
Manufacturing 1,487 824 86 128 66 56 64 68 Construction 1,709 723 98 155 55 57 44 65 Wholesale & Retail Trade 8,144 4,911 560 838 450 375 344 395 Transportation & Storage 1,139 696 86 114 42 47 55 50 Accommodation &
Food Service Activities 848 656 104 100 77 68 51 64 Information & Communications 1,350 1,028 150 166 91 94 102 83 Financial & Insurance Activities 2,172 1,873 169 196 151 131 117 138 Real Estate Activities 684 535 40 75 49 39 18 27 Professional, Scientific &
Technical Activities 2,372 1,924 250 330 191 181 158 167 Administrative & Support
Service Activities 1,046 765 87 129 67 61 70 74 Education, Health & Social Services 517 474 56 62 44 33 44 37 Arts, Entertainment, Recreation &
Other Service Activities 803 634 64 95 59 55 56 55 Others 125 86 11 13 9 9 5 6
Source : Accounting and Corporate Regulatory Authority Note : The industries are classified according to the Singapore Standard Industrial Classification 2010.
Number
Number
21 Monthly Digest of Statistics Singapore

Business Formation and Cessation
6.3 FORMATION OF BUSINESSES BY INDUSTRY
Industry 2009 2010 Jun 2011 Jul 2011 Aug 2011 Sep 2011 Oct 2011 Nov 2011
Total 26,876 23,978 2,017 2,163 1,889 1,804 1,897 1,909
Manufacturing 1,174 1,115 102 92 77 53 65 83 Construction 1,638 1,616 133 132 111 117 113 124 Wholesale & Retail Trade 8,291 7,446 633 701 604 578 623 597 Transportation & Storage 1,062 984 88 97 86 64 82 88 Accommodation &
Food Service Activities 1,625 1,562 124 136 103 115 104 107 Information & Communications 1,403 1,324 116 108 121 104 92 108 Financial & Insurance Activities 447 469 50 48 47 56 20 32 Real Estate Activities 352 224 15 21 19 11 24 13 Professional, Scientific &
Technical Activities 4,742 3,571 308 321 302 269 304 309 Administrative & Support
Service Activities 1,588 1,499 126 129 115 126 106 129 Education, Health & Social Services 1,606 1,530 111 154 138 105 128 125 Arts, Entertainment, Recreation &
Other Service Activities 2,766 2,474 203 208 160 200 221 187 Others 182 164 8 16 6 6 15 7
Source : Accounting and Corporate Regulatory Authority Note : The industries are classified according to the Singapore Standard Industrial Classification 2010.
6.4 CESSATION OF BUSINESSES BY INDUSTRY
Industry 2009 2010 Jun 2011 Jul 2011 Aug 2011 Sep 2011 Oct 2011 Nov 2011
Total 23,555 24,254 1,755 1,994 1,911 1,766 1,887 1,780
Manufacturing 1,258 1,241 91 80 105 80 82 85 Construction 1,608 1,619 114 121 124 113 111 105 Wholesale & Retail Trade 7,996 7,983 570 676 615 586 598 595 Transportation & Storage 1,009 1,034 80 88 64 77 81 69 Accommodation &
Food Service Activities 1,543 1,594 133 127 153 120 131 115 Information & Communications 1,169 1,293 89 111 86 82 104 108 Financial & Insurance Activities 238 299 27 43 38 29 24 36 Real Estate Activities 269 347 37 34 49 45 28 34 Professional, Scientific &
Technical Activities 3,082 3,335 216 264 269 221 271 222 Administrative & Support
Service Activities 1,496 1,595 126 115 125 121 136 118 Education, Health & Social Services 1,235 1,292 83 106 93 97 106 122 Arts, Entertainment, Recreation &
Other Service Activities 2,491 2,499 184 222 185 185 208 165 Others 161 123 5 7 5 10 7 6
Source : Accounting and Corporate Regulatory Authority Note : The industries are classified according to the Singapore Standard Industrial Classification 2010.
Number
Number
22 Monthly Digest of Statistics Singapore

Manufacturing
7.1 INDEX OF INDUSTRIAL PRODUCTION
(2011 = 100)
Code Industry 2010 2011 Dec 2010 Jan 2011 Feb 2011 Mar 2011 Apr 2011 May 2011
10/11/12 Food, Beverages & Tobacco 96.4 100.0 99.7 102.5 78.5 101.1 92.3 96.9 13 Textiles 122.1 100.0 132.3 111.8 61.4 100.2 92.8 117.4 14 Wearing Apparel 123.3 100.0 121.7 102.9 77.7 82.4 79.6 87.7 15 Leather Products 81.8 100.0 102.1 94.4 64.2 84.9 94.6 100.8 16 Sawn Timber &
Wood Products 104.0 100.0 112.6 104.0 77.1 109.1 99.4 98.5
17 Paper & Paper Products 106.1 100.0 104.1 101.0 87.3 110.0 106.8 94.8 18 Printing & Reproduction of
Recorded Media 103.5 100.0 106.7 101.6 77.8 107.6 99.6 99.6 19 Petroleum 95.6 100.0 114.0 105.8 98.8 99.4 85.6 100.6 20 Chemicals & Chemical
Products 97.6 100.0 101.3 109.1 98.7 113.0 101.1 108.4 21 Pharmaceuticals & Biological
Products 75.3 100.0 39.4 88.3 81.5 121.3 101.7 76.5
22 Rubber & Plastic Products 112.3 100.0 109.9 105.3 86.2 111.4 101.8 102.4 23 Non-metallic Mineral Products 92.5 100.0 113.2 100.7 78.6 99.1 97.8 99.8 24 Basic Metals 102.2 100.0 101.3 105.0 138.6 124.2 97.1 87.1 25 Fabricated Metal Products 103.6 100.0 114.0 98.1 79.5 109.2 93.7 102.2 26 Computer, Electronic &
Optical Products 113.6 100.0 121.6 118.8 95.2 118.3 105.3 96.9
27 Electrical Equipment 124.1 100.0 90.6 95.7 75.5 108.1 95.1 94.7 28 Machinery & Equipment 78.5 100.0 95.0 85.3 67.8 102.9 95.4 91.9 29 Motor Vehicles, Trailers &
Semi-Trailers 85.9 100.0 88.7 101.4 86.7 92.7 96.2 101.5 30 Other Transport Equipment 94.0 100.0 106.4 90.0 94.9 103.3 95.0 93.5 31 Furniture 113.6 100.0 150.0 136.6 93.5 91.1 92.8 87.2
32 Other Manufacturing Industries 92.0 100.0 95.4 84.8 74.7 112.6 88.2 95.2
Total Manufacturing 92.9 100.0 85.6 103.2 87.9 112.6 99.9 94.3
(continued on next page)
Source : Economic Development Board Note : The industries are classified according to the Singapore Standard Industrial Classification (SSIC) 2010.
23 Monthly Digest of Statistics Singapore
Manufacturing
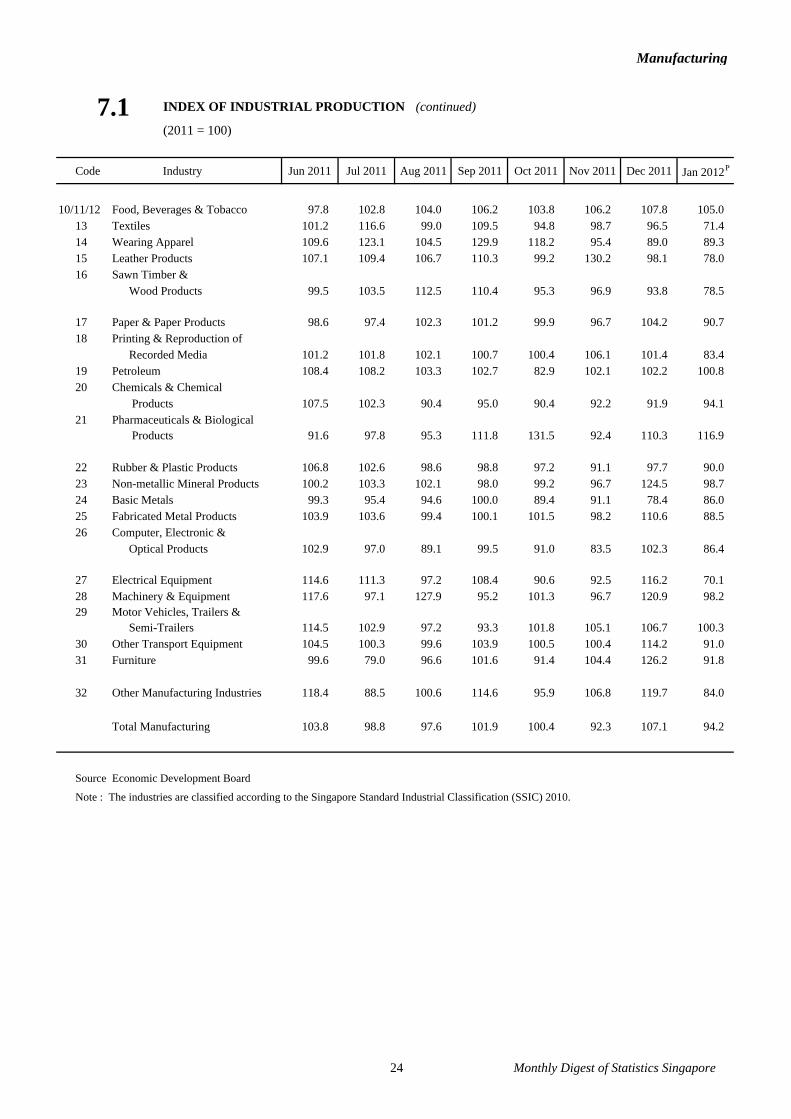
7.1 INDEX OF INDUSTRIAL PRODUCTION (continued)
(2011 = 100)
Code Industry Jun 2011 Jul 2011 Aug 2011 Sep 2011 Oct 2011 Nov 2011 Dec 2011 Jan 2012P
10/11/12 Food, Beverages & Tobacco 97.8 102.8 104.0 106.2 103.8 106.2 107.8 105.0 13 Textiles 101.2 116.6 99.0 109.5 94.8 98.7 96.5 71.4 14 Wearing Apparel 109.6 123.1 104.5 129.9 118.2 95.4 89.0 89.3 15 Leather Products 107.1 109.4 106.7 110.3 99.2 130.2 98.1 78.0 16 Sawn Timber &
Wood Products 99.5 103.5 112.5 110.4 95.3 96.9 93.8 78.5
17 Paper & Paper Products 98.6 97.4 102.3 101.2 99.9 96.7 104.2 90.7 18 Printing & Reproduction of
Recorded Media 101.2 101.8 102.1 100.7 100.4 106.1 101.4 83.4 19 Petroleum 108.4 108.2 103.3 102.7 82.9 102.1 102.2 100.8 20 Chemicals & Chemical
Products 107.5 102.3 90.4 95.0 90.4 92.2 91.9 94.1 21 Pharmaceuticals & Biological
Products 91.6 97.8 95.3 111.8 131.5 92.4 110.3 116.9
22 Rubber & Plastic Products 106.8 102.6 98.6 98.8 97.2 91.1 97.7 90.0 23 Non-metallic Mineral Products 100.2 103.3 102.1 98.0 99.2 96.7 124.5 98.7 24 Basic Metals 99.3 95.4 94.6 100.0 89.4 91.1 78.4 86.0 25 Fabricated Metal Products 103.9 103.6 99.4 100.1 101.5 98.2 110.6 88.5 26 Computer, Electronic &
Optical Products 102.9 97.0 89.1 99.5 91.0 83.5 102.3 86.4
27 Electrical Equipment 114.6 111.3 97.2 108.4 90.6 92.5 116.2 70.1 28 Machinery & Equipment 117.6 97.1 127.9 95.2 101.3 96.7 120.9 98.2 29 Motor Vehicles, Trailers &
Semi-Trailers 114.5 102.9 97.2 93.3 101.8 105.1 106.7 100.3 30 Other Transport Equipment 104.5 100.3 99.6 103.9 100.5 100.4 114.2 91.0 31 Furniture 99.6 79.0 96.6 101.6 91.4 104.4 126.2 91.8
32 Other Manufacturing Industries 118.4 88.5 100.6 114.6 95.9 106.8 119.7 84.0
Total Manufacturing 103.8 98.8 97.6 101.9 100.4 92.3 107.1 94.2
Source Economic Development Board
Note : The industries are classified according to the Singapore Standard Industrial Classification (SSIC) 2010.
24 Monthly Digest of Statistics Singapore

Manufacturing
7.2 INVESTMENT COMMITMENTS IN MANUFACTURING 1 AND SERVICES
BY COUNTRY OF ORIGIN
(Fixed Asset Investments) Million Dollars
2010 2011 2010 Q3 2010 Q4 2011 Q1 2011 Q2 2011 Q3 2011 Q4
Total 12,854.2 13,734.3 2,639.8 2,669.7 2,640.2 3,672.4 4,038.9 3,382.8
Foreign 10,784.6 11,858.9 2,179.3 2,373.6 2,052.1 2,624.6 3,898.2 3,284.0
United States of America 3,311.5 5,047.4 373.1 241.1 199.5 999.7 2,672.1 1,176.1
Japan 1,175.7 995.0 191.0 299.2 69.9 34.0 355.1 536.0
Europe 4,819.0 2,131.9 632.6 1,402.7 570.8 587.0 217.8 756.3
Asia Pacific & Others 1,478.4 3,684.6 982.6 430.6 1,211.9 1,003.9 653.2 815.6
Local 2,069.6 1,875.4 460.5 296.1 588.1 1,047.8 140.7 98.8
Source : Economic Development Board 1 Data include servicing, engineering and R & D.
7.3 INDICES OF UNIT BUSINESS COST AND UNIT LABOUR COST
(2005 = 100)
Weights 1 2010 2011 2010 Q3 2010 Q4 2011 Q1 2011 Q2 2011 Q3 2011 Q4
Unit Business Cost Index ofManufacturing
Total 100.0 102.5 104.1 101.0 106.4 105.5 102.0 100.9 107.9
Unit Labour Cost 39.3 92.1 89.8 87.1 101.6 96.5 85.2 80.4 97.0
Services Cost 59.8 109.5 113.5 110.3 109.8 111.6 113.0 114.3 115.0
Government Rates & Fees 0.9 87.1 103.3 90.0 93.3 98.2 101.0 105.5 108.7
Unit Labour Cost Index of Overall Economy 110.9 114.7 103.8 120.9 123.2 107.3 105.5 123.0
1 The weights are based on the 2005 input structure.
25 Monthly Digest of Statistics Singapore

Construction and Real Estate
8.1 CONTRACTS AWARDED AND PROGRESS PAYMENTS CERTIFIED
2010 2011P Nov 2010 Dec 2010 Jan 2011 Feb 2011 Mar 2011 Apr 2011
Contracts Awarded 27,564.6 32,266.5 2,283.1 2,760.9 3,080.0 2,287.9 2,716.5 2,630.3
Public 8,546.5 14,824.4 712.3 1,103.5 1,185.8 915.4 744.4 1,662.0
Private 19,018.1 17,442.1 1,570.8 1,657.4 1,894.2 1,372.5 1,972.1 968.2
Progress Payments Certified 27,427.8 27,341.9 2,278.0 2,464.7 2,356.5 1,936.5 2,349.0 2,144.8
Public 10,975.7 11,376.3 968.2 1,043.1 1,051.4 916.2 1,067.3 906.9
Private 16,452.2 15,965.6 1,309.8 1,421.7 1,305.1 1,020.3 1,281.7 1,237.9
May 2011 Jun 2011 Jul 2011 Aug 2011 Sep 2011 Oct 2011 Nov 2011 Dec 2011P
Contracts Awarded 3,312.1 2,860.8 2,565.9 3,077.8 2,848.1 2,062.1 3,327.4 1,497.6
Public 1,319.1 1,578.6 1,276.1 1,191.1 1,636.1 830.3 1,996.2 489.2
Private 1,993.0 1,282.2 1,289.8 1,886.7 1,212.0 1,231.8 1,331.1 1,008.4
Progress Payments Certified 2,229.2 2,256.0 2,222.9 2,342.7 2,336.1 2,367.5 2,333.0 2,468.0
Public 896.2 919.1 921.3 934.5 948.2 976.4 878.0 961.0
Private 1,333.1 1,336.9 1,301.6 1,408.2 1,387.9 1,391.1 1,455.0 1,507.0
Source : Building and Construction Authority
Million Dollars
26 Monthly Digest of Statistics Singapore
Construction and Real Estate
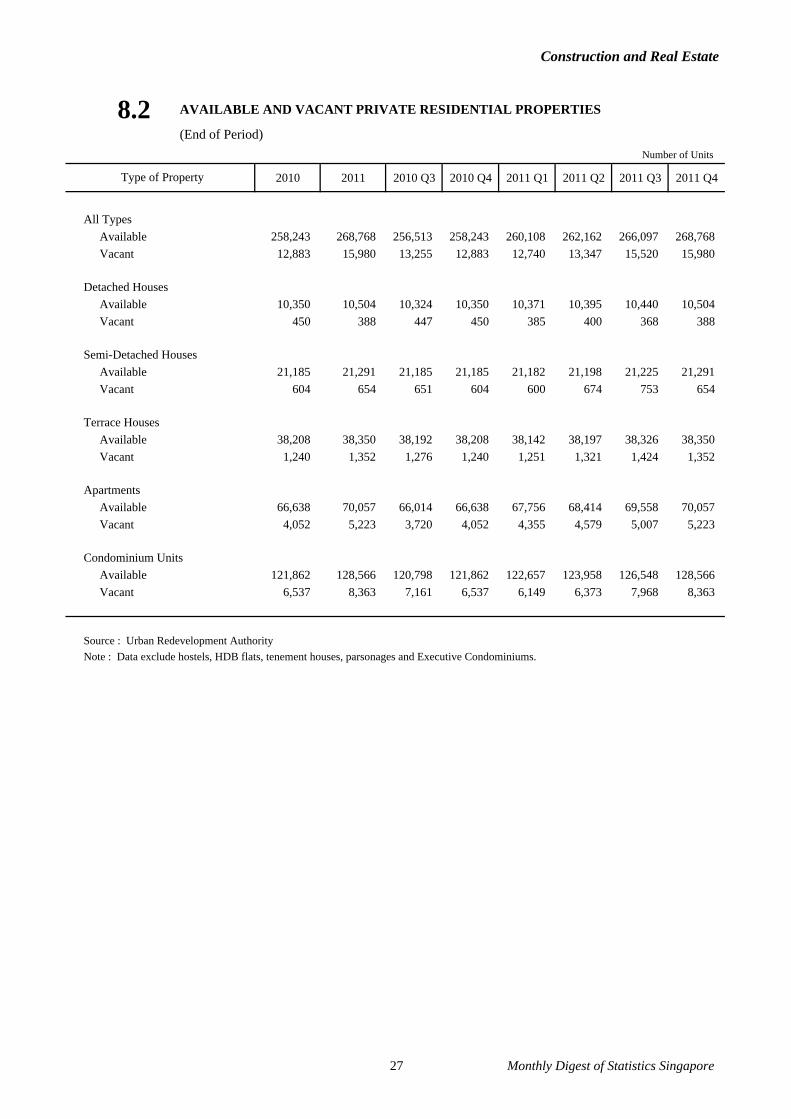
8.2 AVAILABLE AND VACANT PRIVATE RESIDENTIAL PROPERTIES
(End of Period)
2010 2011 2010 Q3 2010 Q4 2011 Q1 2011 Q2 2011 Q3 2011 Q4
All TypesAvailable 258,243 268,768 256,513 258,243 260,108 262,162 266,097 268,768 Vacant 12,883 15,980 13,255 12,883 12,740 13,347 15,520 15,980
Detached HousesAvailable 10,350 10,504 10,324 10,350 10,371 10,395 10,440 10,504 Vacant 450 388 447 450 385 400 368 388
Semi-Detached HousesAvailable 21,185 21,291 21,185 21,185 21,182 21,198 21,225 21,291 Vacant 604 654 651 604 600 674 753 654
Terrace HousesAvailable 38,208 38,350 38,192 38,208 38,142 38,197 38,326 38,350 Vacant 1,240 1,352 1,276 1,240 1,251 1,321 1,424 1,352
ApartmentsAvailable 66,638 70,057 66,014 66,638 67,756 68,414 69,558 70,057 Vacant 4,052 5,223 3,720 4,052 4,355 4,579 5,007 5,223
Condominium UnitsAvailable 121,862 128,566 120,798 121,862 122,657 123,958 126,548 128,566 Vacant 6,537 8,363 7,161 6,537 6,149 6,373 7,968 8,363
Source : Urban Redevelopment AuthorityNote : Data exclude hostels, HDB flats, tenement houses, parsonages and Executive Condominiums.
Number of Units
Type of Property
27 Monthly Digest of Statistics Singapore
Construction and Real Estate
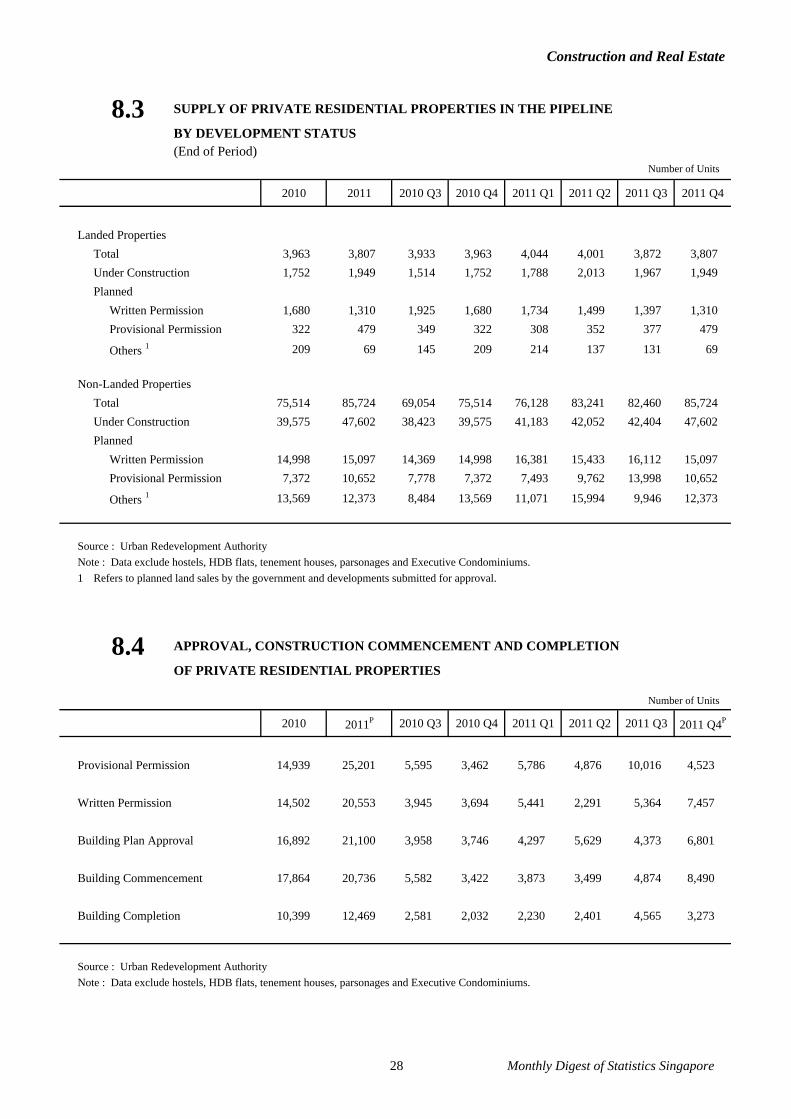
8.3 SUPPLY OF PRIVATE RESIDENTIAL PROPERTIES IN THE PIPELINE
BY DEVELOPMENT STATUS(End of Period)
2010 2011 2010 Q3 2010 Q4 2011 Q1 2011 Q2 2011 Q3 2011 Q4
Landed PropertiesTotal 3,963 3,807 3,933 3,963 4,044 4,001 3,872 3,807 Under Construction 1,752 1,949 1,514 1,752 1,788 2,013 1,967 1,949 Planned
Written Permission 1,680 1,310 1,925 1,680 1,734 1,499 1,397 1,310 Provisional Permission 322 479 349 322 308 352 377 479
Others 1 209 69 145 209 214 137 131 69
Non-Landed PropertiesTotal 75,514 85,724 69,054 75,514 76,128 83,241 82,460 85,724 Under Construction 39,575 47,602 38,423 39,575 41,183 42,052 42,404 47,602 Planned
Written Permission 14,998 15,097 14,369 14,998 16,381 15,433 16,112 15,097 Provisional Permission 7,372 10,652 7,778 7,372 7,493 9,762 13,998 10,652
Others 1 13,569 12,373 8,484 13,569 11,071 15,994 9,946 12,373
Source : Urban Redevelopment AuthorityNote : Data exclude hostels, HDB flats, tenement houses, parsonages and Executive Condominiums.1 Refers to planned land sales by the government and developments submitted for approval.
8.4 APPROVAL, CONSTRUCTION COMMENCEMENT AND COMPLETION
OF PRIVATE RESIDENTIAL PROPERTIES
2010 2011P 2010 Q3 2010 Q4 2011 Q1 2011 Q2 2011 Q3 2011 Q4P
Provisional Permission 14,939 25,201 5,595 3,462 5,786 4,876 10,016 4,523
Written Permission 14,502 20,553 3,945 3,694 5,441 2,291 5,364 7,457
Building Plan Approval 16,892 21,100 3,958 3,746 4,297 5,629 4,373 6,801
Building Commencement 17,864 20,736 5,582 3,422 3,873 3,499 4,874 8,490
Building Completion 10,399 12,469 2,581 2,032 2,230 2,401 4,565 3,273
Source : Urban Redevelopment AuthorityNote : Data exclude hostels, HDB flats, tenement houses, parsonages and Executive Condominiums.
Number of Units
Number of Units
28 Monthly Digest of Statistics Singapore

Construction and Real Estate
8.5 AVAILABLE AND VACANT EXECUTIVE CONDOMINIUMS AND
SUPPLY OF EXECUTIVE CONDOMINIUMS IN THE PIPELINE
BY DEVELOPMENT STATUS
(End of Period)
2010 2011 2010 Q3 2010 Q4 2011 Q1 2011 Q2 2011 Q3 2011 Q4
Executive Condominiums Available 10,430 10,430 10,430 10,430 10,430 10,430 10,430 10,430 Vacant 52 83 82 52 56 78 81 83
Supply by Development StatusTotal 6,005 10,073 4,099 6,005 6,092 7,179 7,179 10,073
Under Construction 1,659 4,262 680 1,659 2,199 2,514 3,592 4,262 Planned
Written Permission 540 1,796 979 540 - 1,680 602 1,796 Provisional Permission 336 - 540 336 2,023 - 1,138 -Others 1 3,470 4,015 1,900 3,470 1,870 2,985 1,847 4,015
Source : Urban Redevelopment Authority1 Refers to planned land sales by the government and development submitted for approval.
Number of Units
Type of Property
29 Monthly Digest of Statistics Singapore

Construction and Real Estate
8.6 AVAILABLE AND VACANT COMMERCIAL AND INDUSTRIAL PROPERTIES
(End of Period)
2010 2011 2010 Q3 2010 Q4 2011 Q1 2011 Q2 2011 Q3 2011 Q4
Private Sector
Office SpaceAvailable 5,816 6,008 5,808 5,816 5,874 5,981 5,982 6,008 Vacant 771 753 841 771 785 819 766 753
Shop SpaceAvailable 2,312 2,338 2,272 2,312 2,320 2,312 2,338 2,338 Vacant 140 148 167 140 168 159 180 148
Factory SpaceAvailable 25,308 26,209 25,178 25,308 25,478 25,653 26,066 26,209 Vacant 2,097 1,984 2,153 2,097 2,007 2,061 2,044 1,984
Warehouse SpaceAvailable 6,912 7,069 6,867 6,912 6,867 7,053 7,066 7,069 Vacant 594 406 601 594 495 548 457 406
Public Sector
Office SpaceAvailable 1,240 1,223 1,242 1,240 1,235 1,233 1,226 1,223 Vacant 85 64 79 85 74 83 78 64
Shop SpaceAvailable 1,103 1,081 1,109 1,103 1,091 1,088 1,076 1,081 Vacant 57 33 53 57 41 37 30 33
Factory SpaceAvailable 5,349 5,050 5,381 5,349 5,346 5,355 5,035 5,050 Vacant 112 140 136 112 106 126 118 140
Warehouse SpaceAvailable 46 47 46 46 46 47 47 47 Vacant 1 - - 1 - 1 - -
Source : Urban Redevelopment Authority
Thousand sq m nett
30 Monthly Digest of Statistics Singapore

Construction and Real Estate
8.7 SUPPLY OF COMMERCIAL AND INDUSTRIAL PROPERTIES
IN THE PIPELINE BY DEVELOPMENT STATUS
(Private and Public Sectors)(End of Period)
2010 2011 2010 Q3 2010 Q4 2011 Q1 2011 Q2 2011 Q3 2011 Q4
Office SpaceTotal 1,280 1,114 1,218 1,280 1,265 1,203 1,166 1,114 Under Construction 653 581 664 653 710 588 574 581 Planned
Written Permission 121 282 123 121 116 115 205 282 Provisional Permission 288 39 100 288 168 173 154 39
Others 1 218 212 331 218 271 327 233 212
Shop Space Total 505 552 533 505 537 647 608 552 Under Construction 201 323 256 201 239 300 266 323 Planned
Written Permission 71 115 62 71 71 54 76 115 Provisional Permission 56 30 64 56 63 77 112 30
Others 1 177 84 151 177 164 216 154 84
Factory Space Total 3,439 4,274 3,100 3,439 3,510 3,647 3,830 4,274 Under Construction 2,052 2,688 1,955 2,052 2,211 2,453 2,542 2,688 Planned
Written Permission 388 441 413 388 366 301 316 441 Provisional Permission 233 397 260 233 545 343 440 397
Others 1 766 748 472 766 388 550 532 748
Warehouse SpaceTotal 685 1,050 698 685 675 646 663 1,050 Under Construction 540 616 572 540 544 484 574 616 Planned
Written Permission 91 30 5 91 127 36 87 30 Provisional Permission 54 404 107 54 4 126 2 404
Others 1 - - 14 - - - - -
Source : Urban Redevelopment Authority1 Refers to planned public developments and land sales by the government and developments
submitted for approval.
Thousand sq m gross
31 Monthly Digest of Statistics Singapore
Construction and Real Estate
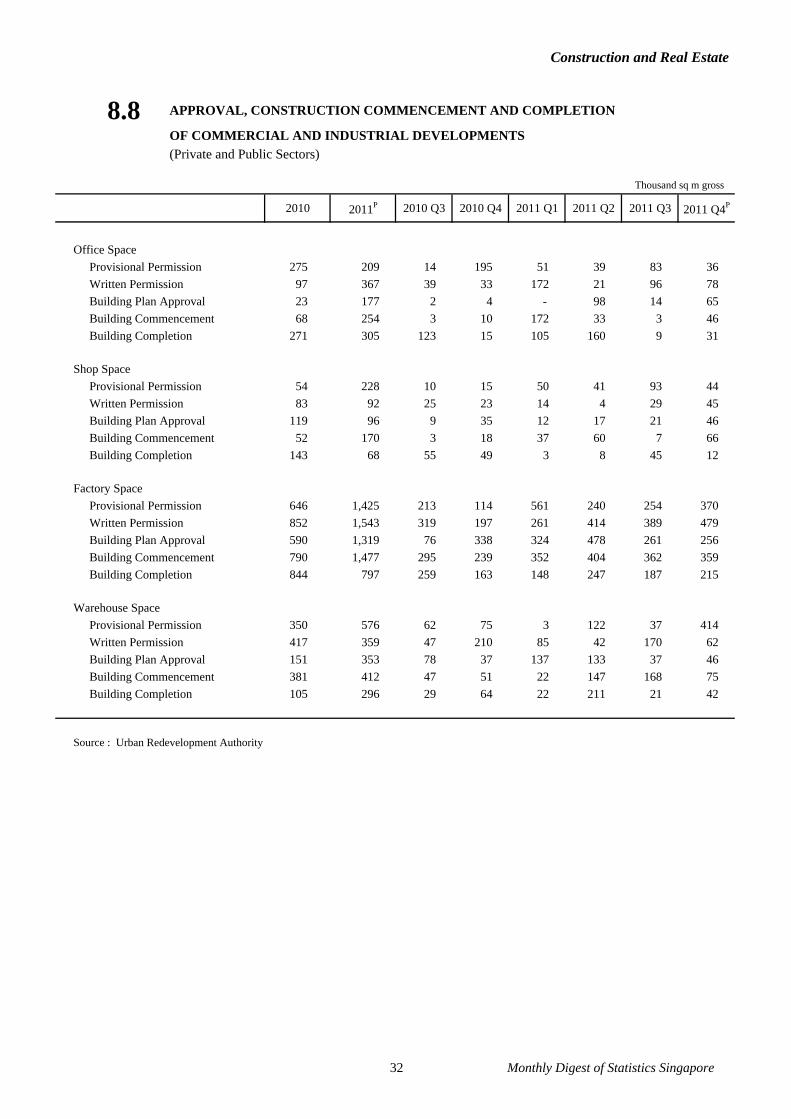
8.8 APPROVAL, CONSTRUCTION COMMENCEMENT AND COMPLETION
OF COMMERCIAL AND INDUSTRIAL DEVELOPMENTS(Private and Public Sectors)
2010 2011P 2010 Q3 2010 Q4 2011 Q1 2011 Q2 2011 Q3 2011 Q4P
Office SpaceProvisional Permission 275 209 14 195 51 39 83 36 Written Permission 97 367 39 33 172 21 96 78 Building Plan Approval 23 177 2 4 - 98 14 65 Building Commencement 68 254 3 10 172 33 3 46 Building Completion 271 305 123 15 105 160 9 31
Shop Space Provisional Permission 54 228 10 15 50 41 93 44 Written Permission 83 92 25 23 14 4 29 45 Building Plan Approval 119 96 9 35 12 17 21 46 Building Commencement 52 170 3 18 37 60 7 66 Building Completion 143 68 55 49 3 8 45 12
Factory Space Provisional Permission 646 1,425 213 114 561 240 254 370 Written Permission 852 1,543 319 197 261 414 389 479 Building Plan Approval 590 1,319 76 338 324 478 261 256 Building Commencement 790 1,477 295 239 352 404 362 359 Building Completion 844 797 259 163 148 247 187 215
Warehouse SpaceProvisional Permission 350 576 62 75 3 122 37 414 Written Permission 417 359 47 210 85 42 170 62 Building Plan Approval 151 353 78 37 137 133 37 46 Building Commencement 381 412 47 51 22 147 168 75 Building Completion 105 296 29 64 22 211 21 42
Source : Urban Redevelopment Authority
Thousand sq m gross
32 Monthly Digest of Statistics Singapore

Services
9.1 RETAIL SALES INDEX
(2010 = 100)
Weights 1 2010 2011P Nov 2010 Dec 2010 Jan 2011 Feb 2011 Mar 2011 Apr 2011
At Current Prices
Total 10,000 100.0 104.6 100.4 119.0 114.5 84.4 100.9 100.1
Total (excl Motor Vehicles) 7,535 100.0 108.0 101.4 123.2 121.6 92.2 102.8 102.0
Department Stores 1,525 100.0 107.0 98.8 125.6 129.1 90.2 98.2 100.6 Supermarkets 453 100.0 100.8 95.4 103.2 118.4 92.9 96.5 97.2 Provision & Sundry Shops 475 100.0 106.2 99.4 106.2 116.8 97.1 103.4 103.2 Food & Beverages 201 100.0 107.0 97.8 108.5 155.1 100.9 96.1 98.1 Motor Vehicles 2,465 100.0 94.3 97.5 106.0 92.8 60.6 95.2 94.5 Petrol Service Stations 508 100.0 115.1 95.3 100.8 111.3 99.9 117.3 119.0 Medical Goods & Toiletries 415 100.0 109.5 100.5 114.3 119.1 91.6 114.7 103.7 Wearing Apparel & Footwear 746 100.0 106.6 105.2 144.9 141.7 88.6 91.0 94.6 Furniture & Household
Equipment 817 100.0 103.2 102.3 124.5 116.7 80.5 100.6 95.1 Recreational Goods 184 100.0 102.9 89.1 143.7 106.5 90.2 97.1 102.3 Watches & Jewellery 770 100.0 119.4 104.8 136.9 119.7 107.5 103.9 115.6 Telecommunications Apparatus
& Computers 556 100.0 112.9 110.6 126.1 105.9 89.4 113.5 96.1 Optical Goods & Books 367 100.0 98.0 103.8 130.0 109.4 90.3 102.4 97.6 Others 518 100.0 107.8 105.2 115.2 118.4 88.8 110.1 102.9
At Constant Prices
Total 10,000 100.0 102.2 99.1 117.1 112.6 83.2 99.3 97.6
Total (excl Motor Vehicles) 7,535 100.0 105.6 100.2 122.2 120.5 91.1 100.9 99.4
Department Stores 1,525 100.0 105.7 97.3 125.5 128.5 89.5 96.6 99.0 Supermarkets 453 100.0 97.9 94.5 102.3 115.7 90.3 94.4 94.8 Provision & Sundry Shops 475 100.0 103.6 98.6 105.2 115.3 95.7 101.5 101.4 Food & Beverages 201 100.0 103.4 96.8 107.4 150.8 97.4 93.8 95.3 Motor Vehicles 2,465 100.0 91.6 95.8 101.5 88.6 58.9 94.6 92.1 Petrol Service Stations 508 100.0 103.1 95.3 96.5 103.7 91.8 104.4 104.2 Medical Goods & Toiletries 415 100.0 107.6 99.4 112.9 117.4 90.4 113.4 102.0 Wearing Apparel & Footwear 746 100.0 106.6 102.6 145.9 143.4 89.7 89.7 93.6 Furniture & Household
Equipment 817 100.0 104.2 102.7 125.6 117.9 81.4 101.0 95.6 Recreational Goods 184 100.0 104.6 88.2 144.2 107.0 91.0 98.8 103.2 Watches & Jewellery 770 100.0 108.3 101.1 130.3 116.1 104.1 99.1 108.1 Telecommunications Apparatus
& Computers 556 100.0 118.2 110.9 126.2 106.8 91.2 117.3 99.0 Optical Goods & Books 367 100.0 96.8 103.4 129.6 108.8 89.8 101.9 96.4 Others 518 100.0 105.7 103.9 114.9 118.0 88.3 108.3 100.9
(continued on next page)
1 The weights for the Retail Sales Index are computed based on the retail sales data from the Annual Survey of Retail Trade for reference year 2009.
33 Monthly Digest of Statistics Singapore

Services
9.1 RETAIL SALES INDEX (continued)
(2010 = 100)
Weights 1 May 2011 Jun 2011 Jul 2011 Aug 2011 Sep 2011 Oct 2011 Nov 2011 Dec 2011P
At Current Prices
Total 10,000 103.7 106.2 108.6 101.1 98.8 106.6 106.7 124.0
Total (excl Motor Vehicles) 7,535 106.4 106.0 108.9 105.8 101.6 107.8 107.9 133.2
Department Stores 1,525 109.0 103.5 106.5 104.9 98.9 107.4 103.0 132.7 Supermarkets 453 100.9 92.7 101.5 106.8 94.9 102.8 97.0 108.5 Provision & Sundry Shops 475 106.7 101.9 109.0 109.4 107.0 108.0 104.4 107.8 Food & Beverages 201 100.0 99.9 102.3 107.0 98.8 105.2 100.4 120.3 Motor Vehicles 2,465 95.2 106.9 107.8 86.7 90.5 102.7 102.8 95.8 Petrol Service Stations 508 117.5 110.7 121.9 117.3 115.9 119.2 115.4 115.3 Medical Goods & Toiletries 415 108.8 105.5 106.8 105.7 112.3 111.0 108.4 127.1 Wearing Apparel & Footwear 746 98.1 106.1 111.3 98.8 90.1 100.4 103.7 154.5 Furniture & Household
Equipment 817 102.7 102.0 105.3 102.7 97.8 102.0 103.2 129.3 Recreational Goods 184 104.6 107.4 106.9 99.5 91.5 97.7 94.8 135.8 Watches & Jewellery 770 124.5 124.9 120.3 118.7 109.5 120.6 114.3 153.0 Telecommunications Apparatus
& Computers 556 98.1 111.3 108.3 100.1 110.6 116.4 141.9 163.6 Optical Goods & Books 367 95.9 94.2 97.2 89.6 84.2 89.1 100.1 126.7 Others 518 101.3 107.4 108.9 108.6 105.6 109.0 108.4 123.7
At Constant Prices
Total 10,000 101.2 104.8 106.7 98.2 95.3 102.8 103.0 121.2
Total (excl Motor Vehicles) 7,535 104.1 104.5 106.8 102.6 98.5 104.6 104.4 130.2
Department Stores 1,525 107.7 103.5 105.7 102.8 97.5 105.4 100.8 131.4 Supermarkets 453 98.6 90.3 98.8 103.8 91.9 99.2 93.5 104.1 Provision & Sundry Shops 475 104.5 99.5 106.2 106.2 103.7 104.6 100.7 103.7 Food & Beverages 201 97.4 96.8 99.1 103.3 95.2 100.9 96.1 114.6 Motor Vehicles 2,465 92.6 105.8 106.5 84.8 85.4 97.4 98.6 93.7 Petrol Service Stations 508 104.7 100.2 109.3 106.2 104.0 105.2 101.5 101.8 Medical Goods & Toiletries 415 107.6 104.6 104.6 103.2 109.5 108.2 105.7 125.0 Wearing Apparel & Footwear 746 97.5 108.8 112.4 97.1 89.6 99.2 101.8 156.1 Furniture & Household
Equipment 817 103.1 102.4 106.4 104.2 99.4 103.4 104.6 131.2 Recreational Goods 184 105.4 110.1 108.8 101.4 94.1 100.2 96.3 139.2 Watches & Jewellery 770 115.7 115.3 110.0 103.1 92.1 105.2 97.3 133.9 Telecommunications Apparatus
& Computers 556 101.3 115.7 113.9 105.5 117.3 124.5 151.0 174.7 Optical Goods & Books 367 94.8 92.9 96.0 88.5 83.1 87.4 98.2 124.1 Others 518 99.3 106.3 107.1 105.5 102.9 105.7 104.8 120.6
1 The weights for the Retail Sales Index are computed based on the retail sales data from the Annual Survey of Retail Trade for reference year 2009.
34 Monthly Digest of Statistics Singapore

Services
9.2 FOOD & BEVERAGE SERVICES INDEX
(2010 = 100)
Weights 1 2010 2011P Nov 2010 Dec 2010 Jan 2011 Feb 2011 Mar 2011 Apr 2011
At Current Prices
Total 1,000 100.0 106.9 100.7 110.2 104.8 102.0 103.0 102.1
Restaurants 391 100.0 105.2 99.8 110.9 106.3 112.3 97.0 96.5 Fast Food Outlets 126 100.0 109.8 100.8 109.3 101.7 97.0 106.5 107.8 Food Caterers 114 100.0 108.6 105.5 112.2 105.9 106.9 108.0 106.6 Other Eating Places 369 100.0 107.2 100.1 109.2 104.1 91.3 106.6 104.8
At Constant Prices
Total 1,000 100.0 104.2 100.2 109.5 103.7 100.7 101.6 100.1
Restaurants 391 100.0 102.3 99.1 110.0 104.7 110.6 95.5 94.4 Fast Food Outlets 126 100.0 107.8 100.5 109.0 100.8 96.1 105.5 106.1 Food Caterers 114 100.0 107.1 105.4 112.0 105.6 106.6 107.7 105.0 Other Eating Places 369 100.0 104.3 99.6 108.4 102.9 90.0 104.7 102.4
Weights 1 May 2011 Jun 2011 Jul 2011 Aug 2011 Sep 2011 Oct 2011 Nov 2011 Dec 2011P
At Current Prices
Total 1,000 108.0 106.8 110.6 105.3 105.3 108.9 106.4 119.5
Restaurants 391 106.8 102.7 106.1 102.6 101.4 106.5 103.8 120.2 Fast Food Outlets 126 117.1 111.0 116.0 104.9 110.3 115.6 110.5 119.5 Food Caterers 114 104.9 107.0 109.8 107.6 107.0 105.2 111.9 121.8 Other Eating Places 369 107.2 109.6 113.6 107.4 107.4 110.3 106.0 118.1
At Constant Prices
Total 1,000 105.8 104.5 107.6 102.3 102.3 105.0 102.5 115.0
Restaurants 391 104.5 100.5 103.0 99.4 98.2 101.9 99.4 114.9 Fast Food Outlets 126 115.3 109.0 113.7 102.5 107.8 112.6 107.7 116.0 Food Caterers 114 103.4 105.4 108.1 106.0 105.4 103.2 109.8 119.5 Other Eating Places 369 104.6 106.9 110.2 104.1 103.9 106.0 101.9 113.3
Note : Food & beverage sales refers to the sales of prepared food and drinks for in-premises consumption or on a take-away basis. All eating places are included with the exception of hawker stalls.
1 The weights for the Food & Beverage Services Index are computed based on the food & beverage sales data from the Annual Survey of Food & Beverage Services for reference year 2009.
35 Monthly Digest of Statistics Singapore
Services
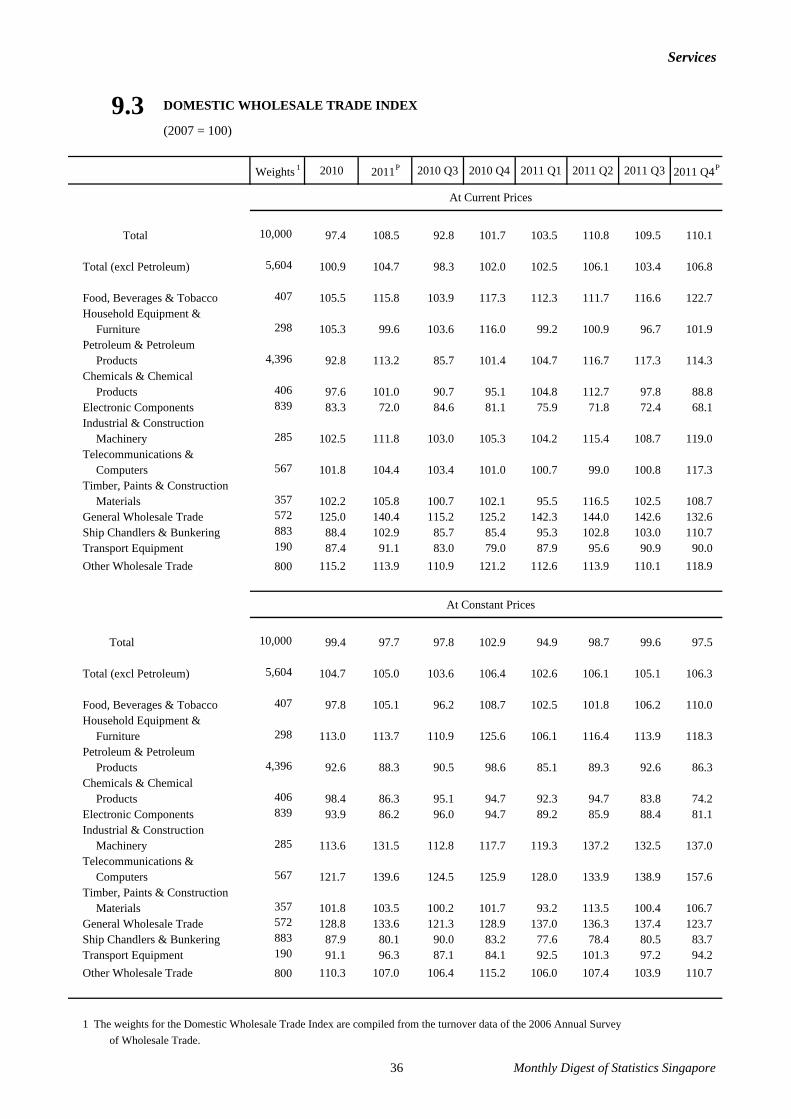
9.3 DOMESTIC WHOLESALE TRADE INDEX
(2007 = 100)
Weights 1 2010 2011P 2010 Q3 2010 Q4 2011 Q1 2011 Q2 2011 Q3 2011 Q4P
At Current Prices
Total 10,000 97.4 108.5 92.8 101.7 103.5 110.8 109.5 110.1
Total (excl Petroleum) 5,604 100.9 104.7 98.3 102.0 102.5 106.1 103.4 106.8
Food, Beverages & Tobacco 407 105.5 115.8 103.9 117.3 112.3 111.7 116.6 122.7 Household Equipment &
Furniture 298 105.3 99.6 103.6 116.0 99.2 100.9 96.7 101.9 Petroleum & Petroleum
Products 4,396 92.8 113.2 85.7 101.4 104.7 116.7 117.3 114.3 Chemicals & Chemical
Products 406 97.6 101.0 90.7 95.1 104.8 112.7 97.8 88.8 Electronic Components 839 83.3 72.0 84.6 81.1 75.9 71.8 72.4 68.1 Industrial & Construction
Machinery 285 102.5 111.8 103.0 105.3 104.2 115.4 108.7 119.0 Telecommunications &
Computers 567 101.8 104.4 103.4 101.0 100.7 99.0 100.8 117.3 Timber, Paints & Construction
Materials 357 102.2 105.8 100.7 102.1 95.5 116.5 102.5 108.7 General Wholesale Trade 572 125.0 140.4 115.2 125.2 142.3 144.0 142.6 132.6 Ship Chandlers & Bunkering 883 88.4 102.9 85.7 85.4 95.3 102.8 103.0 110.7 Transport Equipment 190 87.4 91.1 83.0 79.0 87.9 95.6 90.9 90.0 Other Wholesale Trade 800 115.2 113.9 110.9 121.2 112.6 113.9 110.1 118.9
At Constant Prices
Total 10,000 99.4 97.7 97.8 102.9 94.9 98.7 99.6 97.5
Total (excl Petroleum) 5,604 104.7 105.0 103.6 106.4 102.6 106.1 105.1 106.3
Food, Beverages & Tobacco 407 97.8 105.1 96.2 108.7 102.5 101.8 106.2 110.0 Household Equipment &
Furniture 298 113.0 113.7 110.9 125.6 106.1 116.4 113.9 118.3 Petroleum & Petroleum
Products 4,396 92.6 88.3 90.5 98.6 85.1 89.3 92.6 86.3 Chemicals & Chemical
Products 406 98.4 86.3 95.1 94.7 92.3 94.7 83.8 74.2 Electronic Components 839 93.9 86.2 96.0 94.7 89.2 85.9 88.4 81.1 Industrial & Construction
Machinery 285 113.6 131.5 112.8 117.7 119.3 137.2 132.5 137.0 Telecommunications &
Computers 567 121.7 139.6 124.5 125.9 128.0 133.9 138.9 157.6 Timber, Paints & Construction
Materials 357 101.8 103.5 100.2 101.7 93.2 113.5 100.4 106.7 General Wholesale Trade 572 128.8 133.6 121.3 128.9 137.0 136.3 137.4 123.7 Ship Chandlers & Bunkering 883 87.9 80.1 90.0 83.2 77.6 78.4 80.5 83.7 Transport Equipment 190 91.1 96.3 87.1 84.1 92.5 101.3 97.2 94.2 Other Wholesale Trade 800 110.3 107.0 106.4 115.2 106.0 107.4 103.9 110.7
1 The weights for the Domestic Wholesale Trade Index are compiled from the turnover data of the 2006 Annual Survey of Wholesale Trade.
36 Monthly Digest of Statistics Singapore
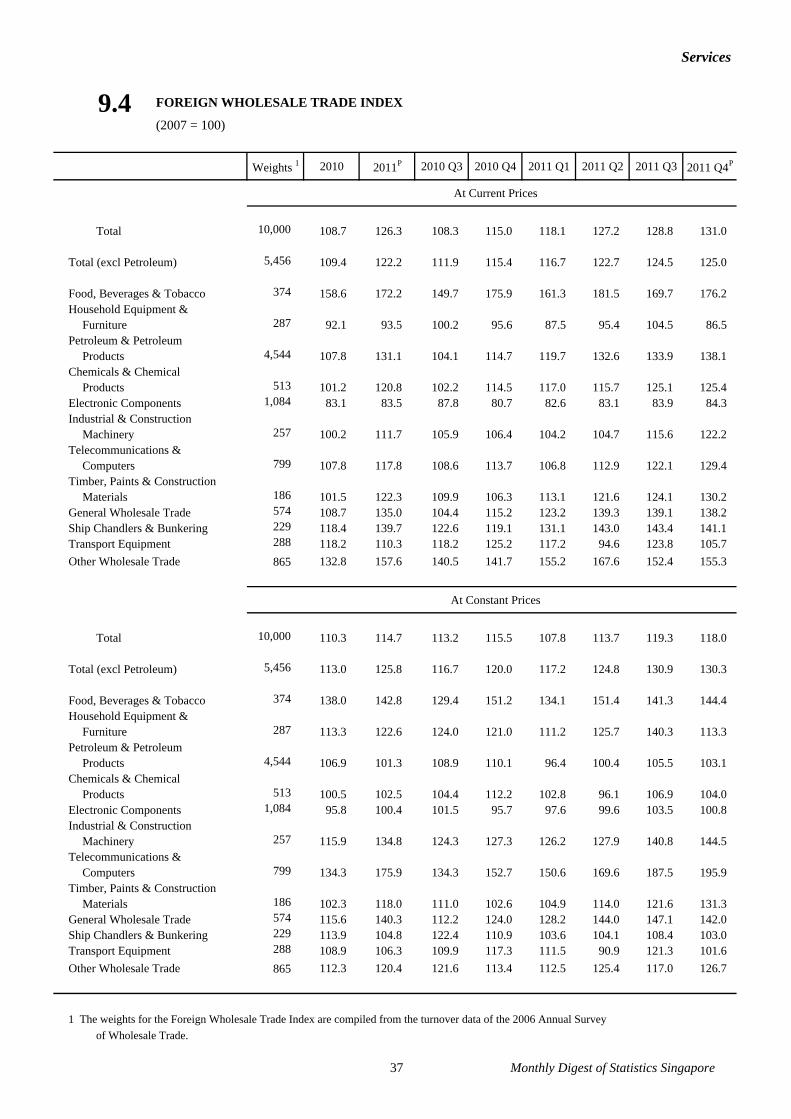
Services
9.4 FOREIGN WHOLESALE TRADE INDEX
(2007 = 100)
Weights 1 2010 2011P 2010 Q3 2010 Q4 2011 Q1 2011 Q2 2011 Q3 2011 Q4P
At Current Prices
Total 10,000 108.7 126.3 108.3 115.0 118.1 127.2 128.8 131.0
Total (excl Petroleum) 5,456 109.4 122.2 111.9 115.4 116.7 122.7 124.5 125.0
Food, Beverages & Tobacco 374 158.6 172.2 149.7 175.9 161.3 181.5 169.7 176.2 Household Equipment &
Furniture 287 92.1 93.5 100.2 95.6 87.5 95.4 104.5 86.5 Petroleum & Petroleum
Products 4,544 107.8 131.1 104.1 114.7 119.7 132.6 133.9 138.1 Chemicals & Chemical
Products 513 101.2 120.8 102.2 114.5 117.0 115.7 125.1 125.4 Electronic Components 1,084 83.1 83.5 87.8 80.7 82.6 83.1 83.9 84.3 Industrial & Construction
Machinery 257 100.2 111.7 105.9 106.4 104.2 104.7 115.6 122.2 Telecommunications &
Computers 799 107.8 117.8 108.6 113.7 106.8 112.9 122.1 129.4 Timber, Paints & Construction
Materials 186 101.5 122.3 109.9 106.3 113.1 121.6 124.1 130.2 General Wholesale Trade 574 108.7 135.0 104.4 115.2 123.2 139.3 139.1 138.2 Ship Chandlers & Bunkering 229 118.4 139.7 122.6 119.1 131.1 143.0 143.4 141.1 Transport Equipment 288 118.2 110.3 118.2 125.2 117.2 94.6 123.8 105.7 Other Wholesale Trade 865 132.8 157.6 140.5 141.7 155.2 167.6 152.4 155.3
At Constant Prices
Total 10,000 110.3 114.7 113.2 115.5 107.8 113.7 119.3 118.0
Total (excl Petroleum) 5,456 113.0 125.8 116.7 120.0 117.2 124.8 130.9 130.3
Food, Beverages & Tobacco 374 138.0 142.8 129.4 151.2 134.1 151.4 141.3 144.4 Household Equipment &
Furniture 287 113.3 122.6 124.0 121.0 111.2 125.7 140.3 113.3 Petroleum & Petroleum
Products 4,544 106.9 101.3 108.9 110.1 96.4 100.4 105.5 103.1 Chemicals & Chemical
Products 513 100.5 102.5 104.4 112.2 102.8 96.1 106.9 104.0 Electronic Components 1,084 95.8 100.4 101.5 95.7 97.6 99.6 103.5 100.8 Industrial & Construction
Machinery 257 115.9 134.8 124.3 127.3 126.2 127.9 140.8 144.5 Telecommunications &
Computers 799 134.3 175.9 134.3 152.7 150.6 169.6 187.5 195.9 Timber, Paints & Construction
Materials 186 102.3 118.0 111.0 102.6 104.9 114.0 121.6 131.3 General Wholesale Trade 574 115.6 140.3 112.2 124.0 128.2 144.0 147.1 142.0 Ship Chandlers & Bunkering 229 113.9 104.8 122.4 110.9 103.6 104.1 108.4 103.0 Transport Equipment 288 108.9 106.3 109.9 117.3 111.5 90.9 121.3 101.6 Other Wholesale Trade 865 112.3 120.4 121.6 113.4 112.5 125.4 117.0 126.7
1 The weights for the Foreign Wholesale Trade Index are compiled from the turnover data of the 2006 Annual Survey of Wholesale Trade.
37 Monthly Digest of Statistics Singapore

Services
9.5 BUSINESS RECEIPTS INDEX FOR SERVICES INDUSTRIES
(2008 = 100)
Weights 1 2010 2011P 2010 Q3 2010 Q4 2011 Q1 2011 Q2 2011 Q3 2011 Q4P
Total Services 2 10,000 105.9 113.8 105.2 112.3 111.9 110.9 115.0 117.3
Transport & Storage 3 2,408 92.0 96.1 92.5 96.5 92.0 94.2 96.2 102.0
Information & Communications 935 111.5 117.4 105.5 117.7 117.5 115.0 114.4 122.7
Financial & Insurance 2,461 109.3 119.9 108.1 117.4 119.9 118.0 122.0 119.8
Real Estate, Rental & Leasing 1,209 114.6 122.9 115.4 122.0 118.4 121.8 125.1 126.3
Business Services
excl Real Estate, Rental & Leasing 4 1,680 104.7 113.2 104.2 110.6 108.6 109.8 113.9 120.6
Education 451 109.7 113.7 103.3 110.6 125.2 99.2 126.0 104.5
Health & Social Services 459 109.0 121.3 110.1 117.0 118.8 118.3 120.6 127.6
Recreation & Personal Services 5 397 125.3 139.4 134.5 137.9 139.2 135.1 140.6 142.6
1 The weights for the 2008-based Quarterly Business Receipts Index series are based on the value added contributionsof the respective industries, using data from the Annual Survey of Services 2007.
2 Excludes wholesale and retail trade, accommodation & food services.3 Comprises land transport, water transport, air transport, warehousing & support activities
for transport and post & courier activities.4 Comprises professional, scientific & technical and administrative & support service activities,
e.g. legal services, accounting activities, management and management consultancy services, architectural, engineering and technical services, employment agencies and travel agencies.
5 Comprises arts, entertainment & recreation, membership organisations' activities (e.g. business and professional membership organisations, religious organisations and interest group organisations) and personal services.
38 Monthly Digest of Statistics Singapore

External Trade
10.1 EXTERNAL TRADE BY TYPE
2010 2011 Dec 2010 Jan 2011 Feb 2011 Mar 2011 Apr 2011 May 2011
At Current Prices
Total Trade 902,062.6 974,396.4 77,108.1 78,793.5 67,536.6 88,368.6 80,667.5 81,521.5
Exports 478,840.8 514,741.2 41,504.4 42,422.3 36,168.3 46,046.7 42,528.7 42,255.6 Oil 103,511.0 136,773.5 8,874.7 11,196.4 9,324.2 11,977.8 11,965.4 11,441.8 Non-oil 375,329.7 377,967.7 32,629.7 31,225.9 26,844.1 34,068.8 30,563.3 30,813.8
Domestic Exports 248,609.8 281,349.7 21,352.5 22,640.8 19,697.1 24,865.8 22,977.2 22,849.3 Oil 75,011.1 103,953.8 6,905.1 8,057.3 6,925.9 8,561.8 8,564.7 8,397.2 Non-oil 173,598.8 177,395.8 14,447.4 14,583.4 12,771.1 16,304.0 14,412.5 14,452.1
Re-exports 230,230.9 233,391.6 20,151.8 19,781.5 16,471.2 21,180.9 19,551.5 19,406.3
Imports 423,221.8 459,655.1 35,603.7 36,371.2 31,368.4 42,321.9 38,138.8 39,265.9 Oil 115,591.6 149,945.6 9,251.1 11,582.9 9,946.4 15,294.8 12,784.8 13,293.7 Non-oil 307,630.2 309,709.6 26,352.6 24,788.4 21,422.0 27,027.1 25,354.0 25,972.2
Total Trade 967,109.6 987,445.1 81,983.6 81,606.1 68,765.2 88,188.1 80,005.7 82,473.0
Exports 518,915.7 533,605.5 44,814.7 44,799.0 37,589.6 47,478.0 43,155.8 43,736.0 Oil 93,810.7 96,633.6 7,444.8 8,980.5 6,951.0 8,267.0 7,931.4 7,986.4 Non-oil 425,105.1 436,971.9 37,369.9 35,818.6 30,638.6 39,211.1 35,224.3 35,749.6
Domestic Exports 264,392.3 279,769.9 22,443.7 23,239.3 19,802.9 24,805.7 22,278.8 22,653.9 Oil 67,021.2 72,525.1 5,735.1 6,394.7 5,134.1 5,816.4 5,579.6 5,767.3 Non-oil 197,371.1 207,244.8 16,708.6 16,844.6 14,668.7 18,989.3 16,699.2 16,886.6
Re-exports 254,523.4 253,835.5 22,371.0 21,559.7 17,786.7 22,672.3 20,877.0 21,082.2
Imports 448,194.0 453,839.6 37,168.9 36,807.1 31,175.7 40,710.1 36,850.0 38,737.0 Oil 108,576.5 109,948.2 8,030.5 9,541.1 7,535.1 10,971.9 8,841.5 9,689.3 Non-oil 339,617.5 343,891.5 29,138.4 27,266.0 23,640.5 29,738.2 28,008.5 29,047.7
(continued on next page)Source : International Enterprise Singapore
At 2006 Prices
Million Dollars
39 Monthly Digest of Statistics Singapore

External Trade
10.1 EXTERNAL TRADE BY TYPE (continued)
Jun 2011 Jul 2011 Aug 2011 Sep 2011 Oct 2011 Nov 2011 Dec 2011 Jan 2012
At Current Prices
Total Trade 82,273.3 78,671.4 86,134.4 82,205.2 81,955.8 84,631.3 81,637.3 80,173.5
Exports 43,435.4 42,122.5 44,378.3 44,439.7 43,385.2 42,933.8 44,624.9 40,713.8 Oil 12,032.4 11,612.9 11,907.7 12,106.3 10,873.9 10,877.9 11,457.0 11,190.3 Non-oil 31,403.0 30,509.6 32,470.6 32,333.4 32,511.3 32,056.0 33,167.9 29,523.5
Domestic Exports 23,502.4 23,307.4 26,245.3 24,467.5 22,696.8 23,401.0 24,699.0 23,100.2 Oil 8,753.1 8,970.5 9,845.3 9,504.8 8,632.6 8,795.8 8,944.8 8,818.9 Non-oil 14,749.3 14,336.9 16,400.0 14,962.7 14,064.2 14,605.3 15,754.2 14,281.3
Re-exports 19,932.9 18,815.0 18,132.9 19,972.2 20,688.4 19,532.8 19,925.9 17,613.6
Imports 38,837.9 36,548.9 41,756.1 37,765.5 38,570.6 41,697.4 37,012.4 39,459.8 Oil 12,367.8 10,792.9 15,677.7 11,410.1 13,107.6 13,545.0 10,142.0 14,266.2 Non-oil 26,470.1 25,756.0 26,078.4 26,355.5 25,463.0 28,152.5 26,870.4 25,193.5
Total Trade 83,752.1 80,973.3 88,723.7 84,051.3 82,012.7 84,516.8 82,377.0 78,773.1
Exports 44,974.0 44,025.1 47,297.4 46,067.4 44,620.3 44,073.0 45,789.9 41,204.6 Oil 8,499.2 8,130.9 8,592.7 8,580.2 7,539.7 7,303.9 7,870.7 7,341.7 Non-oil 36,474.8 35,894.2 38,704.7 37,487.2 37,080.7 36,769.0 37,919.1 33,862.9
Domestic Exports 23,318.1 23,235.5 26,878.9 24,172.5 22,112.5 22,885.1 24,386.9 22,274.4 Oil 6,070.1 6,199.4 7,037.4 6,656.0 5,924.9 5,856.0 6,089.1 5,734.0 Non-oil 17,248.0 17,036.1 19,841.5 17,516.4 16,187.6 17,029.1 18,297.8 16,540.4
Re-exports 21,655.9 20,789.6 20,418.5 21,894.9 22,507.8 21,187.9 21,403.0 18,930.3
Imports 38,778.1 36,948.1 41,426.3 37,984.0 37,392.4 40,443.8 36,587.1 37,568.5 Oil 9,161.3 7,889.5 11,823.3 8,439.4 9,443.5 9,419.3 7,192.9 9,672.0 Non-oil 29,616.8 29,058.6 29,603.0 29,544.6 27,948.9 31,024.5 29,394.2 27,896.4
Source : International Enterprise Singapore
At 2006 Prices
Million Dollars
40 Monthly Digest of Statistics Singapore

External Trade
10.2 IMPORTS BY REGION/COUNTRY
Region/Country 2010 2011 Aug 2011 Sep 2011 Oct 2011 Nov 2011 Dec 2011 Jan 2012
Total 423,221.8 459,655.1 41,756.1 37,765.5 38,570.6 41,697.4 37,012.4 39,459.8
America 59,728.4 64,493.9 5,677.7 5,148.5 4,933.7 6,429.0 5,488.8 5,479.5 Brazil 1,759.7 2,410.6 245.0 167.7 83.3 200.9 188.5 166.1 Canada 1,433.7 1,471.8 118.2 108.0 185.3 124.1 130.2 130.0 United States 47,515.3 49,050.0 3,974.7 3,971.9 3,763.9 5,042.4 4,391.6 4,219.9
Asia 290,501.5 317,518.0 29,388.1 25,051.7 26,969.0 28,650.7 24,888.1 27,240.4 Bahrain 300.0 238.7 10.3 9.9 41.7 25.0 91.1 25.5 Bangladesh 78.1 134.7 10.3 8.6 7.8 8.3 13.1 12.3 Brunei Darussalam 178.1 251.3 22.4 15.4 7.7 8.8 20.0 18.6 Cambodia 217.4 238.9 19.6 14.3 33.0 51.9 18.5 19.6 China 45,844.3 47,747.8 4,008.3 3,817.2 3,748.3 4,217.3 4,196.3 3,934.4 Hong Kong 4,003.7 3,994.2 411.9 301.8 330.8 377.3 319.3 230.1 India 12,566.1 17,770.9 1,456.1 1,507.5 1,580.8 1,425.9 1,171.6 1,744.3 Indonesia 22,937.1 24,245.6 2,169.8 2,001.3 1,989.8 2,005.4 1,912.7 1,947.6 Japan 33,261.5 32,963.6 2,803.2 2,807.7 2,527.7 2,634.7 2,641.2 2,100.1 Korea, Republic of 24,514.5 27,317.9 2,214.8 2,150.4 2,704.2 2,537.0 2,058.0 2,451.9 Kuwait 3,607.0 4,515.2 523.2 737.7 292.2 298.2 295.3 832.0 Laos 3.8 0.6 0.0 0.0 0.0 0.2 0.1 0.0 Malaysia 49,489.6 49,166.9 4,315.5 3,914.1 4,287.7 4,117.9 3,987.3 3,488.1 Pakistan 123.6 95.4 5.2 7.2 5.2 19.2 6.3 5.9 Philippines 12,522.8 7,793.2 667.9 543.7 582.2 562.2 644.0 573.4 Saudi Arabia 15,297.1 22,163.5 2,815.8 878.8 2,922.2 2,545.4 1,774.4 2,530.9 Sri Lanka 118.8 178.5 10.1 11.7 12.0 13.3 15.9 9.6 Taiwan 25,239.0 27,333.3 2,192.0 2,273.6 2,089.7 2,719.9 2,481.8 2,360.0 Thailand 14,000.5 14,270.2 1,472.4 1,372.5 1,209.5 972.9 999.1 820.0 United Arab Emirates 8,692.8 14,544.9 2,415.4 905.9 1,128.4 1,383.5 758.7 1,758.5 Vietnam 2,193.0 2,084.6 170.0 194.6 180.9 175.8 239.0 151.8
Europe 65,907.2 70,040.8 5,935.2 6,900.6 6,020.8 5,809.5 6,002.9 6,161.6 France 10,118.8 10,662.5 809.4 1,624.0 934.0 852.6 782.3 1,543.5 Germany 12,124.5 13,080.9 1,095.2 1,085.3 1,066.9 1,272.6 1,199.8 1,001.4 Italy 3,830.1 4,475.7 397.5 353.0 428.5 372.3 434.0 341.2 Netherlands 7,279.8 8,761.7 857.9 960.0 859.9 742.6 928.5 974.5 Sweden 1,674.3 1,632.7 122.3 112.9 143.6 124.5 150.0 112.5 United Kingdom 7,603.1 7,597.4 821.2 547.2 781.6 729.8 843.7 639.7 Switzerland 6,181.3 5,378.4 457.7 535.0 386.8 545.2 502.2 421.0
Oceania 5,597.4 6,086.2 576.3 585.7 502.8 703.0 508.0 414.7 Australia 4,710.6 4,705.3 376.5 304.0 355.2 613.5 403.4 359.0 New Zealand 783.9 1,253.2 182.8 265.9 140.9 82.3 96.7 50.7
Africa 1,487.5 1,516.3 178.9 79.0 144.4 105.3 124.6 163.6
European Union 1 52,252.2 57,901.0 5,162.3 5,670.8 5,074.3 4,909.1 5,075.5 5,280.0
Source : International Enterprise Singapore 1 The European Union (EU) comprises Austria, Belgium, Bulgaria, Cyprus, Czech Rep, Denmark, Estonia, Finland, France, Germany,
Greece, Hungary, Ireland, Italy, Latvia, Lithuania, Luxembourg, Malta, Netherlands, Poland, Portugal, Romania, Slovak Rep,Slovenia, Spain, Sweden and the United Kingdom.
Million Dollars
41 Monthly Digest of Statistics Singapore

External Trade
10.3 EXPORTS BY REGION/COUNTRY
Region/Country 2010 2011 Aug 2011 Sep 2011 Oct 2011 Nov 2011 Dec 2011 Jan 2012
Total 478,840.8 514,741.2 44,378.3 44,439.7 43,385.2 42,933.8 44,624.9 40,713.8
America 49,943.9 53,643.9 4,410.2 4,290.9 4,345.1 4,019.3 4,739.3 4,848.1 Brazil 1,988.5 1,754.1 131.7 165.4 157.9 248.4 129.4 111.2 Canada 1,981.5 1,765.1 168.5 169.4 163.4 199.4 113.9 194.3 United States 30,871.4 27,638.4 2,125.8 2,129.2 2,250.2 2,224.7 2,242.7 2,411.3
Asia 343,924.8 367,364.3 31,303.9 32,099.6 31,338.7 31,179.6 31,757.6 28,717.6 Bahrain 124.2 98.3 7.2 6.9 10.2 8.1 14.0 8.1 Bangladesh 2,317.9 2,854.3 254.2 240.5 308.2 249.5 213.2 207.4 Brunei Darussalam 1,286.2 1,978.7 692.4 106.1 117.0 123.5 132.0 185.9 Cambodia 3,000.3 1,140.1 117.8 78.2 86.8 110.3 97.9 88.4 China 49,467.9 53,650.7 4,708.7 4,646.3 4,742.0 4,758.7 4,876.3 4,039.5 Hong Kong 56,081.0 56,776.5 4,658.4 5,111.6 4,494.6 5,177.9 4,730.9 4,577.5 India 18,101.4 17,654.0 1,314.8 1,349.2 1,151.5 1,193.5 1,428.4 1,187.2 Indonesia 44,983.8 53,776.6 4,453.2 5,023.4 4,873.1 4,439.1 4,268.7 4,353.8 Japan 22,332.1 23,120.5 1,795.3 2,062.8 2,149.5 2,090.5 2,266.3 1,835.8 Korea, Republic of 19,547.7 19,458.7 1,671.7 1,663.3 1,571.7 1,592.5 1,810.2 1,721.3 Kuwait 245.3 185.3 11.2 16.3 14.2 23.5 26.6 19.2 Laos 31.3 43.6 1.5 2.6 2.0 1.6 4.0 1.8 Malaysia 57,114.2 62,834.7 5,653.0 5,435.4 5,151.3 5,514.4 5,758.4 4,707.4 Pakistan 1,591.9 2,365.1 90.8 215.9 328.4 81.4 368.4 83.7 Philippines 9,775.3 8,506.3 676.2 681.1 694.8 738.1 639.7 683.5 Saudi Arabia 1,109.6 1,099.6 104.8 119.7 89.3 96.2 109.9 91.0 Sri Lanka 1,630.3 1,674.7 239.5 215.6 162.3 176.8 180.1 196.6 Taiwan 17,441.5 18,356.1 1,457.1 1,457.5 1,426.1 1,461.2 1,455.2 1,274.5 Thailand 17,283.8 17,645.1 1,523.2 1,566.1 1,396.4 1,269.7 1,281.8 1,620.0 United Arab Emirates 5,182.5 5,829.9 477.8 548.6 462.9 576.9 647.9 404.7 Vietnam 10,061.1 12,834.9 964.1 1,195.2 1,358.3 1,067.1 1,044.5 897.0
Europe 50,262.8 51,988.1 5,140.9 4,543.7 3,859.2 3,908.6 4,305.7 3,890.8 France 7,530.6 7,690.0 521.6 861.5 514.6 557.1 1,021.8 488.2 Germany 8,369.7 8,416.6 685.2 692.4 649.2 637.4 654.3 638.0 Italy 932.1 1,223.7 84.0 84.5 89.8 92.9 83.1 82.9 Netherlands 8,387.8 9,487.4 948.3 711.1 706.3 679.4 758.3 733.4 Sweden 393.5 376.8 31.0 38.1 19.7 18.9 21.4 41.7 United Kingdom 8,333.6 8,328.0 1,216.6 742.4 590.9 596.2 478.4 756.0 Switzerland 1,573.0 1,041.0 76.3 82.1 78.3 92.3 67.0 118.0
Oceania 24,183.2 29,433.3 2,625.4 2,620.5 2,524.0 2,620.3 2,551.3 2,321.3 Australia 17,110.7 20,145.7 1,640.1 1,889.8 1,778.3 1,618.2 1,774.2 1,572.2 New Zealand 2,322.4 2,672.9 247.7 206.2 195.7 286.2 237.5 193.1
Africa 10,525.9 12,311.0 897.8 884.8 1,318.3 1,206.0 1,271.0 935.9
European Union 1 47,156.9 48,129.1 4,492.8 4,305.5 3,609.5 3,655.6 4,058.9 3,594.6
Source : International Enterprise Singapore 1 The European Union (EU) comprises Austria, Belgium, Bulgaria, Cyprus, Czech Rep, Denmark, Estonia, Finland, France, Germany,
Greece, Hungary, Ireland, Italy, Latvia, Lithuania, Luxembourg, Malta, Netherlands, Poland, Portugal, Romania, Slovak Rep,Slovenia, Spain, Sweden and the United Kingdom.
Million Dollars
42 Monthly Digest of Statistics Singapore

External Trade
10.4 IMPORTS BY COMMODITY SECTION
Commodity Section 2010 2011 Aug 2011 Sep 2011 Oct 2011 Nov 2011 Dec 2011 Jan 2012
Total 423,221.8 459,655.1 41,756.1 37,765.5 38,570.6 41,697.4 37,012.4 39,459.8
Food 9,290.3 10,295.7 905.9 798.8 872.2 971.4 1,002.2 808.5 Coffee, tea, cocoa, spices &
manufactures 1,173.3 1,410.3 126.0 104.4 139.5 153.9 131.9 109.5 Fish, seafood (excl marine mammals) &
preparations 1,295.7 1,435.8 128.5 124.9 127.3 137.3 154.0 112.3 Vegetables & fruits 1,523.1 1,665.6 144.9 128.7 132.4 148.0 165.1 146.6
Beverages & Tobacco 3,067.8 3,678.7 367.9 292.2 330.8 321.5 359.3 274.0 Beverages 2,333.4 2,849.0 294.7 226.6 262.6 249.8 274.1 203.1 Tobacco & manufactures 734.5 829.7 73.2 65.6 68.2 71.7 85.2 71.0
Crude Materials 3,003.9 3,726.0 322.3 302.2 302.5 342.4 355.9 283.9 Metalliferous ores &
metal scrap 439.9 804.8 80.1 62.8 40.2 80.4 94.4 58.8 Crude rubber 688.1 902.4 75.8 62.0 72.0 70.1 47.8 64.9 Crude fertilizers & minerals
(excl coal petroleum & precious stones) 1,031.0 1,070.2 85.0 93.6 106.2 97.5 120.1 83.5
Crude animal & vegetable materials nes 327.1 394.6 35.1 39.8 36.0 32.3 38.3 30.4
Mineral Fuels & Lubricants 115,591.6 149,945.6 15,677.7 11,410.1 13,107.6 13,545.0 10,142.0 14,266.2 Petroleum & products 1 &
related materials 110,815.7 143,796.5 15,159.1 10,864.0 12,566.6 12,995.1 9,564.8 13,665.1
Animal & Vegetable Oils 842.9 1,481.2 151.6 166.4 155.6 75.2 164.1 170.7 Fixed vegetable fats & oils crude
refined or fractionated 759.8 1,242.9 127.9 136.2 138.4 68.3 132.9 159.2
Animal or vegetable fats & oils 2 nes 68.8 41.3 3.7 2.7 3.0 2.4 5.5 3.0
Chemicals & Chemical Products 28,629.7 31,882.1 2,738.7 2,596.1 2,658.0 2,631.0 2,747.6 2,484.9 Organic chemicals 7,603.8 8,523.5 776.6 676.9 596.3 626.0 638.8 613.1 Plastics in primary forms 5,275.8 6,459.6 504.7 527.8 642.5 646.0 717.1 648.4 Medicinal & pharmaceutical products 3,253.8 3,525.6 280.8 318.4 344.5 264.1 300.2 247.6 Essential oils & resinoids &
perfume materials; toilet polishing& cleansing preparations 3,155.1 3,478.8 305.4 272.0 300.6 307.2 320.0 252.4
Source : International Enterprise Singapore Note : Data are based on Standard International Trade Classification (SITC) Rev 4.11 Include oil bunkers.2 Include processed waxes of animal or vegetable origin, inedible mixtures or preparations of animal or vegetable fats or oils nes.
Million Dollars
43 Monthly Digest of Statistics Singapore

External Trade
10.4 IMPORTS BY COMMODITY SECTION (continued)
Commodity Section 2010 2011 Aug 2011 Sep 2011 Oct 2011 Nov 2011 Dec 2011 Jan 2012
Manufactured Goods 26,457.6 30,995.6 2,516.9 2,381.2 2,546.0 2,824.5 2,620.0 2,210.9 Non-ferrous metals 4,990.5 6,535.4 438.9 398.2 508.6 514.1 476.7 374.9 Iron & steel 6,786.8 8,639.9 728.3 618.3 706.8 892.8 748.0 599.0 Manufactures of metals nes 6,338.7 6,320.8 549.1 570.6 556.3 567.8 541.7 540.1 Non-metallic mineral manufactures nes 3,223.5 3,604.9 301.3 310.3 290.3 341.3 301.0 251.1 Textile, yarn, fabrics made-up
articles nes & related products 1,423.7 1,446.5 120.7 115.6 117.0 126.9 135.4 106.2 Paper, paperboard & articles of
paper or paperboard pulp 1,773.8 2,303.7 200.3 198.6 190.1 194.5 194.5 176.1 Rubber manufactures nes 1,297.4 1,487.1 127.2 123.8 129.3 126.1 150.8 114.8
Machinery & Equipment 196,105.6 188,268.1 15,898.4 16,493.1 15,275.0 17,337.1 16,101.1 15,969.7 Electronics 123,201.8 113,381.7 9,426.5 9,427.3 8,884.5 10,412.1 9,517.5 8,507.5
Integrated circuits 67,380.0 59,403.3 4,751.2 4,895.2 4,650.2 5,635.1 4,839.2 4,585.7 Parts of personal computers 13,678.0 11,794.7 1,059.4 986.7 822.7 1,082.5 1,052.6 836.7 Disk drives 2,604.8 2,324.8 174.7 186.6 177.7 166.5 198.4 188.2 Telecommunications
equipment 3 11,443.0 12,711.3 1,081.4 967.6 998.1 1,331.1 1,082.8 939.4
Consumer electronics 4 5,798.0 5,213.9 460.8 474.3 438.5 403.3 382.0 353.1 Personal computers 4,408.9 4,834.4 460.0 428.4 508.0 396.7 488.1 395.2 Parts of integrated circuits 4,199.3 4,331.2 407.0 387.3 291.6 404.0 398.1 350.1 Diodes and transistors 6,787.6 6,311.9 512.8 572.2 473.5 462.1 505.3 384.6
Non-electronics 72,903.7 74,886.4 6,471.9 7,065.8 6,390.5 6,924.9 6,583.6 7,462.2 Electrical circuit apparatus 5,193.8 5,093.0 427.7 435.9 397.1 427.2 407.0 373.7 Electrical machinery nes 4,878.1 4,899.3 404.3 418.9 386.4 456.3 428.4 373.2
Miscellaneous Manufactures 29,683.6 32,060.3 2,594.1 2,658.9 2,783.1 2,997.1 2,900.9 2,489.2 Professional scientific & controlling
instruments & apparatus nes 8,609.7 8,565.2 696.7 729.1 693.1 816.5 792.0 659.9 Photographic apparatus equipment &
supplies & optical goods nes;watches & clocks 4,450.9 4,956.6 408.5 437.7 421.4 444.8 501.1 345.0
Articles of apparel & clothing accessories 2,669.8 2,934.8 272.3 234.1 234.5 260.6 301.0 250.8
Miscellaneous manufactured articles nes 10,727.8 12,046.8 899.4 971.2 1,135.8 1,133.8 955.4 940.0
Miscellaneous 10,548.9 7,322.0 582.6 666.7 539.8 652.3 619.4 501.6
Source : International Enterprise Singapore Note : Data are based on Standard International Trade Classification (SITC) Rev 4.13 Includes pagers, cellular/hand phones, TV cameras, video cameras and recorders, radar and navigational equipment,
radio remote controls, satellite discs and parts for these products.4 Includes television receivers, radio broadcast receivers, video and sound recorders, microphones, loudspeakers, headphones,
earphones, television cameras, still image video cameras and other video camera recorders, and parts for these products.
Million Dollars
44 Monthly Digest of Statistics Singapore

External Trade
10.5 EXPORTS BY COMMODITY SECTION
Commodity Section 2010 2011 Aug 2011 Sep 2011 Oct 2011 Nov 2011 Dec 2011 Jan 2012
Total 478,840.8 514,741.2 44,378.3 44,439.7 43,385.2 42,933.8 44,624.9 40,713.8
Food 5,455.3 6,663.2 529.2 720.2 617.2 558.4 587.3 472.3 Coffee, tea, cocoa, spices &
manufactures 1,322.5 1,905.4 151.2 261.0 207.7 132.0 149.5 121.8 Fish, seafood (excl marine mammals) &
preparations 502.7 505.1 32.4 67.1 40.1 47.3 47.6 31.7 Vegetables & fruits 307.8 396.5 35.9 28.1 32.9 34.4 38.5 26.4
Beverages & Tobacco 3,256.5 3,789.7 298.6 356.9 380.7 398.9 375.5 297.8 Beverages 2,466.2 2,913.7 232.5 279.5 305.8 318.3 289.7 231.0 Tobacco & manufactures 790.3 875.9 66.1 77.4 74.9 80.6 85.8 66.8
Crude Materials 2,819.9 3,315.2 286.6 295.1 240.7 256.5 253.8 186.8 Metalliferous ores &
metal scrap 1,119.6 1,294.5 112.8 106.8 86.6 113.3 90.5 78.2 Crude rubber 658.7 872.5 81.0 84.8 57.5 48.8 74.6 31.5 Crude fertilizers & minerals
(excl coal petroleum & precious stones) 303.5 372.6 30.0 32.1 30.9 25.8 26.5 22.6
Crude animal & vegetable materials nes 210.5 230.4 17.4 21.7 17.9 21.9 23.6 15.6
Mineral Fuels & Lubricants 103,511.0 136,773.5 11,907.7 12,106.3 10,873.9 10,877.9 11,457.0 11,190.3 Petroleum & products 1 &
related materials 103,220.1 136,470.0 11,901.2 12,071.5 10,853.8 10,867.3 11,432.5 11,154.4
Animal & Vegetable Oils 610.6 546.1 29.7 45.5 80.5 40.9 44.5 40.7 Fixed vegetable fats & oils crude
refined or fractionated 394.7 433.5 21.7 34.9 71.2 33.3 35.4 30.8
Animal or vegetable fats & oils 2 nes 197.4 100.3 7.5 9.5 8.7 7.1 7.6 8.7
Chemicals & Chemical Products 56,644.3 64,777.1 5,765.6 5,714.0 5,720.9 4,931.8 5,309.2 5,340.1 Organic chemicals 21,889.9 26,091.7 2,567.9 2,605.8 2,175.4 1,739.0 1,960.2 2,430.4 Plastics in primary forms 12,911.7 14,135.3 1,192.2 1,053.3 1,196.6 1,204.4 1,201.3 1,115.5 Medicinal & pharmaceutical products 8,332.1 8,847.5 703.5 663.5 945.2 687.8 722.5 582.2 Essential oils & resinoids &
perfume materials; toilet polishing& cleansing preparations 4,884.1 6,087.6 521.1 597.0 652.5 550.6 627.5 510.1
Source : International Enterprise Singapore Note : Data are based on Standard International Trade Classification (SITC) Rev 4.11 Include oil bunkers.2 Include processed waxes of animal or vegetable origin, inedible mixtures or preparations of animal or vegetable fats or oils nes.
Million Dollars
45Monthly Digest of Statistics Singapore
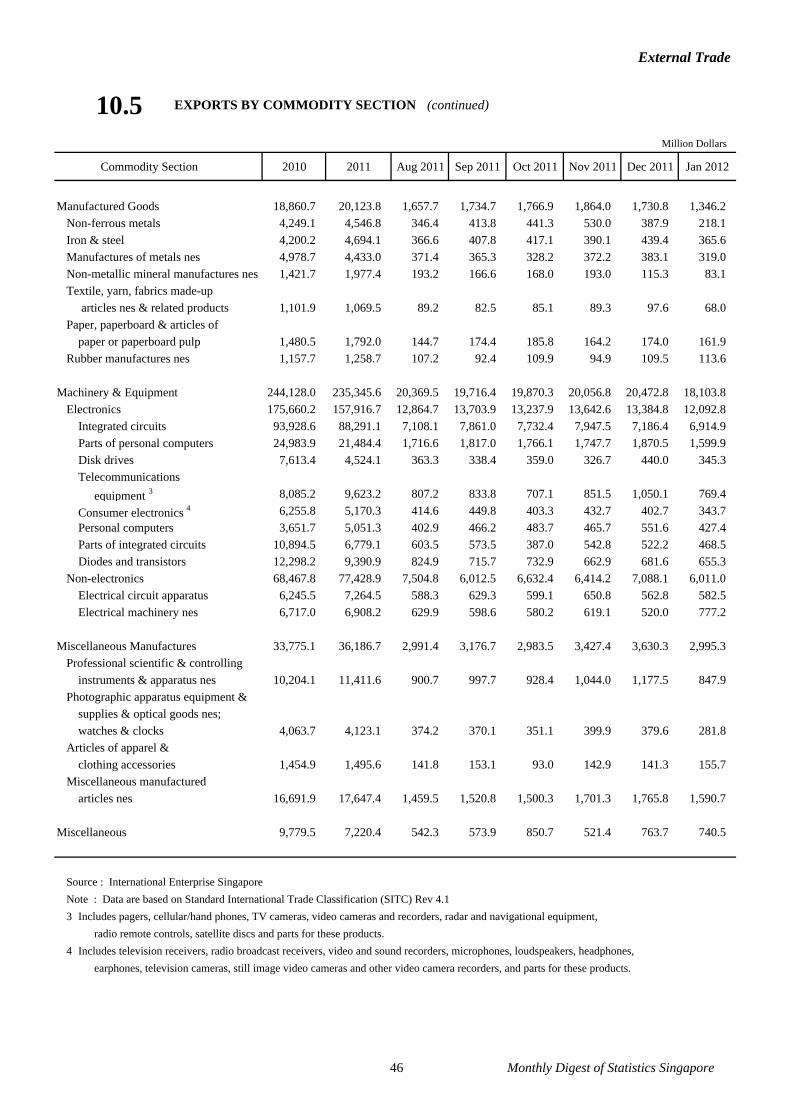
External Trade
10.5 EXPORTS BY COMMODITY SECTION (continued)
Commodity Section 2010 2011 Aug 2011 Sep 2011 Oct 2011 Nov 2011 Dec 2011 Jan 2012
Manufactured Goods 18,860.7 20,123.8 1,657.7 1,734.7 1,766.9 1,864.0 1,730.8 1,346.2 Non-ferrous metals 4,249.1 4,546.8 346.4 413.8 441.3 530.0 387.9 218.1 Iron & steel 4,200.2 4,694.1 366.6 407.8 417.1 390.1 439.4 365.6 Manufactures of metals nes 4,978.7 4,433.0 371.4 365.3 328.2 372.2 383.1 319.0 Non-metallic mineral manufactures nes 1,421.7 1,977.4 193.2 166.6 168.0 193.0 115.3 83.1 Textile, yarn, fabrics made-up
articles nes & related products 1,101.9 1,069.5 89.2 82.5 85.1 89.3 97.6 68.0 Paper, paperboard & articles of
paper or paperboard pulp 1,480.5 1,792.0 144.7 174.4 185.8 164.2 174.0 161.9 Rubber manufactures nes 1,157.7 1,258.7 107.2 92.4 109.9 94.9 109.5 113.6
Machinery & Equipment 244,128.0 235,345.6 20,369.5 19,716.4 19,870.3 20,056.8 20,472.8 18,103.8 Electronics 175,660.2 157,916.7 12,864.7 13,703.9 13,237.9 13,642.6 13,384.8 12,092.8
Integrated circuits 93,928.6 88,291.1 7,108.1 7,861.0 7,732.4 7,947.5 7,186.4 6,914.9 Parts of personal computers 24,983.9 21,484.4 1,716.6 1,817.0 1,766.1 1,747.7 1,870.5 1,599.9 Disk drives 7,613.4 4,524.1 363.3 338.4 359.0 326.7 440.0 345.3 Telecommunications
equipment 3 8,085.2 9,623.2 807.2 833.8 707.1 851.5 1,050.1 769.4 Consumer electronics 4 6,255.8 5,170.3 414.6 449.8 403.3 432.7 402.7 343.7 Personal computers 3,651.7 5,051.3 402.9 466.2 483.7 465.7 551.6 427.4 Parts of integrated circuits 10,894.5 6,779.1 603.5 573.5 387.0 542.8 522.2 468.5 Diodes and transistors 12,298.2 9,390.9 824.9 715.7 732.9 662.9 681.6 655.3
Non-electronics 68,467.8 77,428.9 7,504.8 6,012.5 6,632.4 6,414.2 7,088.1 6,011.0 Electrical circuit apparatus 6,245.5 7,264.5 588.3 629.3 599.1 650.8 562.8 582.5 Electrical machinery nes 6,717.0 6,908.2 629.9 598.6 580.2 619.1 520.0 777.2
Miscellaneous Manufactures 33,775.1 36,186.7 2,991.4 3,176.7 2,983.5 3,427.4 3,630.3 2,995.3 Professional scientific & controlling
instruments & apparatus nes 10,204.1 11,411.6 900.7 997.7 928.4 1,044.0 1,177.5 847.9 Photographic apparatus equipment &
supplies & optical goods nes;watches & clocks 4,063.7 4,123.1 374.2 370.1 351.1 399.9 379.6 281.8
Articles of apparel & clothing accessories 1,454.9 1,495.6 141.8 153.1 93.0 142.9 141.3 155.7
Miscellaneous manufactured articles nes 16,691.9 17,647.4 1,459.5 1,520.8 1,500.3 1,701.3 1,765.8 1,590.7
Miscellaneous 9,779.5 7,220.4 542.3 573.9 850.7 521.4 763.7 740.5
Source : International Enterprise Singapore Note : Data are based on Standard International Trade Classification (SITC) Rev 4.13 Includes pagers, cellular/hand phones, TV cameras, video cameras and recorders, radar and navigational equipment,
radio remote controls, satellite discs and parts for these products.4 Includes television receivers, radio broadcast receivers, video and sound recorders, microphones, loudspeakers, headphones,
earphones, television cameras, still image video cameras and other video camera recorders, and parts for these products.
Million Dollars
46 Monthly Digest of Statistics Singapore
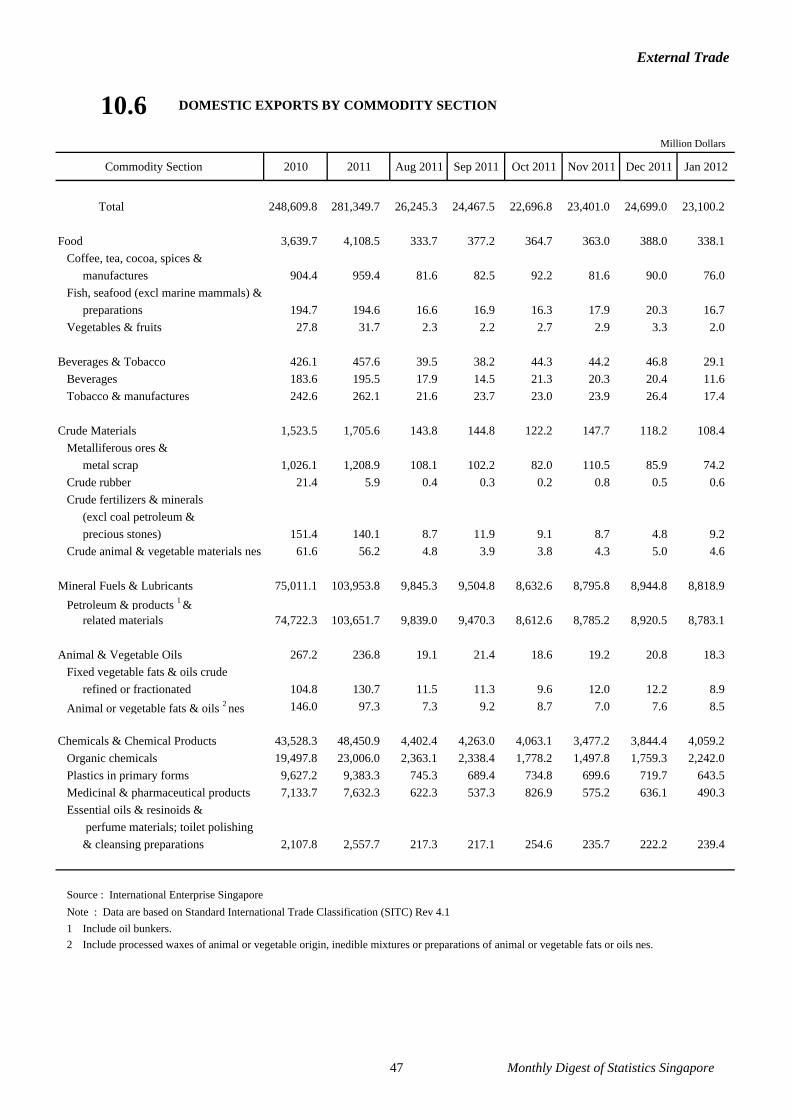
External Trade
10.6 DOMESTIC EXPORTS BY COMMODITY SECTION
Commodity Section 2010 2011 Aug 2011 Sep 2011 Oct 2011 Nov 2011 Dec 2011 Jan 2012
Total 248,609.8 281,349.7 26,245.3 24,467.5 22,696.8 23,401.0 24,699.0 23,100.2
Food 3,639.7 4,108.5 333.7 377.2 364.7 363.0 388.0 338.1 Coffee, tea, cocoa, spices &
manufactures 904.4 959.4 81.6 82.5 92.2 81.6 90.0 76.0 Fish, seafood (excl marine mammals) &
preparations 194.7 194.6 16.6 16.9 16.3 17.9 20.3 16.7 Vegetables & fruits 27.8 31.7 2.3 2.2 2.7 2.9 3.3 2.0
Beverages & Tobacco 426.1 457.6 39.5 38.2 44.3 44.2 46.8 29.1 Beverages 183.6 195.5 17.9 14.5 21.3 20.3 20.4 11.6 Tobacco & manufactures 242.6 262.1 21.6 23.7 23.0 23.9 26.4 17.4
Crude Materials 1,523.5 1,705.6 143.8 144.8 122.2 147.7 118.2 108.4 Metalliferous ores &
metal scrap 1,026.1 1,208.9 108.1 102.2 82.0 110.5 85.9 74.2 Crude rubber 21.4 5.9 0.4 0.3 0.2 0.8 0.5 0.6 Crude fertilizers & minerals
(excl coal petroleum & precious stones) 151.4 140.1 8.7 11.9 9.1 8.7 4.8 9.2
Crude animal & vegetable materials nes 61.6 56.2 4.8 3.9 3.8 4.3 5.0 4.6
Mineral Fuels & Lubricants 75,011.1 103,953.8 9,845.3 9,504.8 8,632.6 8,795.8 8,944.8 8,818.9 Petroleum & products 1 &
related materials 74,722.3 103,651.7 9,839.0 9,470.3 8,612.6 8,785.2 8,920.5 8,783.1
Animal & Vegetable Oils 267.2 236.8 19.1 21.4 18.6 19.2 20.8 18.3 Fixed vegetable fats & oils crude
refined or fractionated 104.8 130.7 11.5 11.3 9.6 12.0 12.2 8.9 Animal or vegetable fats & oils 2 nes 146.0 97.3 7.3 9.2 8.7 7.0 7.6 8.5
Chemicals & Chemical Products 43,528.3 48,450.9 4,402.4 4,263.0 4,063.1 3,477.2 3,844.4 4,059.2 Organic chemicals 19,497.8 23,006.0 2,363.1 2,338.4 1,778.2 1,497.8 1,759.3 2,242.0 Plastics in primary forms 9,627.2 9,383.3 745.3 689.4 734.8 699.6 719.7 643.5 Medicinal & pharmaceutical products 7,133.7 7,632.3 622.3 537.3 826.9 575.2 636.1 490.3 Essential oils & resinoids &
perfume materials; toilet polishing& cleansing preparations 2,107.8 2,557.7 217.3 217.1 254.6 235.7 222.2 239.4
Source : International Enterprise Singapore Note : Data are based on Standard International Trade Classification (SITC) Rev 4.11 Include oil bunkers.2 Include processed waxes of animal or vegetable origin, inedible mixtures or preparations of animal or vegetable fats or oils nes.
Million Dollars
47 Monthly Digest of Statistics Singapore

External Trade
10.6 DOMESTIC EXPORTS BY COMMODITY SECTION (continued)
Commodity Section 2010 2011 Aug 2011 Sep 2011 Oct 2011 Nov 2011 Dec 2011 Jan 2012
Manufactured Goods 7,027.7 6,932.1 602.7 599.1 559.5 537.8 536.9 463.7 Non-ferrous metals 1,097.7 1,059.9 85.6 87.5 63.6 85.9 69.2 62.4 Iron & steel 824.2 870.1 78.0 95.3 91.8 77.3 59.9 70.6 Manufactures of metals nes 2,557.2 2,005.5 177.7 166.0 135.8 151.5 190.8 146.6 Non-metallic mineral manufactures nes 646.8 1,121.9 111.7 98.6 113.2 67.2 52.1 41.6 Textile, yarn, fabrics made-up
articles nes & related products 362.7 331.4 25.1 31.4 25.6 26.0 26.6 20.9 Paper, paperboard & articles of
paper or paperboard pulp 1,092.3 1,070.8 85.2 85.1 92.2 90.3 103.9 95.9 Rubber manufactures nes 341.2 332.1 27.4 23.8 26.4 28.9 25.3 19.5
Machinery & Equipment 94,412.0 91,057.6 8,833.9 7,358.6 6,890.5 7,807.0 8,379.1 7,208.6 Electronics 64,685.5 56,135.0 4,861.8 4,989.3 4,436.1 5,103.2 4,911.5 4,413.6
Integrated circuits 26,872.2 25,434.9 2,236.9 2,422.6 2,057.4 2,569.7 2,153.5 2,147.4 Parts of personal computers 12,884.6 11,051.3 949.7 935.9 879.5 910.5 967.7 817.0 Disk drives 5,472.6 2,801.5 241.5 212.0 211.4 178.7 284.8 241.4 Telecommunications
equipment 3 1,665.3 1,932.1 137.4 169.0 159.5 207.6 242.2 218.1
Consumer electronics 4 1,786.1 1,258.7 95.9 103.6 85.7 125.4 103.1 80.4 Personal computers 1,657.7 2,338.0 174.7 197.2 230.7 164.9 258.5 157.1 Parts of integrated circuits 7,811.8 4,730.3 428.9 419.5 274.6 395.8 386.5 286.6 Diodes and transistors 3,558.4 3,777.6 366.2 300.1 289.5 275.8 260.9 266.2
Non-electronics 29,726.4 34,922.6 3,972.1 2,369.3 2,454.4 2,703.8 3,467.5 2,795.1 Electrical circuit apparatus 2,979.2 2,961.0 235.2 247.7 211.3 287.5 251.5 259.9 Electrical machinery nes 3,204.1 3,017.8 288.1 256.7 219.0 236.2 200.4 485.1
Miscellaneous Manufactures 19,498.7 21,322.0 1,768.3 1,922.4 1,735.1 1,937.8 2,169.3 1,771.7 Professional scientific & controlling
instruments & apparatus nes 5,889.5 6,803.6 550.6 593.8 530.7 586.1 689.9 512.3
Photographic apparatus equipment &supplies & optical goods nes;incl watches & clocks 1,513.3 1,498.4 130.3 137.3 127.4 133.2 130.4 94.3
Articles of apparel & clothing accessories 184.2 184.1 19.9 26.9 9.7 14.6 14.3 15.7
Miscellaneous manufactured articles nes 11,566.9 12,449.4 1,037.3 1,130.8 1,041.4 1,167.7 1,294.2 1,121.0
Miscellaneous 3,275.5 3,124.6 256.6 238.0 266.4 271.4 250.7 284.1
Source : International Enterprise Singapore Note : Data are based on Standard International Trade Classification (SITC) Rev 4.13 Includes pagers, cellular/hand phones, TV cameras, video cameras and recorders, radar and navigational equipment,
radio remote controls, satellite discs and parts for these products.4 Includes television receivers, radio broadcast receivers, video and sound recorders, microphones, loudspeakers, headphones,
earphones, television cameras, still image video cameras and other video camera recorders, and parts for these products.
Million Dollars
48 Monthly Digest of Statistics Singapore

External Trade
10.7 RE-EXPORTS BY COMMODITY SECTION
Commodity Section 2010 2011 Aug 2011 Sep 2011 Oct 2011 Nov 2011 Dec 2011 Jan 2012
Total 230,230.9 233,391.6 18,132.9 19,972.2 20,688.4 19,532.8 19,925.9 17,613.6
Food 1,815.6 2,554.6 195.5 343.0 252.5 195.4 199.2 134.1 Coffee, tea, cocoa, spices &
manufactures 418.0 946.1 69.6 178.5 115.5 50.4 59.5 45.8 Fish, seafood (excl marine mammals) &
preparations 308.0 310.6 15.8 50.2 23.7 29.4 27.3 15.0 Vegetables & fruits 279.9 364.8 33.5 25.9 30.3 31.5 35.3 24.4
Beverages & Tobacco 2,830.3 3,332.0 259.1 318.7 336.5 354.7 328.7 268.8 Beverages 2,282.6 2,718.2 214.6 265.0 284.5 298.0 269.3 219.4 Tobacco & manufactures 547.7 613.8 44.6 53.7 52.0 56.7 59.4 49.4
Crude Materials 1,296.4 1,609.6 142.8 150.3 118.5 108.7 135.6 78.4 Metalliferous ores &
metal scrap 93.6 85.6 4.6 4.7 4.6 2.8 4.6 4.0 Crude rubber 637.2 866.6 80.6 84.5 57.3 48.0 74.2 30.8 Crude fertilizers & minerals
(excl coal petroleum & precious stones) 152.1 232.6 21.3 20.1 21.8 17.1 21.7 13.3
Crude animal & vegetable materials nes 149.0 174.3 12.6 17.8 14.2 17.6 18.6 10.9
Mineral Fuels & Lubricants 28,499.9 32,819.7 2,062.3 2,601.4 2,241.3 2,082.1 2,512.2 2,371.4 Petroleum & products 1 &
related materials 28,497.8 32,818.3 2,062.2 2,601.2 2,241.2 2,082.1 2,512.1 2,371.3
Animal & Vegetable Oils 343.4 309.3 10.5 24.1 61.9 21.7 23.6 22.4 Fixed vegetable fats & oils crude
refined or fractionated 290.0 302.7 10.2 23.6 61.6 21.2 23.3 21.9 Animal or vegetable fats & oils 2 nes 51.4 3.0 0.2 0.3 0.0 0.1 0.0 0.2
Chemicals & Chemical Products 13,116.0 16,326.2 1,363.1 1,451.0 1,657.8 1,454.5 1,464.8 1,280.9 Organic chemicals 2,392.0 3,085.8 204.8 267.4 397.2 241.2 201.0 188.3 Plastics in primary forms 3,284.5 4,752.1 446.9 363.9 461.9 504.8 481.5 471.9 Medicinal & pharmaceutical products 1,198.4 1,215.2 81.3 126.2 118.3 112.6 86.4 91.9 Essential oils & resinoids &
perfume materials; toilet polishing& cleansing preparations 2,776.3 3,529.9 303.8 379.9 397.9 314.9 405.3 270.7
Source : International Enterprise Singapore Note : Data are based on Standard International Trade Classification (SITC) Rev 4.11 Include oil bunkers.2 Include processed waxes of animal or vegetable origin, inedible mixtures or preparations of animal or vegetable fats or oils nes.
Million Dollars
49 Monthly Digest of Statistics Singapore
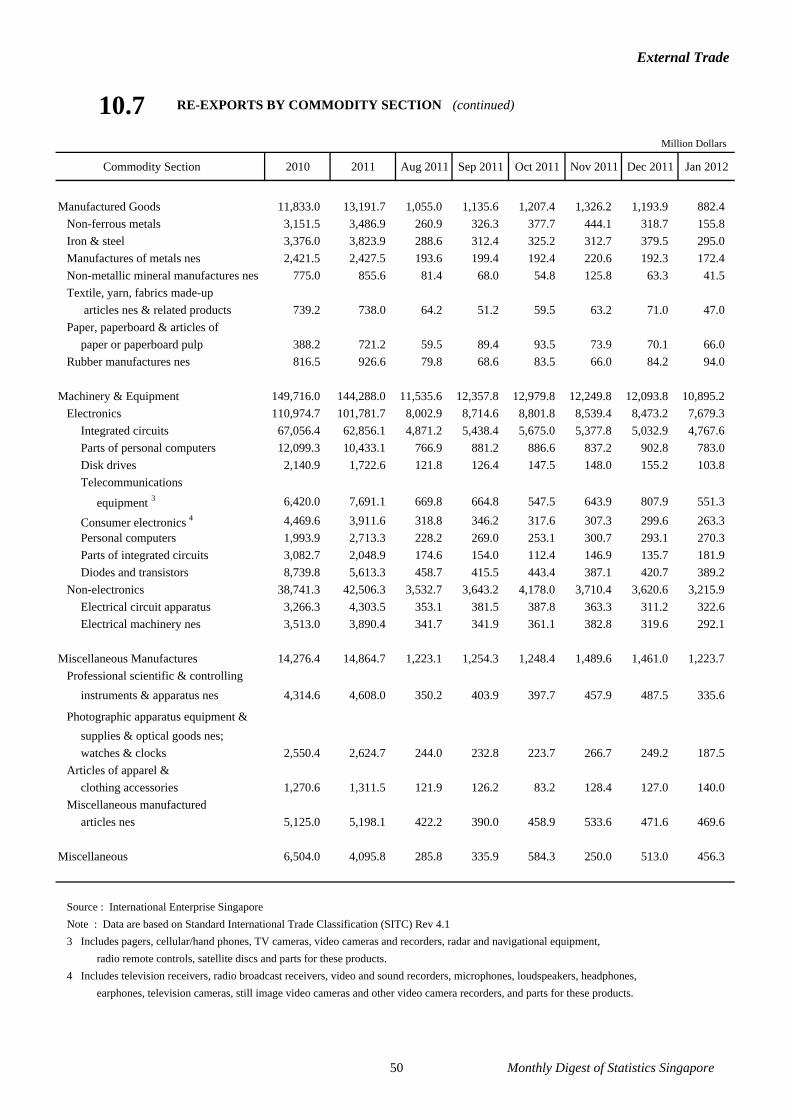
External Trade
10.7 RE-EXPORTS BY COMMODITY SECTION (continued)
Commodity Section 2010 2011 Aug 2011 Sep 2011 Oct 2011 Nov 2011 Dec 2011 Jan 2012
Manufactured Goods 11,833.0 13,191.7 1,055.0 1,135.6 1,207.4 1,326.2 1,193.9 882.4 Non-ferrous metals 3,151.5 3,486.9 260.9 326.3 377.7 444.1 318.7 155.8 Iron & steel 3,376.0 3,823.9 288.6 312.4 325.2 312.7 379.5 295.0 Manufactures of metals nes 2,421.5 2,427.5 193.6 199.4 192.4 220.6 192.3 172.4 Non-metallic mineral manufactures nes 775.0 855.6 81.4 68.0 54.8 125.8 63.3 41.5 Textile, yarn, fabrics made-up
articles nes & related products 739.2 738.0 64.2 51.2 59.5 63.2 71.0 47.0 Paper, paperboard & articles of
paper or paperboard pulp 388.2 721.2 59.5 89.4 93.5 73.9 70.1 66.0 Rubber manufactures nes 816.5 926.6 79.8 68.6 83.5 66.0 84.2 94.0
Machinery & Equipment 149,716.0 144,288.0 11,535.6 12,357.8 12,979.8 12,249.8 12,093.8 10,895.2 Electronics 110,974.7 101,781.7 8,002.9 8,714.6 8,801.8 8,539.4 8,473.2 7,679.3
Integrated circuits 67,056.4 62,856.1 4,871.2 5,438.4 5,675.0 5,377.8 5,032.9 4,767.6 Parts of personal computers 12,099.3 10,433.1 766.9 881.2 886.6 837.2 902.8 783.0 Disk drives 2,140.9 1,722.6 121.8 126.4 147.5 148.0 155.2 103.8 Telecommunications
equipment 3 6,420.0 7,691.1 669.8 664.8 547.5 643.9 807.9 551.3
Consumer electronics 4 4,469.6 3,911.6 318.8 346.2 317.6 307.3 299.6 263.3 Personal computers 1,993.9 2,713.3 228.2 269.0 253.1 300.7 293.1 270.3 Parts of integrated circuits 3,082.7 2,048.9 174.6 154.0 112.4 146.9 135.7 181.9 Diodes and transistors 8,739.8 5,613.3 458.7 415.5 443.4 387.1 420.7 389.2
Non-electronics 38,741.3 42,506.3 3,532.7 3,643.2 4,178.0 3,710.4 3,620.6 3,215.9 Electrical circuit apparatus 3,266.3 4,303.5 353.1 381.5 387.8 363.3 311.2 322.6 Electrical machinery nes 3,513.0 3,890.4 341.7 341.9 361.1 382.8 319.6 292.1
Miscellaneous Manufactures 14,276.4 14,864.7 1,223.1 1,254.3 1,248.4 1,489.6 1,461.0 1,223.7 Professional scientific & controlling
instruments & apparatus nes 4,314.6 4,608.0 350.2 403.9 397.7 457.9 487.5 335.6
Photographic apparatus equipment &supplies & optical goods nes;watches & clocks 2,550.4 2,624.7 244.0 232.8 223.7 266.7 249.2 187.5
Articles of apparel & clothing accessories 1,270.6 1,311.5 121.9 126.2 83.2 128.4 127.0 140.0
Miscellaneous manufactured articles nes 5,125.0 5,198.1 422.2 390.0 458.9 533.6 471.6 469.6
Miscellaneous 6,504.0 4,095.8 285.8 335.9 584.3 250.0 513.0 456.3
Source : International Enterprise Singapore Note : Data are based on Standard International Trade Classification (SITC) Rev 4.13 Includes pagers, cellular/hand phones, TV cameras, video cameras and recorders, radar and navigational equipment,
radio remote controls, satellite discs and parts for these products.4 Includes television receivers, radio broadcast receivers, video and sound recorders, microphones, loudspeakers, headphones,
earphones, television cameras, still image video cameras and other video camera recorders, and parts for these products.
Million Dollars
50 Monthly Digest of Statistics Singapore
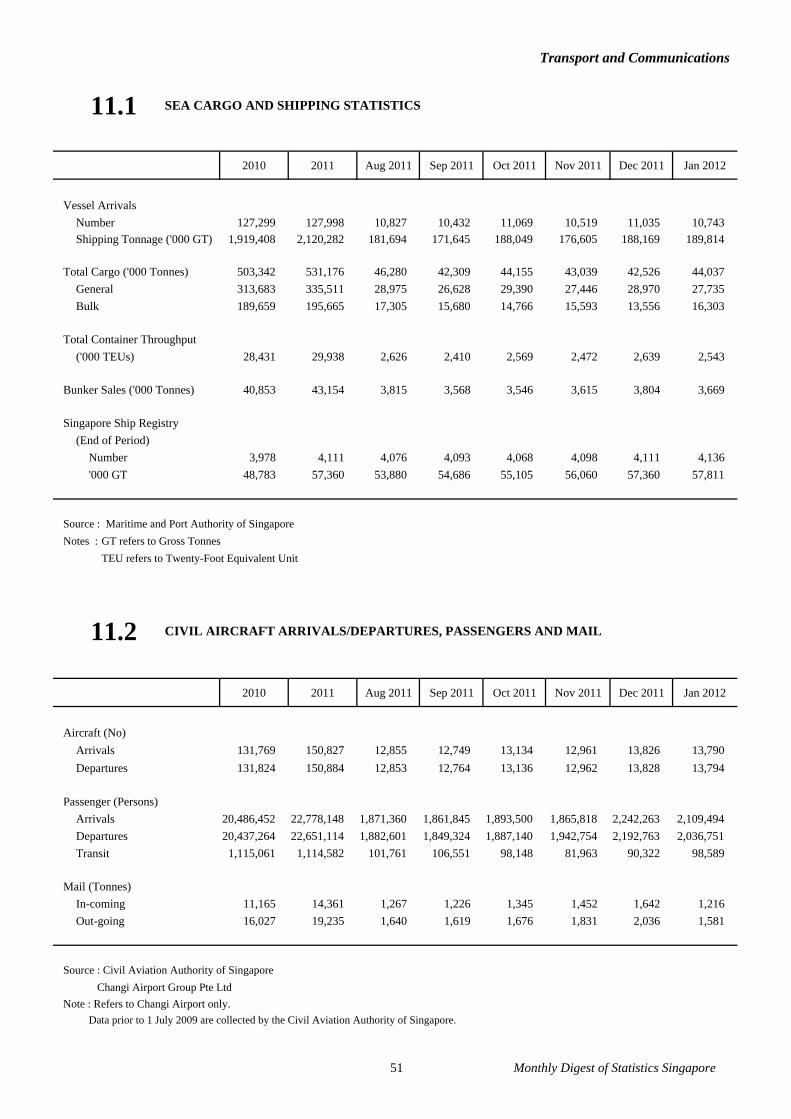
Transport and Communications
11.1 SEA CARGO AND SHIPPING STATISTICS
2010 2011 Aug 2011 Sep 2011 Oct 2011 Nov 2011 Dec 2011 Jan 2012
Vessel ArrivalsNumber 127,299 127,998 10,827 10,432 11,069 10,519 11,035 10,743 Shipping Tonnage ('000 GT) 1,919,408 2,120,282 181,694 171,645 188,049 176,605 188,169 189,814
Total Cargo ('000 Tonnes) 503,342 531,176 46,280 42,309 44,155 43,039 42,526 44,037 General 313,683 335,511 28,975 26,628 29,390 27,446 28,970 27,735 Bulk 189,659 195,665 17,305 15,680 14,766 15,593 13,556 16,303
Total Container Throughput ('000 TEUs) 28,431 29,938 2,626 2,410 2,569 2,472 2,639 2,543
Bunker Sales ('000 Tonnes) 40,853 43,154 3,815 3,568 3,546 3,615 3,804 3,669
Singapore Ship Registry (End of Period)
Number 3,978 4,111 4,076 4,093 4,068 4,098 4,111 4,136 '000 GT 48,783 57,360 53,880 54,686 55,105 56,060 57,360 57,811
Source : Maritime and Port Authority of Singapore Notes : GT refers to Gross Tonnes
TEU refers to Twenty-Foot Equivalent Unit
11.2 CIVIL AIRCRAFT ARRIVALS/DEPARTURES, PASSENGERS AND MAIL
2010 2011 Aug 2011 Sep 2011 Oct 2011 Nov 2011 Dec 2011 Jan 2012
Aircraft (No)Arrivals 131,769 150,827 12,855 12,749 13,134 12,961 13,826 13,790 Departures 131,824 150,884 12,853 12,764 13,136 12,962 13,828 13,794
Passenger (Persons)Arrivals 20,486,452 22,778,148 1,871,360 1,861,845 1,893,500 1,865,818 2,242,263 2,109,494 Departures 20,437,264 22,651,114 1,882,601 1,849,324 1,887,140 1,942,754 2,192,763 2,036,751 Transit 1,115,061 1,114,582 101,761 106,551 98,148 81,963 90,322 98,589
Mail (Tonnes)In-coming 11,165 14,361 1,267 1,226 1,345 1,452 1,642 1,216 Out-going 16,027 19,235 1,640 1,619 1,676 1,831 2,036 1,581
Source : Civil Aviation Authority of Singapore Changi Airport Group Pte Ltd
Note : Refers to Changi Airport only.Data prior to 1 July 2009 are collected by the Civil Aviation Authority of Singapore.
51 Monthly Digest of Statistics Singapore

Transport and Communications
11.3 AIR CARGO DISCHARGED BY REGION/COUNTRY OF ORIGIN
Tonnes
Region/Country 2010 2011 Aug 2011 Sep 2011 Oct 2011 Nov 2011 Dec 2011 Jan 2012
Total 941,403 983,110 81,566 81,046 86,053 84,790 88,164 71,971
South East Asia 160,634 162,933 12,986 13,219 14,367 13,278 16,247 13,275 Indonesia 59,368 63,787 4,522 4,601 6,209 6,400 7,856 5,513 Malaysia 18,412 17,529 1,638 1,652 1,596 1,161 1,296 1,096 Philippines 15,126 13,527 1,213 1,106 1,088 972 1,057 990 Thailand 49,963 52,470 4,225 4,398 3,944 3,410 4,611 4,546 Vietnam 14,584 12,904 1,164 1,183 1,206 1,090 1,175 890
North East Asia 435,604 455,946 38,297 37,457 39,260 39,624 39,698 31,582 China 126,636 140,730 12,152 12,164 12,723 13,106 12,311 10,142 Hong Kong 119,850 128,050 10,697 10,481 11,188 11,377 11,912 8,836 Japan 69,998 67,479 5,559 5,314 5,190 5,227 5,376 4,213
South Asia 60,784 64,206 5,553 5,528 5,546 5,162 5,230 5,035
Middle East 22,536 22,859 1,933 1,907 1,881 2,036 2,224 1,615
Oceania 83,365 83,869 6,517 6,484 7,268 7,939 9,048 7,469
Europe 147,350 158,544 12,870 13,219 14,545 14,272 13,219 10,746 France 8,949 9,714 796 808 745 739 805 614 Germany 20,627 25,349 1,867 1,892 2,254 3,170 2,587 2,095 United Kingdom 21,522 23,110 1,819 1,978 2,140 1,973 1,741 1,668
North America 27,106 30,467 3,041 2,910 2,784 2,162 2,054 1,866
Other Regions 4,024 4,285 369 321 403 317 444 383
Source : Civil Aviation Authority of Singapore Changi Airport Group Pte Ltd
Note : Refers to Changi Airport only. Data exclude passenger baggage, diplomatic cargo and aircraft stores.Data prior to 1 July 2009 are collected by the Civil Aviation Authority of Singapore.
52 Monthly Digest of Statistics Singapore

Transport and Communications
11.4 AIR CARGO LOADED BY REGION/COUNTRY OF DESTINATION
Tonnes
Region/Country 2010 2011 Aug 2011 Sep 2011 Oct 2011 Nov 2011 Dec 2011 Jan 2012
Total 872,406 882,142 71,554 73,313 77,061 75,416 78,443 64,872
South East Asia 186,976 183,053 14,204 14,827 15,083 16,495 17,271 13,812 Indonesia 62,726 67,358 5,173 5,396 5,649 6,253 6,659 5,005 Malaysia 31,494 28,977 2,239 2,319 2,089 2,379 2,356 2,035 Philippines 16,309 15,332 1,150 1,163 1,404 1,180 1,216 1,232 Thailand 50,213 48,082 3,691 4,150 4,007 4,808 5,159 4,156 Vietnam 20,987 17,752 1,407 1,296 1,378 1,489 1,448 1,041
North East Asia 283,049 296,887 23,353 24,345 24,885 23,942 27,798 22,858 China 84,084 87,420 7,008 7,410 7,124 6,842 7,251 6,423 Hong Kong 74,531 70,945 5,917 6,048 5,887 5,736 6,543 5,707 Japan 65,566 69,615 5,224 5,501 6,070 6,519 7,929 5,013
South Asia 76,527 74,211 5,804 6,034 6,122 5,560 6,193 5,407
Middle East 31,144 30,974 2,325 2,301 2,894 2,933 3,344 2,844
Oceania 107,074 115,393 11,255 10,866 11,622 10,818 9,643 7,582
Europe 134,549 131,523 10,688 11,126 11,918 11,309 10,500 9,139 France 9,549 8,910 733 756 795 709 669 698 Germany 28,855 26,845 2,044 1,944 2,229 2,559 2,502 2,293 United Kingdom 29,669 30,048 2,570 2,701 2,855 2,763 2,441 1,992
North America 42,209 37,682 2,786 2,732 3,181 2,871 2,676 2,416
Other Regions 10,878 12,419 1,138 1,081 1,357 1,487 1,018 814
Source : Civil Aviation Authority of Singapore Changi Airport Group Pte Ltd
Note : Refers to Changi Airport only. Data exclude passenger baggage, diplomatic cargo and aircraft stores.Data prior to 1 July 2009 are collected by the Civil Aviation Authority of Singapore.
53Monthly Digest of Statistics Singapore

Transport and Communications
11.5 AIR PASSENGER ARRIVALS BY REGION/COUNTRY OF EMBARKATION
Number
Region/Country 2010 2011 Aug 2011 Sep 2011 Oct 2011 Nov 2011 Dec 2011 Jan 2012
Total 20,486,452 22,778,148 1,871,360 1,861,845 1,893,500 1,865,818 2,242,263 2,109,494
South East Asia 8,811,792 10,036,909 839,117 791,431 826,752 779,906 935,310 906,529 Indonesia 2,761,475 3,153,549 278,479 247,205 261,947 259,268 305,269 266,279 Malaysia 2,212,056 2,412,185 201,388 186,612 191,546 206,764 231,270 204,541 Philippines 966,752 1,190,718 91,221 92,112 99,169 90,836 93,724 129,431 Thailand 1,727,449 2,038,476 169,074 169,659 176,231 116,675 182,567 184,385 Vietnam 724,838 797,218 65,336 62,374 61,959 66,010 75,187 78,072
North East Asia 4,962,172 5,630,941 472,330 473,452 463,679 491,809 586,790 542,664 China 1,679,061 1,854,692 149,828 159,043 157,669 156,774 183,972 194,666 Hong Kong 1,435,104 1,701,227 141,312 138,483 130,683 147,514 175,179 154,444 Japan 889,148 913,870 87,108 81,037 77,614 83,226 93,227 81,299
South Asia 1,710,999 1,857,916 140,454 144,152 155,424 158,316 188,344 187,432
Middle East 420,003 460,759 34,251 32,254 33,063 39,736 53,934 43,018
Oceania 2,286,788 2,411,290 184,326 206,378 188,400 206,871 260,191 214,456
Europe 1,866,350 1,961,008 171,223 181,655 190,769 156,848 176,488 174,804 France 235,953 231,442 19,523 21,063 21,763 18,263 20,111 19,955 Germany 394,426 407,694 35,406 37,287 39,783 35,267 36,865 39,119 United Kingdom 653,643 691,547 60,675 63,968 64,328 54,233 62,534 60,181
North America 294,725 308,425 21,887 22,888 24,570 23,783 29,539 30,821
Other Regions 133,623 110,900 7,772 9,635 10,843 8,549 11,667 9,770
Source : Civil Aviation Authority of Singapore Changi Airport Group Pte Ltd
Note : Refers to Changi Airport only. Data exclude transit passengers who continued their journey on the same flight.Data prior to 1 July 2009 are collected by the Civil Aviation Authority of Singapore.
54 Monthly Digest of Statistics Singapore

Transport and Communications
11.6 AIR PASSENGER DEPARTURES BY REGION/COUNTRY OF DISEMBARKATION
Number
Region/Country 2010 2011 Aug 2011 Sep 2011 Oct 2011 Nov 2011 Dec 2011 Jan 2012
Total 20,437,264 22,651,114 1,882,601 1,849,324 1,887,140 1,942,754 2,192,763 2,036,751
South East Asia 8,755,307 9,906,692 762,199 824,269 801,820 817,460 965,468 877,576 Indonesia 2,790,288 3,148,636 230,654 289,704 260,921 266,787 276,336 294,290 Malaysia 2,226,047 2,416,209 185,970 200,502 191,781 209,035 240,664 206,942 Philippines 934,112 1,156,379 82,771 81,475 90,723 99,640 127,557 90,763 Thailand 1,669,633 1,946,344 163,928 160,381 159,071 127,013 190,728 164,953 Vietnam 732,223 805,354 66,619 61,327 62,453 72,080 82,989 77,720
North East Asia 4,972,827 5,631,425 538,109 441,643 479,398 520,168 577,958 486,839 China 1,702,519 1,868,223 175,625 148,344 164,464 169,703 178,784 178,153 Hong Kong 1,413,649 1,691,244 166,382 123,102 134,834 154,968 174,456 137,370 Japan 893,770 905,517 89,855 79,762 78,441 84,001 91,537 79,220
South Asia 1,708,949 1,839,230 138,656 134,899 162,857 178,638 191,723 164,043
Middle East 412,018 448,069 34,510 38,500 33,732 39,523 44,158 45,512
Oceania 2,292,231 2,485,586 197,205 207,927 237,014 208,269 218,285 265,214
Europe 1,869,473 1,923,801 174,641 169,601 139,992 145,734 155,429 163,236 France 236,184 227,614 20,301 19,483 16,537 17,566 18,199 17,515 Germany 393,970 402,614 35,177 34,312 31,357 34,860 34,460 36,457 United Kingdom 647,369 657,951 57,431 59,467 43,920 45,329 50,271 56,593
North America 286,218 297,408 28,430 22,446 21,923 22,783 28,189 23,959
Other Regions 140,241 118,903 8,851 10,039 10,404 10,179 11,553 10,372
Source : Civil Aviation Authority of Singapore Changi Airport Group Pte Ltd
Note : Refers to Changi Airport only. Data exclude transit passengers who continued their journey on the same flight.Data prior to 1 July 2009 are collected by the Civil Aviation Authority of Singapore.
55 Monthly Digest of Statistics Singapore

Transport and Communications
11.7 MOTOR VEHICLE POPULATION BY TYPE OF VEHICLE
(End of Period) Number
Type of Vehicle 2010 2011 Aug 2011 Sep 2011 Oct 2011 Nov 2011 Dec 2011 Jan 2012
Total 945,829 956,704 950,198 952,009 953,819 955,183 956,704 957,863
Cars 1 584,399 592,361 587,281 588,710 589,985 591,119 592,361 593,555
Rental Cars 13,347 13,919 13,718 13,771 13,758 13,860 13,919 13,970
Taxis 26,073 27,051 26,756 26,845 26,970 27,018 27,051 27,059
Buses 16,309 17,046 16,824 16,892 16,991 17,040 17,046 17,037
Motorcycles & Scooters 148,160 146,559 147,122 146,935 146,868 146,627 146,559 146,388
Goods & Other Vehicles 157,541 159,768 158,497 158,856 159,247 159,519 159,768 159,854
Source : Land Transport Authority1 Includes private and company cars.
11.8 MOTOR VEHICLE POPULATION BY VEHICLE QUOTA CATEGORY 1
(End of Period) Number
Vehicle Quota Category 2010 2011 Aug 2011 Sep 2011 Oct 2011 Nov 2011 Dec 2011 Jan 2012
Total 945,829 956,704 950,198 952,009 953,819 955,183 956,704 957,863
Cars (1,600 cc & below) & Taxis 364,618 363,566 361,571 362,265 362,701 363,138 363,566 363,997
Cars (1,600 cc & below) 338,545 336,515 334,815 335,420 335,731 336,120 336,515 336,938
Taxis 26,073 27,051 26,756 26,845 26,970 27,018 27,051 27,059
Cars (above 1,600 cc) 256,655 267,221 263,676 264,556 265,496 266,337 267,221 268,043
Goods Vehicles & Buses 153,340 155,479 154,225 154,567 154,958 155,226 155,479 155,546
Motorcycles & Scooters 147,345 145,741 146,300 146,107 146,049 145,809 145,741 145,573
Others 2 23,871 24,697 24,426 24,514 24,615 24,673 24,697 24,704
Source : Land Transport Authority1 Includes weekend/off peak cars and tax exempted vehicles.2 Includes vehicles which are exempted from the Vehicle Quota System.
56 Monthly Digest of Statistics Singapore

Transport and Communications
11.9 NEW REGISTRATION OF MOTOR VEHICLES BY VEHICLE QUOTA CATEGORY 1
Number
Vehicle Quota Category 2010 2011 Aug 2011 Sep 2011 Oct 2011 Nov 2011 Dec 2011 Jan 2012
Total 61,018 47,855 3,480 3,882 3,774 3,689 3,852 3,486
Cars (1,600 cc & below) & Taxis 23,485 14,675 1,035 1,100 924 953 973 1,044
Cars (1,600 cc & below) 18,622 10,816 925 968 756 869 818 861
Taxis 4,863 3,859 110 132 168 84 155 183
Cars (above 1,600 cc) 23,043 17,095 1,092 1,335 1,416 1,417 1,439 1,324
Goods Vehicles & Buses 4,618 6,077 518 560 570 506 493 315
Motorcycles & Scooters 8,281 8,046 688 737 684 644 736 711
Others 2 1,591 1,962 147 150 180 169 211 92
Source : Land Transport Authority1 Includes weekend/off peak cars and tax exempted vehicles.2 Includes vehicles which are exempted from the Vehicle Quota System.
11.10 MOTOR VEHICLES DE-REGISTERED BY VEHICLE QUOTA CATEGORY 1
Number
Vehicle Quota Category 2010 2011 Aug 2011 Sep 2011 Oct 2011 Nov 2011 Dec 2011 Jan 2012
Total 40,707 36,980 5,503 2,071 1,964 2,325 2,331 2,327
Cars (1,600 cc & below) & Taxis 16,560 15,727 3,894 406 488 516 545 613
Cars (1,600 cc & below) 13,068 12,846 3,780 363 445 480 423 438
Taxis 3,492 2,881 114 43 43 36 122 175
Cars (above 1,600 cc) 10,394 6,529 498 455 476 576 555 502
Goods Vehicles & Buses 5,512 3,938 219 218 179 238 240 248
Motorcycles & Scooters 7,340 9,650 764 930 742 884 804 879
Others 2 901 1,136 128 62 79 111 187 85
Source : Land Transport Authority1 Includes weekend/off peak cars and tax exempted vehicles.2 Includes vehicles which are exempted from the Vehicle Quota System.
57 Monthly Digest of Statistics Singapore

Transport and Communications
11.11 MOTOR VEHICLE QUOTA, QUOTA PREMIUM
AND PREVAILING QUOTA PREMIUM
Dec 2011 Jan 2012 Feb 2012
1st Bidding 2nd Bidding 1st Bidding 2nd Bidding 1st Bidding 2nd Bidding
TotalQuota (No) 1,910 1,909 1,884 2,024 1,855 1,866 Successful Bids (No) 1,886 1,745 1,876 2,004 1,796 1,789 Bids Received (No) 2,529 2,680 2,733 2,900 2,937 2,861
Cars (1,600cc & below) & TaxisQuota (No) 549 566 554 657 619 624 Successful Bids (No) 543 457 554 652 571 607 Bids Received (No) 781 878 901 903 1,058 1,017 Quota Premium ($) 52,392 50,001 46,889 48,112 52,809 57,009 Prevailing Quota Premium ($) na 53,280 na 51,380 na 51,202
Cars (1,601cc & above) Quota (No) 354 368 356 353 350 351 Successful Bids (No) 351 368 356 351 346 348 Bids Received (No) 474 464 511 537 635 580 Quota Premium ($) 72,350 70,003 65,801 67,889 73,890 78,189 Prevailing Quota Premium ($) na 72,697 na 71,731 na 71,354
Goods Vehicles & BusesQuota (No) 242 249 242 241 162 164 Successful Bids (No) 242 249 239 236 158 149 Bids Received (No) 334 361 357 405 307 248 Quota Premium ($) 40,009 39,589 38,699 44,001 49,801 52,004 Prevailing Quota Premium ($) na 38,401 na 40,549 na 44,018
MotorcyclesQuota (No) 416 392 388 393 412 413 Successful Bids (No) 415 386 386 390 409 389 Bids Received (No) 451 456 434 517 512 509 Quota Premium ($) 1,902 1,481 1,682 1,552 1,802 2,012 Prevailing Quota Premium ($) na 1,909 na 1,753 na 1,739
Open Category Quota (No) 349 334 344 380 312 314 Successful Bids (No) 335 285 341 375 312 296 Bids Received (No) 489 521 530 538 425 507 Quota Premium ($) 74,340 71,000 65,700 67,101 73,801 78,000
Source : Land Transport AuthorityNote : 1. Under the Open Bidding System, two tender exercises would be held each month on alternate fortnights:
i) The first exercise will usually start on the first Monday of the month at 9.00am and end two days later on Wednesday at 4.00pm;
ii) The second exercise will usually start on the third Monday of the month at 9.00am and end two days later on Wednesday at 4.00pm.
If a public holiday falls within the three-day bidding exercise, the bidding period would be extended accordingly. 2. Prevailing quota premium (PQP) for existing vehicles is a moving average of the quota premiums over the last 3 months.
Month of Bidding Exercise
57 Monthly Digest of Statistics Singapore

Transport and Communications
11.12 ROAD CASUALTIES
Number
2010 2011 Aug 2011 Sep 2011 Oct 2011 Nov 2011 Dec 2011 Jan 2012P
Total CasualtiesFatalities 193 197 19 15 19 12 13 17 Injured 11,065 9,752 816 765 788 710 761 714
PedestriansFatalities 55 49 7 5 3 5 3 4 Injured 1,052 988 88 72 79 76 71 62
Cyclists & Pillions 1
Fatalities 16 15 2 3 1 1 - 4 Injured 557 485 47 34 45 27 26 30
Motor Cyclists & Pillion RidersFatalities 89 99 9 6 9 4 5 8 Injured 5,397 4,635 389 366 340 351 342 330
Motor Vehicle Drivers & PassengersCars & Station Wagons
Fatalities 14 16 - - 3 - 3 -Injured 2,647 2,634 216 220 241 177 234 201
Goods Vehicles 2 & BusesFatalities 14 18 1 1 3 2 2 1 Injured 1,296 909 61 58 69 74 80 83
OthersFatalities 5 - - - - - - -Injured 116 101 15 15 14 5 8 8
Source : Traffic Police Department1 Includes those using power assisted bicycles.2 Comprises Goods Van, Pick-up, Lorry, Tipper Truck and Trailer only.
59 Monthly Digest of Statistics Singapore

Transport and Communications
11.13 POSTAL ARTICLES HANDLED AND TELECOMMUNICATIONS
2010 2011 Jul 2011 Aug 2011 Sep 2011 Oct 2011 Nov 2011 Dec 2011
Postal Articles Handled (million) 2,009.1 2,085.5 165.4 169.2 167.7 159.7 186.1 182.2
Subscriptions 1 ('000)
Fixed Line 2 1,983.9 2,016.9 na na 2,017.4 na na 2,016.9 Residential 1,203.1 1,237.1 na na 1,240.2 na na 1,237.1
Corporate 780.8 779.7 na na 777.2 na na 779.7
Mobile Phone 7,288.6 7,755.2 7,589.6 7,626.8 7,667.5 7,697.9 7,718.0 7,755.2 2G
Post-paid 289.8 204.5 235.5 233.1 226.6 218.4 211.2 204.5 Pre-paid 2,294.4 1,795.3 1,967.4 1,928.9 1,891.8 1,857.0 1,822.0 1,795.3
3G 3 4,704.5 5,755.4 5,386.7 5,464.8 5,549.1 5,622.4 5,684.8 5,755.4
Post-paid 3,472.7 3,825.3 3,697.9 3,719.3 3,741.3 3,763.4 3,796.4 3,825.3
Pre-paid 1,231.8 1,930.1 1,688.8 1,745.5 1,807.8 1,859.0 1,888.4 1,930.1
Dial-up Internet 4 67.5 58.3 62.2 61.0 60.3 59.5 58.9 58.3
Broadband 5 7,849.3 9,222.1 8,745.0 8,851.7 8,960.0 9,048.2 9,133.3 9,222.1
Residential Wired 6 na 1,237.9 1,221.5 1,228.5 1,231.7 1,232.4 1,235.3 1,237.9 Corporate Wired 7 na 85.3 82.9 83.3 83.7 84.5 85.2 85.3 Wireless 8 6,587.2 7,898.9 7,440.6 7,539.9 7,644.6 7,731.3 7,812.8 7,898.9
International Telephone
Call Minutes 9 (million) 12,436.3 12,342.4 1,013.1 1,043.2 1,013.6 1,049.2 1,008.1 1,125.0
Source : Singapore Post Infocomm Development Authority of Singapore
1 Figures refer to end of period.2 Data are updated on a quarterly basis, in March, June, September and December. 3 Prior to November 2009, 3G subscription data comprise the sum of prepaid and postpaid 3G subscriptions.
Data breakdown for prepaid and postpaid 3G subscriptions are available with effect from December 2009.4 Data cover paid Internet access subscriptions only.5 Includes retail xDSL, cable modems, leased line Internet, 3G, 3.5G/HSDPA, WiMAX or its equivalent
and Wi-Fi hotspots access (including Wireless@SG subscriptions).6 Includes all retail residential wired broadband subscriptions provided over xDSL, cable modems, leased line and optical fibre.
Residential wireless broadband subscriptions are excluded.7 Includes all retail corporate wired broadband subscriptions provided over xDSL, cable modems, leased line and optical fibre.
Corporate wireless broadband subscriptions are excluded.8 Includes all retail broadband Internet access subscriptions provided via wireless platforms such as 3G, 3.5G/HSDPA, WiMAX
or its equivalent and Wi-Fi hotspots (including Wireless@SG subscriptions).9 Includes all Service-Based Operators.
60 Monthly Digest of Statistics Singapore
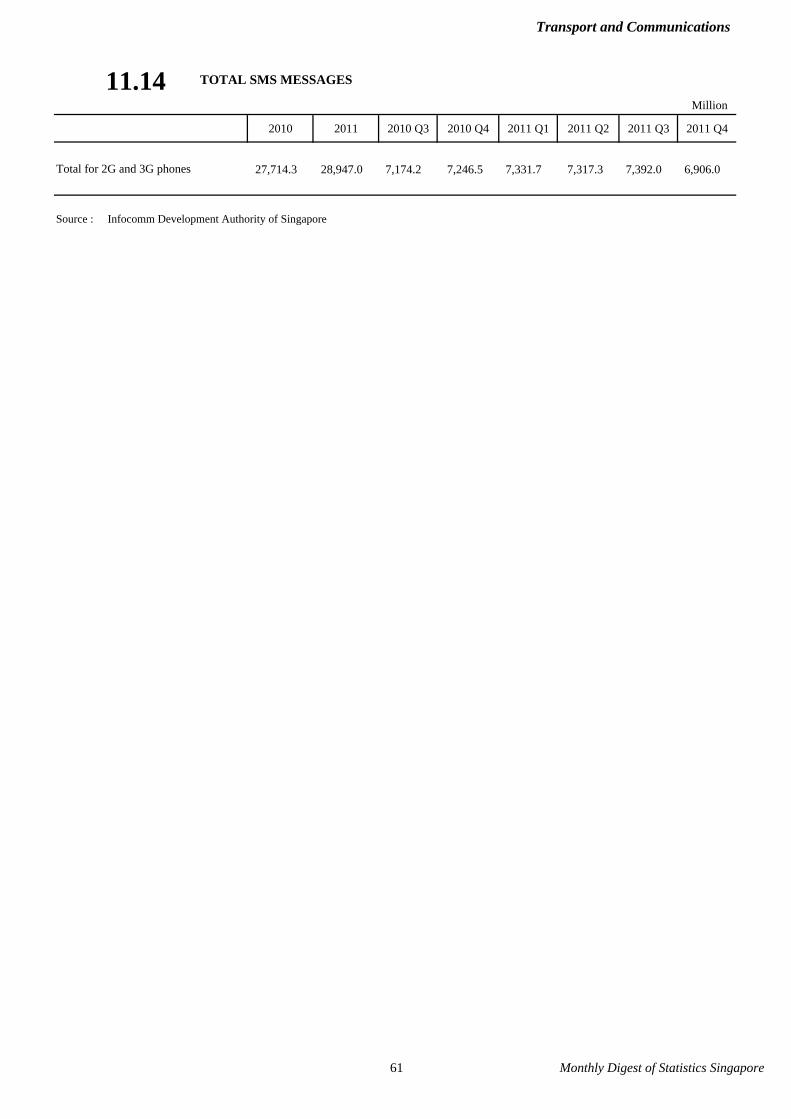
Transport and Communications
TOTAL SMS MESSAGES
Million
2010 2011 2010 Q3 2010 Q4 2011 Q1 2011 Q2 2011 Q3 2011 Q4
27,714.3 28,947.0 7,174.2 7,246.5 7,331.7 7,317.3 7,392.0 6,906.0
Source : Infocomm Development Authority of Singapore
11.14
Total for 2G and 3G phones
61 Monthly Digest of Statistics Singapore

Tourism
12.1 INTERNATIONAL VISITOR ARRIVALS BY REGION/COUNTRY OF RESIDENCE
Number
Region/Country 2010 2011 Jul 2011 Aug 2011 Sep 2011 Oct 2011 Nov 2011 Dec 2011
Total 11,641,700 13,169,720 1,273,870 1,178,458 1,033,728 1,084,873 1,027,375 1,216,036
Americas 524,846 563,680 53,651 43,227 37,353 47,919 48,140 47,508 Canada 75,142 82,925 7,098 6,398 4,554 6,814 7,842 7,606 United States 417,195 440,525 43,187 34,221 29,820 36,830 36,686 36,402
Asia 8,678,618 10,037,690 986,819 921,111 788,937 817,584 763,330 933,921
ASEAN 1 4,821,753 5,413,065 497,719 449,281 450,723 437,151 414,536 560,082 China 1,171,493 1,577,420 183,862 183,890 104,211 133,545 100,816 113,323 Hong Kong 387,579 464,362 56,960 49,034 31,113 31,027 31,538 36,197 India 828,994 868,962 71,209 60,926 58,309 77,192 72,382 78,419 Japan 528,951 656,360 55,479 72,034 62,395 57,675 61,261 62,565 Korea, Republic of 360,703 414,865 40,587 44,364 30,112 33,592 33,143 29,596 Pakistan 21,927 20,927 3,568 1,154 1,319 1,574 1,485 1,850 Saudi Arabia 12,633 17,041 3,696 1,056 1,545 1,142 1,907 1,167 Sri Lanka 78,973 83,989 7,585 7,586 6,394 6,469 6,559 11,386 Taiwan 191,186 238,474 33,454 26,574 19,057 17,774 15,862 15,143 United Arab Emirates 56,476 62,734 9,149 6,637 4,660 3,709 6,958 5,856
Europe 1,373,528 1,401,452 113,846 124,285 104,484 117,701 130,133 128,355 Austria 20,093 19,887 1,779 1,913 1,582 1,716 1,901 1,628 Belgium & Luxembourg 24,399 24,978 2,683 2,464 1,819 2,221 2,181 2,025 France 130,461 140,294 13,943 17,520 10,434 11,202 11,165 12,048 Germany 209,263 219,948 15,675 18,141 17,400 18,938 22,487 21,446 Greece 8,006 7,130 555 648 494 578 591 767 Italy 51,086 53,517 4,151 8,242 3,867 3,765 4,718 4,872 Netherlands 76,520 81,089 9,682 8,909 6,318 7,112 6,532 6,167
Scandinavia 2 96,484 97,008 8,720 5,226 5,524 8,135 9,597 10,259 Switzerland 74,376 79,021 7,318 6,090 5,725 7,595 7,767 6,686 United Kingdom 461,769 442,600 30,659 34,967 33,956 36,358 39,073 37,052
CIS 3 & Eastern Europe 119,746 127,921 9,216 9,100 9,089 10,647 13,027 14,206
Oceania 989,115 1,093,378 112,000 84,622 96,987 95,616 80,350 96,602 Australia 880,558 956,007 94,690 71,953 86,076 84,503 70,008 84,702 New Zealand 95,790 122,990 15,973 11,612 9,698 9,875 8,887 10,511
Others 75,593 73,520 7,554 5,213 5,967 6,053 5,422 9,650 Africa 75,540 73,385 7,462 5,213 5,942 6,051 5,421 9,644
Source : Singapore Tourism BoardNote : Data for visitor arrivals are compiled from Disembarkation/Embarkation Forms (IMM 23A) completed by all visitors
arriving in Singapore at the points of entry. Exclude arrivals of Malaysians by land.1 ASEAN comprises Brunei Darussalam, Cambodia, Indonesia, Laos, Malaysia, Myanmar, Philippines, Singapore,
Thailand and Vietnam. However, when used in this statistical table, the term excludes Singapore.2 Scandinavia comprises Denmark, Norway and Sweden.3 CIS denotes The Commonwealth of Independent States comprising Armenia, Azerbaijan, Belarus, Georgia, Kazakhstan,
Kyrgyzstan, Republic of Moldova, Russian Federation, Tajikistan, Turkmenistan, Ukraine and Uzbekistan.
62 Monthly Digest of Statistics Singapore

Tourism
12.2 INTERNATIONAL VISITOR ARRIVALS BY a) SEX AND b) AGE GROUP
Number
2010 2011 Jul 2011 Aug 2011 Sep 2011 Oct 2011 Nov 2011 Dec 2011
Total 1 11,641,700 13,169,720 1,273,870 1,178,458 1,033,728 1,084,873 1,027,375 1,216,036
Sex
Males 6,029,079 6,743,187 630,411 583,038 541,353 561,163 544,172 605,239
Females 5,131,004 5,919,233 592,837 548,735 451,001 479,785 442,259 559,565
Age Group (Years)
Under 15 970,336 1,131,131 153,479 132,736 65,425 73,625 58,436 140,229
15 - 19 412,470 480,242 68,919 54,013 26,520 33,361 29,892 60,568
20 - 24 813,671 915,632 98,949 92,870 77,793 70,436 68,270 92,365
25 - 34 2,645,301 3,003,810 268,765 262,079 264,879 256,351 248,522 268,118
35 - 44 2,538,795 2,855,400 276,060 258,259 224,219 235,799 226,256 246,911
45 - 54 2,082,793 2,320,132 216,850 197,835 185,556 198,819 188,210 200,459
55 - 64 1,415,948 1,598,035 127,939 119,840 128,598 143,070 135,143 134,204
65 & Over 736,906 838,524 60,193 58,372 58,583 71,189 70,724 71,062
Not Stated 25,481 26,815 2,716 2,454 2,155 2,223 1,922 2,120
Source : Singapore Tourism BoardNote : Data for visitor arrivals are compiled from Disembarkation/Embarkation Forms (IMM 23A) completed by all visitors
arriving in Singapore at the points of entry. Exclude arrivals of Malaysians by land.1 Includes sex not stated.
63 Monthly Digest of Statistics Singapore

Tourism
12.3 INTERNATIONAL VISITOR ARRIVALS BY LENGTH OF STAY
Length of Stay (Days) 2010 2011 Jul 2011 Aug 2011 Sep 2011 Oct 2011 Nov 2011 Dec 2011
Total 11,126.9 12,643.2 1,231.7 1,116.8 1,019.3 1,045.8 996.3 1,081.8
Under 1 2,480.5 2,780.7 248.8 248.2 229.8 235.1 227.4 251.9 1 2,188.4 2,463.7 228.3 224.7 189.9 211.8 189.2 204.8 2 1,961.1 2,225.5 214.5 184.3 180.1 194.1 187.9 182.5 3 1,636.2 1,954.7 199.9 171.6 156.0 155.0 152.5 165.8 4 874.5 1,044.9 114.6 95.0 85.7 81.1 76.1 91.2 5 469.8 535.0 57.0 46.3 44.5 41.6 39.9 47.6 6 289.1 321.5 35.0 26.3 26.4 25.6 23.9 28.7 7 204.3 226.7 25.3 19.6 19.7 17.8 17.0 19.6
8 - 10 285.3 315.3 33.9 26.9 26.7 23.8 23.6 27.0 11 - 14 204.7 220.1 23.9 20.3 17.2 16.9 16.4 18.0 15 & Over 533.1 555.1 50.5 53.7 43.4 43.1 42.4 44.8
Source : Singapore Tourism BoardNote : Data for visitor arrivals are compiled from Disembarkation/Embarkation Forms (IMM 23A) completed by all visitors
arriving in Singapore at the points of entry. Exclude arrivals of Malaysians by land. Refers to visitors who left Singapore during the period specified.
12.4 OUTBOUND DEPARTURES OF SINGAPORE RESIDENTS
BY MODE OF TRANSPORT Number
2010 2011 Jul 2011 Aug 2011 Sep 2011 Oct 2011 Nov 2011 Dec 2011
Total 7,342,276 7,752,926 592,057 537,969 624,327 615,413 739,630 930,172
Air 5,617,110 6,082,620 447,246 424,227 496,243 486,524 598,638 748,441
Sea 1,725,166 1,670,306 144,811 113,742 128,084 128,889 140,992 181,731
Source : Immigration & Checkpoints Authority
Thousand
64 Monthly Digest of Statistics Singapore

Tourism
12.5 GAZETTED HOTEL STATISTICS
Unit 2010 2011 Jul 2011 Aug 2011 Sep 2011 Oct 2011 Nov 2011 Dec 2011
Available Room Nights 1 '000 10,990.2 12,239.0 1,040.6 1,019.7 984.6 994.4 967.0 988.8
Standard Average Occupancy Rate 2 % 85.1 86.4 93.6 84.8 86.7 87.3 89.8 84.0
Standard Average Room Rate 3 $ 217.0 245.0 244.6 239.7 271.3 252.2 254.4 250.5
Room Revenue $m 2,030.3 2,594.3 238.3 207.3 231.7 219.1 221.0 208.2
Food and Beverage Revenue $m 1,018.5 1,275.0 105.9 87.4 130.0 113.8 122.5 112.9
Source : Singapore Tourism Board1 Refers to room-nights available for occupancy. Excludes rooms closed for renovations and staff use as declared by the hotels.2 Refers to gross lettings (room nights) divided by available room-nights. 3 Refers to total room revenue divided by gross lettings.
65 Monthly Digest of Statistics Singapore

Finance
13.1 CURRENCY IN CIRCULATION
(End of Period)
2010 2011 Aug 2011 Sep 2011 Oct 2011 Nov 2011 Dec 2011 Jan 2012
Gross Circulation ($m) 25,772.8 28,180.1 28,180.1 28,180.1 28,180.1 28,180.1 28,180.1 30,126.1
Notes 24,585.4 26,941.7 26,958.3 26,953.3 26,950.4 26,947.4 26,941.7 28,882.8
Coins 1,187.4 1,238.4 1,221.8 1,226.8 1,229.7 1,232.7 1,238.4 1,243.3
Source : Monetary Authority of Singapore
13.2 MONEY SUPPLY
(End of Period)
2010 2011 Aug 2011 Sep 2011 Oct 2011 Nov 2011 Dec 2011 Jan 2012
Money Supply (M1) 112,465.5 129,118.9 126,538.2 128,118.8 129,202.4 130,772.7 129,118.9 130,419.1
Currency in Active Circulation 1 22,299.5 24,690.3 23,632.0 23,664.6 23,939.0 24,080.2 24,690.3 25,724.2 Demand Deposits of
Private Sector 90,166.0 104,428.6 102,906.2 104,454.2 105,263.4 106,692.5 104,428.6 104,694.9
Money Supply (M2) 403,078.2 443,352.8 431,253.4 434,818.4 439,817.4 442,144.4 443,352.8 446,484.1 M1 112,465.5 129,118.9 126,538.2 128,118.8 129,202.4 130,772.7 129,118.9 130,419.1 Quasi-Money 290,612.7 314,233.9 304,715.2 306,699.6 310,615.0 311,371.7 314,233.9 316,065.0
Fixed Deposits 154,420.9 160,704.5 159,357.4 159,422.3 161,845.3 161,730.1 160,704.5 161,696.4 S$ Negotiable Certificates
of Deposit 20.0 165.0 165.0 165.0 165.0 165.0 165.0 170.0 Savings & Other Deposits 136,171.8 153,364.4 145,192.8 147,112.3 148,604.7 149,476.6 153,364.4 154,198.6
Money Supply (M3) 410,091.4 451,661.0 438,692.5 442,633.7 447,856.1 450,296.8 451,661.0 455,057.0 M2 403,078.2 443,352.8 431,253.4 434,818.4 439,817.4 442,144.4 443,352.8 446,484.1 Net Deposits with Non-bank
Financial Institutions Finance Companies 7,013.2 8,308.2 7,439.1 7,815.3 8,038.7 8,152.4 8,308.2 8,572.9
Source : Monetary Authority of Singapore (MAS) 1 Refers to gross circulation less amounts held by government treasuries and banks, and excludes
numismatics currency and bullion coins issued by MAS.
Million Dollars
66 Monthly Digest of Statistics Singapore
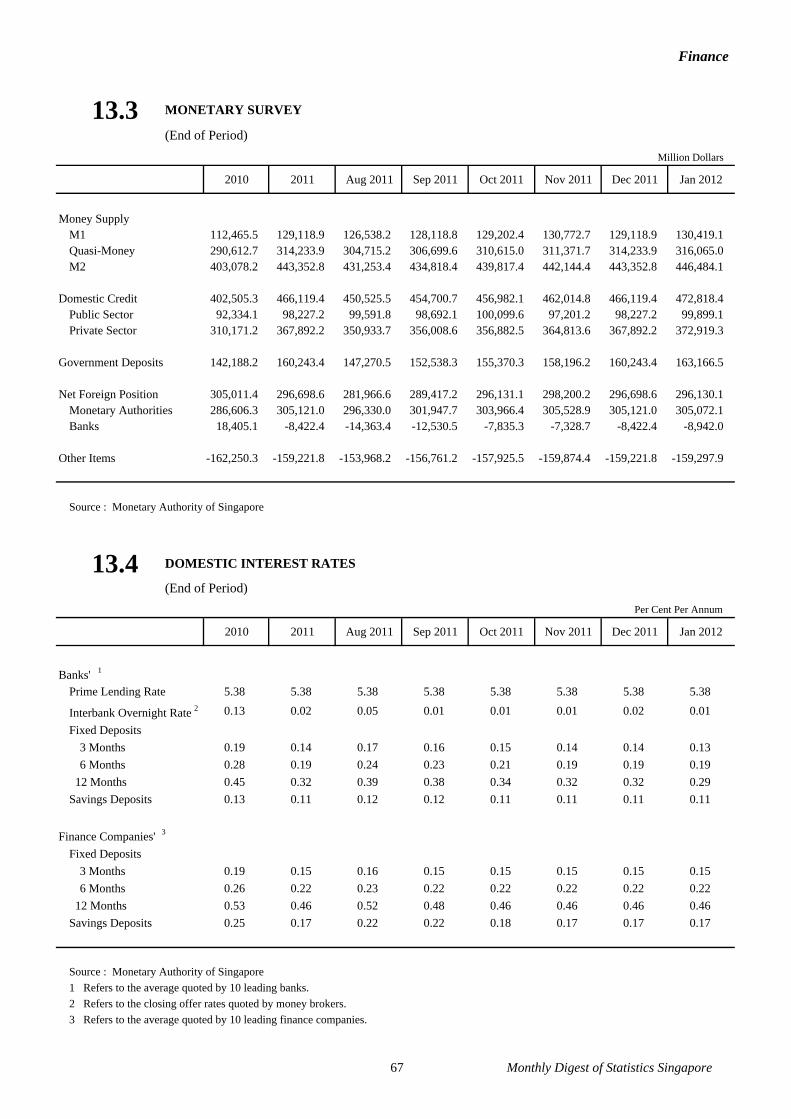
Finance
13.3 MONETARY SURVEY
(End of Period)
2010 2011 Aug 2011 Sep 2011 Oct 2011 Nov 2011 Dec 2011 Jan 2012
Money Supply M1 112,465.5 129,118.9 126,538.2 128,118.8 129,202.4 130,772.7 129,118.9 130,419.1 Quasi-Money 290,612.7 314,233.9 304,715.2 306,699.6 310,615.0 311,371.7 314,233.9 316,065.0 M2 403,078.2 443,352.8 431,253.4 434,818.4 439,817.4 442,144.4 443,352.8 446,484.1
Domestic Credit 402,505.3 466,119.4 450,525.5 454,700.7 456,982.1 462,014.8 466,119.4 472,818.4 Public Sector 92,334.1 98,227.2 99,591.8 98,692.1 100,099.6 97,201.2 98,227.2 99,899.1 Private Sector 310,171.2 367,892.2 350,933.7 356,008.6 356,882.5 364,813.6 367,892.2 372,919.3
Government Deposits 142,188.2 160,243.4 147,270.5 152,538.3 155,370.3 158,196.2 160,243.4 163,166.5
Net Foreign Position 305,011.4 296,698.6 281,966.6 289,417.2 296,131.1 298,200.2 296,698.6 296,130.1 Monetary Authorities 286,606.3 305,121.0 296,330.0 301,947.7 303,966.4 305,528.9 305,121.0 305,072.1 Banks 18,405.1 -8,422.4 -14,363.4 -12,530.5 -7,835.3 -7,328.7 -8,422.4 -8,942.0
Other Items -162,250.3 -159,221.8 -153,968.2 -156,761.2 -157,925.5 -159,874.4 -159,221.8 -159,297.9
Source : Monetary Authority of Singapore
13.4 DOMESTIC INTEREST RATES
(End of Period)
2010 2011 Aug 2011 Sep 2011 Oct 2011 Nov 2011 Dec 2011 Jan 2012
Banks' 1
Prime Lending Rate 5.38 5.38 5.38 5.38 5.38 5.38 5.38 5.38
Interbank Overnight Rate 2 0.13 0.02 0.05 0.01 0.01 0.01 0.02 0.01 Fixed Deposits
3 Months 0.19 0.14 0.17 0.16 0.15 0.14 0.14 0.13 6 Months 0.28 0.19 0.24 0.23 0.21 0.19 0.19 0.19
12 Months 0.45 0.32 0.39 0.38 0.34 0.32 0.32 0.29 Savings Deposits 0.13 0.11 0.12 0.12 0.11 0.11 0.11 0.11
Finance Companies' 3
Fixed Deposits 3 Months 0.19 0.15 0.16 0.15 0.15 0.15 0.15 0.15 6 Months 0.26 0.22 0.23 0.22 0.22 0.22 0.22 0.22
12 Months 0.53 0.46 0.52 0.48 0.46 0.46 0.46 0.46 Savings Deposits 0.25 0.17 0.22 0.22 0.18 0.17 0.17 0.17
Source : Monetary Authority of Singapore1 Refers to the average quoted by 10 leading banks.2 Refers to the closing offer rates quoted by money brokers.3 Refers to the average quoted by 10 leading finance companies.
Million Dollars
Per Cent Per Annum
67 Monthly Digest of Statistics Singapore

Finance
13.5 EXCHANGE RATES
2010 2011 Aug 2011 Sep 2011 Oct 2011 Nov 2011 Dec 2011 Jan 2012
S$ Per Unit of:
Australian Dollar 1.2524 1.2971 1.2716 1.2800 1.2904 1.3015 1.3104 1.3302 Chinese Renminbi 0.2014 0.1946 0.1887 0.1957 0.2008 0.2029 0.2040 0.2028 Euro 1.8095 1.7495 1.7325 1.7221 1.7500 1.7486 1.7069 1.6514 Hong Kong Dollar 0.1755 0.1616 0.1550 0.1604 0.1644 0.1657 0.1666 0.1649 Malaysian Ringgit 0.4234 0.4111 0.4052 0.4059 0.4073 0.4087 0.4097 0.4113 Pound Sterling 2.1073 2.0161 1.9780 1.9745 2.0110 2.0378 2.0201 1.9854 US Dollar 1.3635 1.2579 1.2088 1.2506 1.2792 1.2896 1.2957 1.2805
S$ Per 100 Units of:
Indian Rupee 2.9827 2.7027 2.6701 2.6257 2.5974 2.5432 2.4650 2.4962 Indonesian Rupiah 0.0150 0.0143 0.0142 0.0143 0.0144 0.0143 0.0142 0.0140 Japanese Yen 1.5543 1.5780 1.5672 1.6286 1.6662 1.6639 1.6643 1.6642 Korean Won 0.1180 0.1135 0.1126 0.1116 0.1108 0.1137 0.1128 0.1120 New Taiwan Dollar 4.3292 4.2798 4.1727 4.2068 4.2218 4.2655 4.2818 4.2682 Philippine Peso 3.0228 2.9038 2.8490 2.9022 2.9483 2.9773 2.9660 2.9374 Thai Baht 4.2986 4.1252 4.0470 4.1102 4.1386 4.1645 4.1553 4.0536
Source : Monetary Authority of SingaporeNote : Rates are average rates for the period.
13.6 OFFICIAL FOREIGN RESERVES
(End of Period)
2010 2011 Aug 2011 Sep 2011 Oct 2011 Nov 2011 Dec 2011 Jan 2012P
Total Foreign Reserves 288,954.1 308,403.2 299,503.6 305,284.6 307,207.8 308,822.1 308,403.2 308,252.5
Special Drawing Rights 1,969.8 1,732.9 1,681.3 1,761.0 1,719.5 1,744.4 1,732.9 1,688.8
Reserve Position in the IMF 421.0 905.5 784.8 878.0 857.3 869.3 905.5 884.9
Gold & Foreign Exchange 286,563.3 305,764.8 297,037.5 302,645.6 304,631.0 306,208.4 305,764.8 305,678.8
Total Foreign Reserves (US$m) 225,754.2 237,737.0 249,176.6 233,620.7 245,420.1 240,987.2 237,737.0 245,486.1
Source : Monetary Authority of Singapore
Million Dollars
68 Monthly Digest of Statistics Singapore

Finance
13.7 ASSETS OF DOMESTIC BANKING UNITS
(End of Period)
Asset 2010 2011 Aug 2011 Sep 2011 Oct 2011 Nov 2011 Dec 2011 Jan 2012
Total Assets 781,607.4 858,692.6 838,578.6 855,000.5 849,339.1 860,753.5 858,692.6 867,705.3
Cash 2,219.9 2,796.4 2,219.6 2,345.2 2,293.1 1,964.1 2,796.4 2,964.7
Amounts Due from Banks 232,272.3 215,762.8 221,587.9 221,196.4 216,149.1 221,463.2 215,762.8 215,859.4 In Singapore 77,972.8 58,857.6 75,752.3 69,677.4 65,716.5 62,274.8 58,857.6 57,161.6
Outside Singapore 1 154,299.5 156,905.2 145,835.6 151,519.0 150,432.6 159,188.4 156,905.2 158,697.8
Balances with Monetary Authority of Singapore 15,878.7 17,815.3 16,142.6 17,770.2 17,734.2 17,090.4 17,815.3 18,684.2
Securities and Equities Issued by Private Entities 36,034.3 38,979.7 37,263.1 38,403.0 39,915.6 39,842.9 38,979.7 40,229.8
Debt SecuritiesIn Singapore 8,365.6 9,927.6 9,097.4 9,055.6 9,600.7 10,309.1 9,927.6 11,262.6 Outside Singapore 12,416.8 14,070.5 13,226.4 14,458.8 15,497.0 14,633.3 14,070.5 13,880.1
Equity InvestmentsIn Singapore 10,088.1 9,945.4 9,965.1 9,897.1 9,841.9 9,924.6 9,945.4 10,039.8 Outside Singapore 5,163.8 5,036.2 4,974.1 4,991.4 4,976.1 4,975.9 5,036.2 5,047.3
Debt Securities by GovernmentRelated Entities 94,047.0 99,223.4 101,590.3 101,139.6 101,829.4 98,606.4 99,223.4 100,973.4
Government of Singapore 84,853.4 91,413.5 92,778.8 91,879.0 93,286.4 90,387.8 91,413.5 93,085.7 Statutory Authorities 4,219.1 6,780.8 6,815.3 7,458.7 6,935.9 6,948.1 6,780.8 6,892.3 Other Governments 4,974.6 1,029.2 1,996.3 1,801.9 1,607.2 1,270.5 1,029.2 995.4
Loans & Advances including Bills Financing 322,743.8 420,436.8 393,221.6 405,436.5 406,501.1 415,774.3 420,436.8 422,105.0
Bills Discounted or Purchased 20,050.4 44,582.2 36,741.0 43,041.4 43,276.7 43,911.7 44,582.2 41,396.7 Payable In Singapore 4,430.6 6,947.6 6,433.7 6,969.3 7,113.4 6,899.9 6,947.6 6,892.8 Payable Outside Singapore 15,619.8 37,634.6 30,307.3 36,072.1 36,163.3 37,011.8 37,634.6 34,503.9
Loans & Advances 302,693.4 375,854.6 356,480.5 362,395.0 363,224.4 371,862.7 375,854.6 380,708.3 Resident 283,067.7 334,290.7 318,622.1 322,627.6 323,390.5 330,731.8 334,290.7 337,831.7 Non-Resident 19,625.7 41,563.9 37,858.4 39,767.4 39,833.9 41,130.9 41,563.9 42,876.6
Other Assets 2 78,411.4 63,678.2 66,553.6 68,709.6 64,916.3 66,012.3 63,678.2 66,888.9
Source : Monetary Authority of Singapore1 Includes Asian Currency Units.2 The value of fixed assets is reported before depreciation.
Million Dollars
69 Monthly Digest of Statistics Singapore

Finance
13.8 LIABILITIES OF DOMESTIC BANKING UNITS
(End of Period)
Liability 2010 2011 Aug 2011 Sep 2011 Oct 2011 Nov 2011 Dec 2011 Jan 2012
Total Liabilities 781,607.4 858,692.6 838,578.6 855,000.5 849,339.1 860,753.5 858,692.6 867,705.3
Capital & Reserves 62,441.7 64,981.4 65,858.6 65,416.8 65,280.5 64,980.0 64,981.4 68,387.7
Deposits of Non-bank
Customers 1 433,757.8 483,323.4 469,605.2 473,387.7 478,735.0 483,450.0 483,323.4 487,281.5 Demand Deposits 100,394.2 118,369.5 116,315.6 118,961.2 119,763.4 121,228.5 118,369.5 121,172.2 Fixed Deposits 185,564.8 197,822.5 195,434.3 194,411.7 197,203.8 199,256.6 197,822.5 197,919.7 Savings Deposits 146,802.5 165,546.2 156,219.6 158,492.4 160,351.0 161,169.4 165,546.2 166,439.5 Other Deposits 996.3 1,585.1 1,635.7 1,522.4 1,416.7 1,795.4 1,585.1 1,750.1
Amounts Due to Banks 188,564.9 225,665.1 210,967.2 224,148.5 219,386.7 226,698.7 225,665.1 225,797.3 In Singapore 14,189.7 9,900.5 14,652.7 13,225.1 12,442.9 12,020.5 9,900.5 12,935.3
Outside Singapore 2 174,375.2 215,764.6 196,314.6 210,923.4 206,943.8 214,678.2 215,764.6 212,862.0
Other Liabilities 3 96,843.1 84,722.7 92,147.6 92,047.5 85,937.0 85,624.9 84,722.7 86,238.9
Source : Monetary Authority of Singapore1 Excludes non-bank customers' holdings of Singapore dollar negotiable certificates of deposit.2 Includes Asian Currency Units.3 Includes accumulated depreciation for fixed assets.
Million Dollars
70 Monthly Digest of Statistics Singapore

Finance
13.9 LOANS AND ADVANCES OF DOMESTIC BANKING UNITS
TO NON-BANK CUSTOMERS BY INDUSTRY(End of Period)
Industry 2010 2011 Aug 2011 Sep 2011 Oct 2011 Nov 2011 Dec 2011 Jan 2012
Total 322,743.8 420,436.8 393,221.6 405,436.5 406,501.1 415,774.3 420,436.8 422,105.0
Loans to Businesses 1 171,232.4 240,899.7 223,728.2 233,599.9 233,324.7 240,155.5 240,899.7 240,821.5
Agriculture, Mining &
Quarrying 382.2 1,736.1 1,766.5 1,849.5 1,866.9 1,926.3 1,736.1 1,567.1
Manufacturing 10,917.6 19,007.3 16,709.4 17,936.1 17,675.7 18,213.7 19,007.3 19,196.2
Building & Construction 2 53,593.9 66,938.5 62,583.8 63,121.7 63,401.5 65,024.4 66,938.5 68,154.7
General Commerce 30,982.9 49,250.1 43,588.3 48,301.7 49,275.1 51,511.8 49,250.1 48,363.1
Transport, Storage &
Communications 9,018.1 12,110.2 10,748.3 11,231.8 11,048.0 11,810.9 12,110.2 12,490.8
Business Services 2,990.5 4,445.6 4,303.1 4,305.5 4,076.0 4,355.1 4,445.6 4,621.6
Financial Institutions 37,992.5 55,249.7 50,963.3 51,288.7 52,661.0 53,751.0 55,249.7 54,971.9
Professional & Private
Individuals
Business Purposes 3,258.0 4,051.1 4,217.4 4,629.5 3,630.7 3,932.1 4,051.1 4,200.7
Others 22,096.7 28,111.1 28,848.1 30,935.4 29,689.8 29,630.2 28,111.1 27,255.4
Consumer Loans 151,511.6 179,537.0 169,493.2 171,836.5 173,176.4 175,618.9 179,537.0 181,283.4
Housing & Bridging Loans 112,350.2 131,104.5 124,974.2 126,646.1 128,093.2 129,431.3 131,104.5 132,680.1
Professional & Private
Individuals
Car Loans 11,678.5 12,692.8 11,440.4 11,417.1 11,388.1 11,329.8 12,692.8 12,569.2
Credit Cards 6,888.9 7,881.6 7,149.3 7,304.4 7,413.1 7,709.7 7,881.6 7,785.6
Share Financing 1,319.6 931.5 967.8 949.4 894.9 942.1 931.5 932.8
Others 19,274.4 26,926.6 24,961.5 25,519.5 25,387.1 26,206.0 26,926.6 27,315.7
Source : Monetary Authority of SingaporeNotes : Figures include bills financing.
The industry categories have been refined according to the Singapore Standard Industrial Classification. The industrial classification is by end-use of loans. If this classification is not possible, the borrower's main business activity will be used.
1 Includes loans to professional and private individuals for business purposes.2 Includes loans to building and building co-operative societies, building developers and real estate agents.
Million Dollars
71 Monthly Digest of Statistics Singapore

Finance
13.10 ASSETS AND LIABILITIES OF ASIAN CURRENCY UNITS
(End of Period)
Asset/Liability 2010 2011 Aug 2011 Sep 2011 Oct 2011 Nov 2011 Dec 2011 Jan 2012
Total Assets/Liabilities 971,299.4 1,036,205.4 1,089,639.4 1,083,722.8 1,053,147.8 1,050,335.8 1,036,205.4 1,056,326.6
Assets Loans to Non-bank Customers 268,081.7 312,814.0 309,671.8 309,976.7 308,887.6 311,083.5 312,814.0 311,779.3 Inter-bank Funds 501,891.4 529,034.9 564,720.0 558,359.8 540,576.8 539,480.3 529,034.9 539,195.8
In Singapore 92,715.5 113,364.7 118,160.9 117,064.0 117,846.6 116,350.3 113,364.7 118,921.8 Inter-Asian Currency Units 53,762.1 53,381.0 59,152.7 55,591.2 53,256.4 52,682.3 53,381.0 56,370.3 Outside Singapore 355,413.7 362,289.2 387,406.4 385,704.6 369,473.7 370,447.7 362,289.2 363,903.7
Debt Securities & Equities 130,155.8 102,043.2 120,822.1 107,617.1 108,149.5 103,681.2 102,043.2 108,164.7 Other Assets 71,170.5 92,313.3 94,425.5 107,769.0 95,534.0 96,090.7 92,313.3 97,186.7
Liabilities Deposits of Non-bank Customers 273,952.5 296,376.6 307,152.1 295,279.1 295,741.2 293,626.1 296,376.6 301,773.1 Inter-bank Funds 584,246.0 599,771.4 646,052.1 637,860.9 614,725.5 613,251.3 599,771.4 605,689.5
In Singapore 79,206.4 77,607.8 92,102.7 88,283.4 86,122.7 85,173.9 77,607.8 85,875.8 Inter-Asian Currency Units 53,840.0 53,620.5 59,268.5 55,570.2 53,346.1 52,691.0 53,620.5 56,389.9 Outside Singapore 451,199.5 468,543.1 494,680.9 494,007.4 475,256.7 475,386.3 468,543.1 463,423.8
Other Liabilities 113,100.9 140,057.4 136,435.2 150,582.7 142,681.1 143,458.4 140,057.4 148,864.0
Source : Monetary Authority of SingaporeNote : Asian Currency Unit is a separate accounting unit of banks and other financial institutions given approval
to transact in the Asian Dollar Market.
13.11 ASSETS OF FINANCE COMPANIES
(End of Period)
Asset 2010 2011 Aug 2011 Sep 2011 Oct 2011 Nov 2011 Dec 2011 Jan 2012
Total Assets 11,523.6 12,165.3 11,610.6 11,597.4 11,612.0 11,893.9 12,165.3 12,513.8
Cash & Balances with MonetaryAuthority of Singapore 225.6 263.3 231.9 238.1 249.1 258.3 263.3 266.2
Deposits with Banks & Other Institutions 1,885.0 1,176.2 1,529.6 1,117.2 902.5 1,053.9 1,176.2 1,246.7
Securities & Equities 1,259.3 1,161.9 1,054.2 1,121.1 1,137.5 1,154.1 1,161.9 1,180.9 Loans & Advances 8,058.2 9,460.2 8,703.8 9,029.5 9,234.8 9,330.7 9,460.2 9,725.6
Hire Purchase 2,069.9 2,037.7 1,984.7 1,991.2 2,014.1 2,025.9 2,037.7 2,034.0 On Motor Vehicles 1,930.4 1,899.6 1,860.0 1,866.0 1,884.7 1,893.7 1,899.6 1,892.3 On Consumer Durables 0.1 - 0.1 0.1 0.1 - - - On Other Goods 139.4 138.0 124.7 125.2 129.4 132.1 138.0 141.6
Housing Loans 1,485.5 1,517.1 1,474.7 1,483.0 1,496.3 1,507.1 1,517.1 1,525.9 Other Loans & Advances 4,502.8 5,905.4 5,244.4 5,555.3 5,724.4 5,797.7 5,905.4 6,165.7
Other Assets 95.5 103.7 91.2 91.5 88.1 96.9 103.7 94.4
Source : Monetary Authority of Singapore
Million US Dollars
Million Dollars
72 Monthly Digest of Statistics Singapore

Finance
13.12 LIABILITIES OF FINANCE COMPANIES
(End of Period)
Liability 2010 2011 Aug 2011 Sep 2011 Oct 2011 Nov 2011 Dec 2011 Jan 2012
Total Liabilities 11,523.6 12,165.3 11,610.6 11,597.4 11,612.0 11,893.9 12,165.3 12,513.8
Capital & Reserves 1,926.2 1,999.2 1,951.3 1,976.5 1,984.8 1,985.3 1,999.2 2,009.9
Deposits 8,891.4 9,481.0 8,961.3 8,934.5 8,942.7 9,207.8 9,481.0 9,820.4 Savings Deposits 266.6 252.7 261.1 263.7 259.8 251.6 252.7 248.0 Fixed Deposits 8,614.6 9,218.7 8,688.7 8,661.2 8,664.9 8,937.9 9,218.7 9,563.8 Other Deposits 10.2 9.7 11.6 9.5 18.0 18.3 9.7 8.7
Other Creditors 79.6 45.6 59.9 76.0 50.6 47.9 45.6 43.0
Other Liabilities 626.4 639.5 638.1 610.5 633.9 652.9 639.5 640.4
Source : Monetary Authority of Singapore
13.13 ASSETS AND LIABILITIES OF DOMESTIC AND ASIAN
CURRENCY UNIT OPERATIONS OF MERCHANT BANKS(End of Period)
Asset/Liability 2010 2011 Aug 2011 Sep 2011 Oct 2011 Nov 2011 Dec 2011 Jan 2012
Total Assets/Liabilities 89,760.3 87,855.4 87,912.5 91,421.5 83,645.7 84,974.3 87,855.4 82,778.5
AssetsAmounts Due from Banks 22,604.2 22,815.1 21,952.1 23,711.9 21,633.1 22,478.2 22,815.1 20,847.3
In Singapore 2,254.7 2,571.1 3,134.4 3,107.3 2,657.2 2,468.6 2,571.1 2,706.3
Outside Singapore 1 20,349.6 20,244.1 18,817.7 20,604.6 18,975.9 20,009.6 20,244.1 18,141.0 Loans & Advances to Non-bank Customers 25,976.8 29,095.7 27,284.1 29,291.6 27,706.1 28,776.5 29,095.7 24,816.1 Securities & Equities 36,100.0 28,622.4 32,617.0 30,140.1 28,631.3 26,846.9 28,622.4 30,405.8 Other Assets 5,079.2 7,322.1 6,059.3 8,278.0 5,675.1 6,872.8 7,322.1 6,709.3
LiabilitiesCapital & Reserves 9,510.2 9,989.6 9,616.9 10,055.6 9,722.0 10,009.2 9,989.6 9,780.3 Amounts Due to Banks 51,264.3 46,928.5 48,758.1 49,006.5 43,870.2 44,368.7 46,928.5 46,138.0
In Singapore 3,101.8 589.0 686.8 617.7 785.4 575.3 589.0 579.6 Outside Singapore 1 48,162.4 46,339.4 48,071.4 48,388.8 43,084.8 43,793.4 46,339.4 45,558.4
Borrowings from Non-bank Customers 21,249.1 22,623.4 21,530.1 23,029.5 22,190.4 22,364.4 22,623.4 17,818.4 Other Liabilities 7,736.8 8,313.9 8,007.3 9,330.0 7,863.2 8,232.0 8,313.9 9,041.8
Source : Monetary Authority of SingaporeNote : Provision of corporate financial advisory services, underwriting and operations in the gold market
would not be reflected in the data.1 Includes Asian Currency Units.
Million Dollars
Million Dollars
73 Monthly Digest of Statistics Singapore

Finance
13.14 PLEDGES AT PAWNSHOPS
2009 2010 Jun 2011 Jul 2011 Aug 2011 Sep 2011 Oct 2011 Nov 2011
Pledges ('000)Received 2,778.2 2,977.1 289.9 300.6 319.8 328.8 316.7 321.1 Redeemed 2,575.1 2,788.8 263.8 280.4 308.8 309.1 294.2 293.2
Amount of Loans ($m)Given Out 2,006.2 2,745.3 390.7 415.9 492.1 504.6 485.7 519.1
Redeemed 1 1,955.8 2,604.1 371.6 402.1 456.4 480.6 461.5 486.6
Source : Registry of Pawnbrokers
13.15 CENTRAL PROVIDENT FUND CONTRIBUTIONS, WITHDRAWALS
AND AMOUNT DUE TO MEMBERS
2010 2011 Aug 2011 Sep 2011 Oct 2011 Nov 2011 Dec 2011 Jan 2012
Amount Contributed 22,039.0 24,672.8 2,014.5 1,881.9 1,788.5 1,821.6 2,146.2 2,671.0
Interest Credited 6,709.8 7,472.7 628.7 633.0 635.5 638.5 641.5 669.0
Amount Withdrawn 1 9,617.3 10,436.5 830.3 908.9 1,014.7 863.6 917.0 875.9 Public Housing 4,006.9 5,464.3 368.2 443.0 459.9 413.8 471.4 452.0 Residential Properties 845.9 1,346.7 115.5 100.4 116.3 122.7 105.7 120.0
Reached 55 Years of Age 2 1,771.1 1,940.1 182.0 182.8 170.4 163.8 167.0 153.0 Leaving Singapore &
Malaysia 3 454.6 505.5 44.3 42.3 43.1 40.9 30.5 39.8
Death 378.3 434.6 37.0 43.6 37.7 31.3 37.1 34.9 Medisave Scheme 678.2 721.7 59.1 67.2 59.3 60.8 63.9 48.8 Private Medical Scheme 286.1 335.5 33.1 34.8 34.2 31.3 33.0 26.8 Others 1,196.2 -311.9 -8.9 -5.2 93.8 -1.0 8.4 0.6
Refunds and Transfers 47.5 51.5 5.9 3.3 2.8 2.9 2.7 1.5
Total Amount Due to Members 185,888.0 207,545.5 201,074.6 202,677.4 204,083.9 205,677.5 207,545.5 210,008.1
(End of Period)
Source : Central Provident Fund BoardNote : Figures from January 2011 onwards are unaudited.1 Refers to net amount withdrawn (gross amount withdrawn less amount refunded) by members.2 Includes first and subsequent withdrawals.3 Includes Malaysians leaving Singapore permanently.
1 Includes Interest.
Million Dollars
74 Monthly Digest of Statistics Singapore

Finance
13.16 TURNOVER ON THE SINGAPORE EXCHANGE (EQUITIES)
2010 2011 Aug 2011 Sep 2011 Oct 2011 Nov 2011 Dec 2011 Jan 2012
SGX MainboardVolume (million) 342,864.0 254,663.2 26,289.9 20,301.6 20,462.5 19,382.0 12,073.2 20,651.2
Basic Materials 20,403.7 13,129.9 978.1 581.5 905.3 595.9 358.9 697.9 Consumer Goods 73,556.3 58,493.9 5,302.1 3,528.5 4,285.9 3,833.2 2,875.0 4,318.5 Consumer Services 50,640.8 32,932.4 3,594.8 4,010.8 2,864.9 2,399.5 967.1 2,266.9 Financials 47,610.5 37,527.6 4,289.2 3,226.4 2,968.5 2,696.2 2,086.7 2,661.5 Health Care 8,626.4 3,478.1 383.9 231.7 205.9 168.1 126.1 202.3 Industrials 90,137.0 64,617.9 6,530.8 5,025.4 5,336.6 6,560.2 3,723.7 7,602.9 Oil & Gas 13,308.0 18,302.1 1,880.8 1,536.5 1,900.7 920.6 589.9 1,043.1 Technology 25,390.8 12,673.7 1,549.5 989.0 840.1 1,168.5 589.2 798.4 Telecommunications 6,044.9 6,792.4 979.1 688.1 544.0 561.6 444.6 633.4 Utilities 7,145.5 6,715.1 801.6 483.7 610.4 478.3 312.1 426.2
Value (S$m) 376,751.6 341,256.1 38,339.5 28,422.2 26,425.8 24,138.3 15,627.8 23,168.1 Basic Materials 11,582.6 9,153.2 651.3 507.1 635.3 450.0 318.1 437.4 Consumer Goods 49,241.6 44,473.8 4,319.0 2,983.6 3,206.6 3,097.4 1,893.2 2,690.5 Consumer Services 72,301.5 61,357.6 7,332.6 5,936.1 4,594.0 4,115.3 1,929.3 3,419.9 Financials 115,972.5 100,174.4 11,839.1 8,035.7 7,174.6 6,936.1 5,082.6 6,405.7 Health Care 6,427.9 2,858.9 287.0 148.4 154.5 138.5 132.3 193.6 Industrials 66,978.0 60,046.7 5,934.2 4,656.8 4,684.3 5,056.6 3,089.5 5,186.4 Oil & Gas 28,735.9 37,886.7 4,655.5 3,783.7 3,967.2 2,363.1 1,504.4 2,608.4 Technology 6,120.2 3,233.6 254.9 245.1 225.1 247.5 227.3 253.3 Telecommunications 16,531.1 19,491.4 2,834.7 2,032.8 1,634.3 1,581.2 1,328.5 1,775.8 Utilities 2,860.3 2,580.1 231.2 93.0 149.8 152.5 122.6 197.2
Source : Singapore Exchange Limited Note : All Mainboard and Catalist stocks are classified based on Industry Classification Benchmark.
Includes Ordinary Shares, Stapled Securities and Unit Trusts.
75 Monthly Digest of Statistics Singapore

Finance
13.16 TURNOVER ON THE SINGAPORE EXCHANGE (EQUITIES) (continued)
2010 2011 Aug 2011 Sep 2011 Oct 2011 Nov 2011 Dec 2011 Jan 2012
SGX CatalistVolume (million) 37,683.2 27,039.6 2,622.7 1,382.5 1,854.1 3,137.6 1,881.5 3,267.3
Basic Materials 19.4 605.7 0.8 2.4 120.8 328.7 102.6 124.3 Consumer Goods 2,652.8 1,317.7 229.7 53.5 28.3 25.1 121.0 256.6 Consumer Services 1,813.3 1,447.2 108.7 43.1 151.1 177.9 137.0 161.4 Financials 132.7 1,084.6 69.7 16.8 34.2 364.5 76.6 194.8 Health Care 4,825.5 874.9 99.6 32.3 47.0 47.4 47.2 136.3 Industrials 19,564.8 14,926.2 1,298.4 881.6 860.3 1,715.0 1,018.3 1,453.5 Oil & Gas 1,702.6 1,514.4 75.3 41.7 330.6 233.5 237.9 393.8 Technology 5,698.4 4,682.8 679.7 272.1 221.9 229.6 127.5 531.9 Telecommunications - - - - - - - - Utilities 1,273.8 586.2 60.9 39.0 60.0 15.9 13.3 14.7
Value (S$m) 4,953.7 3,380.9 175.6 121.3 329.4 578.1 296.0 554.5 Basic Materials 2.2 290.3 0.1 0.1 61.4 176.4 48.7 60.1 Consumer Goods 304.9 132.4 9.7 2.1 1.0 1.8 7.2 11.5 Consumer Services 613.8 256.0 17.1 6.7 14.3 7.2 6.0 6.9 Financials 20.8 166.9 9.8 2.8 4.6 50.7 10.0 27.4 Health Care 804.7 82.7 8.3 2.8 3.7 3.8 3.7 10.9 Industrials 2,104.2 1,700.3 95.6 88.8 85.7 232.5 114.1 232.8 Oil & Gas 692.5 578.1 21.6 13.2 155.9 92.0 102.7 197.2 Technology 316.4 142.0 9.1 2.6 2.3 13.4 2.7 7.1 Telecommunications - - - - - - - - Utilities 94.1 32.0 4.3 2.3 0.5 0.2 0.7 0.7
Source : Singapore Exchange Limited Note : All Mainboard and Catalist stocks are classified based on Industry Classification Benchmark.
Includes Ordinary Shares, Stapled Securities and Unit Trusts.
76 Monthly Digest of Statistics Singapore

Public Finance
14.1 GOVERNMENT FINANCE
2010 2011 Aug 2011 Sep 2011 Oct 2011 Nov 2011 Dec 2011 Jan 2012
Deficit (-) or Surplus 1 15,433.6 26,624.8 3,846.3 2,429.6 1,011.7 3,933.5 1,494.2 1,774.9
Total Revenue & Grants 64,088.6 79,080.8 7,862.0 6,364.1 4,362.3 7,491.9 5,753.7 5,492.8
Revenue 2 64,088.6 79,080.8 7,862.0 6,364.1 4,362.3 7,491.9 5,753.7 5,492.8
Expenditure & Lending minus Repayments 48,655.0 52,456.0 4,015.7 3,934.5 3,350.6 3,558.4 4,259.5 3,717.9
Expenditure 51,697.1 55,496.2 4,284.8 3,796.4 3,038.1 4,220.6 4,883.7 3,783.8 Lending minus Repayments -3,042.1 -3,040.2 -269.1 138.1 312.5 -662.2 -624.2 -65.9
Total Financing -15,433.6 -26,624.8 -3,846.3 -2,429.6 -1,011.7 -3,933.5 -1,494.2 -1,774.9
Domestic Financing -15,433.6 -26,624.8 -3,846.3 -2,429.6 -1,011.7 -3,933.5 -1,494.2 -1,774.9 Total Net Borrowing 29,693.7 35,677.3 7,561.4 9.5 2,237.7 3,068.3 3,969.4 6,582.1 Use of Cash Balances -45,127.3 -62,302.1 -11,407.7 -2,439.1 -3,249.4 -7,001.8 -5,463.6 -8,357.0
Foreign Financing - - - - - - - -
Source : Accountant-General's Department Note : Presentation format of the table follows that of the National Summary Data Page (NSDP) for Singapore, which disseminates
the data prescribed by the International Monetary Fund’s Special Data Dissemination Standards (SDDS). Data in the table represent a broader definition of Government revenues and receipts than the fiscal position presented during each year’s Budget under Singapore’s Constitution as it includes the revenues and receipts accruing to both the Government’s current and past reserves.
1 Accrues to both current and past reserves and does not reflect budget fiscal position of the current term of government. 2 Includes land sales and capital receipts (which accrue primarily to past reserves) in addition to taxes and other revenues.
14.2 GOVERNMENT DEBT
(End of Period)
2010 2011 2010 Q3 2010 Q4 2011 Q1 2011 Q2 2011 Q3 2011 Q4
Total 321,182.3 354,023.4 312,000.8 321,182.3 331,163.0 342,211.4 345,973.6 354,023.4
Domestic Debt 321,182.3 354,023.4 312,000.8 321,182.3 331,163.0 342,211.4 345,973.6 354,023.4 Registered Stocks &
Bonds 253,841.3 279,635.0 250,830.1 253,841.3 263,376.3 271,283.2 276,815.9 279,635.0 Treasury Bills 57,100.0 59,100.0 54,500.0 57,100.0 57,900.0 57,900.0 57,900.0 59,100.0 Advance Deposits 10,241.0 15,288.4 6,670.7 10,241.0 9,886.7 13,028.2 11,257.7 15,288.4
External Debt - - - - - - - -
Domestic Debt 310,941.3 338,735.0 305,330.1 310,941.3 321,276.3 329,183.2 334,715.9 338,735.0 (excl Advance Deposits) 1 year maturity or less 80,915.5 84,615.5 78,315.5 80,915.5 77,015.5 82,115.5 78,715.5 84,615.5 More than 1 year maturity 230,025.8 254,119.5 227,014.6 230,025.8 244,260.8 247,067.7 256,000.4 254,119.5
Memorandum Item :Debt Guarantees - - - - - - - -
Source : Accountant-General's Department Monetary Authority of Singapore
Million Dollars
Million Dollars
77 Monthly Digest of Statistics Singapore
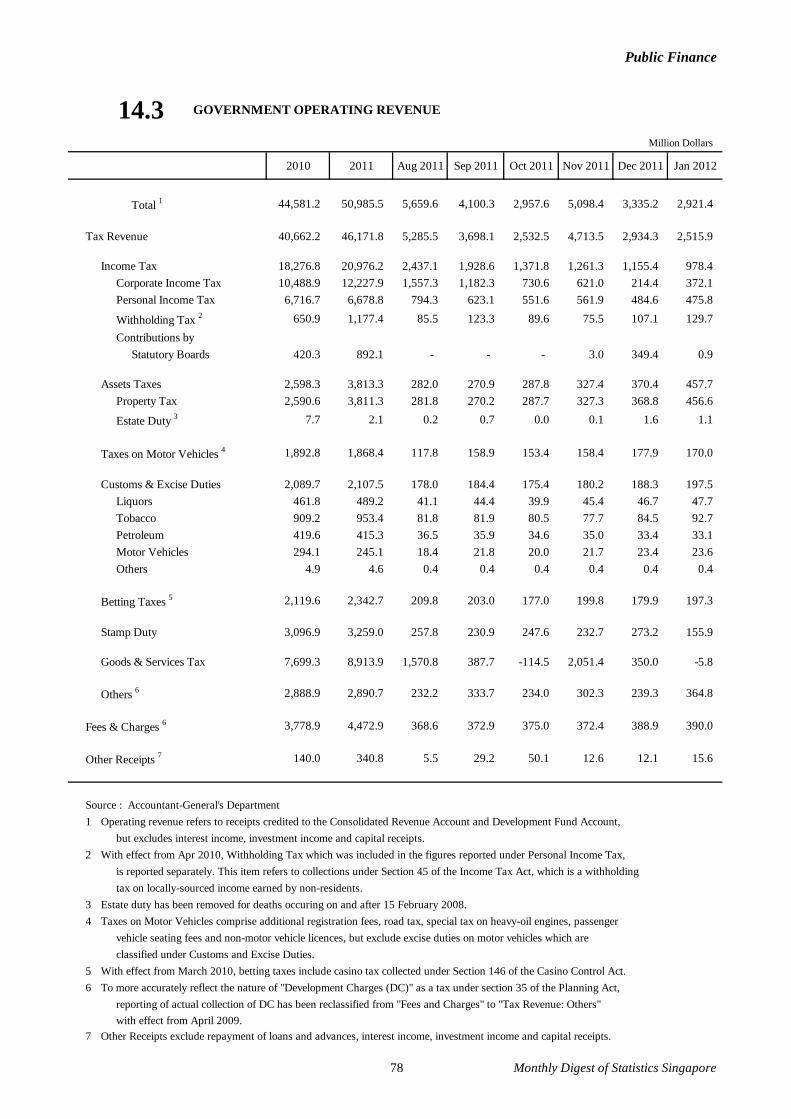
Public Finance
14.3 GOVERNMENT OPERATING REVENUE
2010 2011 Aug 2011 Sep 2011 Oct 2011 Nov 2011 Dec 2011 Jan 2012
Total 1 44,581.2 50,985.5 5,659.6 4,100.3 2,957.6 5,098.4 3,335.2 2,921.4
Tax Revenue 40,662.2 46,171.8 5,285.5 3,698.1 2,532.5 4,713.5 2,934.3 2,515.9
Income Tax 18,276.8 20,976.2 2,437.1 1,928.6 1,371.8 1,261.3 1,155.4 978.4 Corporate Income Tax 10,488.9 12,227.9 1,557.3 1,182.3 730.6 621.0 214.4 372.1 Personal Income Tax 6,716.7 6,678.8 794.3 623.1 551.6 561.9 484.6 475.8
Withholding Tax 2 650.9 1,177.4 85.5 123.3 89.6 75.5 107.1 129.7 Contributions by
Statutory Boards 420.3 892.1 - - - 3.0 349.4 0.9
Assets Taxes 2,598.3 3,813.3 282.0 270.9 287.8 327.4 370.4 457.7 Property Tax 2,590.6 3,811.3 281.8 270.2 287.7 327.3 368.8 456.6
Estate Duty 3 7.7 2.1 0.2 0.7 0.0 0.1 1.6 1.1
Taxes on Motor Vehicles 4 1,892.8 1,868.4 117.8 158.9 153.4 158.4 177.9 170.0
Customs & Excise Duties 2,089.7 2,107.5 178.0 184.4 175.4 180.2 188.3 197.5 Liquors 461.8 489.2 41.1 44.4 39.9 45.4 46.7 47.7 Tobacco 909.2 953.4 81.8 81.9 80.5 77.7 84.5 92.7 Petroleum 419.6 415.3 36.5 35.9 34.6 35.0 33.4 33.1 Motor Vehicles 294.1 245.1 18.4 21.8 20.0 21.7 23.4 23.6 Others 4.9 4.6 0.4 0.4 0.4 0.4 0.4 0.4
Betting Taxes 5 2,119.6 2,342.7 209.8 203.0 177.0 199.8 179.9 197.3
Stamp Duty 3,096.9 3,259.0 257.8 230.9 247.6 232.7 273.2 155.9
Goods & Services Tax 7,699.3 8,913.9 1,570.8 387.7 -114.5 2,051.4 350.0 -5.8
Others 6 2,888.9 2,890.7 232.2 333.7 234.0 302.3 239.3 364.8
Fees & Charges 6 3,778.9 4,472.9 368.6 372.9 375.0 372.4 388.9 390.0
Other Receipts 7 140.0 340.8 5.5 29.2 50.1 12.6 12.1 15.6
Source : Accountant-General's Department1 Operating revenue refers to receipts credited to the Consolidated Revenue Account and Development Fund Account,
but excludes interest income, investment income and capital receipts.2 With effect from Apr 2010, Withholding Tax which was included in the figures reported under Personal Income Tax,
is reported separately. This item refers to collections under Section 45 of the Income Tax Act, which is a withholding tax on locally-sourced income earned by non-residents.
3 Estate duty has been removed for deaths occuring on and after 15 February 2008.4 Taxes on Motor Vehicles comprise additional registration fees, road tax, special tax on heavy-oil engines, passenger
vehicle seating fees and non-motor vehicle licences, but exclude excise duties on motor vehicles which are classified under Customs and Excise Duties.
5 With effect from March 2010, betting taxes include casino tax collected under Section 146 of the Casino Control Act.6 To more accurately reflect the nature of "Development Charges (DC)" as a tax under section 35 of the Planning Act,
reporting of actual collection of DC has been reclassified from "Fees and Charges" to "Tax Revenue: Others"with effect from April 2009.
7 Other Receipts exclude repayment of loans and advances, interest income, investment income and capital receipts.
Million Dollars
78 Monthly Digest of Statistics Singapore
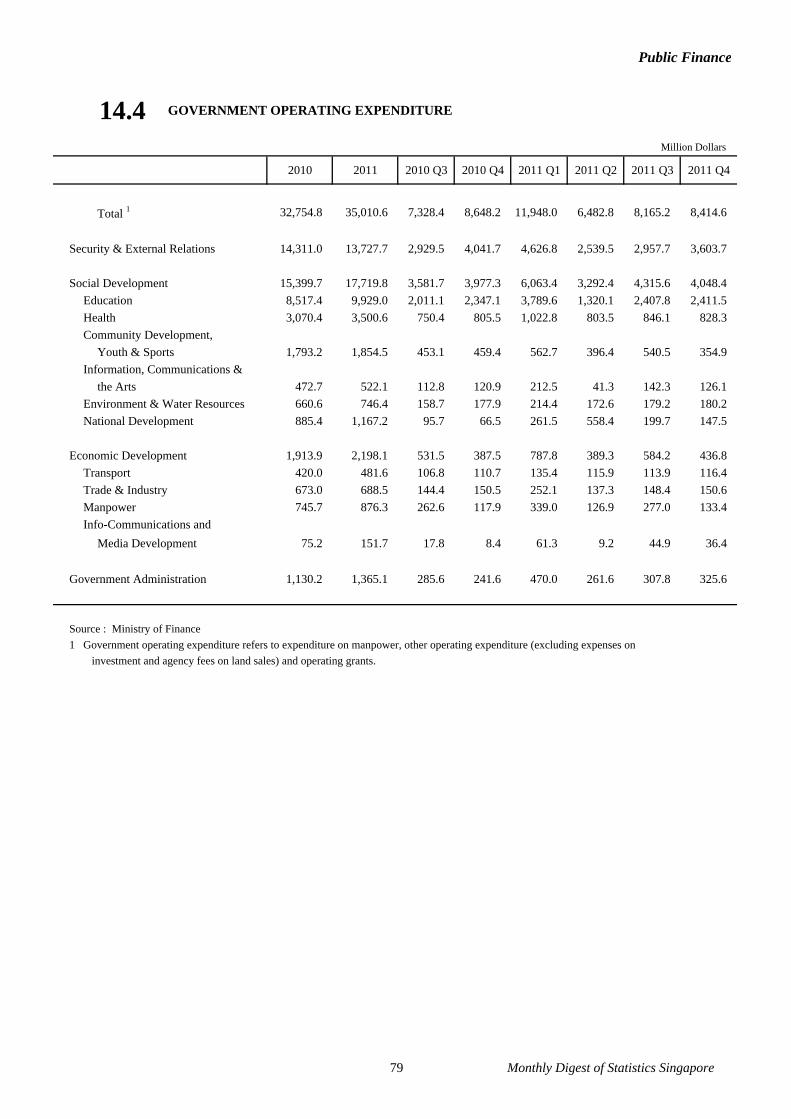
Public Finance
14.4 GOVERNMENT OPERATING EXPENDITURE
2010 2011 2010 Q3 2010 Q4 2011 Q1 2011 Q2 2011 Q3 2011 Q4
Total 1 32,754.8 35,010.6 7,328.4 8,648.2 11,948.0 6,482.8 8,165.2 8,414.6
Security & External Relations 14,311.0 13,727.7 2,929.5 4,041.7 4,626.8 2,539.5 2,957.7 3,603.7
Social Development 15,399.7 17,719.8 3,581.7 3,977.3 6,063.4 3,292.4 4,315.6 4,048.4 Education 8,517.4 9,929.0 2,011.1 2,347.1 3,789.6 1,320.1 2,407.8 2,411.5 Health 3,070.4 3,500.6 750.4 805.5 1,022.8 803.5 846.1 828.3 Community Development,
Youth & Sports 1,793.2 1,854.5 453.1 459.4 562.7 396.4 540.5 354.9 Information, Communications &
the Arts 472.7 522.1 112.8 120.9 212.5 41.3 142.3 126.1 Environment & Water Resources 660.6 746.4 158.7 177.9 214.4 172.6 179.2 180.2 National Development 885.4 1,167.2 95.7 66.5 261.5 558.4 199.7 147.5
Economic Development 1,913.9 2,198.1 531.5 387.5 787.8 389.3 584.2 436.8 Transport 420.0 481.6 106.8 110.7 135.4 115.9 113.9 116.4 Trade & Industry 673.0 688.5 144.4 150.5 252.1 137.3 148.4 150.6 Manpower 745.7 876.3 262.6 117.9 339.0 126.9 277.0 133.4 Info-Communications and
Media Development 75.2 151.7 17.8 8.4 61.3 9.2 44.9 36.4
Government Administration 1,130.2 1,365.1 285.6 241.6 470.0 261.6 307.8 325.6
Source : Ministry of Finance1 Government operating expenditure refers to expenditure on manpower, other operating expenditure (excluding expenses on
investment and agency fees on land sales) and operating grants.
Million Dollars
79 Monthly Digest of Statistics Singapore

Public Finance
14.5 GOVERNMENT DEVELOPMENT EXPENDITURE
2010 2011 2010 Q3 2010 Q4 2011 Q1 2011 Q2 2011 Q3 2011 Q4
Total 1 11,294.6 11,760.8 3,031.5 2,644.3 3,849.7 2,110.5 2,994.5 2,806.0
Security & External Relations 777.0 703.2 169.8 155.5 278.1 127.7 149.3 148.2
Social Development 3,478.9 3,725.6 923.6 818.3 1,389.3 636.0 849.1 851.3 Education 841.1 934.2 252.7 142.6 371.0 68.0 174.5 320.7 Health 613.2 405.6 126.5 100.9 214.0 39.6 77.7 74.3 Community Development,
Youth & Sports 69.2 110.1 21.6 4.1 88.6 3.0 9.0 9.5 Information, Communications &
the Arts 93.6 136.5 16.4 15.9 74.9 16.4 15.4 29.8 Environment & Water Resources 358.3 391.4 88.5 89.0 161.0 88.0 105.3 37.1 National Development 1,503.4 1,747.9 417.9 465.7 479.8 421.1 467.0 380.0
Economic Development 6,859.6 7,116.0 1,890.0 1,654.3 2,034.6 1,340.7 1,968.9 1,771.8 Transport 4,051.3 4,222.4 1,205.4 1,104.5 957.5 725.1 1,254.5 1,285.4 Trade & Industry 2,363.3 2,573.1 515.5 452.1 910.4 595.4 650.3 417.0 Manpower 24.5 57.3 5.6 3.5 31.8 0.9 8.5 16.1 Info-Communications and
Media Development 420.5 263.1 163.4 94.2 134.8 19.3 55.6 53.3
Government Administration 179.0 215.9 48.2 16.1 147.7 6.2 27.3 34.8
Source : Ministry of Finance1 Government development expenditure excludes land-related expenditure items and loans to statutory boards and industrial
and commercial enterprises.
Million Dollars
80 Monthly Digest of Statistics Singapore

Public Finance
14.6 DUTY-PAID RELEASES OF LIQUORS
Litres
2010 2011 Aug 2011 Sep 2011 Oct 2011 Nov 2011 Dec 2011 Jan 2012
Total 120,049,779 126,265,086 10,392,471 11,320,237 10,486,468 11,046,103 11,548,361 13,003,283
Beer & Ale 99,380,734 104,338,269 8,862,719 9,346,349 8,685,707 8,885,489 9,184,709 10,900,853
Brandy 902,266 979,374 106,625 84,699 87,263 81,714 99,216 99,221
Cider & Perry 531,797 470,486 27,104 43,342 57,093 38,821 60,956 45,543
Gin & Geneva 138,141 151,761 14,379 15,446 10,640 15,062 16,227 12,680
Liqueurs & Cordials 185,690 203,164 17,951 19,733 16,325 20,551 21,813 16,176
Rum 170,628 210,010 14,450 15,973 25,046 16,482 24,453 17,921
Sake 288,596 316,214 25,726 34,935 27,472 40,906 33,286 20,068
Samsu 565,126 507,700 45,515 58,416 28,149 52,365 35,938 52,272
Sparkling Wine 1 773,870 904,546 66,703 98,080 67,120 114,573 146,443 71,742
Still Wine 2 7,646,250 8,536,119 658,831 754,284 679,138 940,976 982,544 772,910
Stout & Porter 6,918,812 6,893,971 321,806 605,546 597,672 568,682 646,609 761,204
Vodka 436,434 464,753 33,837 50,947 36,333 52,153 44,777 41,126
Whisky 1,109,206 1,198,547 112,085 103,241 92,799 105,201 124,846 93,125
Others 1,002,229 1,090,172 84,740 89,246 75,711 113,128 126,544 98,442
Source : Singapore Customs Note: Data refers to gross quantities released.1 Refers to sparkling wine of fresh grapes.2 Refers to still wine of fresh grapes.
81 Monthly Digest of Statistics Singapore
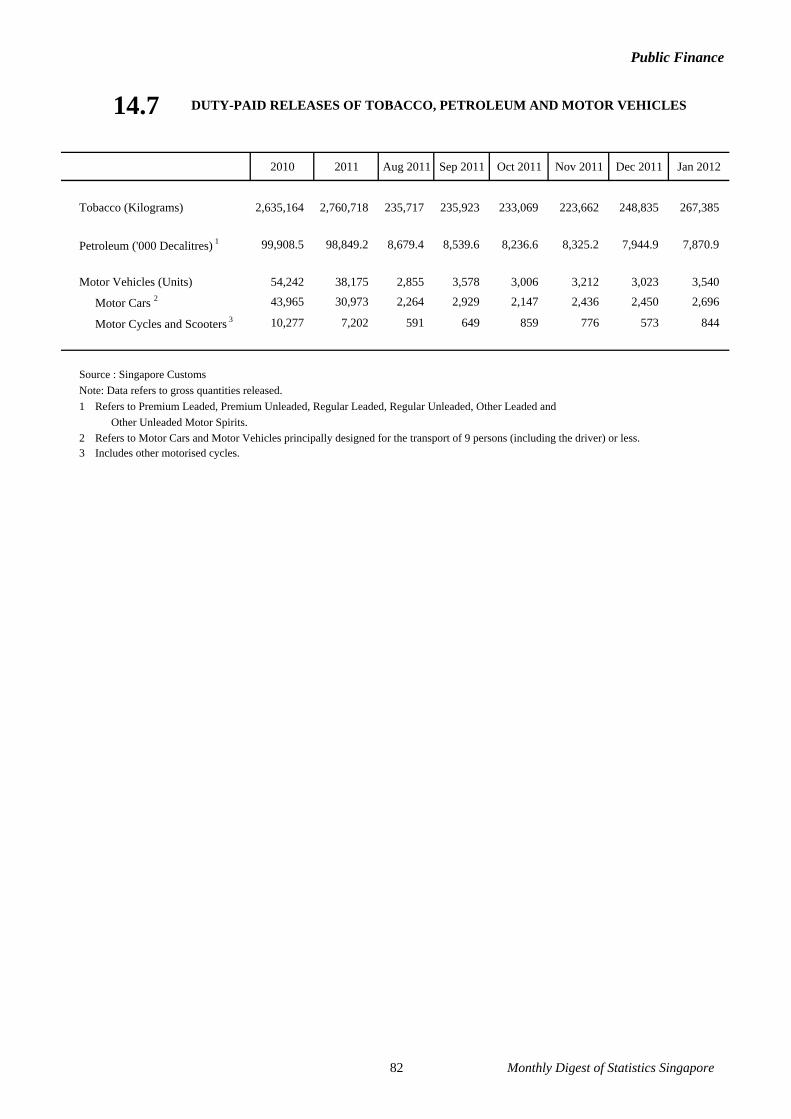
Public Finance
14.7 DUTY-PAID RELEASES OF TOBACCO, PETROLEUM AND MOTOR VEHICLES
2010 2011 Aug 2011 Sep 2011 Oct 2011 Nov 2011 Dec 2011 Jan 2012
Tobacco (Kilograms) 2,635,164 2,760,718 235,717 235,923 233,069 223,662 248,835 267,385
Petroleum ('000 Decalitres) 1 99,908.5 98,849.2 8,679.4 8,539.6 8,236.6 8,325.2 7,944.9 7,870.9
Motor Vehicles (Units) 54,242 38,175 2,855 3,578 3,006 3,212 3,023 3,540
Motor Cars 2 43,965 30,973 2,264 2,929 2,147 2,436 2,450 2,696
Motor Cycles and Scooters 3 10,277 7,202 591 649 859 776 573 844
Source : Singapore Customs Note: Data refers to gross quantities released.1 Refers to Premium Leaded, Premium Unleaded, Regular Leaded, Regular Unleaded, Other Leaded and
Other Unleaded Motor Spirits.2 Refers to Motor Cars and Motor Vehicles principally designed for the transport of 9 persons (including the driver) or less.3 Includes other motorised cycles.
82 Monthly Digest of Statistics Singapore
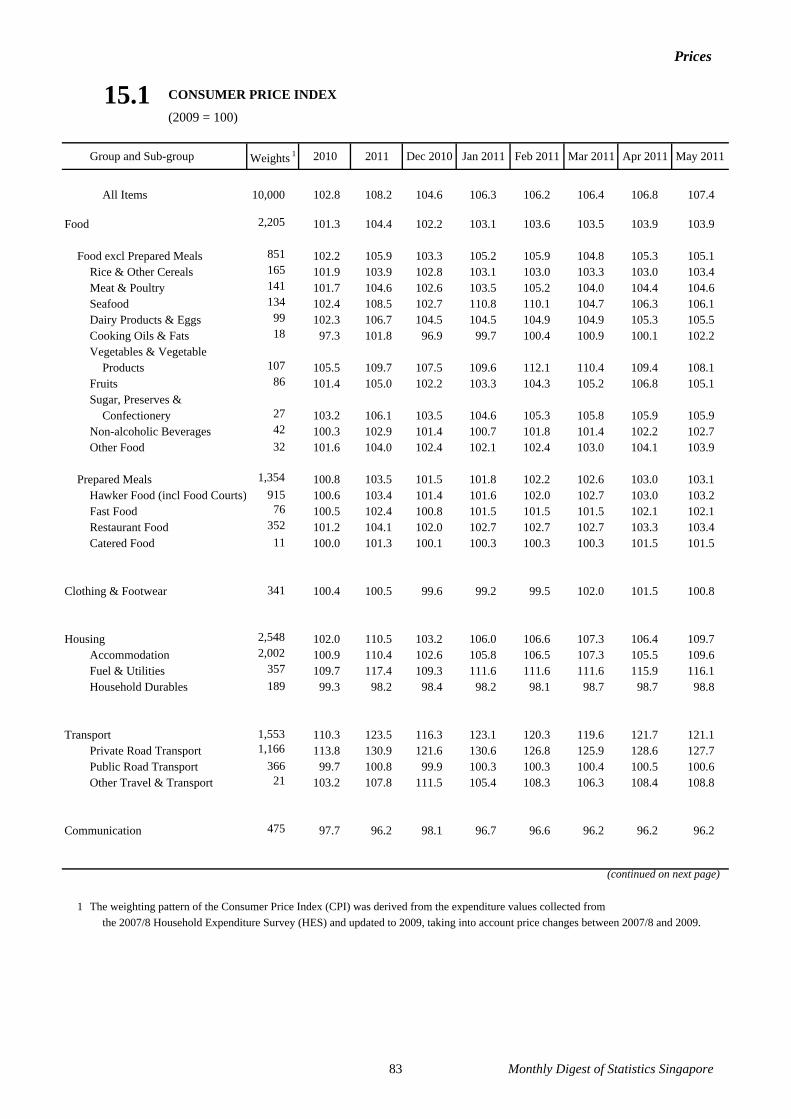
Prices
15.1 CONSUMER PRICE INDEX
(2009 = 100)
Group and Sub-group Weights 1 2010 2011 Dec 2010 Jan 2011 Feb 2011 Mar 2011 Apr 2011 May 2011
All Items 10,000 102.8 108.2 104.6 106.3 106.2 106.4 106.8 107.4
Food 2,205 101.3 104.4 102.2 103.1 103.6 103.5 103.9 103.9
Food excl Prepared Meals 851 102.2 105.9 103.3 105.2 105.9 104.8 105.3 105.1 Rice & Other Cereals 165 101.9 103.9 102.8 103.1 103.0 103.3 103.0 103.4 Meat & Poultry 141 101.7 104.6 102.6 103.5 105.2 104.0 104.4 104.6 Seafood 134 102.4 108.5 102.7 110.8 110.1 104.7 106.3 106.1 Dairy Products & Eggs 99 102.3 106.7 104.5 104.5 104.9 104.9 105.3 105.5 Cooking Oils & Fats 18 97.3 101.8 96.9 99.7 100.4 100.9 100.1 102.2 Vegetables & Vegetable
Products 107 105.5 109.7 107.5 109.6 112.1 110.4 109.4 108.1 Fruits 86 101.4 105.0 102.2 103.3 104.3 105.2 106.8 105.1 Sugar, Preserves &
Confectionery 27 103.2 106.1 103.5 104.6 105.3 105.8 105.9 105.9 Non-alcoholic Beverages 42 100.3 102.9 101.4 100.7 101.8 101.4 102.2 102.7 Other Food 32 101.6 104.0 102.4 102.1 102.4 103.0 104.1 103.9
Prepared Meals 1,354 100.8 103.5 101.5 101.8 102.2 102.6 103.0 103.1 Hawker Food (incl Food Courts) 915 100.6 103.4 101.4 101.6 102.0 102.7 103.0 103.2 Fast Food 76 100.5 102.4 100.8 101.5 101.5 101.5 102.1 102.1 Restaurant Food 352 101.2 104.1 102.0 102.7 102.7 102.7 103.3 103.4 Catered Food 11 100.0 101.3 100.1 100.3 100.3 100.3 101.5 101.5
Clothing & Footwear 341 100.4 100.5 99.6 99.2 99.5 102.0 101.5 100.8
Housing 2,548 102.0 110.5 103.2 106.0 106.6 107.3 106.4 109.7 Accommodation 2,002 100.9 110.4 102.6 105.8 106.5 107.3 105.5 109.6 Fuel & Utilities 357 109.7 117.4 109.3 111.6 111.6 111.6 115.9 116.1 Household Durables 189 99.3 98.2 98.4 98.2 98.1 98.7 98.7 98.8
Transport 1,553 110.3 123.5 116.3 123.1 120.3 119.6 121.7 121.1 Private Road Transport 1,166 113.8 130.9 121.6 130.6 126.8 125.9 128.6 127.7 Public Road Transport 366 99.7 100.8 99.9 100.3 100.3 100.4 100.5 100.6 Other Travel & Transport 21 103.2 107.8 111.5 105.4 108.3 106.3 108.4 108.8
Communication 475 97.7 96.2 98.1 96.7 96.6 96.2 96.2 96.2
(continued on next page)
1 The weighting pattern of the Consumer Price Index (CPI) was derived from the expenditure values collected fromthe 2007/8 Household Expenditure Survey (HES) and updated to 2009, taking into account price changes between 2007/8 and 2009.
83 Monthly Digest of Statistics Singapore

Prices
15.1 CONSUMER PRICE INDEX (continued)
(2009 = 100)
Group and Sub-group Weights 1 2010 2011 Dec 2010 Jan 2011 Feb 2011 Mar 2011 Apr 2011 May 2011
Education & Stationery 735 102.7 105.7 103.9 105.1 105.2 105.2 105.4 105.3 Tuition & Other Fees 598 103.3 106.8 104.6 106.0 106.2 106.2 106.4 106.4 School Textbooks &
Stationery 72 100.4 100.9 101.2 101.3 101.3 101.2 101.3 101.0 Newspapers, Magazines
& Other Books 65 100.4 100.5 100.5 100.5 100.5 100.5 100.5 100.5
Health Care 586 101.9 104.3 102.9 103.8 103.8 103.7 104.0 103.9 Medical Treatment 352 102.0 104.7 102.9 104.0 104.0 104.1 104.3 104.4 Dental Treatment 48 103.8 106.8 105.4 105.9 105.9 105.9 106.2 106.4 Proprietary Medicines &
Supplies 106 101.5 104.5 103.4 104.0 104.2 103.6 104.4 103.4 Medical Health Insurance 80 100.4 100.9 100.8 100.9 100.9 100.9 100.9 100.9
Recreation & Others 1,557 101.1 102.5 102.7 100.6 101.2 101.5 102.5 102.1 Recreation & Entertainment 320 98.7 89.6 97.8 87.8 87.9 87.8 88.7 89.1 Alcoholic Drinks & Tobacco 136 100.3 101.4 100.5 100.8 100.4 101.5 101.6 101.6 Personal Care 222 100.7 101.6 101.3 101.4 101.2 101.3 101.4 101.3 Household Services 250 101.5 112.7 102.7 104.9 108.8 108.8 112.4 114.0 Non-Durable Household Goods 71 101.1 102.7 101.7 101.8 102.4 102.5 102.7 102.7 Personal Effects 78 101.1 100.8 101.5 101.8 99.8 102.0 101.8 100.2 Hobbies & Other Miscellaneous
Expenditure 480 103.0 106.8 107.6 106.1 106.5 106.7 107.3 105.3
All Items less Imputed Rentals on
Owner-Occupied Accommodation 2 8,441 103.2 107.6 104.6 106.5 106.2 106.2 106.4 106.9
All Items less Accommodation 7,998 103.3 107.6 105.1 106.5 106.2 106.2 107.1 106.8
(continued on next page)
1 The weighting pattern of the Consumer Price Index (CPI) was derived from the expenditure values collected fromthe 2007/8 Household Expenditure Survey (HES) and updated to 2009, taking into account price changes between 2007/8 and 2009.
2 A significant share of the CPI Accommodation subgroup is “owner-occupied accommodation (OOA) cost”, which is computed based on the imputed rental concept under the rental equivalence method. Given that it has no impact on the cash expenditure of most households in Singapore as they already own their homes, “All Items less imputed rentals on owner-occupied accommodation” is compiled as an additional indicator.
84 Monthly Digest of Statistics Singapore

Prices
15.1 CONSUMER PRICE INDEX (continued)
(2009 = 100)
Group and Sub-group Weights 1 Jun 2011 Jul 2011 Aug 2011 Sep 2011 Oct 2011 Nov 2011 Dec 2011 Jan 2012
All Items 10,000 107.1 108.7 109.5 109.3 109.8 110.4 110.4 111.4
Food 2,205 104.2 104.5 104.6 104.9 105.5 105.6 106.0 107.1
Food excl Prepared Meals 851 105.6 105.5 105.8 106.2 106.7 106.9 107.7 110.0 Rice & Other Cereals 165 103.6 104.1 104.1 104.4 104.5 104.8 105.2 105.3 Meat & Poultry 141 104.6 104.5 104.8 104.7 105.0 104.7 105.6 107.4 Seafood 134 107.0 108.0 108.7 110.0 110.1 109.3 111.2 122.9 Dairy Products & Eggs 99 106.6 106.4 107.6 107.6 107.8 109.2 109.7 109.4 Cooking Oils & Fats 18 100.6 101.9 103.3 103.6 102.4 103.5 102.9 102.6 Vegetables & Vegetable
Products 107 109.2 108.0 107.2 108.4 111.0 111.3 111.7 113.6 Fruits 86 105.8 104.6 104.3 104.5 104.6 105.7 106.2 106.5 Sugar, Preserves &
Confectionery 27 106.6 105.8 106.5 105.6 106.9 106.4 108.0 107.5 Non-alcoholic Beverages 42 103.3 102.8 103.8 103.7 103.5 104.7 104.7 104.3 Other Food 32 104.4 103.7 103.8 104.7 105.3 105.0 105.5 105.0
Prepared Meals 1,354 103.3 103.8 103.9 104.0 104.7 104.8 105.0 105.3 Hawker Food (incl Food Courts) 915 103.4 103.7 103.8 104.0 104.4 104.6 104.7 104.8 Fast Food 76 102.4 102.6 102.8 102.8 103.2 103.2 103.5 103.6 Restaurant Food 352 103.4 104.3 104.5 104.5 105.8 105.8 105.9 106.8 Catered Food 11 101.5 101.5 101.5 101.5 102.0 102.0 102.0 102.0
Clothing & Footwear 341 97.9 99.4 102.1 100.8 101.4 102.2 99.7 100.4
Housing 2,548 108.7 112.2 113.0 113.2 114.1 114.8 113.5 116.1 Accommodation 2,002 108.4 112.0 113.0 113.2 114.5 115.2 113.6 116.7 Fuel & Utilities 357 115.9 120.7 121.3 121.3 120.4 120.9 120.9 122.7 Household Durables 189 98.7 98.1 97.9 97.7 97.7 98.1 97.8 97.6
Transport 1,553 121.0 124.3 126.3 124.8 124.8 126.5 128.0 127.4 Private Road Transport 1,166 127.7 132.1 134.7 132.8 132.5 134.8 136.4 134.6 Public Road Transport 366 100.6 100.7 100.8 100.7 101.1 101.3 102.1 105.5 Other Travel & Transport 21 108.7 106.3 106.9 105.2 106.5 109.1 113.9 110.1
Communication 475 96.0 96.2 96.1 96.0 96.2 96.3 96.2 96.3
(continued on next page)
1 The weighting pattern of the Consumer Price Index (CPI) was derived from the expenditure values collected fromthe 2007/8 Household Expenditure Survey (HES) and updated to 2009, taking into account price changes between 2007/8 and 2009.
85 Monthly Digest of Statistics Singapore
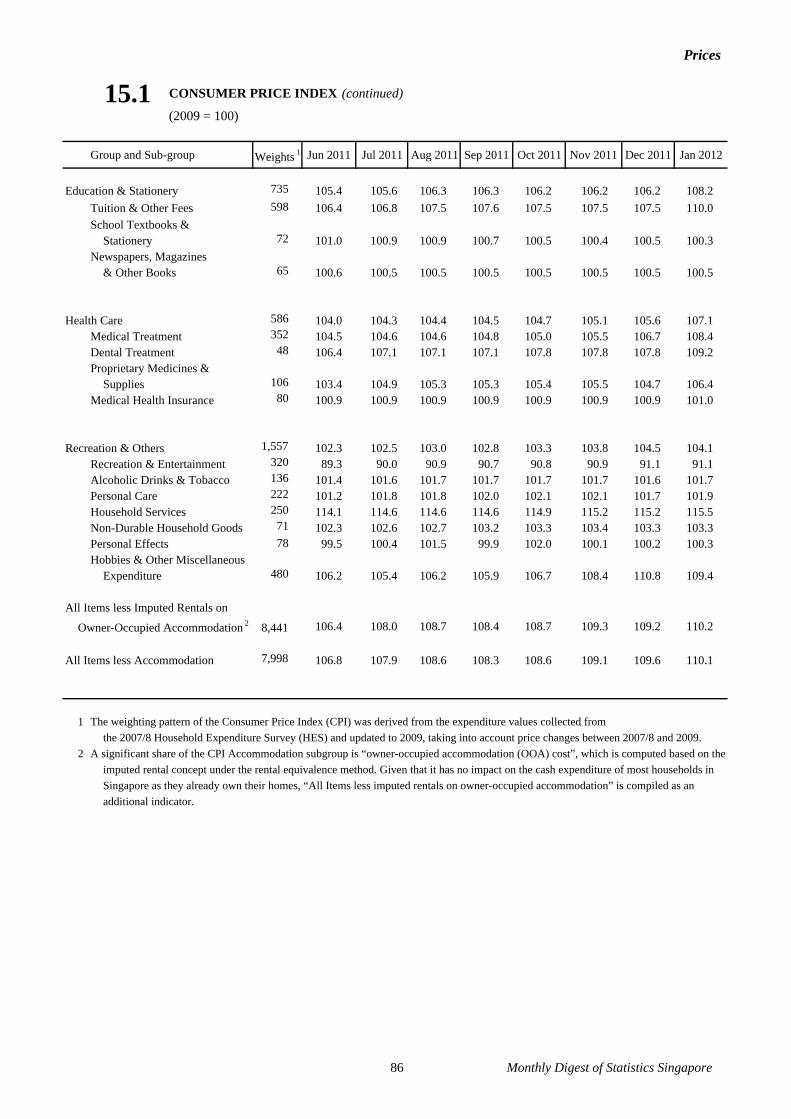
Prices
15.1 CONSUMER PRICE INDEX (continued)
(2009 = 100)
Group and Sub-group Weights 1 Jun 2011 Jul 2011 Aug 2011 Sep 2011 Oct 2011 Nov 2011 Dec 2011 Jan 2012
Education & Stationery 735 105.4 105.6 106.3 106.3 106.2 106.2 106.2 108.2 Tuition & Other Fees 598 106.4 106.8 107.5 107.6 107.5 107.5 107.5 110.0 School Textbooks &
Stationery 72 101.0 100.9 100.9 100.7 100.5 100.4 100.5 100.3 Newspapers, Magazines
& Other Books 65 100.6 100.5 100.5 100.5 100.5 100.5 100.5 100.5
Health Care 586 104.0 104.3 104.4 104.5 104.7 105.1 105.6 107.1 Medical Treatment 352 104.5 104.6 104.6 104.8 105.0 105.5 106.7 108.4 Dental Treatment 48 106.4 107.1 107.1 107.1 107.8 107.8 107.8 109.2 Proprietary Medicines &
Supplies 106 103.4 104.9 105.3 105.3 105.4 105.5 104.7 106.4 Medical Health Insurance 80 100.9 100.9 100.9 100.9 100.9 100.9 100.9 101.0
Recreation & Others 1,557 102.3 102.5 103.0 102.8 103.3 103.8 104.5 104.1 Recreation & Entertainment 320 89.3 90.0 90.9 90.7 90.8 90.9 91.1 91.1 Alcoholic Drinks & Tobacco 136 101.4 101.6 101.7 101.7 101.7 101.7 101.6 101.7 Personal Care 222 101.2 101.8 101.8 102.0 102.1 102.1 101.7 101.9 Household Services 250 114.1 114.6 114.6 114.6 114.9 115.2 115.2 115.5 Non-Durable Household Goods 71 102.3 102.6 102.7 103.2 103.3 103.4 103.3 103.3 Personal Effects 78 99.5 100.4 101.5 99.9 102.0 100.1 100.2 100.3 Hobbies & Other Miscellaneous
Expenditure 480 106.2 105.4 106.2 105.9 106.7 108.4 110.8 109.4
All Items less Imputed Rentals on
Owner-Occupied Accommodation 2 8,441 106.4 108.0 108.7 108.4 108.7 109.3 109.2 110.2
All Items less Accommodation 7,998 106.8 107.9 108.6 108.3 108.6 109.1 109.6 110.1
1 The weighting pattern of the Consumer Price Index (CPI) was derived from the expenditure values collected fromthe 2007/8 Household Expenditure Survey (HES) and updated to 2009, taking into account price changes between 2007/8 and 2009.
2 A significant share of the CPI Accommodation subgroup is “owner-occupied accommodation (OOA) cost”, which is computed based on the imputed rental concept under the rental equivalence method. Given that it has no impact on the cash expenditure of most households in Singapore as they already own their homes, “All Items less imputed rentals on owner-occupied accommodation” is compiled as an additional indicator.
86 Monthly Digest of Statistics Singapore

Prices
15.2 CONSUMER PRICE INDEX FOR HOUSEHOLDS IN DIFFERENT
INCOME GROUPS(2009 = 100)
Income Group All Items FoodClothing
& Footwear
Housing Transport Comm -unication
Education &
StationeryHealth Care Recreation
& Others
All Items less Imputed Rentals
on Owner-Occupied
Accommodation 2
Weights 1 Per 10,000
Lowest 20% 10,000 2,689 225 3,605 719 518 439 739 1,066 7,576 Middle 60% 10,000 2,381 352 2,477 1,492 552 686 585 1,475 8,504 Highest 20% 10,000 1,843 348 2,428 1,823 354 865 559 1,780 8,531
Consumer Price Index
2010 Lowest 20% 102.4 101.4 100.4 103.8 105.3 98.4 102.3 102.2 100.8 102.6Middle 60% 102.7 101.3 100.4 102.4 109.6 97.7 102.7 101.9 101.0 103.0Highest 20% 103.1 101.3 100.4 100.8 111.6 97.6 102.8 101.8 101.4 103.7
2011Lowest 20% 107.2 104.6 100.8 114.0 112.6 97.5 105.2 104.5 95.9 104.9Middle 60% 107.9 104.5 100.5 111.5 121.9 96.3 105.8 104.2 101.6 106.9Highest 20% 108.9 104.4 100.7 107.7 126.3 96.0 105.8 104.6 104.3 109.1
2009 Jul-DecLowest 20% 100.1 100.0 100.6 100.2 101.1 99.4 100.2 100.1 99.7 100.3Middle 60% 100.3 100.0 100.6 99.7 102.5 99.3 100.2 100.2 99.7 100.5Highest 20% 100.2 100.0 100.7 98.9 103.1 99.3 100.1 100.2 99.5 100.5
2010 Jan-JunLowest 20% 101.4 101.0 99.7 102.1 103.7 98.0 101.4 101.3 100.4 101.9Middle 60% 101.6 100.9 99.4 101.0 107.0 97.3 101.8 101.1 100.5 102.0Highest 20% 101.9 100.8 99.4 99.7 108.5 97.2 102.0 101.0 100.6 102.5
2010 Jul-DecLowest 20% 103.4 101.8 101.1 105.5 106.9 98.7 103.2 103.1 101.1 103.4Middle 60% 103.8 101.8 101.4 103.8 112.2 98.1 103.7 102.7 101.4 103.9Highest 20% 104.3 101.8 101.4 101.9 114.7 98.1 103.6 102.6 102.2 104.9
2011 Jan-JunLowest 20% 105.4 103.8 100.4 110.2 111.0 97.5 104.9 104.1 95.3 103.8Middle 60% 106.4 103.7 100.2 108.2 119.5 96.3 105.3 103.8 100.9 105.8Highest 20% 107.5 103.7 100.2 105.4 123.9 96.1 105.4 104.2 103.5 107.9
2011 Jul-DecLowest 20% 109.0 105.3 101.2 117.8 114.2 97.5 105.5 105.0 96.6 106.0Middle 60% 109.4 105.2 100.9 114.8 124.2 96.2 106.2 104.7 102.4 108.1Highest 20% 110.3 105.2 101.2 110.1 128.7 96.0 106.3 105.0 105.2 110.2
1 The weighting patterns of the Consumer Price Index (CPI) was derived from the expenditure values collected fromthe 2007/08 Household Expenditure Survey (HES) and updated to 2009, taking into account price changes between 2007/8 and 2009.
2 A significant share of the CPI Accommodation subgroup is “owner-occupied accommodation (OOA) cost”, which is computed based on the imputed rental concept under the rental equivalence method. Given that it has no impact on the cash expenditure of most households in Singapore as they already own their homes, “All Items less imputed rentals on owner-occupied accommodation” is compiled as an additional indicator.
87 Monthly Digest of Statistics Singapore

Prices
15.3 PRICE INDICES OF SELECTED CONSUMER ITEMS
(2009 = 100)
Item Weights 1 2010 2011 Aug 2011 Sep 2011 Oct 2011 Nov 2011 Dec 2011 Jan 2012
Utilities
Water Tariff 70 100.0 100.0 100.0 100.0 100.0 100.0 100.0 100.0
Electricity Tariff 207 114.6 126.9 133.2 133.2 131.7 131.7 131.7 134.7
Gas Tariff 20 113.6 114.7 118.9 118.9 118.9 128.3 128.3 128.3
Liquefied Petroleum Gas 17 109.6 120.1 120.3 120.3 119.7 119.7 119.7 121.3
Private Road Transport
Petrol, 98 Octane 93 107.0 118.6 117.0 118.1 120.5 121.9 121.9 123.6
Petrol, 95 Octane 131 109.2 122.2 121.2 122.3 124.0 123.9 123.2 125.2
Petrol, 92 Octane 19 108.2 122.1 121.2 122.4 124.2 124.1 123.2 125.2
Public Road Transport
Bus Fares 112 99.0 99.6 99.2 99.2 100.5 100.8 100.8 100.8
Train Fares 90 99.2 99.4 99.3 99.3 99.6 99.6 99.6 99.6
Taxi Fares 133 100.0 100.8 100.8 100.8 100.8 100.8 102.9 111.7
Education & Stationery
Primary SchoolMiscellaneous Fees 15 100.0 100.0 100.0 100.0 100.0 100.0 100.0 100.0
Secondary & Junior College, School & Miscellaneous Fees 32 103.1 105.7 105.7 105.7 105.7 105.7 105.7 107.9
Tuition Fees at Polytechnics& Local Universities 100 103.1 107.5 109.7 109.7 109.7 109.7 109.7 109.7
Health Care
Hospitalisation Fees 147 101.9 104.7 104.3 104.6 104.8 105.7 107.6 108.5
Consultation Fees atPolyclinics & General Practitioners 68 101.2 102.9 103.2 103.2 103.3 103.3 103.4 107.0
1 The weighting pattern of the Consumer Price Index (CPI) was derived from the expenditure values collected fromthe 2007/8 Household Expenditure Survey (HES) and updated to 2009, taking into account price changes between 2007/8 and 2009.
88 Monthly Digest of Statistics Singapore

Prices
15.4 AVERAGE RETAIL PRICES OF SELECTED ITEMS
Dollars
Item Unit 2010 2011 Aug 2011 Sep 2011 Oct 2011 Nov 2011 Dec 2011 Jan 2012
Rice & Other CerealsThai Rice 100% Fragrant 5 kg pkt 12.43 12.45 12.16 12.38 12.36 12.52 12.63 12.71 Instant Noodles 5 pkts 2.16 2.23 2.24 2.25 2.26 2.25 2.25 2.24 Ordinary White Bread 400 g 1.40 1.45 1.46 1.46 1.46 1.46 1.46 1.46 Vitamin Enriched Bread 400 g 1.63 1.60 1.64 1.61 1.64 1.64 1.64 1.58 High Fibre Bread 400 g 2.20 2.20 2.20 2.20 2.20 2.20 2.20 2.20
Meat & PoultryChilled Lean Pork Per kg 12.66 12.75 12.64 12.57 12.62 12.73 12.85 13.46 Chilled Streaky Pork Per kg 13.62 13.91 13.92 13.92 13.94 13.96 14.02 14.74 Chilled Pork Rib Bones Per kg 15.84 16.13 16.17 16.13 16.04 15.94 16.23 16.73 Chilled Beef Per kg 20.25 21.23 20.80 20.46 21.65 22.22 21.84 21.52 Chilled Mutton Per kg 15.12 17.60 17.79 17.79 17.79 17.79 17.79 17.79 Hen Per kg 5.54 5.82 5.84 5.78 5.79 5.69 6.01 5.93 Duck Per kg 6.59 6.78 6.79 6.75 6.74 6.68 7.00 6.78 Chilled Chicken Wing Each 0.64 0.66 0.66 0.66 0.66 0.66 0.66 0.68
SeafoodWhite Pomfret Per kg 21.85 24.28 23.99 24.82 24.24 24.39 24.57 30.41 Flowery Grouper Per kg 13.09 14.28 14.84 14.96 14.70 14.32 14.05 16.33 Kurau (cut) Per kg 42.77 44.36 47.29 46.31 44.04 43.73 44.50 50.20 Gold Banded Scad (kuning) Per kg 5.71 6.11 6.38 6.42 6.40 6.27 6.51 6.92 Spanish Mackerel (tenggiri) Per kg 10.15 10.44 10.97 10.65 10.59 10.47 10.89 11.28 Golden Snapper Per kg 15.43 16.74 16.83 17.73 17.36 17.62 16.31 19.03 Sea Bream (kerisi) Per kg 7.22 7.56 7.63 7.68 7.75 7.82 7.85 8.44 Sea Bass Per kg 10.67 12.15 12.55 12.93 13.53 12.85 12.66 13.12 Cod Fish Per kg 39.79 46.30 46.23 47.02 47.41 47.81 49.03 48.65 Salmon Per kg 25.10 26.17 26.19 25.68 25.98 25.39 24.97 25.45 Small Prawns Per kg 10.02 10.47 10.27 10.33 10.23 10.42 10.69 12.88 Medium Prawns Per kg 15.98 16.91 16.99 16.86 17.52 16.94 17.94 21.47 Large Prawns Per kg 21.95 24.01 21.93 22.46 22.91 19.09 21.81 29.06 Squids Per kg 9.81 11.15 11.05 11.03 11.01 11.08 11.34 12.19 Fish Balls Per 10 1.79 1.88 1.87 1.88 1.88 1.90 1.90 1.92
Dairy Products & EggsFresh Milk 1 litre pkt 2.76 2.85 2.78 2.81 2.78 2.85 2.85 2.85 Condensed Milk 397 g tin 1.52 1.65 1.58 1.61 1.65 1.64 1.65 1.65 Infant Milk Powder 900 g tin 35.44 38.81 37.95 38.39 38.54 38.61 38.81 38.85 Cheese Pkt of 12 slices 4.76 5.06 4.92 5.02 5.00 5.07 5.06 5.10 Ice-cream 1.5 litre tub 6.00 6.03 6.07 6.08 6.08 6.10 6.03 5.85 Hen Eggs Per 10 1.85 1.98 1.93 1.84 1.87 2.00 1.98 1.97
Note : Prices may not be strictly comparable with those published earlier due to changes in specifications.
89 Monthly Digest of Statistics Singapore

Prices
15.4 AVERAGE RETAIL PRICES OF SELECTED ITEMS (continued)
Dollars
Item Unit 2010 2011 Aug 2011 Sep 2011 Oct 2011 Nov 2011 Dec 2011 Jan 2012
Cooking Oil 2 kg bottle 5.52 6.04 6.12 6.11 6.05 6.12 6.06 6.00
VegetablesCabbage Per kg 1.73 1.81 1.75 1.76 1.78 1.81 1.81 1.83 Spinach (bayam) Per kg 2.64 2.83 2.50 2.59 2.77 2.71 2.83 2.92 Small Mustard Per kg 2.81 3.16 2.73 2.88 3.03 2.98 3.16 3.05 Kale Per kg 4.02 4.11 3.86 4.01 4.12 4.09 4.11 4.19 Broccoli Per kg 6.83 6.80 6.73 6.67 6.51 6.63 6.80 6.88 Tomatoes Per kg 2.03 1.96 2.06 1.94 2.24 2.36 1.96 2.53 Potatoes Per kg 1.59 1.79 1.71 1.71 1.78 1.80 1.79 1.77 Carrots Per kg 1.90 1.95 1.92 1.93 1.90 1.96 1.95 1.94
Fresh FruitsPapaya Per kg 1.55 1.68 1.80 1.72 1.73 1.66 1.68 1.75 Bananas (emas) Per kg 1.51 1.56 1.53 1.51 1.52 1.52 1.56 1.56 Watermelon Per kg 1.16 1.31 1.21 1.22 1.27 1.39 1.31 1.30 Grapes Per kg 7.47 7.66 7.70 7.71 7.71 7.61 7.66 7.85 Orange Each 0.34 0.34 0.34 0.34 0.34 0.34 0.34 0.34 Apple Each 0.37 0.38 0.38 0.39 0.38 0.38 0.38 0.39 Pear Each 0.88 0.92 0.88 0.88 0.90 0.92 0.92 0.95
Other Food and BeveragesSugar 2 kg pkt 3.16 3.37 3.38 3.38 3.38 3.36 3.38 3.30 Instant Coffee 200 g packaging 9.33 9.79 9.97 9.87 9.73 9.98 9.93 10.01 Chicken Extract ½ doz 16.56 16.60 16.59 16.53 16.28 16.19 16.58 16.51 Food Beverage 400 g tin 4.10 4.17 4.10 4.19 4.25 4.29 4.27 4.25 Beer 330 ml can 3.10 3.09 3.09 3.11 3.12 3.09 3.10 3.09 Aerated Soft Drinks 330 ml can 0.62 0.65 0.64 0.65 0.66 0.66 0.66 0.66 Non-Aerated,
Soft Drinks 6 pkts of 250 ml 2.32 2.36 2.40 2.40 2.39 2.41 2.38 2.22
Petroleum Related Products & CigarettesDiesel Per litre 1.22 1.46 1.46 1.44 1.46 1.47 1.46 1.50 Petrol, 98 Octane Per litre 1.84 2.04 2.02 2.03 2.08 2.10 2.10 2.13 Petrol, 95 Octane Per litre 1.75 1.96 1.94 1.96 1.98 1.98 1.97 2.00 Petrol, 92 Octane Per litre 1.69 1.90 1.89 1.91 1.94 1.93 1.92 1.95 Liquefied Petroleum Gas Per kg 2.87 3.09 3.15 3.00 2.99 2.99 2.99 3.02 Cigarettes 20-stick pack 10.66 10.73 10.71 10.71 10.71 10.71 10.71 10.71
Note : Prices may not be strictly comparable with those published earlier due to changes in specifications.
90 Monthly Digest of Statistics Singapore
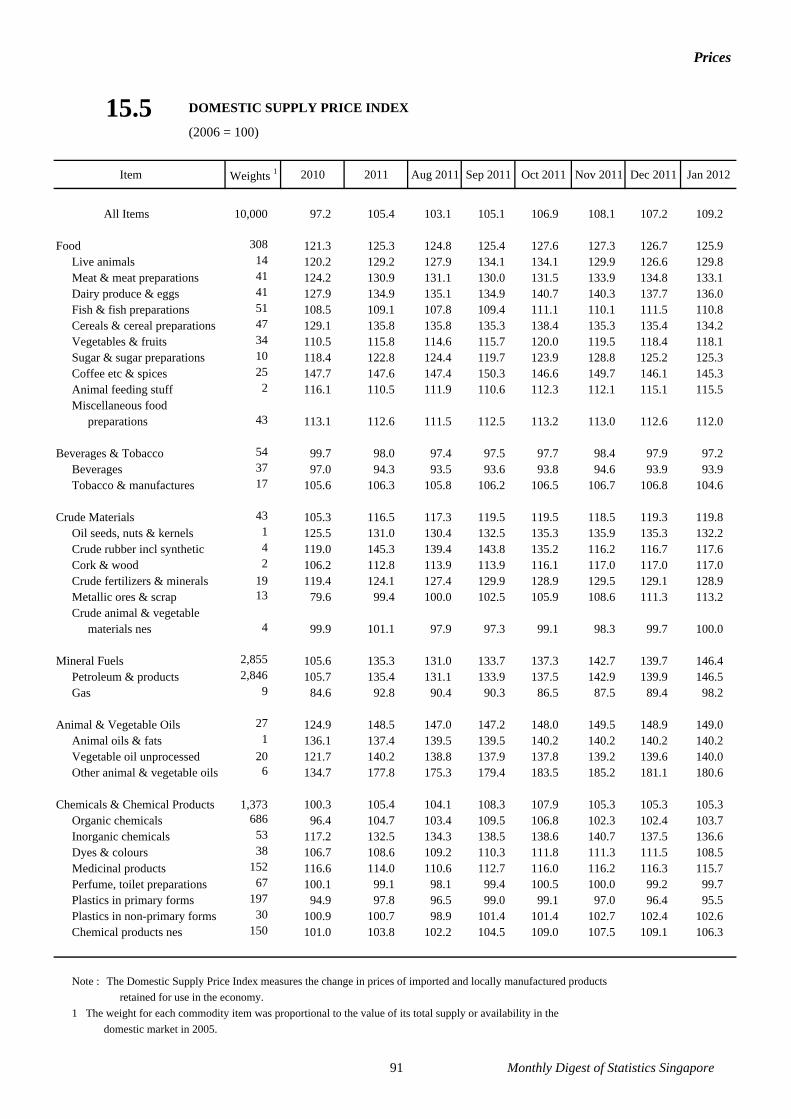
Prices
15.5 DOMESTIC SUPPLY PRICE INDEX
(2006 = 100)
Item Weights 1 2010 2011 Aug 2011 Sep 2011 Oct 2011 Nov 2011 Dec 2011 Jan 2012
All Items 10,000 97.2 105.4 103.1 105.1 106.9 108.1 107.2 109.2
Food 308 121.3 125.3 124.8 125.4 127.6 127.3 126.7 125.9 Live animals 14 120.2 129.2 127.9 134.1 134.1 129.9 126.6 129.8 Meat & meat preparations 41 124.2 130.9 131.1 130.0 131.5 133.9 134.8 133.1 Dairy produce & eggs 41 127.9 134.9 135.1 134.9 140.7 140.3 137.7 136.0 Fish & fish preparations 51 108.5 109.1 107.8 109.4 111.1 110.1 111.5 110.8 Cereals & cereal preparations 47 129.1 135.8 135.8 135.3 138.4 135.3 135.4 134.2 Vegetables & fruits 34 110.5 115.8 114.6 115.7 120.0 119.5 118.4 118.1 Sugar & sugar preparations 10 118.4 122.8 124.4 119.7 123.9 128.8 125.2 125.3 Coffee etc & spices 25 147.7 147.6 147.4 150.3 146.6 149.7 146.1 145.3 Animal feeding stuff 2 116.1 110.5 111.9 110.6 112.3 112.1 115.1 115.5 Miscellaneous food
preparations 43 113.1 112.6 111.5 112.5 113.2 113.0 112.6 112.0
Beverages & Tobacco 54 99.7 98.0 97.4 97.5 97.7 98.4 97.9 97.2 Beverages 37 97.0 94.3 93.5 93.6 93.8 94.6 93.9 93.9 Tobacco & manufactures 17 105.6 106.3 105.8 106.2 106.5 106.7 106.8 104.6
Crude Materials 43 105.3 116.5 117.3 119.5 119.5 118.5 119.3 119.8 Oil seeds, nuts & kernels 1 125.5 131.0 130.4 132.5 135.3 135.9 135.3 132.2 Crude rubber incl synthetic 4 119.0 145.3 139.4 143.8 135.2 116.2 116.7 117.6 Cork & wood 2 106.2 112.8 113.9 113.9 116.1 117.0 117.0 117.0 Crude fertilizers & minerals 19 119.4 124.1 127.4 129.9 128.9 129.5 129.1 128.9 Metallic ores & scrap 13 79.6 99.4 100.0 102.5 105.9 108.6 111.3 113.2 Crude animal & vegetable
materials nes 4 99.9 101.1 97.9 97.3 99.1 98.3 99.7 100.0
Mineral Fuels 2,855 105.6 135.3 131.0 133.7 137.3 142.7 139.7 146.4 Petroleum & products 2,846 105.7 135.4 131.1 133.9 137.5 142.9 139.9 146.5 Gas 9 84.6 92.8 90.4 90.3 86.5 87.5 89.4 98.2
Animal & Vegetable Oils 27 124.9 148.5 147.0 147.2 148.0 149.5 148.9 149.0 Animal oils & fats 1 136.1 137.4 139.5 139.5 140.2 140.2 140.2 140.2 Vegetable oil unprocessed 20 121.7 140.2 138.8 137.9 137.8 139.2 139.6 140.0 Other animal & vegetable oils 6 134.7 177.8 175.3 179.4 183.5 185.2 181.1 180.6
Chemicals & Chemical Products 1,373 100.3 105.4 104.1 108.3 107.9 105.3 105.3 105.3 Organic chemicals 686 96.4 104.7 103.4 109.5 106.8 102.3 102.4 103.7 Inorganic chemicals 53 117.2 132.5 134.3 138.5 138.6 140.7 137.5 136.6 Dyes & colours 38 106.7 108.6 109.2 110.3 111.8 111.3 111.5 108.5 Medicinal products 152 116.6 114.0 110.6 112.7 116.0 116.2 116.3 115.7 Perfume, toilet preparations 67 100.1 99.1 98.1 99.4 100.5 100.0 99.2 99.7 Plastics in primary forms 197 94.9 97.8 96.5 99.0 99.1 97.0 96.4 95.5 Plastics in non-primary forms 30 100.9 100.7 98.9 101.4 101.4 102.7 102.4 102.6 Chemical products nes 150 101.0 103.8 102.2 104.5 109.0 107.5 109.1 106.3
Note : The Domestic Supply Price Index measures the change in prices of imported and locally manufactured productsretained for use in the economy.
1 The weight for each commodity item was proportional to the value of its total supply or availability in the domestic market in 2005.
91 Monthly Digest of Statistics Singapore
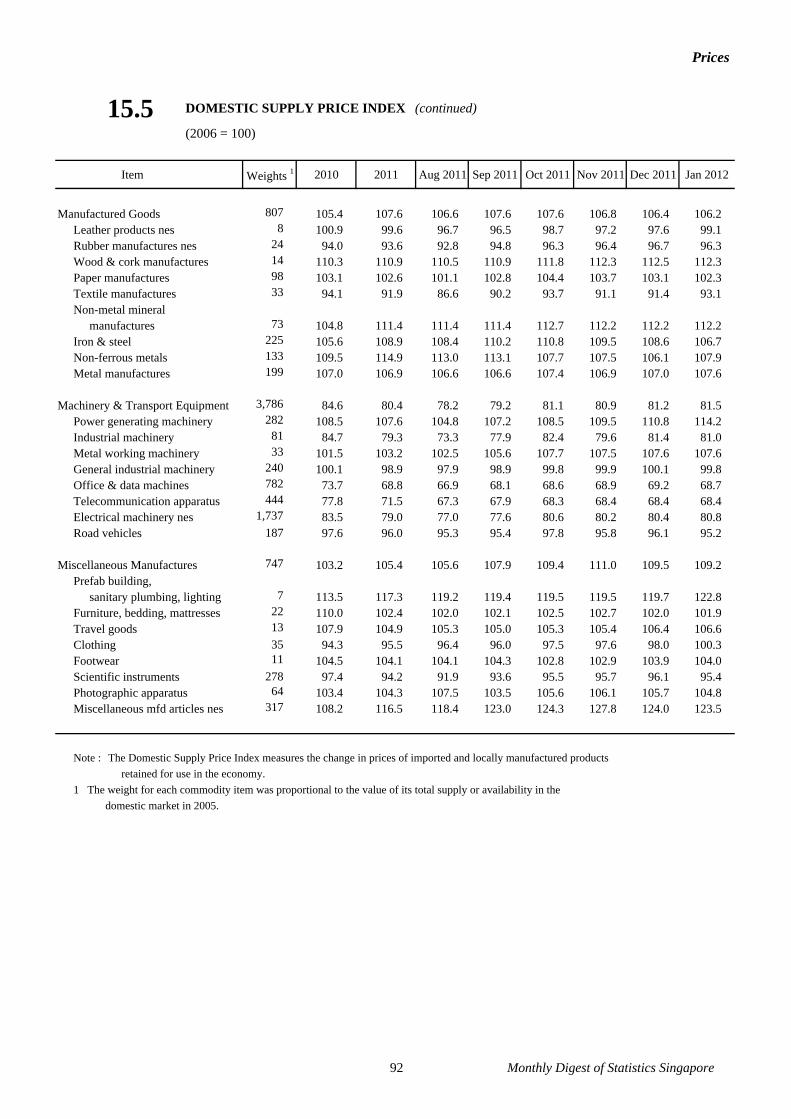
Prices
15.5 DOMESTIC SUPPLY PRICE INDEX (continued)
(2006 = 100)
Item Weights 1 2010 2011 Aug 2011 Sep 2011 Oct 2011 Nov 2011 Dec 2011 Jan 2012
Manufactured Goods 807 105.4 107.6 106.6 107.6 107.6 106.8 106.4 106.2 Leather products nes 8 100.9 99.6 96.7 96.5 98.7 97.2 97.6 99.1 Rubber manufactures nes 24 94.0 93.6 92.8 94.8 96.3 96.4 96.7 96.3 Wood & cork manufactures 14 110.3 110.9 110.5 110.9 111.8 112.3 112.5 112.3 Paper manufactures 98 103.1 102.6 101.1 102.8 104.4 103.7 103.1 102.3 Textile manufactures 33 94.1 91.9 86.6 90.2 93.7 91.1 91.4 93.1 Non-metal mineral
manufactures 73 104.8 111.4 111.4 111.4 112.7 112.2 112.2 112.2 Iron & steel 225 105.6 108.9 108.4 110.2 110.8 109.5 108.6 106.7 Non-ferrous metals 133 109.5 114.9 113.0 113.1 107.7 107.5 106.1 107.9 Metal manufactures 199 107.0 106.9 106.6 106.6 107.4 106.9 107.0 107.6
Machinery & Transport Equipment 3,786 84.6 80.4 78.2 79.2 81.1 80.9 81.2 81.5 Power generating machinery 282 108.5 107.6 104.8 107.2 108.5 109.5 110.8 114.2 Industrial machinery 81 84.7 79.3 73.3 77.9 82.4 79.6 81.4 81.0 Metal working machinery 33 101.5 103.2 102.5 105.6 107.7 107.5 107.6 107.6 General industrial machinery 240 100.1 98.9 97.9 98.9 99.8 99.9 100.1 99.8 Office & data machines 782 73.7 68.8 66.9 68.1 68.6 68.9 69.2 68.7 Telecommunication apparatus 444 77.8 71.5 67.3 67.9 68.3 68.4 68.4 68.4 Electrical machinery nes 1,737 83.5 79.0 77.0 77.6 80.6 80.2 80.4 80.8 Road vehicles 187 97.6 96.0 95.3 95.4 97.8 95.8 96.1 95.2
Miscellaneous Manufactures 747 103.2 105.4 105.6 107.9 109.4 111.0 109.5 109.2 Prefab building,
sanitary plumbing, lighting 7 113.5 117.3 119.2 119.4 119.5 119.5 119.7 122.8 Furniture, bedding, mattresses 22 110.0 102.4 102.0 102.1 102.5 102.7 102.0 101.9 Travel goods 13 107.9 104.9 105.3 105.0 105.3 105.4 106.4 106.6 Clothing 35 94.3 95.5 96.4 96.0 97.5 97.6 98.0 100.3 Footwear 11 104.5 104.1 104.1 104.3 102.8 102.9 103.9 104.0 Scientific instruments 278 97.4 94.2 91.9 93.6 95.5 95.7 96.1 95.4 Photographic apparatus 64 103.4 104.3 107.5 103.5 105.6 106.1 105.7 104.8 Miscellaneous mfd articles nes 317 108.2 116.5 118.4 123.0 124.3 127.8 124.0 123.5
Note : The Domestic Supply Price Index measures the change in prices of imported and locally manufactured products retained for use in the economy.
1 The weight for each commodity item was proportional to the value of its total supply or availability in the domestic market in 2005.
92 Monthly Digest of Statistics Singapore

Prices
15.6 SINGAPORE MANUFACTURED PRODUCTS PRICE INDEX
(2006 = 100)
Item Weights 1 2010 2011 Aug 2011 Sep 2011 Oct 2011 Nov 2011 Dec 2011 Jan 2012
All Items 10,000 89.7 94.5 92.4 93.6 95.7 95.4 95.4 96.7
Food 186 120.1 123.2 123.0 123.6 125.1 124.8 124.7 123.8 Meat & meat preparations 17 116.0 119.1 119.5 119.3 119.3 118.9 119.1 116.8 Dairy produce & eggs 32 114.1 113.4 112.7 115.3 118.8 116.3 117.0 115.8 Fish & fish preparations 12 115.9 119.3 119.4 120.9 121.4 121.9 122.0 121.6 Cereals & cereal preparations 38 123.5 128.9 128.5 128.6 130.7 130.5 130.1 128.7 Vegetables & fruits 5 107.8 112.5 112.4 116.8 116.8 116.8 116.8 116.8 Coffee etc & spices 31 134.7 142.0 143.1 141.2 141.7 142.7 142.2 142.3 Animal feeding stuff 5 115.8 112.5 114.1 112.9 114.4 114.4 117.9 117.9 Miscellaneous food
preparations 46 116.0 117.7 116.6 117.9 119.2 119.0 118.5 117.9
Beverages & Tobacco 47 103.4 103.9 103.6 103.8 103.5 104.0 103.6 103.1 Beverages 27 102.4 101.1 100.6 101.0 100.4 101.3 100.7 101.0 Tobacco & manufactures 20 104.8 107.7 107.8 107.8 107.8 107.8 107.8 106.1
Crude Materials 6 302.3 291.4 286.0 291.7 296.5 299.4 299.6 297.7 Cork & wood 1 103.7 107.9 111.1 111.1 111.1 111.1 111.1 111.1 Crude fertilizers & minerals 3 499.6 476.6 462.4 475.6 484.9 488.4 488.8 483.9 Metallic ores & scrap 1 105.9 105.9 105.9 105.9 105.9 105.9 105.9 105.9 Crude animal & vegetable
materials nes 1 123.9 121.4 129.6 123.3 124.7 133.9 134.2 138.4
Mineral Fuels 2,182 104.4 130.9 126.3 130.7 133.0 135.5 133.7 138.9 Petroleum & products 2,149 104.7 131.4 126.8 131.3 133.7 136.2 134.4 139.5 Gas 33 84.6 92.8 90.4 90.3 86.5 87.5 89.4 98.2
Animal & Vegetable Oils 23 140.2 157.7 160.9 157.1 158.4 156.2 156.3 160.1 Animal oils & fats 1 126.2 184.3 218.6 219.1 238.9 232.1 234.6 235.2 Vegetable oil unprocessed 22 140.6 156.9 159.1 155.2 156.0 153.9 154.0 157.8
Chemicals & Chemical Products 2,053 79.9 83.1 82.2 84.0 84.0 81.6 80.9 81.5 Organic chemicals 1,290 66.2 69.9 69.4 71.0 69.5 66.8 66.1 67.8 Inorganic chemicals 37 107.3 119.9 122.0 123.7 128.5 131.3 130.1 129.1 Dyes & colours 44 104.1 107.7 109.0 109.9 110.6 109.8 110.1 106.4 Medicinal products 138 121.7 115.5 110.2 112.0 116.9 117.0 117.1 115.7 Perfume, toilet preparations 46 99.4 100.9 101.4 101.6 100.4 100.0 98.9 99.0 Plastics in primary forms 377 92.1 96.8 95.4 98.7 99.1 95.8 95.0 94.5 Plastics in non-primary forms 17 120.0 124.0 123.6 125.1 124.6 125.7 126.3 122.8 Chemical products nes 104 115.4 115.0 114.7 115.7 124.9 120.6 121.3 117.4
1 The weights for Singapore Manufactured Products Price Index are compiled based on the production value of the commodity item in 2005.
93 Monthly Digest of Statistics Singapore
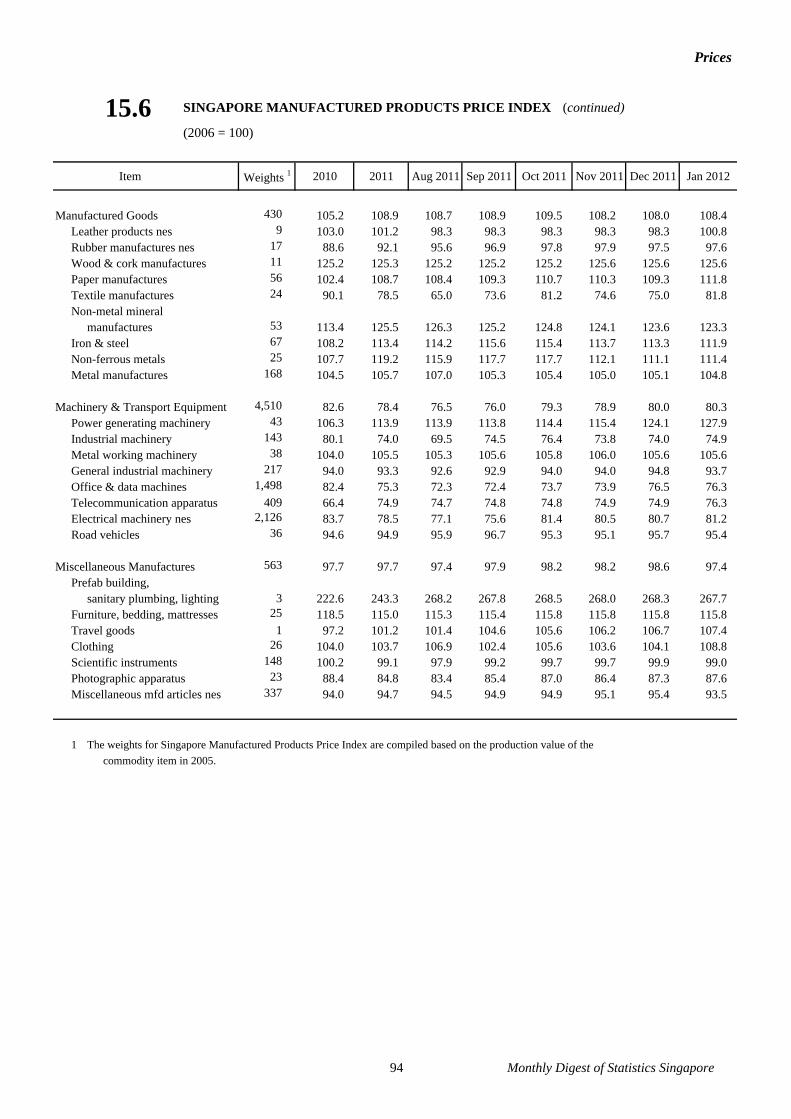
Prices
15.6 SINGAPORE MANUFACTURED PRODUCTS PRICE INDEX (continued)
(2006 = 100)
Item Weights 1 2010 2011 Aug 2011 Sep 2011 Oct 2011 Nov 2011 Dec 2011 Jan 2012
Manufactured Goods 430 105.2 108.9 108.7 108.9 109.5 108.2 108.0 108.4 Leather products nes 9 103.0 101.2 98.3 98.3 98.3 98.3 98.3 100.8 Rubber manufactures nes 17 88.6 92.1 95.6 96.9 97.8 97.9 97.5 97.6 Wood & cork manufactures 11 125.2 125.3 125.2 125.2 125.2 125.6 125.6 125.6 Paper manufactures 56 102.4 108.7 108.4 109.3 110.7 110.3 109.3 111.8 Textile manufactures 24 90.1 78.5 65.0 73.6 81.2 74.6 75.0 81.8 Non-metal mineral
manufactures 53 113.4 125.5 126.3 125.2 124.8 124.1 123.6 123.3 Iron & steel 67 108.2 113.4 114.2 115.6 115.4 113.7 113.3 111.9 Non-ferrous metals 25 107.7 119.2 115.9 117.7 117.7 112.1 111.1 111.4 Metal manufactures 168 104.5 105.7 107.0 105.3 105.4 105.0 105.1 104.8
Machinery & Transport Equipment 4,510 82.6 78.4 76.5 76.0 79.3 78.9 80.0 80.3 Power generating machinery 43 106.3 113.9 113.9 113.8 114.4 115.4 124.1 127.9 Industrial machinery 143 80.1 74.0 69.5 74.5 76.4 73.8 74.0 74.9 Metal working machinery 38 104.0 105.5 105.3 105.6 105.8 106.0 105.6 105.6 General industrial machinery 217 94.0 93.3 92.6 92.9 94.0 94.0 94.8 93.7 Office & data machines 1,498 82.4 75.3 72.3 72.4 73.7 73.9 76.5 76.3 Telecommunication apparatus 409 66.4 74.9 74.7 74.8 74.8 74.9 74.9 76.3 Electrical machinery nes 2,126 83.7 78.5 77.1 75.6 81.4 80.5 80.7 81.2 Road vehicles 36 94.6 94.9 95.9 96.7 95.3 95.1 95.7 95.4
Miscellaneous Manufactures 563 97.7 97.7 97.4 97.9 98.2 98.2 98.6 97.4 Prefab building,
sanitary plumbing, lighting 3 222.6 243.3 268.2 267.8 268.5 268.0 268.3 267.7 Furniture, bedding, mattresses 25 118.5 115.0 115.3 115.4 115.8 115.8 115.8 115.8 Travel goods 1 97.2 101.2 101.4 104.6 105.6 106.2 106.7 107.4 Clothing 26 104.0 103.7 106.9 102.4 105.6 103.6 104.1 108.8 Scientific instruments 148 100.2 99.1 97.9 99.2 99.7 99.7 99.9 99.0 Photographic apparatus 23 88.4 84.8 83.4 85.4 87.0 86.4 87.3 87.6 Miscellaneous mfd articles nes 337 94.0 94.7 94.5 94.9 94.9 95.1 95.4 93.5
1 The weights for Singapore Manufactured Products Price Index are compiled based on the production value of the commodity item in 2005.
94 Monthly Digest of Statistics Singapore

Prices
15.7 IMPORT PRICE INDEX
(2006 = 100)
Item Weights 1 2010 2011 Aug 2011 Sep 2011 Oct 2011 Nov 2011 Dec 2011 Jan 2012
All Items 10,000 93.7 98.2 95.9 97.6 99.3 100.2 99.8 100.9
Food 203 122.3 129.1 130.0 130.9 133.3 132.7 131.4 130.7 Live animals 8 120.2 129.1 127.8 134.0 134.1 129.8 126.5 129.8 Meat & meat preparations 23 125.2 132.2 131.7 131.2 133.2 136.7 137.8 136.6 Dairy produce & eggs 28 133.1 140.4 140.4 141.0 146.7 145.9 143.6 141.8 Fish & fish preparations 38 107.0 107.9 106.2 107.8 110.3 109.2 111.0 110.2 Cereals & cereal preparations 19 134.3 141.7 141.2 141.1 144.9 140.8 141.6 140.7 Vegetables & fruits 35 112.9 123.8 123.2 124.2 127.4 127.6 125.9 125.3 Sugar & sugar preparations 9 119.1 123.8 125.5 120.7 124.9 129.9 126.1 125.9 Coffee etc & spices 23 145.6 163.4 176.3 179.6 178.2 175.5 167.9 166.8 Animal feeding stuff 2 138.7 125.1 124.1 123.2 125.6 123.5 123.4 127.5 Miscellaneous food
preparations 18 111.6 109.2 108.7 108.9 107.6 106.7 106.5 106.6
Beverages & Tobacco 67 100.1 97.4 95.8 96.1 97.7 98.8 99.0 98.6 Beverages 46 97.6 96.0 94.7 94.6 96.3 97.6 97.8 98.0 Tobacco & manufactures 21 105.8 100.4 98.3 99.6 101.0 101.5 101.8 100.1
Crude Materials 66 112.0 123.3 122.7 125.0 123.8 119.4 119.0 119.0 Hides, skins and furskins raw 2 83.0 82.3 83.6 84.4 86.7 86.4 88.2 88.2 Oil seeds, nuts & kernels 1 125.5 131.0 130.4 132.5 135.3 135.9 135.3 132.2 Crude rubber incl synthetic 18 125.0 151.0 146.4 150.8 143.7 125.7 122.6 121.2 Cork & wood 7 104.4 110.1 111.1 111.1 113.3 114.0 114.0 114.0 Textile fibres & waste 3 108.5 110.5 110.5 111.7 112.6 112.9 113.0 118.4 Crude fertilizers & minerals 15 120.4 124.7 128.3 131.0 130.1 130.7 130.3 130.0 Metallic ores & scrap 11 95.8 111.0 111.5 113.5 116.1 118.2 120.3 121.8 Crude animal & vegetable
materials nes 9 102.8 102.0 99.7 99.4 100.4 99.9 100.7 100.9
Mineral Fuels 1,798 106.7 136.5 132.6 135.2 138.8 143.8 141.0 148.3 Petroleum & products 1,798 106.7 136.5 132.6 135.2 138.8 143.8 141.0 148.3
Animal & Vegetable Oils 15 135.4 168.5 164.0 163.6 164.5 168.0 167.3 166.1 Animal oils & fats 1 136.1 137.4 139.5 139.5 140.2 140.2 140.2 140.2 Vegetable oil unprocessed 8 137.4 167.8 161.4 158.0 157.2 162.2 163.5 161.8 Other animal & vegetable oils 6 132.4 172.5 170.1 174.3 177.8 179.5 175.6 175.2
Chemicals & Chemical Products 631 101.2 104.8 104.0 106.3 107.0 106.6 106.7 105.9 Organic chemicals 192 100.5 107.9 107.7 110.2 110.8 109.1 108.9 107.7 Inorganic chemicals 32 122.9 137.1 138.3 143.8 140.6 142.0 136.8 136.1 Dyes & colours 36 104.7 104.4 104.3 105.7 107.3 107.1 107.4 106.3 Medicinal products 81 110.3 110.1 109.3 111.2 112.6 112.6 113.5 114.0 Perfume, toilet preparations 70 100.9 99.6 97.3 98.8 99.1 98.7 98.8 99.4 Plastics in primary forms 82 97.6 99.7 99.8 101.2 101.9 101.6 101.6 99.9 Plastics in non-primary forms 32 97.3 96.1 94.1 96.8 96.7 98.0 97.3 98.5 Chemical products nes 106 92.2 95.7 93.6 96.5 98.1 98.4 100.2 98.4
1 The weights for the Import Price Index are compiled based on the value of the commodity item imported in 2005.
95 Monthly Digest of Statistics Singapore

Prices
15.7 IMPORT PRICE INDEX (continued)
(2006 = 100)
Item Weights 1 2010 2011 Aug 2011 Sep 2011 Oct 2011 Nov 2011 Dec 2011 Jan 2012
Manufactured Goods 761 104.8 107.9 106.2 107.1 107.6 106.9 106.2 106.3 Leather products nes 5 97.0 96.9 93.9 93.0 100.6 95.4 96.9 96.0 Rubber manufactures nes 32 107.0 111.3 110.9 113.5 115.2 115.3 115.9 115.6 Wood & cork manufactures 10 96.4 97.9 97.2 97.9 99.4 99.9 100.1 99.9 Paper manufactures 49 103.0 100.5 98.7 100.6 102.2 101.7 101.6 99.3 Textile manufactures 53 96.5 100.2 99.3 99.7 100.7 101.1 101.3 100.3 Non-metal mineral
manufactures 151 94.7 94.1 93.1 94.3 97.3 97.2 97.7 97.5 Iron & steel 182 102.5 105.8 104.7 106.8 107.7 106.6 105.6 103.7 Non-ferrous metals 136 120.9 131.1 125.3 123.7 119.0 118.6 114.9 118.8 Metal manufactures 143 107.2 109.1 108.8 109.9 111.2 109.3 109.8 110.5
Machinery & Transport Equipment 5,653 84.8 81.9 79.5 81.0 82.3 82.4 82.8 82.5 Power generating machinery 261 106.6 104.8 102.9 104.9 105.6 105.8 107.1 109.8 Industrial machinery 299 96.2 93.4 89.6 90.6 94.4 93.5 94.8 93.4 Metal working machinery 54 98.0 97.7 96.5 99.4 102.4 101.5 102.2 102.2 General industrial machinery 310 103.5 101.9 100.6 102.0 103.1 102.8 103.0 102.9 Office & data machines 1,035 72.8 72.0 71.0 71.8 72.4 72.6 72.8 72.3 Telecommunication apparatus 685 73.6 65.1 59.6 60.2 60.6 60.7 60.8 59.7 Electrical machinery nes 2,803 84.9 81.9 79.6 81.8 83.2 83.6 83.8 83.5 Road vehicles 206 106.2 106.9 106.1 106.0 109.7 107.5 108.4 108.7
Miscellaneous Manufactures 806 100.1 101.3 101.3 103.0 104.4 105.7 104.7 104.9 Prefab building,
sanitary plumbing, lighting 10 104.5 106.6 106.5 106.7 106.8 106.9 107.2 109.8 Furniture, bedding, mattresses 22 109.0 100.9 100.4 100.5 100.9 101.1 100.4 100.3 Travel goods 16 105.5 104.1 104.2 104.2 105.4 105.6 106.3 107.3 Clothing 108 91.9 93.1 93.1 94.0 94.7 95.4 95.8 96.5 Footwear 15 103.6 103.2 103.2 103.4 102.6 102.6 103.3 103.3 Scientific instruments 246 96.0 92.9 90.6 92.3 94.3 94.6 94.9 94.3 Photographic apparatus 130 99.0 98.7 99.9 97.8 99.5 99.9 99.9 101.1 Miscellaneous mfd articles nes 259 106.6 113.6 115.2 119.6 120.7 124.1 120.5 120.6
1 The weights for the Import Price Index are compiled based on the value of the commodity item imported in 2005.
96 Monthly Digest of Statistics Singapore

Prices
15.8 EXPORT PRICE INDEX
(2006 = 100)
Item Weights 1 2010 2011 Aug 2011 Sep 2011 Oct 2011 Nov 2011 Dec 2011 Jan 2012
All Items 10,000 90.5 92.7 90.1 91.9 93.4 94.0 93.8 94.4
Food 102 121.8 133.3 135.2 136.4 137.6 136.7 136.9 135.2 Meat & meat preparations 1 130.1 140.1 145.6 142.0 135.8 135.8 133.6 133.6 Dairy produce & eggs 10 128.8 131.9 130.7 131.9 135.8 134.4 135.5 135.3 Fish & fish preparations 18 107.1 108.1 107.1 108.7 109.3 110.7 110.7 111.5 Cereals & cereal preparations 14 115.9 120.2 119.9 122.0 121.9 122.3 122.5 119.8 Vegetables & fruits 8 129.5 194.3 195.1 205.0 199.4 198.0 196.2 180.6 Sugar & sugar preparations 3 132.4 136.7 133.3 133.1 137.0 137.2 136.4 134.9 Coffee etc & spices 24 130.5 143.0 151.9 149.8 152.3 150.2 149.2 149.0 Animal feeding stuff 4 115.5 115.4 114.2 114.5 114.7 115.5 116.9 118.8 Miscellaneous food
preparations 20 121.2 130.9 131.9 132.9 135.9 133.1 135.6 134.9
Beverages & Tobacco 54 111.7 112.2 110.1 112.4 113.1 114.3 114.0 115.5 Beverages 34 110.3 114.6 112.9 114.8 115.1 116.5 115.7 118.7 Tobacco & manufactures 20 114.1 108.3 105.4 108.4 109.9 110.7 111.1 110.2
Crude Materials 60 139.7 149.4 147.3 150.8 145.9 138.7 136.3 136.5 Hides, skins and furskins raw 2 87.7 85.2 84.6 85.8 85.8 85.8 85.8 85.8 Crude rubber incl synthetic 14 146.9 181.4 173.4 181.7 173.2 148.9 139.9 137.3 Cork & wood 5 99.6 104.1 106.8 107.6 108.8 108.3 110.0 124.0 Pulp & waste paper 4 138.2 154.7 163.2 166.4 157.7 132.9 133.8 131.1 Textile fibres & waste 3 104.2 105.8 105.5 106.8 110.4 111.9 110.2 116.5 Crude fertilizers & minerals 5 424.9 418.9 412.1 425.6 415.5 419.5 421.6 416.8 Metallic ores & scrap 21 96.6 100.8 100.5 100.2 94.9 93.8 91.7 92.1 Crude animal & vegetable
materials nes 6 101.5 95.9 93.3 94.9 95.8 96.2 97.3 96.5
Mineral Fuels 1,518 111.9 143.5 139.9 142.8 145.7 150.2 146.9 152.4 Petroleum & products 1,500 111.8 143.5 139.9 143.0 145.8 150.5 147.0 152.6 Gas 18 120.6 138.2 145.9 132.7 133.0 131.1 133.0 137.7
Animal & Vegetable Oils 11 136.9 153.0 148.8 152.2 150.9 149.1 148.0 149.8 Animal oils & fats 1 122.6 127.3 128.7 132.5 130.1 129.6 134.5 134.5 Vegetable oil unprocessed 7 153.5 175.4 170.7 174.4 171.9 168.7 166.5 169.8 Other animal & vegetable oils 3 101.7 106.7 102.6 105.5 107.0 108.1 108.5 107.1
Chemicals & Chemical Products 1,153 97.5 98.0 96.4 98.5 99.7 98.8 98.6 98.1 Organic chemicals 543 95.4 94.9 92.3 94.9 96.5 95.9 95.4 95.9 Inorganic chemicals 11 117.1 123.9 125.7 126.9 126.8 125.6 124.7 125.6 Dyes & colours 47 93.9 95.2 94.6 97.8 99.1 98.2 100.1 99.2 Medicinal products 130 91.9 88.3 89.1 90.9 90.3 90.6 89.6 88.0 Perfume, toilet preparations 73 97.6 98.2 98.0 98.6 99.4 98.5 98.7 97.0 Plastics in primary forms 235 98.8 101.6 100.5 101.9 101.7 99.7 99.3 97.1 Plastics in non-primary forms 23 104.3 125.8 125.3 126.6 132.1 129.8 131.8 132.4 Chemical products nes 91 111.8 112.4 109.4 111.7 115.5 115.4 116.2 116.0
1 The weights for the Export Price Index are compiled based on the value of the commodity item exported in 2005.
97 Monthly Digest of Statistics Singapore

Prices
15.8 EXPORT PRICE INDEX (continued)
(2006 = 100)
Item Weights 1 2010 2011 Aug 2011 Sep 2011 Oct 2011 Nov 2011 Dec 2011 Jan 2012
Manufactured Goods 463 105.7 108.9 106.9 107.1 106.7 106.9 105.6 106.5 Leather products nes 6 90.4 89.1 88.5 89.8 90.0 90.1 90.1 95.2 Rubber manufactures nes 32 102.3 102.3 101.5 103.2 104.5 104.7 104.7 103.9 Wood & cork manufactures 5 106.3 102.5 98.0 99.1 100.6 101.1 99.2 98.9 Paper manufactures 31 109.3 105.5 102.8 104.4 108.1 108.2 108.8 108.3 Textile manufactures 48 94.7 98.5 97.7 98.4 98.8 100.6 98.7 97.4 Non-metal mineral
manufactures 25 96.2 93.4 92.3 93.4 93.6 93.9 94.8 94.1 Iron & steel 105 112.0 114.5 114.4 113.9 114.6 114.3 114.3 114.1 Non-ferrous metals 96 123.2 139.9 133.4 131.0 126.2 125.3 119.8 124.7 Metal manufactures 115 92.6 89.7 88.9 90.4 90.8 91.6 91.5 92.0
Machinery & Transport Equipment 5,950 80.9 76.1 73.2 74.7 76.3 76.4 77.1 76.7 Power generating machinery 138 100.4 99.5 97.7 98.0 98.9 98.7 99.0 100.5 Industrial machinery 263 86.1 82.6 80.8 85.9 85.6 82.8 83.4 84.4 Metal working machinery 59 89.2 85.1 83.4 84.7 86.2 86.6 86.7 80.6 General industrial machinery 272 99.0 95.7 94.5 95.9 98.3 98.7 98.9 98.9 Office & data machines 1,447 82.7 74.0 69.3 71.7 72.8 73.4 76.4 75.8 Telecommunication apparatus 699 70.3 64.7 62.3 63.4 64.2 64.2 64.4 64.0 Electrical machinery nes 2,952 78.7 75.5 73.1 74.1 76.1 76.2 76.0 75.6 Road vehicles 120 95.4 91.7 89.3 90.4 92.1 92.4 92.5 93.3
Miscellaneous Manufactures 689 93.9 90.7 90.0 91.6 92.7 93.2 93.1 92.9 Prefab building,
sanitary plumbing, lighting 5 114.1 114.1 114.1 114.1 114.1 114.1 114.1 106.1 Furniture, bedding, mattresses 7 82.5 83.8 82.6 83.2 83.7 86.5 86.6 86.9 Travel goods 8 111.4 102.7 99.4 100.8 101.9 102.6 103.1 104.6 Clothing 75 85.5 86.4 86.8 87.1 87.3 87.7 87.4 86.9 Footwear 8 96.0 100.0 99.5 101.9 102.0 102.4 102.4 105.4 Scientific instruments 179 96.3 93.5 92.5 93.5 95.1 95.3 95.4 95.0 Photographic apparatus 99 91.8 86.8 85.3 86.1 87.8 88.9 89.5 89.4 Miscellaneous mfd articles nes 308 94.5 90.7 90.1 92.7 93.6 94.1 93.6 93.6
1 The weights for the Export Price Index are compiled based on the value of the commodity item exported in 2005.
98 Monthly Digest of Statistics Singapore

Prices
15.9 CONSTRUCTION MATERIAL MARKET PRICES
Material Unit 2010 2011 Aug 2011 Sep 2011 Oct 2011 Nov 2011 Dec 2011 Jan 2012
Cement in Bulk (Ordinary Portland Cement) $/Tonne 89.14 93.78 94.20 94.30 95.50 96.10 96.20 97.00
Steel Bars 1
(16-32mm High Tensile) $/Tonne 833.41 931.26 946.50 946.00 944.80 922.20 913.40 906.00
Granite 2
(20mm Aggregate) $/Tonne 19.63 21.58 20.20 20.40 20.40 19.90 19.80 19.80
Concreting Sand 2 $/Tonne 28.19 25.96 24.70 24.00 24.10 24.10 24.50 24.00
Ready Mixed Concrete 3 $/m3 95.44 108.99 109.90 109.50 108.90 108.10 108.00 108.00
Source : Building and Construction Authority1 The market prices of steel bars are based on fixed price supply contracts with contract period 6 months or less.2 The prices of granite and concreting sand exclude delivery charges to concrete batching plants.3 The prices are based on new contracts with non-fixed price, fixed price and market retail price for “Grade 40 Pump”.
99 Monthly Digest of Statistics Singapore

Prices
15.10 PRICE INDEX OF HOUSING & DEVELOPMENT BOARD RESALE FLATS
(4th Quarter 1998 = 100)
2010 Q3 2010 Q4 2011 Q1 2011 Q2 2011 Q3 2011 Q4
Resale Price Index 167.8 172.0 174.8 180.3 187.2 190.4
Source : Housing & Development Board
Note : The index is based on average resale price by date of registration. Weights are based on 12-quarter moving average transactions.
15.11 PRIVATE PROPERTY PRICE INDEX BY TYPE OF PROPERTY
(4th Quarter 1998 = 100)
Type of Property 2010 Q3 2010 Q4 2011 Q1 2011 Q2 2011 Q3 2011 Q4P
Residential 189.6 194.8 199.1 203.0 205.7 206.2
Landed 201.8 212.9 221.2 229.1 234.5 234.8 Detached 212.4 230.4 239.8 247.6 249.2 250.2 Semi-Detached 192.5 198.4 204.0 211.9 219.8 218.5 Terrace 196.7 204.0 212.0 220.0 228.6 229.1
Non-Landed 186.3 189.7 192.9 195.6 197.8 198.4 Apartment 196.7 201.4 203.1 206.8 209.0 209.5 Condominium 182.1 185.0 188.8 191.1 193.3 194.1
Commercial
Office Space 104.1 109.4 114.8 118.9 123.3 124.5 Shop Space 113.1 114.7 115.3 116.6 120.6 120.8
Industrial 106.9 113.8 123.3 130.1 139.2 144.7
Multiple-User Factory 107.1 113.8 123.6 130.6 139.3 144.6 Multiple-User Warehouse 104.9 113.9 120.5 126.0 137.8 145.8
Source : Urban Redevelopment AuthorityNote : The weights used to compute the index are updated every quarter from 4th Quarter 1998.
100 Monthly Digest of Statistics Singapore

Prices
15.12 PRICE INDICES OF NON-LANDED PRIVATE RESIDENTIAL
PROPERTIES BY LOCALITY AND COMPLETION STATUS 1
(4th Quarter 1998 = 100)
2010 Q3 2010 Q4 2011 Q1 2011 Q2 2011 Q3 2011 Q4P
Core Central Region 2
All 198.0 202.4 204.6 207.9 209.4 210.5 Uncompleted 199.0 202.9 203.0 205.8 206.7 207.9
Completed 1 196.1 201.5 207.4 211.7 213.9 214.5
Rest of Central Region 3
All 177.5 180.8 184.5 186.6 188.8 189.0 Uncompleted 184.0 186.9 188.8 189.7 190.8 191.2
Completed 1 169.3 173.3 179.1 182.8 186.4 186.4
Outside Central Region
All 174.6 178.2 183.7 186.9 190.8 191.9 Uncompleted 182.3 187.7 192.3 193.6 196.4 197.2
Completed 1 159.3 161.1 166.4 171.2 176.0 177.2
Source : Urban Redevelopment Authority1 A building project is deemed completed when the Certificate of Statutory Completion (CSC) in respect of that
building is issued by the Commissioner of Building Control and the title of all the units in the project has been transferred to the purchasers.
2 Refer to Postal Districts 9, 10, 11, Downtown Core and Sentosa.3 Refer to Central Region outside postal districts 9, 10, 11, Downtown Core and Sentosa.
Note : Map of Central Region and areas in Core Central Region is available in the Urban Redevelopment Authority's website.
101 Monthly Digest of Statistics Singapore

Prices
15.13 COMMERCIAL PROPERTY RENTAL INDEX BY TYPE OF PROPERTY
(4th Quarter 1998 = 100)
Type of Property 2010 Q3 2010 Q4 2011 Q1 2011 Q2 2011 Q3 2011 Q4
Office Space
Central Region 152.3 159.4 168.0 170.6 172.2 172.8
Central Area 156.2 163.6 172.0 174.4 175.9 176.8
Fringe Area 127.4 131.5 138.9 142.6 142.9 142.7
Shop Space
Central Region 114.7 116.6 117.5 118.4 119.0 119.6
Central Area 117.6 119.5 120.0 120.8 121.9 122.5
Fringe Area 102.2 104.1 106.1 107.6 107.7 108.6
Source : Urban Redevelopment AuthorityNote : Data refer to properties owned by the private sector.
The weights used to compute the index are updated every quarter from 4th Quarter 1998.
102 Monthly Digest of Statistics Singapore

Health
16.1 HOSPITAL ADMISSIONS AND PUBLIC SECTOR OUTPATIENT ATTENDANCES
Number
2010 2011 Aug 2011 Sep 2011 Oct 2011 Nov 2011 Dec 2011 Jan 2012
Hospital Admissions 1 450,323 469,441 38,116 39,535 39,779 39,538 39,596 37,611
Public Sector Hospitals 2 343,332 357,022 29,092 29,941 29,843 30,075 30,211 28,588
Private Sector Hospitals 3 106,991 112,419 9,024 9,594 9,936 9,463 9,385 9,023
Public Sector Outpatient Attendances
Specialist Outpatient Clinics 4 4,023,686 4,234,428 361,968 371,623 342,482 361,295 338,195 339,576
Accident & Emergency Departments 858,781 934,485 76,087 76,610 82,236 79,388 79,444 85,885
Polyclinics 4,314,496 4,519,038 363,034 411,121 380,685 380,409 388,360 362,686
Dental Clinics 5 862,874 863,187 71,872 77,957 64,552 63,248 43,312 68,657
Source : Ministry of Health1 Data refer to inpatient discharges for all hospitals.2 Includes specialty centres.3 Includes community hospitals and chronic sick hospitals.4 Excludes staff attendances.5 Includes dental services in Hospitals, Polyclinics, School Dental Clinics and National Dental Centre
16.2 ADMISSIONS TO PUBLIC SECTOR HOSPITALS
Number
Hospital 2010 2011 Aug 2011 Sep 2011 Oct 2011 Nov 2011 Dec 2011 Jan 2012
Total 343,332 357,022 29,092 29,941 29,843 30,075 30,211 28,588
Alexandra Hospital 14,930 13,742 1,143 1,206 1,225 1,259 1,342 1,252 Changi General Hospital 38,190 38,879 3,245 3,330 3,238 3,363 3,295 3,216
Khoo Teck Puat Hospital 1 12,054 28,433 2,228 2,258 2,294 2,421 2,335 2,189 National University Hospital 59,842 56,613 4,475 4,605 4,618 4,648 4,721 4,462 Singapore General Hospital 73,606 74,943 6,108 6,301 6,136 6,414 6,418 6,095 Tan Tock Seng Hospital 58,543 56,150 4,879 4,854 4,684 4,573 4,840 4,454 Communicable Disease Centre 1,627 1,574 137 127 135 124 134 151 Institute of Mental Health /
Woodbridge Hospital 9,759 9,628 805 782 784 781 830 734 K K Women's & Children's Hospital 64,558 67,471 5,342 5,684 5,975 5,760 5,510 5,343 National Heart Centre 10,223 9,589 730 794 754 732 786 692
Source : Ministry of HealthNote : Data refer to inpatient discharges for all hospitals.1 Inpatient services started wef 28 June 2010
103 Monthly Digest of Statistics Singapore

Community Services
17.1 NUMBER AND CAPACITY OF CHILD CARE CENTRES
(End of Period) Number
2010 2011 2010 Q3 2010 Q4 2011 Q1 2011 Q2 2011 Q3 2011 Q4
Number 874 955 849 874 907 920 939 955
Capacity 77,792 85,790 75,218 77,792 81,016 82,370 84,161 85,790
Source :
17.2 ENROLMENT IN CHILD CARE CENTRES BY TYPE OF
PROGRAMME AND ORGANISATION(End of Period)
Number
2010 2011 2010 Q3 2010 Q4 2011 Q1 2011 Q2 2011 Q3 2011 Q4
Total 63,955 73,900 65,712 63,955 66,455 69,890 72,795 73,900
Full-Day Programme 53,903 63,091 54,826 53,903 55,819 59,203 61,912 63,091
Voluntary 18,778 23,281 19,289 18,778 20,472 21,827 22,818 23,281 NTUC 5,601 7,527 5,605 5,601 6,489 6,988 7,288 7,527 PCF 3,759 5,429 3,411 3,759 4,402 4,825 5,295 5,429
Workplace 3,614 3,948 3,815 3,614 3,682 3,839 3,931 3,948
Private 31,511 35,862 31,722 31,511 31,665 33,537 35,163 35,862
Half-Day Programme 8,014 8,734 8,563 8,014 8,534 8,644 8,807 8,734
Flexicare Programme 2,038 2,075 2,323 2,038 2,102 2,043 2,076 2,075
Source : Ministry of Community Development, Youth and SportsNTUC refers to National Trades Union Congress.PCF refers to PAP Community Foundation.
Ministry of Community Development, Youth and Sports
104 Monthly Digest of Statistics Singapore

Community Services
17.3 PUBLIC ASSISTANCE RECIPIENTS BY CATEGORY
(End of Period) Number
2010 2011 2010 Q3 2010 Q4 2011 Q1 2011 Q2 2011 Q3 2011 Q4
Total 2,929 3,034 2,889 2,929 2,942 2,985 3,000 3,034
Aged Destitutes 2,482 2,589 2,450 2,482 2,496 2,535 2,553 2,589
Medically Unfit for Work 206 203 196 206 207 208 207 203
Abandoned/Distressed Wives& Orphans 24 21 22 24 22 22 21 21
Disabled Persons Under 60 215 220 219 215 216 219 218 220
Widows with ChildrenUnder 12 Years Old 2 1 2 2 1 1 1 1
People's Association Note: Refers to the number of households under the Public Assistance (PA) Scheme.
17.4 RESIDENTS IN OLD FOLKS' HOMES BY TYPE OF ORGANISATION AND SEX
(End of Period) Number
2010 2011 2010 Q3 2010 Q4 2011 Q1 2011 Q2 2011 Q3 2011 Q4
Total 9,755 9,904 9,702 9,755 9,871 9,819 9,842 9,904 Males 4,603 4,765 4,576 4,603 4,687 4,673 4,716 4,765 Females 5,152 5,139 5,126 5,152 5,184 5,146 5,126 5,139
Government Welfare Homes 1 1,173 1,189 1,184 1,173 1,235 1,238 1,203 1,189 Males 923 938 933 923 981 972 948 938 Females 250 251 251 250 254 266 255 251
Sheltered Housing / Community Homes 670 697 690 670 679 669 696 697
Males 330 343 322 330 345 330 337 343 Females 340 354 368 340 334 339 359 354
Voluntary Nursing Homes 5,033 4,979 5,015 5,033 5,029 4,981 5,012 4,979 Males 2,173 2,142 2,176 2,173 2,165 2,164 2,212 2,142 Females 2,860 2,837 2,839 2,860 2,864 2,817 2,800 2,837
Commercial Nursing Homes 2,879 3,039 2,813 2,879 2,928 2,931 2,931 3,039 Males 1,177 1,342 1,145 1,177 1,196 1,207 1,219 1,342 Females 1,702 1,697 1,668 1,702 1,732 1,724 1,712 1,697
Source : Government Welfare Homes and Sheltered Housing/Community Homes - Ministry of Community Development, Youth and SportsVoluntary Nursing Homes and Commercial Nursing Homes - Ministry of Health
1 Data include only those aged 60 years and above.
Source : Ministry of Community Development, Youth and Sports
105 Monthly Digest of Statistics Singapore
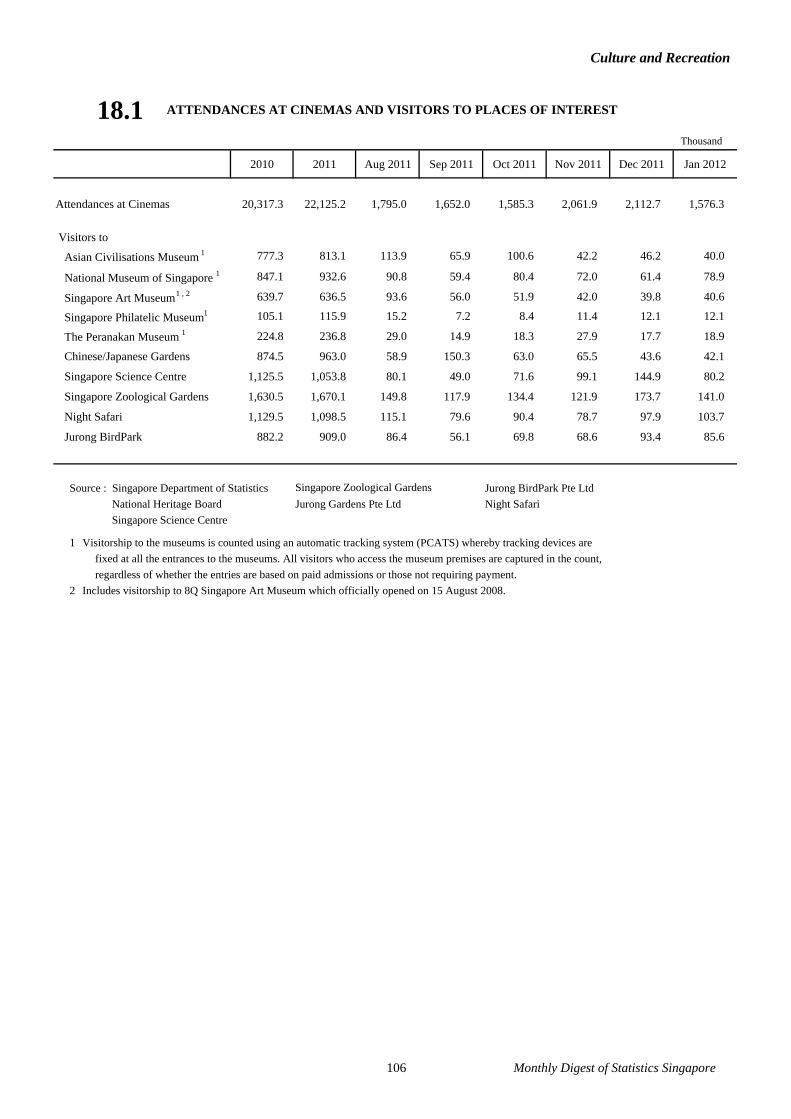
Culture and Recreation
18.1 ATTENDANCES AT CINEMAS AND VISITORS TO PLACES OF INTEREST
Thousand
2010 2011 Aug 2011 Sep 2011 Oct 2011 Nov 2011 Dec 2011 Jan 2012
Attendances at Cinemas 20,317.3 22,125.2 1,795.0 1,652.0 1,585.3 2,061.9 2,112.7 1,576.3
Visitors to
Asian Civilisations Museum 1 777.3 813.1 113.9 65.9 100.6 42.2 46.2 40.0
National Museum of Singapore 1 847.1 932.6 90.8 59.4 80.4 72.0 61.4 78.9
Singapore Art Museum 1 , 2 639.7 636.5 93.6 56.0 51.9 42.0 39.8 40.6
Singapore Philatelic Museum 1 105.1 115.9 15.2 7.2 8.4 11.4 12.1 12.1
224.8 236.8 29.0 14.9 18.3 27.9 17.7 18.9
Chinese/Japanese Gardens 874.5 963.0 58.9 150.3 63.0 65.5 43.6 42.1
Singapore Science Centre 1,125.5 1,053.8 80.1 49.0 71.6 99.1 144.9 80.2
Singapore Zoological Gardens 1,630.5 1,670.1 149.8 117.9 134.4 121.9 173.7 141.0
Night Safari 1,129.5 1,098.5 115.1 79.6 90.4 78.7 97.9 103.7
Jurong BirdPark 882.2 909.0 86.4 56.1 69.8 68.6 93.4 85.6
Source : Singapore Department of Statistics Jurong BirdPark Pte Ltd National Heritage Board Jurong Gardens Pte Ltd Night Safari Singapore Science Centre
1 Visitorship to the museums is counted using an automatic tracking system (PCATS) whereby tracking devices arefixed at all the entrances to the museums. All visitors who access the museum premises are captured in the count,regardless of whether the entries are based on paid admissions or those not requiring payment.
2 Includes visitorship to 8Q Singapore Art Museum which officially opened on 15 August 2008.
The Peranakan Museum 1
Singapore Zoological Gardens
106 Monthly Digest of Statistics Singapore

Culture and Recreation
18.2 UTILISATION OF SPORTS FACILITIES
Number
2010 2011P 2010 Q3 2010 Q4 2011 Q1 2011 Q2 2011 Q3 2011 Q4P
AttendancesSwimming pool 7,163,669 6,939,334 1,630,343 1,773,012 1,529,560 1,933,042 1,900,550 1,576,183 Gymnasium 1,823,321 1,984,865 435,899 472,206 458,102 486,062 517,699 523,002
BookingsTotal 699,973 836,591 162,875 204,793 185,475 205,643 223,129 222,344
Tennis 115,900 129,244 24,000 32,568 29,954 32,197 35,865 31,228 Badminton 1 401,390 472,852 94,905 119,843 105,445 115,301 123,700 128,406 Squash 25,119 32,902 6,010 6,863 7,449 8,055 8,564 8,834 Netball 6,728 6,702 1,001 1,768 1,583 1,665 1,894 1,560 Soccer 19,687 24,122 5,137 4,216 5,360 6,132 6,400 6,230 Hockey 3,748 4,449 807 832 995 1,200 1,176 1,078 Rugby 444 401 114 109 76 107 121 97 Athletics 509 411 76 19 205 132 54 20 Table-tennis 1 61,081 72,710 17,059 18,098 16,514 16,793 19,186 20,217 Basketball 1 19,726 27,977 4,861 6,115 5,071 6,735 8,059 8,112 Volleyball 1 9,895 13,116 2,028 4,018 2,650 3,079 3,899 3,488 Others 2 35,746 51,705 6,877 10,344 10,173 14,247 14,211 13,074
Source : Singapore Sports Council (SSC)Note : Refers to sports facilities provided by SSC.1 Refers to bookings of sports hall facilities managed by SSC.2 Refers to other bookings at sports hall facilities managed by SSC, eg fencing, floorball etc.
107 Monthly Digest of Statistics Singapore
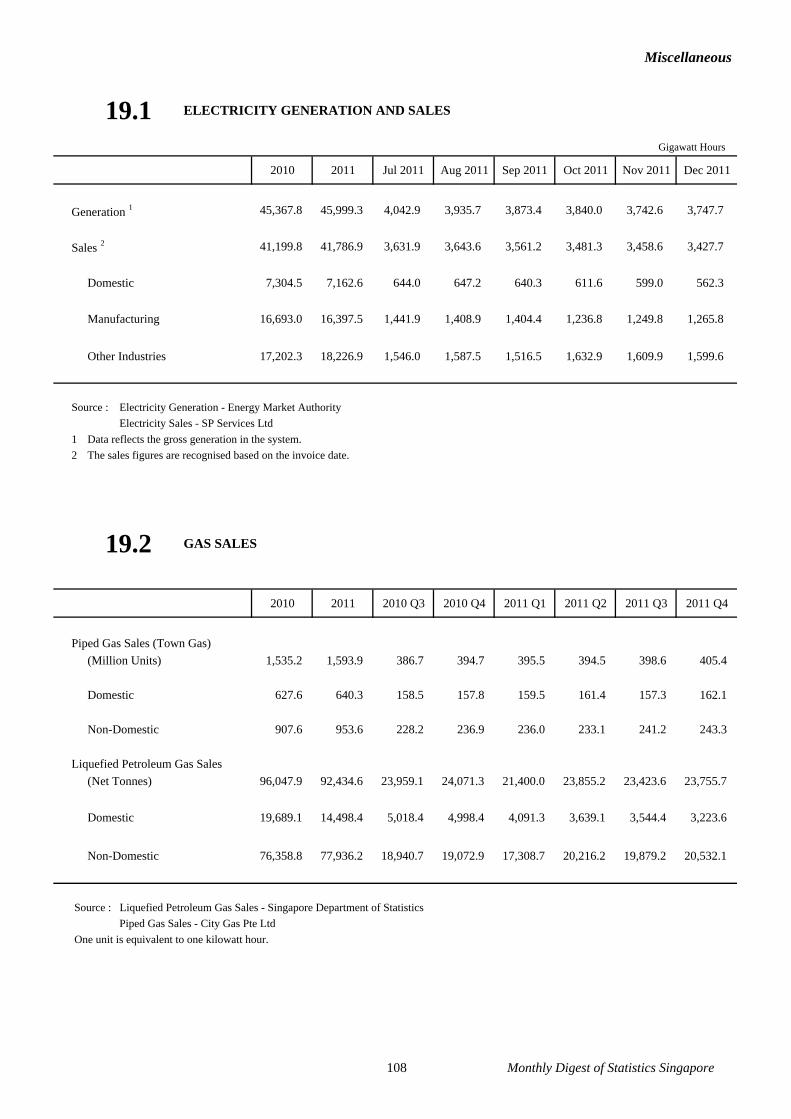
Miscellaneous
19.1 ELECTRICITY GENERATION AND SALES
2010 2011 Jul 2011 Aug 2011 Sep 2011 Oct 2011 Nov 2011 Dec 2011
Generation 1 45,367.8 45,999.3 4,042.9 3,935.7 3,873.4 3,840.0 3,742.6 3,747.7
Sales 2 41,199.8 41,786.9 3,631.9 3,643.6 3,561.2 3,481.3 3,458.6 3,427.7
Domestic 7,304.5 7,162.6 644.0 647.2 640.3 611.6 599.0 562.3
Manufacturing 16,693.0 16,397.5 1,441.9 1,408.9 1,404.4 1,236.8 1,249.8 1,265.8
Other Industries 17,202.3 18,226.9 1,546.0 1,587.5 1,516.5 1,632.9 1,609.9 1,599.6
Source : Electricity Generation - Energy Market Authority Electricity Sales - SP Services Ltd
1 Data reflects the gross generation in the system.2 The sales figures are recognised based on the invoice date.
19.2 GAS SALES
2010 2011 2010 Q3 2010 Q4 2011 Q1 2011 Q2 2011 Q3 2011 Q4
Piped Gas Sales (Town Gas) (Million Units) 1,535.2 1,593.9 386.7 394.7 395.5 394.5 398.6 405.4
Domestic 627.6 640.3 158.5 157.8 159.5 161.4 157.3 162.1
Non-Domestic 907.6 953.6 228.2 236.9 236.0 233.1 241.2 243.3
Liquefied Petroleum Gas Sales(Net Tonnes) 96,047.9 92,434.6 23,959.1 24,071.3 21,400.0 23,855.2 23,423.6 23,755.7
Domestic 19,689.1 14,498.4 5,018.4 4,998.4 4,091.3 3,639.1 3,544.4 3,223.6
Non-Domestic 76,358.8 77,936.2 18,940.7 19,072.9 17,308.7 20,216.2 19,879.2 20,532.1
Source : Liquefied Petroleum Gas Sales - Singapore Department of StatisticsPiped Gas Sales - City Gas Pte Ltd
One unit is equivalent to one kilowatt hour.
Gigawatt Hours
108 Monthly Digest of Statistics Singapore

Miscellaneous
19.3 LIVESTOCK SLAUGHTERED AND FISH SUPPLY AND WHOLESALE
2010 2011 Aug 2011 Sep 2011 Oct 2011 Nov 2011 Dec 2011 Jan 2012
Livestock Slaughtered
Poultry ('000) 50,976 52,156 4,711 4,240 4,393 4,401 4,691 4,415
Chickens 44,659 46,196 4,196 3,769 3,916 3,937 4,141 3,914
Ducks 6,317 5,960 515 471 477 464 550 501
Pigs (No) 288,904 311,282 27,110 24,295 26,436 26,048 25,986 25,173
Fish Supply 1 (Tonnes)
Local Production 1,589 na 176 57 166 167 na na
Imports 134,547 132,937 12,143 11,683 11,524 11,048 12,000 9,554
Exports 40,215 32,311 2,394 3,706 2,402 2,844 2,803 1,690
Fish Wholesale 1,2 (Tonnes) 58,744 na 5,788 5,573 6,606 5,800 na na
Source : Livestock Slaughtered, Fish Supply (Local Production) and Fish Wholesale - Agri-Food & Veterinary Authority Fish Supply (Imports and Exports) - International Enterprise Singapore
Note : Data are based on Standard International Trade Classification (SITC) Rev 4.11 Excludes dried, salted and fish in brine.2 Data include ' Low-value fish'.
19.4
2010 2011 Aug 2011 Sep 2011 Oct 2011 Nov 2011 Dec 2011 Jan 2012
Petitions/Applications For Bankruptcy 2,202 2,314 184 245 205 208 185 207
Bankruptcy Orders Made 1,537 1,527 95 176 113 122 147 114
Bankruptcy Discharges 2,252 1,391 81 86 71 86 123 56
Source : Insolvency and Public Trustee's Office
NUMBER OF BANKRUPTCY PETITIONS/APPLICATIONS,ORDERS MADE AND DISCHARGES
109 Monthly Digest of Statistics Singapore
SINGAPORE DEPARTMENT OF STATISTICS INFORMATION DISSEMINATION SERVICES
Statistics Singapore Website
The Statistics Singapore Website was launched by the Singapore Department of Statistics (DOS) in January 1995. Internet users can access the website by connecting to:
http://www.singstat.gov.sg
Key Singapore statistics are available via the following sections: Statistics
which provides key data on Singapore’s economy and population. News
which covers the Performance of Singapore Economy, the Consumer Price Index, the Wholesale Trade Index, Business Receipts Index for Service Industries, Retail Sales and Catering Trade Indices, Manufacturing Performance, Singapore External Trade, Tourism Sector Performance, Real Estate Information and Employment Situation.
Publications – Papers & Analyses which provides papers on economic and social topics.
Themes which presents official statistics compiled by DOS and the Research and Statistics Units in the various ministries and statutory boards according to themes. Within each theme, relevant statistics and related press releases, publications and references are provided.
Statistical resources are available via:
Publication Catalogue which lists the latest editions of publications released by DOS at http://www.singstat.gov.sg/pubn/catalog.html. All softcopy DOS publications are available for free downloading. Statistical tables of DOS publications in Excel format are also available.
Advance Release Calendar which covers key Singapore economic indicators.
The website also provides a convenient gateway to international statistical websites under the “Statistical Resources” section:
Guide to International Statistics which covers international databases, classifications and links, and statistical terms and definitions.
IMF Dissemination Standards Bulletin Board which provides metadata about Singapore’s key indicators in the real, fiscal, financial and external sectors, including dissemination practices and information about pre-release access of current indicators.
SingStat Express
SingStat Express is a personalised data delivery service which sends the latest press releases, notices of publication, newsletter, occasional and information papers to subscribers via email. SMS alert service is also available to local users. Subscription details are available from the Statistics Singapore Website (www.singstat.gov.sg/express).
109
SINGAPORE DEPARTMENT OF STATISTICS INFORMATION DISSEMINATION SERVICES (cont'd)
Really Simple Syndication
Really Simple Syndication (RSS) is an easy way to stay updated on the latest statistical news released via the Statistics Singapore Website. The SingStat RSS feed delivers statistical news highlights and hyperlinks to the source documents whenever the updates are posted. More information is available at http://www.singstat.gov.sg/svcs/rss.html. Data on SMS
Data on SMS is a free mobile service for local data users to receive the latest data for key indicators via SMS. Simply key data and SMS to 74688 (or SGOVT) for the service. More information is available at http://www.singstat.gov.sg/svcs/dataonsms.html. SingStat Time Series (STS) Online System
The SingStat Time Series (STS) Online System is an internet-accessible time series retrieval system. The STS includes more than 7,000 historical data series on Singapore society and economy from several domains, including national accounts, balance of payments, investments, finance, labour, prices, business expectations, trade, manufacturing, tourism, demography, health and education.
Besides the usual monthly, quarterly and annual data, STS includes also seasonally adjusted data series for key economic indicators providing for a better analysis and understanding of current economic trends. The STS also offers:
Web-based search engine that is easy to use; “Bookmark” features that enable users to save and organise links in their personalised portals.
Subscription to STS is opened to local and overseas users. More information on STS is available via Statistics
Singapore Website. For enquiries, please contact our Department at Tel: 6332-7119. E-survey
The E-survey enables business organisations to complete and submit their survey forms through the internet. Using secured encryption protocols, the E-survey ensures that the information transmitted through the net is secured and protected. The system features online helps and validation checks to assist respondents in completing their survey forms. With the E-survey, respondents can do away with the tedious paper work and manual tasks of mailing or faxing their survey returns to the Department.
Statistical Enquiries and Feedback
If you have any statistical enquiries or comment or suggestions on our statistical publications and electronic services, you are welcomed to:
E-mail us at [email protected] Fax to us at (65) 6332-7689 Call us at 1800-3238118* (local callers)
(65) 6332-7738 (overseas callers)
* Calls from mobile telephone lines to 1800 local toll free number may be subject to mobile airtime charges as imposed by the relevant mobile service provider.
110
PUBLICATIONS SECTION
Senior Assistant Director Miss Ang Seow Long Manager Ms Wong Pui Mun Management Support Officers Miss Koh Wan Ting Ms Nurasikin Ahmad
Nurasikin
Typewritten Text
Nurasikin
Typewritten Text