Monthly Bulletin October 2012 - Europa
194
EUROPEAN CENTRAL BANK MONTHLY BULLETIN EN MONTHLY BULLETIN OCTOBER 1012012 0112012 0212012 0312012 0412012 0512012 0612012 0712012 0812012 0912012 1012012 1112012 1212012
Transcript of Monthly Bulletin October 2012 - Europa

EURO
PEAN
CEN
TRAL
BAN
K
MO
NTH
LY B
ULL
ETI
NEN
MONTHLY BULLET INOCTOBER
1012
012 0112012
02120120312012041201205120120612012071201208120120912012101201211120121212012

MONTHLY BULLET IN
OCTOBER 2012
In 2012 all ECBpublications
feature a motiftaken from
the €50 banknote.

© European Central Bank, 2012
Address Kaiserstrasse 29
60311 Frankfurt am Main
Germany
Postal address Postfach 16 03 19
60066 Frankfurt am Main
Germany
Telephone +49 69 1344 0
Website http://www.ecb.europa.eu
Fax +49 69 1344 6000
This Bulletin was produced under the responsibility of the Executive Board of the ECB. Translations are prepared and published by the national central banks.
All rights reserved. Reproduction for educational and non-commercial purposes is permitted provided that the source is acknowledged.
The cut-off date for the statistics included in this issue was 2 October 2012.
ISSN 1561-0136 (print)
ISSN 1725-2822 (online)

3ECB
Monthly Bulletin
October 2012
EDITORIAL 5
ECONOMIC AND MONETARY
DEVELOPMENTS
The external environment of the euro area 11
Monetary and fi nancial developments 20
Prices and costs 38
Output, demand and the labour market 47
Boxes:
Compliance of outright monetary 1
transactions with the prohibition
on monetary fi nancing 7
Developments in the housing market 2
in China 14
The impact of very low interest rates 3
on monetary dynamics 21
Recent developments in consumer 4
prices for oil products 38
Stock prices and economic growth 5 47
ARTICLES
Global liquidity: concepts,
measurements and implications
from a monetary policy perspective 55
Euro area labour markets and the crisis 69
EURO AREA STATISTICS S1
ANNEXES
Chronology of monetary policy
measures of the Eurosystem I
Publications produced by the European
Central Bank V
Glossary V I I
CONTENTS

4ECB
Monthly Bulletin
October 2012
ABBREVIATIONS
COUNTRIES LU Luxembourg
BE Belgium HU Hungary
BG Bulgaria MT Malta
CZ Czech Republic NL Netherlands
DK Denmark AT Austria
DE Germany PL Poland
EE Estonia PT Portugal
IE Ireland RO Romania
GR Greece SI Slovenia
ES Spain SK Slovakia
FR France FI Finland
IT Italy SE Sweden
CY Cyprus UK United Kingdom
LV Latvia JP Japan
LT Lithuania US United States
OTHERS
BIS Bank for International Settlements
b.o.p. balance of payments
BPM5 IMF Balance of Payments Manual (5th edition)
CD certifi cate of deposit
c.i.f. cost, insurance and freight at the importer’s border
CPI Consumer Price Index
ECB European Central Bank
EER effective exchange rate
EMI European Monetary Institute
EMU Economic and Monetary Union
ESA 95 European System of Accounts 1995
ESCB European System of Central Banks
EU European Union
EUR euro
f.o.b. free on board at the exporter’s border
GDP gross domestic product
HICP Harmonised Index of Consumer Prices
HWWI Hamburg Institute of International Economics
ILO International Labour Organization
IMF International Monetary Fund
MFI monetary fi nancial institution
NACE statistical classifi cation of economic activities in the European Union
NCB national central bank
OECD Organisation for Economic Co-operation and Development
PPI Producer Price Index
SITC Rev. 4 Standard International Trade Classifi cation (revision 4)
ULCM unit labour costs in manufacturing
ULCT unit labour costs in the total economy
In accordance with EU practice, the EU countries are listed in this Bulletin using the alphabetical order of the country names in the national languages.

5ECB
Monthly Bulletin
October 2012
Based on its regular economic and monetary
analyses, the Governing Council decided
at its meeting on 4 October to keep the key
ECB interest rates unchanged. Owing to high
energy prices and increases in indirect taxes
in some euro area countries, infl ation rates are
expected to remain above 2% throughout 2012,
but then to fall below that level again in the
course of next year and to remain in line with
price stability over the policy-relevant horizon.
Consistent with this picture, the underlying
pace of monetary expansion remains subdued.
Infl ation expectations for the euro area continue
to be fi rmly anchored in line with the Governing
Council’s aim of maintaining infl ation rates
below, but close to, 2% over the medium term.
Economic growth in the euro area is expected
to remain weak, with ongoing tensions in some
euro area fi nancial markets and high uncertainty
still weighing on confi dence and sentiment.
The Governing Council’s decisions as regards
Outright Monetary Transactions (OMTs) have
helped to alleviate such tensions over the past
few weeks, thereby reducing concerns about
the materialisation of destructive scenarios. It
is now essential that governments continue to
implement the necessary steps to reduce both
fi scal and structural imbalances and proceed
with fi nancial sector restructuring measures.
The Governing Council remains fi rmly
committed to preserving the singleness of its
monetary policy and to ensuring the proper
transmission of the policy stance to the real
economy throughout the euro area. OMTs will
enable the Governing Council to provide, under
appropriate conditions, a fully effective backstop
to avoid destructive scenarios with potentially
severe challenges for price stability in the
euro area. The Governing Council acts strictly
within its mandate to maintain price stability
over the medium term; it acts independently in
determining monetary policy; and the euro is
irreversible.
The Governing Council is ready to undertake
OMTs, once all the prerequisites are in place. It
will consider entering into OMTs to the extent
that they are warranted from a monetary policy
perspective as long as programme conditionality
is fully respected. The Governing Council would
exit from OMTs once their objectives have been
achieved or when there is a failure to comply
with a programme. OMTs would not take place
while a given programme is under review and
would resume after the review period once
programme compliance has been assured.
As regards the economic analysis, euro area real
GDP contracted by 0.2%, quarter on quarter, in
the second quarter of 2012, following fl at growth
in the previous quarter. Economic indicators, in
particular survey results, confi rm the continuation
of weak economic activity in the third quarter of
2012, in an environment characterised by high
uncertainty. The Governing Council expects
the euro area economy to remain weak in the
near term and to recover only very gradually
thereafter. The growth momentum is supported
by the Governing Council’s standard and
non-standard monetary policy measures, but is
expected to remain dampened by the necessary
process of balance sheet adjustment in the
fi nancial and non-fi nancial sectors, the existence
of high unemployment and an uneven global
recovery.
The risks surrounding the economic outlook for
the euro area continue to be on the downside.
They relate, in particular, to ongoing tensions
in several euro area fi nancial markets and the
potential spillover to the euro area real economy.
These risks should be contained by effective
action by all policy-makers in the euro area.
Euro area annual HICP infl ation was 2.7% in
September 2012, according to Eurostat’s fl ash
estimate, compared with 2.6% in the previous
month. This is higher than expected and
mainly refl ects past increases in indirect taxes
and euro-denominated energy prices. On the
basis of current futures prices for oil, infl ation
rates could remain at elevated levels, before
declining to below 2% again in the course of
next year. Over the policy-relevant horizon, in
an environment of modest growth in the euro
EDITORIAL

6ECB
Monthly Bulletin
October 2012
area and well-anchored long-term infl ation
expectations, underlying price pressures should
remain moderate. Current levels of infl ation
should thus remain transitory and not give
rise to second-round effects. The Governing
Council will continue to monitor closely further
developments in costs, wages and prices.
Risks to the outlook for price developments
continue to be broadly balanced over the
medium term. Upside risks pertain to further
increases in indirect taxes owing to the need for
fi scal consolidation. The main downside risks
relate to the impact of weaker than expected
growth in the euro area, in the event of a renewed
intensifi cation of fi nancial market tensions,
and its effects on the domestic components of
infl ation. If not contained by effective action
by all policy-makers in the euro area, such
intensifi cation has the potential to affect the
balance of risks on the downside.
Turning to the monetary analysis, recent
data confi rm the subdued underlying pace of
monetary expansion. In August the annual
growth rate of M3 decreased to 2.9%, from
3.6% in July. While this decline was mainly
due to a base effect, monthly infl ows were also
relatively contained. Conversely, strong monthly
infl ows into overnight deposits contributed to a
further increase in the annual rate of growth of
M1 to 5.1% in August, compared with 4.5% in
July. This increase refl ects a continuing high
preference for liquidity in an environment of
low interest rates and high uncertainty.
The annual growth rate of loans to the
private sector (adjusted for loan sales and
securitisation) declined in August to -0.2%
(from 0.1% in July), refl ecting a decrease
in the annual rate of growth of loans to
non-fi nancial corporations to -0.5%, from
-0.2% in July. By contrast, the annual growth
of loans to households remained unchanged,
at 1.0%, in August. To a large extent, subdued
loan dynamics refl ect the weak outlook for
GDP, heightened risk aversion and the ongoing
adjustment in the balance sheets of households
and enterprises, all of which weigh on credit
demand. At the same time, in a number of euro
area countries, the segmentation of fi nancial
markets and capital constraints for banks
restrict credit supply.
The soundness of banks’ balance sheets will be
a key factor in facilitating both an appropriate
provision of credit to the economy and the
normalisation of all funding channels, thereby
contributing to an adequate transmission of
monetary policy to the fi nancing conditions
of the non-fi nancial sectors in the different
countries of the euro area. It is thus essential
that the resilience of banks continues to be
strengthened where needed.
To sum up, the economic analysis indicates
that price developments should remain in line
with price stability over the medium term. A
cross-check with the signals from the monetary
analysis confi rms this picture.
Other economic policy areas need to make
substantial contributions to ensure a further
stabilisation of fi nancial markets and an
improvement in the outlook for growth. As
regards fi scal policies, euro area countries are
progressing with consolidation. It is crucial that
efforts are maintained to restore sound fi scal
positions, in line with the commitments under
the Stability and Growth Pact and the 2012
European Semester recommendations. A rapid
implementation of the fi scal compact will also
play a major role in strengthening confi dence
in the soundness of public fi nances. At the
same time, structural reforms are as essential
as fi scal consolidation efforts and measures to
improve the functioning of the fi nancial sector.
In the countries most strongly affected by the
crisis, noticeable progress is being made in
the correction of unit labour cost and current
account developments. Decisive product and
labour market reforms will further improve the
competitiveness of these countries and their
capacity to adjust.
Finally, it is essential to push ahead with
European institution-building. The ECB
welcomes the Commission proposal of

7ECB
Monthly Bulletin
October 2012
EDITORIAL
Box 1
COMPLIANCE OF OUTRIGHT MONETARY TRANSACTIONS WITH THE PROHIBITION ON MONETARY
FINANCING
On 6 September 2012 the Governing Council of the ECB decided on the modalities for undertaking
Outright Monetary Transactions (OMTs) in secondary markets for sovereign bonds in the
euro area.1 While the acceptance of government bonds or other public debt instruments as collateral
by Eurosystem central banks in the context of credit operations with monetary policy counterparties
has been considered compatible with the monetary fi nancing prohibition since the start of EMU,
this box deals briefl y with the compliance of OMTs with the prohibition on monetary fi nancing.
From the ECB’s perspective, OMTs are a necessary, proportional and effective monetary policy
instrument. They aim at ensuring an effective transmission of the Eurosystem’s monetary policy and,
thereby, at securing the conditions for an effective conduct of the single monetary policy within the
euro area, with a view to achieving its primary objective of maintaining price stability. In defi ning
the operational modalities for OMTs, particular care has been given to the need to comply with
the prohibition on monetary fi nancing laid down in Article 123 of the Treaty on the Functioning
of the European Union (TFEU). This Article prohibits the ECB or NCBs from purchasing public
debt instruments on the primary market. Moreover, secondary-market purchases of public debt
instruments – although allowed, in principle, under the monetary fi nancing prohibition – must not
be used to circumvent the objectives of the prohibition on monetary fi nancing. Such clarifi cation is
provided for in Council Regulation (EC) No 3603/93.2 In the context of OMTs, secondary-market
1 See the box entitled “Monetary policy measures decided by the Governing Council on 6 September 2012”, Monthly Bulletin, ECB,
September 2012.
2 Council Regulation (EC) No 3603/93 of 13 December 1993 specifying defi nitions for the application of the prohibitions referred
to in Articles 104 [renumbered after the Lisbon Treaty as Article 123 TFEU] and 104b(1) [renumbered after the Lisbon Treaty as
Article 125 TFEU] of the Treaty (OJ L 332, 31.12.1993, p. 1).
12 September 2012 for a single supervisory
mechanism (SSM) involving the ECB, to be
established through a Council regulation on
the basis of Article 127(6) of the Treaty. The
Governing Council considers an SSM to be one
of the fundamental pillars of a fi nancial union
and one of the main building blocks towards a
genuine Economic and Monetary Union. The
ECB will formally issue a legal opinion in
which it will, in particular, take into account
the following principles: a clear and robust
separation between supervisory decision-making
and monetary policy; appropriate accountability
channels; a decentralisation of tasks within the
Eurosystem; an effective supervisory framework
ensuring coherent oversight of the euro area
banking system; and full compatibility with
the Single Market framework, including the
role and prerogatives of the European Banking
Authority. As the Commission proposal sets
out an ambitious transition schedule towards
the SSM, the ECB has started preparatory work
so as to be able to implement the provisions
of the Council regulation as soon as it enters
into force.
This issue of the Monthly Bulletin contains
two articles. The fi rst article provides a detailed
defi nition of global liquidity, assesses how it can
ultimately infl uence domestic price stability and
discusses the implications for monetary policy.
The second article documents developments
in euro area labour markets since the start of
the economic and fi nancial crisis in 2008 and
reviews the impact of the crisis on structural
features of euro area labour markets.
8ECB
Monthly Bulletin
October 2012
purchases of public debt instruments will, under no circumstances, be used to circumvent the
objectives of the prohibition on monetary fi nancing. In particular, specifi c operational modalities
have been set up to ensure that OMTs do not interfere with the three objectives of the monetary
fi nancing prohibition, namely safeguarding (i) the primary objective of price stability, (ii) central
bank independence, and (iii) fi scal discipline. A major concern has been the need to ensure that this
monetary policy instrument could not ultimately weaken fi scal discipline.
OMTs as a monetary policy measure to achieve the primary objective of price stability
A necessary monetary policy measureThe current situation is characterised by severe distortions in government bond markets which
originate, in particular, from unfounded fears on the part of investors of the reversibility of the
euro. This translates into severe cases of malfunctioning in the price formation process in the
government bond markets, which undermines the functioning of the monetary policy transmission
mechanism. Government bond markets play a key role at various stages of the transmission
mechanism in the euro area. Thus, the effi cacy of standard monetary policy tools in the affected
jurisdictions has been reduced by market dysfunctions impairing the transmission mechanism.
This warrants action by the ECB to mitigate medium-term risks to price stability. Thus, OMTs
are a non-standard, but necessary, monetary policy instrument in the current exceptional
circumstances in fi nancial markets. The use of outright purchases of bonds as a monetary policy
tool is expressly provided for in Article 18.1 of the Statute of the ESCB.
A proportional monetary policy measureOMTs will only be used to the extent necessary to achieve the objective of maintaining price stability.
The Governing Council will consider them as a monetary policy tool insofar as they are warranted
from a monetary policy perspective. Following a thorough assessment, the Governing Council
will decide on the OMTs necessary to address the malfunctioning of certain market segments.
This assessment implies a strict selection of the Member States for which OMTs are carried out.
Moreover, OMTs will be focused on purchases of government bonds with maturities of between
one and three years, thereby underlining the close link to traditional monetary policy. Furthermore,
the Governing Council will terminate OMTs once their objectives have been achieved.
An effective monetary policy measureSpecifi c modalities for undertaking OMTs have been established in order to maximise the
OMTs’ positive impact on the functioning of the monetary policy transmission mechanism.
The effectiveness of OMTs is linked to the due and timely adoption by Member States of
macroeconomic, structural, fi scal and fi nancial measures aimed at restoring and maintaining their
macroeconomic fundamentals. The undertaking by the Eurosystem of OMTs in the sovereign bond
market of a Member State is therefore based on that State’s compliance with its commitments
and timelines under the economic governance framework applying to the euro area. Strict
and effective conditionality attached to an appropriate European Financial Stability Facility/
European Stability Mechanism (EFSF/ESM) programme, including the possibility of EFSF/ESM
primary-market purchases, will be essential, while IMF involvement will be sought. This will not,
however, be suffi cient. The Governing Council will have full discretion in deciding on the start,
continuation and suspension of OMTs and will act in accordance with its monetary policy mandate.
It will consider OMTs to the extent that they are warranted from a monetary policy perspective
and will terminate them once their objectives have been achieved or in cases where there is

9ECB
Monthly Bulletin
October 2012
EDITORIAL
non-compliance with the programme. For this purpose, the Governing Council will closely monitor
all developments and make the necessary assessments.
Neutral impact on liquidity conditions The liquidity created through OMTs will be fully sterilised. With the total absorption, there will
be no increase in the supply of base money and no change in the liquidity conditions.
Fiscal discipline
In order to ensure and maintain fi scal discipline, OMTs will be restricted to Member States which
are subject to strict conditionality covering the necessary macroeconomic, structural, fi scal and
fi nancial adjustment needs. Any purchases of government bonds of those Member States will be
focused on bonds with maturities of between one and three years. These operational modalities
are essential to ensure that OMTs do not impair simultaneous tangible progress by those Member
States in the areas of fi scal consolidation and, in particular, longer-term structural reforms.
Central bank independence
The operational modalities for OMTs have been designed by the Governing Council, in full
independence, from the perspective of what is necessary, proportional and effective for monetary
policy purposes. The Governing Council will have full discretion in deciding on the start,
continuation and suspension of OMTs in accordance with its monetary policy mandate.


11ECB
Monthly Bulletin
October 2012
ECONOMIC AND MONETARYDEVELOPMENTS
The external
environment
of the euro area
While the recovery of the world economy is continuing, the latest survey data suggest that growth has slowed in both advanced and emerging economies in recent months. Notwithstanding this rather synchronised growth moderation, the overall pace of expansion in emerging markets has remained solid in comparison with advanced economies. Headline global infl ation picked up slightly in August, mainly on the back of commodity price developments, while core infl ation continued to ease.
1.1 DEVELOPMENTS IN THE WORLD ECONOMY
While the gradual recovery of the world economy is continuing, the pace of global growth has slowed
again, mainly led by developments in the euro area. Meanwhile, the pace of expansion also slowed in
a number of emerging market economies. This is partly related to the weaker external environment,
but also refl ects past policy tightening in some major countries. According to the latest survey data,
activity remained weak in the third quarter as business sentiment continued to deteriorate. In August
the Purchasing Managers’ Index (PMI) for global all-industry output declined to 51.1, from 51.7 in
July, as new business stagnated. The latest PMI for global manufacturing output picked up slightly in
September, as the pace of contraction eased in the United States, the EU and Asia. Weak consumer
and business confi dence, fragile labour markets and ongoing balance sheet repair will continue to
restrain the pace of growth in a number of advanced economies, while GDP growth in emerging
economies, albeit decelerating, is expected to remain solid by comparison.
Global infl ation picked up slightly in August, largely driven by higher oil and energy prices.
In the OECD area, consumer price infl ation rose to 2.0% in the year to August, from 1.9% in July.
Excluding food and energy, the annual rate of infl ation declined further to 1.6% in August, from
1.8% in July. In several emerging markets, annual rates of infl ation also increased, but remain
signifi cantly below the peaks recorded last year.
ECONOMIC AND MONETARY DEVELOPMENTS
1 THE EXTERNAL ENVIRONMENT OF THE EURO AREA
Chart 1 Global PMI output
(diffusion index; seasonally adjusted; monthly data)
25
30
35
40
45
50
55
60
65
25
30
35
40
45
50
55
60
65
PMI output: overall
PMI output: manufacturing
PMI output: services
2004 2005 2006 2007 2008 2009 2010 2011 2012
Source: Markit.
Chart 2 International price developments
(monthly data; annual percentage changes)
-1
0
1
2
3
4
5
-1
0
1
2
3
4
5
OECD consumer prices (all items)
OECD consumer prices (all items excluding food
and energy)
2004 2005 2006 2007 2008 2009 2010 2011 2012
Source: OECD.

12ECB
Monthly Bulletin
October 2012
UNITED STATES
In the United States, real GDP growth lost some momentum in the second quarter of 2012. According
to the third estimate by the Bureau of Economic Analysis, real GDP increased at an annualised rate of
1.3% (0.3% quarter on quarter) in the second quarter of 2012, down from 2.0% (0.5% quarter on quarter)
in the fi rst quarter. This represents a downward revision of 0.4 percentage point from the previously
reported 1.7%. The revision in GDP growth refl ects broad-based downward revisions to domestic
demand and exports, which were partly offset by a smaller decrease in government consumption.
The increase in real GDP in the second quarter mainly refl ects positive contributions from personal
consumption expenditure and, to a lesser extent, private investment and net exports, which were partly
offset by negative contributions from private inventories and government spending. Real disposable
personal income growth slowed down to 3.1% (annualised), from 3.7% in the fi rst quarter.
Recent data releases have given mixed signals, suggesting a moderate economic expansion in the
third quarter of 2012. On the negative side, business confi dence in the third quarter was lower
than in the second quarter, whereas industrial production fell considerably in August, suggesting
a slowdown in business investment. In addition, employment data for the fi rst two months of the
third quarter were somewhat weak, while external trade developments in July were sluggish. On a
more positive note, consumer confi dence increased sharply in September, suggesting that private
consumption could have rebounded in the third quarter. Furthermore, housing market indicators
continued to improve, providing further evidence that the housing market is steadily picking up and
is expected to have continued to contribute positively to growth in the third quarter of 2012.
As regards price developments, annual CPI infl ation increased from 1.4% in July to 1.7% in
August, reaching its highest level since May 2012. The rise in headline infl ation refl ected mainly
Chart 3 Main developments in major industrialised economies
euro area
United States
Japan
United Kingdom
Output growth 1)
(quarter-on-quarter percentage changes; quarterly data)
Inflation rates 2)
(consumer prices; annual percentage changes; monthly data)
-4
-3
-2
-1
0
1
2
-4
-3
-2
-1
0
1
2
2004 2005 2006 2007 2008 2009 2010 2011 2012-3
-2
-1
0
1
2
3
4
5
6
-3
-2
-1
0
1
2
3
4
5
6
2004 2005 2006 2007 2008 2009 2010 2011 2012
Sources: National data, BIS, Eurostat and ECB calculations.1) Eurostat data are used for the euro area and the United Kingdom; national data are used for the United States and Japan. GDP fi gures have been seasonally adjusted.2) HICP for the euro area and the United Kingdom; CPI for the United States and Japan.

13ECB
Monthly Bulletin
October 2012
ECONOMIC AND MONETARYDEVELOPMENTS
The external
environment
of the euro area
the rebound in energy prices in August, halting the downward trend. Annual food price infl ation
continued to ease further, standing at 2.0%, down from the peak of 4.7% in October 2011. Annual
infl ation, excluding food and energy, declined to 1.9%, from 2.1% in July.
On 13 September 2012 the Federal Open Market Committee (FOMC) decided to launch a third
round of quantitative easing measures – referred to as “QE3” – to further stimulate the economy.
The FOMC plans to purchase additional agency mortgage-backed securities at a pace of
USD 40 billion per month. It will also continue with its programme to extend the average maturity
of its holdings of securities until the end of the year, as announced in June, as well as with its
existing policy of reinvesting principal payments from its holding of agency debt and agency
mortgage-backed securities. With these actions, the FOMC expects to put downward pressure on
longer-term interest rates, support mortgage markets and help to make broader fi nancial conditions
more accommodative. The FOMC also decided to keep the target range for the federal funds rate at
0% to 0.25% and anticipated that exceptionally low levels for the federal funds rate were likely to
be warranted at least until mid-2015.
JAPAN
In Japan, the second release of national accounts data showed that real GDP growth decelerated
to 0.2% (revised downwards from 0.3%) quarter on quarter in the second quarter of the year,
compared with 1.3% in the fi rst quarter. The slowdown was partly due to stagnating private
consumption, which contributed a mere 0.1 percentage point to GDP growth in the second quarter
of 2012 (compared with 0.7 percentage point in the previous quarter). Moreover, the contribution
to real GDP of both net exports of goods and services and private inventories was negative in the
second quarter (around -0.1 and -0.2 percentage point, respectively). The latest high-frequency
data seem to point to some loss in growth momentum in the third quarter. Industrial production
declined further in August, by 1.3%. At the same time, real exports of goods declined for the fourth
consecutive month in August (by 0.6%), while real imports declined by almost 4%. The Bank of
Japan’s Tankan diffusion index of business conditions for large manufacturing fi rms stood at -3 in
the third quarter of 2012 (compared with -1 in the previous quarter), confi rming the weak outlook
for this quarter.
Annual CPI infl ation remained at -0.4% in August, and core CPI infl ation (excluding food,
beverages and energy) remained unchanged at -0.61%. On 19 September 2012 the Bank of Japan
announced an amendment to its asset purchase programme. The maximum outstanding amount of
fi nancial assets purchased through the programme now totals JPY 55 trillion. This corresponds to a
JPY 10 trillion increase in the maximum outstanding amount, which is made up of JPY 5 trillion in
Japanese government bonds and JPY 5 trillion in treasury discount bills. The minimum bid yield for
both Japanese government bonds and corporate bonds was removed. The increased purchases under
the programme will be completed by around the end of June 2013 for treasury discount bills and by
around the end of 2013 for Japanese government bonds. The Bank of Japan kept its target interest
rate unchanged at around 0% to 0.1%.
UNITED KINGDOM
In the United Kingdom, real GDP declined by 0.4% quarter on quarter in the second quarter of
2012, mainly owing to temporary factors. Real GDP is likely to have increased in the third quarter,
again largely on account of temporary factors. Survey indicators for manufacturing and services
mostly improved in August and industrial production rebounded in July. However, forward-
looking indicators remain relatively subdued, and consumer confi dence is still low, confi rming
the underlying weak growth momentum of the economy. The labour market situation has shown

14ECB
Monthly Bulletin
October 2012
signs of improvement, with the unemployment rate standing at 8.1% and employment growing by
0.8% in the three months to July 2012. Looking ahead, the economic recovery is likely to gather
pace only very gradually, as domestic demand is expected to remain constrained by tight credit
conditions, ongoing household balance sheet adjustment and substantial fi scal tightening.
Annual CPI infl ation slowed down to 2.5% in August from 2.6% in July, while CPI infl ation excluding
energy and unprocessed food decreased to 2.2% from 2.4%. Looking ahead, the existence of spare
capacity and the sluggish recovery in economic activity should help contain infl ationary pressures. At
its meeting on 6 September 2012, the Bank of England’s Monetary Policy Committee maintained the
policy rate at 0.5% and the size of its asset purchase programme at GBP 375 billion.
CHINA
In China, economic indicators showed a mixed picture, suggesting that growth might have bottomed
out, although there are no convincing signs as yet of it picking up. Industrial production growth
continued to weaken, standing at 8.9% year on year in August 2012. Both the private sector and
the offi cial PMI for manufacturing for September increased moderately, but remained below the
expansion/contraction threshold of 50. The forward-looking sub-component new orders rose more
strongly, although remaining below the threshold of 50, while the build-up of inventories seems to
have stopped. The housing market continued to improve in August, with activity indicators once
again showing positive growth in year-on-year terms and prices increasing for the third month in
a row (see also Box 2). Retail sales growth stabilised while external trade remained subdued in
August. Total export growth remained weak, with exports to the euro area continuing to decline in
year-on-year terms, while exports to Asia and the United States picked up. As imports declined
in August, the monthly trade surplus increased further, to USD 26.6 billion. Annual CPI infl ation
increased to 2.0% in August, from 1.8% in the previous month, remaining well below the government’s
4% target for 2012. Renminbi-denominated loans and broad money continued to grow robustly.
Box 2
DEVELOPMENTS IN THE HOUSING MARKET IN CHINA
Following sharp increases in housing prices and activity between 2005 and 2011, recent
weakness in the Chinese housing market has rekindled concerns that a strong correction might
have a negative impact on China’s growth outlook and, in turn, on the global economy. This box
investigates the likelihood of such an event materialising by looking at the fundamentals of the
Chinese housing market and its importance for the Chinese economy.
Housing investment has been an increasingly important source of growth for China in recent
years. Real estate investment accounts for about 25% of total fi xed asset investment, with the
latter having driven 50% of GDP growth since 2006. In terms of its share in GDP, real estate
investment rose from 10% in 2006 to 16% in 2011. Construction and real estate services together
employ over 10% of the workforce and contribute to 13% of total added value. Real estate
investment also has strong linkages to other industries such as machinery and equipment.
House prices in China have risen sharply in recent years and are high compared with incomes.
On average, the price per square metre of housing across a sample of 35 large and mid-sized
15ECB
Monthly Bulletin
October 2012
ECONOMIC AND MONETARYDEVELOPMENTS
The external
environment
of the euro area
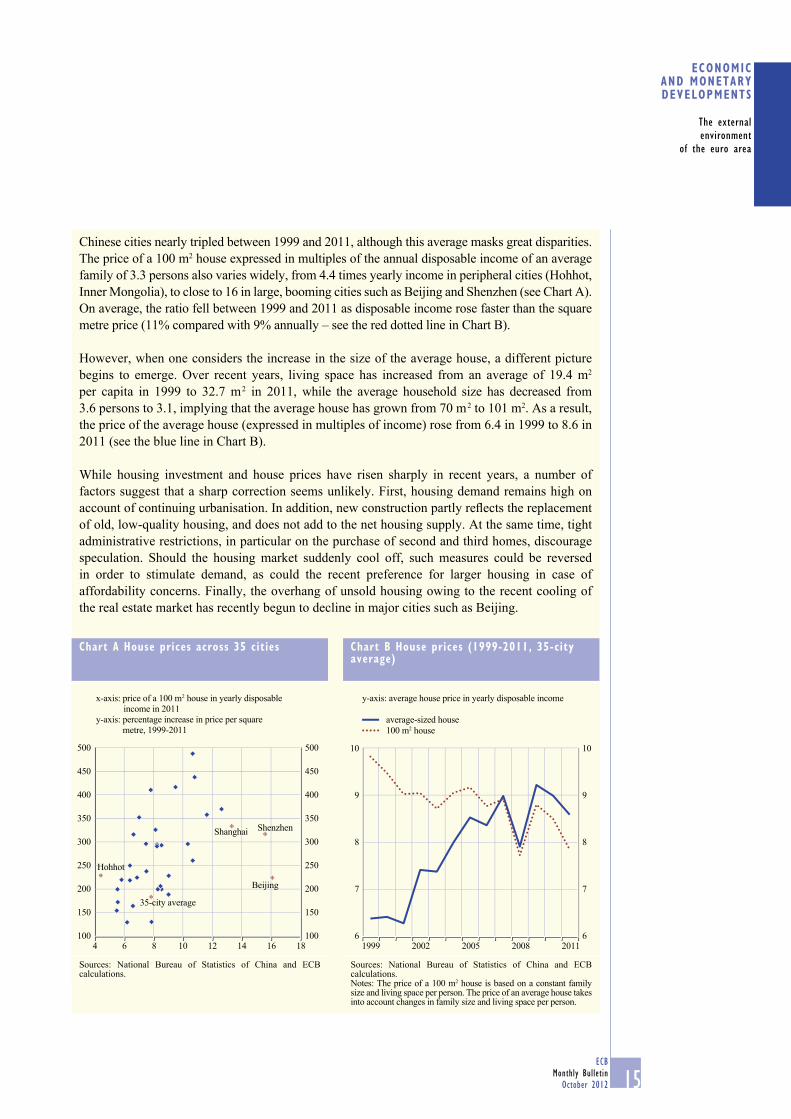
Chinese cities nearly tripled between 1999 and 2011, although this average masks great disparities.
The price of a 100 m2 house expressed in multiples of the annual disposable income of an average
family of 3.3 persons also varies widely, from 4.4 times yearly income in peripheral cities (Hohhot,
Inner Mongolia), to close to 16 in large, booming cities such as Beijing and Shenzhen (see Chart A).
On average, the ratio fell between 1999 and 2011 as disposable income rose faster than the square
metre price (11% compared with 9% annually – see the red dotted line in Chart B).
However, when one considers the increase in the size of the average house, a different picture
begins to emerge. Over recent years, living space has increased from an average of 19.4 m2
per capita in 1999 to 32.7 m 2 in 2011, while the average household size has decreased from
3.6 persons to 3.1, implying that the average house has grown from 70 m 2 to 101 m2. As a result,
the price of the average house (expressed in multiples of income) rose from 6.4 in 1999 to 8.6 in
2011 (see the blue line in Chart B).
While housing investment and house prices have risen sharply in recent years, a number of
factors suggest that a sharp correction seems unlikely. First, housing demand remains high on
account of continuing urbanisation. In addition, new construction partly refl ects the replacement
of old, low-quality housing, and does not add to the net housing supply. At the same time, tight
administrative restrictions, in particular on the purchase of second and third homes, discourage
speculation. Should the housing market suddenly cool off, such measures could be reversed
in order to stimulate demand, as could the recent preference for larger housing in case of
affordability concerns. Finally, the overhang of unsold housing owing to the recent cooling of
the real estate market has recently begun to decline in major cities such as Beijing.
Chart B House prices (1999-2011, 35-city average)
6
7
8
9
10
6
7
8
9
10
1999 2002 2005 2008 2011
y-axis: average house price in yearly disposable income
100 m2 house
average-sized house
Sources: National Bureau of Statistics of China and ECB calculations.Notes: The price of a 100 m2 house is based on a constant family size and living space per person. The price of an average house takes into account changes in family size and living space per person.
Chart A House prices across 35 cities
100
150
200
250
300
350
400
450
500
100
150
200
250
300
350
400
450
500
Beijing
Shanghai
35-city average
Shenzhen
Hohhot
4 6 8 10 12 14 16 18
y-axis: percentage increase in price per square
metre, 1999-2011
x-axis: price of a 100 m2 house in yearly disposable
income in 2011
Sources: National Bureau of Statistics of China and ECB calculations.

16ECB
Monthly Bulletin
October 2012
1.2 COMMODITY MARKETS
Oil prices declined by about 1.5% in September,
partly reversing the increase that began in July.
Brent crude oil prices stood at USD 112 per
barrel on 2 October, implying an increase of
24% with respect to their lowest level recorded
in 2012 on 26 June, but still 11% below the 2012
peak reached on 14 March. Looking ahead,
market participants expect lower oil prices over
the medium term, with futures contracts for
December 2013 trading at USD 105 per barrel
(see also Box 4).
The recent decline in oil prices refl ects a
combination of supply and demand factors.
On the supply side, Saudi Arabia announced
an increase in oil supply in response to the
losses in production following the oil sanctions
against Iran in particular. This announcement
partially offset the upward pressure on oil prices
caused by a fall in oil supply in both OPEC and
There could be a concern that, if households
have extrapolated recent rates of income growth
into the future, assessments of housing
affordability – refl ected in the demand for larger
housing – might prove to have been overly
optimistic, particularly since China’s potential
growth rate is expected to slow in the coming
years. This could induce a fall in prices,
temporarily depressing housing sales as prices
adjust and creating an overhang of unsold
housing stock. Consumers are not highly
leveraged, so the impact on consumption
from a downward housing shock would likely
be small. Mortgage debt as a percentage of
disposable income has increased markedly
over recent years to reach 33% in 2011
(see Chart C). Loan-to-value ratios for
household mortgages are typically low, so
household sector deleveraging linked to falling
property prices is expected to be limited.
However, a large housing market correction
would negatively affect real estate transactions and construction activity, which could spill
over to other industries. That said, in view of the reasons mentioned above, a broad and sharp
correction of house prices seems unlikely, though house prices in individual cities might exhibit
some volatility.
Chart C Consumer loans
(as a percentage of disposable income)
0
10
20
30
40
50
0
10
20
30
40
50
1997 1999 2001 2003 2005 2007 2009 2011
housing mortgage
other
Sources: CEIC, People’s Bank of China, National Bureau of Statistics.
Chart 4 Main developments in commodity prices
20
40
60
80
100
120
140
160
180
60
70
80
90
100
110
120
130
140
Brent crude oil (USD/barrel; left-hand scale)
non-energy commodities (USD; index: 2010 = 100;
right-hand scale)
2008 2009 2010 2011 2012
Sources: Bloomberg and HWWI.

17ECB
Monthly Bulletin
October 2012
ECONOMIC AND MONETARYDEVELOPMENTS
The external
environment
of the euro area
non-OPEC countries in the previous months. Market reports on a potential strategic oil inventory
release by industrialised countries also contributed to lower oil prices. On the demand side, although
oil demand is generally expected to grow at a steady pace in 2013, the International Energy Agency
revised its expectations on oil demand growth slightly downwards on account of slowing global
economic activity.
Prices of non-energy commodities increased again in September, after slight declines in August.
The increase was mainly driven by higher prices for metals and iron ore. Agricultural commodity
prices continued their decline after the spikes of June and July caused by droughts in the United
States. In aggregate terms, the price index for non-energy commodities (denominated in US dollars)
stood 3.0% higher towards the end of September than at the beginning of the year.
1.3 EXCHANGE RATES
Between the end of June and early October 2012 the effective exchange rate of the euro remained
broadly unchanged in an environment of declining volatility. The continued depreciation of
the effective exchange rate of the euro throughout July started to reverse in mid-August and on
2 October 2012 the nominal effective exchange rate of the euro, as measured against the currencies
of 20 of the euro area’s most important trading partners, stood 0.4% above its level at the end of
June 2012 and 5.6% below its average level in 2011 (see Chart 5).
In bilateral terms, over the past three months the euro has appreciated against most major currencies.
Between 29 June and 2 October 2012 the euro appreciated against the US dollar (by 2.7%), the
Chart 5 Euro effective exchange rate (EER-20) and its decomposition 1)
(daily data)
Index: Q1 1999 = 100 Contributions to EER-20 changes 2)
From 29 June to 2 October 2012 (percentage points)
94
95
96
97
98
99
94
95
96
97
98
99
July August September
2012
-0.50
-0.25
0.00
0.25
0.50
-0.50
-0.25
0.00
0.25
0.50
EER
-20
CNY USD GBP JPY CHF SEK OMS other
Source: ECB.1) An upward movement of the index represents an appreciation of the euro against the currencies of 20 of the most important trading partners of the euro area (including all non-euro area EU Member States).2) Contributions to EER-20 changes are displayed individually for the currencies of the main trading partners of the euro area. The category “other Member States” (OMS) refers to the aggregate contribution of the currencies of the non-euro area Member States (except the pound sterling and the Swedish krona). The category “other” refers to the aggregate contribution of the currencies of the remaining six trading partners of the euro area in the EER-20 index. Changes are calculated using the corresponding overall trade weights in the EER-20 index.

18ECB
Monthly Bulletin
October 2012
Japanese yen (by 0.9%) and the Swiss franc (by 0.6%), but depreciated against the pound sterling
(by 0.8%). Over the same horizon, the euro also depreciated vis-à-vis some other European
currencies (see Table 1), including the Polish zloty (by 3.4%), the Czech koruna (by 2.3%) and the
Hungarian forint (by 0.8%). Market volatility – as measured on the basis of foreign exchange option
prices – has decreased overall over the past three months and remains below historical averages.
Between 29 June and 2 October 2012 the
currencies participating in ERM II remained
broadly stable against the euro, trading at, or
close to, their respective central rates. The
Latvian lats traded on the stronger side of its
central rate within the unilaterally set fl uctuation
band of ±1%.
1.4 OUTLOOK FOR THE EXTERNAL ENVIRONMENT
Looking ahead, the loss of momentum in
global growth is likely to persist in the coming
months. The new orders component of the global
manufacturing PMI shows signs of stabilisation at
low levels, rising modestly to 48.9 in September,
from 46.7 in August. It remains below the
expansion/contraction threshold of 50 and well
below its long-term average, thus suggesting
weak prospects for business activity. The
OECD’s composite leading indicator, designed
to anticipate turning points in economic activity
relative to trend, continues to signal low growth
momentum in the OECD area, and in the major
non-member economies.
Table 1 Euro exchange rate developments 1)
(daily data; units of national currency per euro; percentage changes)
Weight in EER-20Level on
Appreciation (+)/ depreciation (-) of the euroas at 2 October 2012
since: compared with:2 October 2012 29 June 2012 2 January 2012 average for 2011
Chinese renminbi 18.8 8.178 2.2 0.3 -9.1
US dollar 16.9 1.293 2.7 0.0 -7.1
Pound sterling 14.9 0.801 -0.8 -4.1 -7.8
Japanese yen 7.2 101.0 0.9 1.5 -9.0
Swiss franc 6.5 1.210 0.6 -0.4 -1.8
Polish zloty 6.2 4.103 -3.4 -8.3 -0.4
Czech koruna 5.0 25.06 -2.3 -1.7 1.9
Swedish krona 4.7 8.533 -2.7 -4.4 -5.5
Korean won 3.9 1,439 -0.2 -3.7 -6.7
Hungarian forint 3.2 285.6 -0.8 -9.2 2.2
NEER 2) 97.6 0.4 -1.9 -5.6
Source: ECB.1) Bilateral exchange rates in descending order based on the corresponding currencies’ trade weights in the EER-20 index.2) Euro nominal effective exchange rate against the currencies of 20 of the most important trading partners of the euro area (EER-20).
Chart 6 OECD composite leading indicators
(monthly data; amplitude-adjusted)
92
94
96
98
100
102
104
92
94
96
98
100
102
104
OECD
emerging economies
2004 2005 2006 2007 2008 2009 2010 2011
Source: OECD.Note: The emerging market indicator is a weighted average of the composite leading indicators for Brazil, Russia and China.

19ECB
Monthly Bulletin
October 2012
ECONOMIC AND MONETARYDEVELOPMENTS
The external
environment
of the euro area
The outlook for the external environment of the euro area remains subject to high uncertainty related
to tensions in key fi nancial market segments as well as fi scal and global imbalances. Risks to the
global outlook remain on the downside and mainly relate to spillover effects from developments in
the euro area, through both trade and confi dence channels and, to a lesser extent, the uncertain scale
of fi scal measures, most notably in the United States.

20ECB
Monthly Bulletin
October 2012
2 MONETARY AND FINANCIAL DEVELOPMENTS
2.1 MONEY AND MFI CREDIT
Monetary data of August 2012 confi rm the subdued underlying pace of money and credit expansion that has already been observed for a protracted period. At the same time, the annual growth rate of M1 continued to increase, refl ecting the money-holding sector’s preference for highly liquid assets in an environment of low interest rates and high uncertainty. MFI lending to the non-fi nancial private sector in the euro area remained weak by historical standards and continued to conceal signifi cant heterogeneous developments across countries. Demand conditions explain much of the current weakness in lending, but supply constraints also persist in a number of countries. In order to ensure the appropriate fi nancing of the economy once demand picks up, credit institutions in a number of euro area countries will need to make progress with the adjustment of their balance sheets.
THE BROAD MONETARY AGGREGATE M3
The annual growth rate of M3 declined to 2.9% in August 2012, down from 3.6% in July
(see Chart 7).1 This moderation of the annual rate of change in M3 refl ects mainly a base effect and
only a modest monthly infl ow to monetary assets in August (month-on-month growth of 0.2%).
On the components side, the money-holding sector continued to shift large amounts of funds
from other assets within and outside M3 to highly liquid monetary assets. This development was
broadly based across sectors. It primarily
refl ects a strong preference for liquidity in the
current environment of very low interest rates
(see Box 3, entitled “The impact of very low
interest rates on monetary dynamics”) and
prevailing high uncertainty.
With regard to counterparties, the annual rate
of growth in credit to the general government
sector, while declining, remained high in
August. MFI loans to the non-fi nancial private
sector contracted further, largely as a result of
signifi cant monthly net redemptions in loans to
non-fi nancial corporations. MFIs’ net external
asset position registered a modest monthly
infl ow, supporting the view that foreign
investors have purchased government bonds
issued by euro area countries.
The volume of euro area MFIs’ main assets
contracted substantially in August. This mainly
refl ected a marked reduction in interbank
lending and external assets.
1 Starting with August 2012 data, M3 excludes repurchase agreements with central counterparties, while private sector loans in the
counterparts to M3 exclude reverse repos of MFIs with central counterparties. The change applies for monetary data since June 2010.
For details, see Box 3, entitled “The adjustment of monetary statistics for repurchase agreement transactions with central counterparties”,
Monthly Bulletin, ECB, September 2012.
Chart 7 M3 growth
(percentage changes; adjusted for seasonal and calendar effects)
-2
0
2
4
6
8
10
12
14
-2
0
2
4
6
8
10
12
14
1999 2001 2003 2005 2007 2009 2011
M3 (annual growth rate)
M3 (three-month centred moving average
of the annual growth rate)
M3 (six-month annualised growth rate)
Source: ECB.
21ECB
Monthly Bulletin
October 2012
ECONOMIC AND MONETARYDEVELOPMENTS
Monetary and
financial
developments
Box 3
THE IMPACT OF VERY LOW INTEREST RATES ON MONETARY DYNAMICS
At its meeting on 5 July 2012, the Governing Council decided to reduce the key ECB interest rates
to unprecedented low levels. In such an environment, well-established empirical relationships
derived from historically observed levels of interest rates might be signifi cantly affected due
to potential non-linear phenomena. Concerning monetary analysis, these effects may relate to:
(i) money demand, including the implications for the signalling properties of money for economic
activity and infl ation; and (ii) money market funds and their role in providing funding to banks.
This box concludes that non-linearities in a close to zero interest rate environment do exist for
money demand, although their signifi cance can be assessed as limited at current interest rate
levels.
Money demand at very low interest rates
Theoretical considerations suggest that extrapolating money demand behaviour that has been
observed within a range of usual levels of interest rates to the case where interest rates approach
zero might not provide reliable information.1 However, the possibility that money demand may
be subject to signifi cant changes as interest rates become very low has important implications
for monetary policy. This is because an atypical increase in money holdings as interest rates
approach zero may be erroneously interpreted as signalling the transmission of monetary stimulus
and therefore the build-up of expansionary pressure, when in fact it may refl ect a change in
conventional money demand behaviour.
Empirical evidence for the effects of very low policy rates over an extended period of time is
scarce, but is for example available for the United States and Japan. For Japan, for instance, there
is strong evidence of non-linearities in the demand for M1 at low rates. This pattern is in line
with standard theoretical predictions of money demand at low opportunity costs. However, it
cannot be ruled out that this observation was affected by the Bank of Japan’s explicit quantitative
easing policy over the period in which the described pattern was observed. For the United States,
by contrast, evidence for the existence of non-linearities in money demand is somewhat weaker.
Empirical results also suggest that new funds tend to be placed in longer-term and riskier assets
in order to benefi t from these assets’ yield pick-up. At the same time, there are no empirical
indications of large-scale stock adjustments out of monetary liabilities, which could put banks
under signifi cant funding stress.
Looking at the link between opportunity costs and income velocity in the euro area reveals a
behaviour that is in line with standard theoretical predictions. The regression line between these
two factors is broadly upward sloping, as higher interest rates lead to a decline in the holdings of
money relative to GDP. However, this linear relationship seems to be far from stable and is less
pronounced for M3 (see Chart A) than for M1 (see Chart B). Since early 2009 when policy rates in
the euro area were cut to unprecedentedly low levels, velocity in both cases exhibited only minor
1 See, among others, Mulligan, C. and Sala-i-Martin, X., “Extensive margins and the demand for money at low interest rates”, Journal of Political Economy, Vol. 108 (5), October 2000, pp. 961-991; Nagayasu, J., “A re-examination of the Japanese money demand function
and structural shifts”, Journal of Policy Modeling, Vol. 25 (4), June 2003, pp. 359-375; and Nakashima, K., “An extremely-low-
interest-rate policy and the shape of the Japanese money demand function”, Macroeconomic Dynamics, Vol. 13 (5), November 2009,
pp. 553-579.

22ECB
Monthly Bulletin
October 2012
movements. However, despite the decline of
policy rates to historical lows, opportunity
costs, after having sharply declined in late
2008, have in fact increased in the euro area
over the last three years, refl ecting the impact
of the sovereign debt crisis on the government
bond yields of a number of euro area countries
(see Chart C). Overall, therefore, the euro area
experience does not point to a rapid decline in
M1 velocity as opportunity costs fall, although
the slope of the regression line has clearly
fl attened as opportunity costs became rather
low.2
The issue of a higher preference for narrow
money in times of low interest rates also
touches upon the question of whether overnight
deposits or banknotes are preferred. So far,
portfolio shifts from other types of assets into
liquid deposits rather than banknotes have
predominantly been observed. This is not least
2 Opportunity costs in the euro area have, as yet, never dropped to the very low levels where non-linear effects would be expected to
manifest themselves. In the United States, where declining long-term yields resulted in opportunity costs close to zero, the demand for
money has indeed increased, resulting in a decline in velocity.
Chart C Remuneration of short-term time and overnight deposits and flows into short-term time deposits in the euro area
(percentages per annum; fl ows in EUR billions)
-60
-40
-20
0
20
40
60
0
1
2
3
4
5
6
spread between short-term time and overnight
deposits, i.e. opportunity cost (left-hand scale)
interest rate on deposits with agreed maturity of up
to one year (left-hand scale)
interest rate on overnight deposits (left-hand scale)
monthly change in holdings of short-term time
deposits by households (right-hand scale)
2003 2004 2005 2006 2007 2008 2009 2010 2011 2012
Sources: ECB and ECB calculations.
Chart A Euro area M3 income velocity and the opportunity cost of M3
(percentages; logarithmic scale)
-0.05
0.00
0.05
0.10
0.15
0.20
-0.05
0.00
0.05
0.10
0.15
0.20
0 1 2 3 4 5 6
y-axis: velocity (log)
x-axis: opportunity cost of M3
Q1 1990-Q4 2000
Q1 2001-Q4 2008
Q1 2009-Q1 2012
y = 0.01x + 0.12
R² = 0.48
y = 0.07x - 0.09
R² = 0.61
Sources: ECB and ECB calculations.
Chart B Euro area M1 income velocity and the opportunity cost of M1
(percentages; logarithmic scale)
0 1 2 3 4 50.0
0.1
0.2
0.3
0.4
0.5
0.6
0.7
0.0
0.1
0.2
0.3
0.4
0.5
0.6
0.7
y = 0.08x + 0.33
R2 = 0.63
x-axis: opportunity cost of M1
y-axis: velocity (log)
Q1 2001-Q4 2008
Q1 2009-Q1 2012
Sources: ECB and ECB calculations.

23ECB
Monthly Bulletin
October 2012
ECONOMIC AND MONETARYDEVELOPMENTS
Monetary and
financial
developments
MAIN COMPONENTS OF M3
As regards the components of M3, the annual growth of M1 increased to 5.1% in August,
from 4.5% in July. This was driven by a sizeable monthly infl ow to overnight deposits, which
was broadly based across sectors. M1 is currently the main contributor to broad money growth,
accounting for 2.6 percentage points of the annual M3 growth of 2.9% in August. The annual growth
of short-term deposits other than overnight deposits (M2 minus M1) declined to 0.8% in August,
from 2.2% in July. This refl ected the shift of funds from short-term time deposits (i.e. deposits
with an agreed maturity of up to two years) into overnight deposits. In addition to the heightened
level of uncertainty, as refl ected in low consumer and business confi dence, the narrowing of the
spread between the remuneration on these two types of deposit partly explains this shift of funds.
By contrast, short-term saving deposits (i.e. deposits redeemable at notice of up to three months)
continued to register a robust monthly infl ow.
The annual growth of marketable instruments (M3 minus M2), which had been on an upward trend
since summer 2011, fell to -0.5% in August, from 4.3% in July, mirroring a strong negative monthly
fl ow. The outfl ows were concentrated predominantly on holdings of MFI debt securities issued with
a maturity of up to two years. In addition, in the current challenging business environment for
money market funds, the money holding sector sold shares/units of those funds, as it had done in
previous months.
because deposits and banknotes are not perfect substitutes, since banknotes can be less readily
mobilised and – beyond a certain threshold – entail signifi cant logistical costs associated with
transport, storage, security and insurance issues. Experience at very low interest rates observed
so far in large currency areas does not point to a large substitution into banknotes.
The consequences of low interest rates for banks’ market-based funding
As a consequence of historically low policy rates in the euro area, net returns on short-term
fi nancial instruments have been meagre for quite some time. In such an environment, money
market funds (MMFs), for instance, experienced withdrawals in recent quarters. Against the
backdrop of declining assets under management at MMFs, the amount of liquidity available
for MMFs’ purchases of banks’ debt securities faded as well. Such a situation could thus
lead to further constraints on credit institutions’ access to funding. As a consequence, the
Governing Council’s decision to cut the interest rate on the ECB’s deposit facility to zero on
5 July triggered some concerns that further declining money market yields might cause
intensifying pressure on MMFs with potential negative consequences for banks’ funding
situation. Besides this, forthcoming regulatory requirements regarding banks’ funding strategies
tend to favour retail funding sources over market-based funding. These developments might thus
weigh on banks’ security-based funding efforts.
The banking industry in the euro area already seems to have anticipated these progressions, for
example by attracting and maintaining retail deposits held by the non-fi nancial private sector.
For instance, to the extent that the increase in overnight deposits stems from money-holding
sector entities’ selling of risky non-bank assets to non-euro area residents, the respective fl ows
ultimately mirror an improvement in banks’ funding position. At the same time, insofar as the
expansion in M1 deposits refl ects portfolio shifts at the expense of other bank liabilities, banks’
funding position is concerned mainly with respect to its maturity.

24ECB
Monthly Bulletin
October 2012
The annual growth rate of M3 deposits (including repurchase agreements) declined to 2.4% in
August, from 2.9% in July. The contribution of non-monetary fi nancial intermediaries other than
insurance corporations and pension funds (OFIs) to annual growth in M3 deposits turned negative
in August, owing to sizeable outfl ows in short-term deposits other than overnight deposits. This
might be related to institutional investors having shifted funds to alternative assets outside M3.
Households continued to be the largest contributor to M3 deposits, as refl ected in the large monthly
fl ow to households’ overnight deposits.
MAIN COUNTERPARTS OF M3
The annual rate of increase in MFI credit to euro area residents declined to 0.5% in August, from
1.0% in July (see Table 2). Credit to the general government continued to grow at a high rate,
although it was signifi cantly lower than that observed in July, primarily on account of a base effect.
Among the components of credit to general government, loans saw modest net redemptions in
August. By contrast, MFIs increased their holdings of government debt securities slightly. At the
same time, MFIs in some countries sold sizeable amounts of these instruments, in part to non-
residents in the context of the improved market sentiment that was also refl ected in the reduced
sovereign bond yields.
The annual growth of credit to the private sector declined further in August, to -1.2%, after -0.9% in
July, mainly refl ecting two developments. First, sizeable monthly net redemptions in MFI loans to
non-fi nancial corporations were observed in August, so that the annual growth of MFI loans to the
private sector (adjusted for loan sales and securitisation) turned negative and stood at -0.2% in that
month, down from 0.1% in July. Second, the annual growth of MFIs’ holdings of securities other
than shares issued by the private sector became signifi cantly more negative. This partly refl ected an
unwinding of past securitisation activities.
Table 2 Summary table of monetary variables
(quarterly fi gures are averages; adjusted for seasonal and calendar effects)
Outstanding amounts as a
percentage of M3 1)
Annual growth rates2011 2011 2012 2012 2012 2012
Q3 Q4 Q1 Q2 July August
M1 51.9 1.4 1.9 2.3 2.8 4.5 5.1Currency in circulation 8.9 4.5 6.2 6.1 5.5 5.9 5.2
Overnight deposits 43.0 0.8 1.0 1.5 2.2 4.3 5.0
M2-M1 (=other short-term deposits) 39.4 3.4 2.3 2.7 2.8 2.2 0.8
Deposits with an agreed maturity of up to two years 18.6 3.1 2.0 3.4 2.7 0.7 -2.3
Deposits redeemable at notice of up to three months 20.9 3.7 2.5 2.1 2.9 3.6 3.8
M2 91.3 2.3 2.1 2.5 2.8 3.5 3.2M3-M2 (=marketable instruments) 8.7 -5.9 -3.6 -0.1 2.6 4.3 -0.5
M3 100.0 1.5 1.5 2.2 2.8 3.6 2.9Credit to euro area residents 2.2 1.1 1.2 1.3 1.0 0.5
Credit to general government 5.2 1.4 5.2 8.4 9.4 8.0
Loans to general government 7.0 -2.1 -4.6 -1.7 1.3 1.7
Credit to the private sector 1.6 1.1 0.3 -0.3 -0.9 -1.2
Loans to the private sector 2.3 1.8 0.7 -0.1 -0.4 -0.6
Loans to the private sector adjusted
for sales and securitisation 2) 2.5 2.0 1.1 0.5 0.1 -0.2
Longer-term fi nancial liabilities (excluding capital and reserves) 3.5 2.6 0.4 -2.4 -4.4 -4.4
Source: ECB.1) As at the end of the last month available. Figures may not add up due to rounding.2) Adjusted for the derecognition of loans from the MFI statistical balance sheet owing to their sale or securitisation.

25ECB
Monthly Bulletin
October 2012
ECONOMIC AND MONETARYDEVELOPMENTS
Monetary and
financial
developments
The annual growth of MFI loans to non-fi nancial corporations (adjusted for loan sales and
securitisation) declined further to -0.5% in August, from -0.2% in July (see Table 3). This
largely refl ected the previously mentioned sizeable monthly net redemptions in August. The net
redemptions were concentrated on short-term and medium-term loans, while the fl ow to long-
term loans was zero. The annual rate of increase in MFIs’ lending to households (adjusted for loan
sales and securitisation) remained unchanged at 1.0% in August. The monthly fl ow was modestly
positive, and was due mainly to lending for house purchase.
Overall, lending to the non-fi nancial private sector in the euro area remains weak by historical
standards and continues to conceal apparent heterogeneous developments across countries, not least
due to differences in the importance of supply and demand factors.
On the demand side, the persistently weak level of economic activity in an environment of high
uncertainty, low consumer and business confi dence and the need to reduce the high debt levels of
both households and corporates have continued to weigh on borrowing in a number of euro area
countries. In addition, cash-rich and large enterprises in some countries have substituted internal
and market-based funding for bank-based funding.
On the supply side, the capital constraints of banks continue to hamper the supply of credit to the
real economy in a number of euro area countries. The fragmentation of fi nancial markets is also
curbing credit growth, albeit to varying degrees across countries. At the same time, the two three-
year longer-term refi nancing operations (LTROs) have substantially alleviated funding pressures and
liquidity concerns for the banking system, thereby preventing disorderly and abrupt deleveraging.
The annual growth of longer-term fi nancial liabilities (excluding capital and reserves) continued
to decline in August, standing at -4.4%. Long-term time deposits (i.e. deposits with an agreed
maturity of over two years) recorded a small infl ow in August, after the strong outfl ow in the
previous month. The infl ow to the money-holding sector’s holdings of long-term debt securities
Table 3 MFI loans to the private sector
(quarterly fi gures are averages; adjusted for seasonal and calendar effects)
Outstanding amount as a percentage
of the total 1)
Annual growth rates2011 2011 2012 2012 2012 2012
Q3 Q4 Q1 Q2 July August
Non-fi nancial corporations 42.7 1.6 1.7 0.7 0.1 -0.4 -0.8Adjusted for sales and securitisation 2) - 2.3 2.0 0.9 0.3 -0.2 -0.5Up to one year 24.7 4.1 3.7 0.6 0.1 0.1 -0.3
Over one and up to fi ve years 17.8 -2.8 -2.6 -3.0 -2.6 -2.7 -3.3
Over fi ve years 57.4 2.1 2.3 2.0 1.0 0.1 -0.1
Households 3) 47.8 3.0 2.2 1.2 0.4 0.3 0.2Adjusted for sales and securitisation 2) - 2.7 2.3 1.9 1.4 1.0 1.0Consumer credit 4) 11.6 -2.0 -2.0 -1.8 -2.1 -2.1 -2.4
Lending for house purchase 4) 72.6 4.0 3.0 1.8 0.9 0.8 0.8
Other lending 15.8 2.4 1.8 0.9 0.2 -0.5 -0.4
Insurance corporations and pension funds 0.8 7.1 4.2 -3.1 -5.4 -8.6 -11.2Other non-monetary fi nancial intermediaries 8.8 1.5 -0.2 -1.8 -3.3 -2.8 -3.4
Source: ECB.Notes: MFI sector including the Eurosystem; sectoral classifi cation based on the ESA 95. For further details, see the relevant technical notes.1) As at the end of the last month available. Sector loans as a percentage of total MFI loans to the private sector; maturity breakdown and breakdown by purpose as a percentage of MFI loans to the respective sector. Figures may not add up due to rounding.2) Adjusted for the derecognition of loans from the MFI statistical balance sheet owing to their sale or securitisation.3) As defi ned in the ESA 95.4) Defi nitions of consumer credit and lending for house purchase are not fully consistent across the euro area.
26ECB
Monthly Bulletin
October 2012
issued by MFIs (i.e. debt securities issued
with a maturity of over two years) remained
negligible. MFIs under stress probably
continued to replace partly maturing debt
securities with liquidity received via the two
three-year LTROs. At the same time, credit
institutions have continued to buy back their
debt securities in order to improve their
capital ratios.
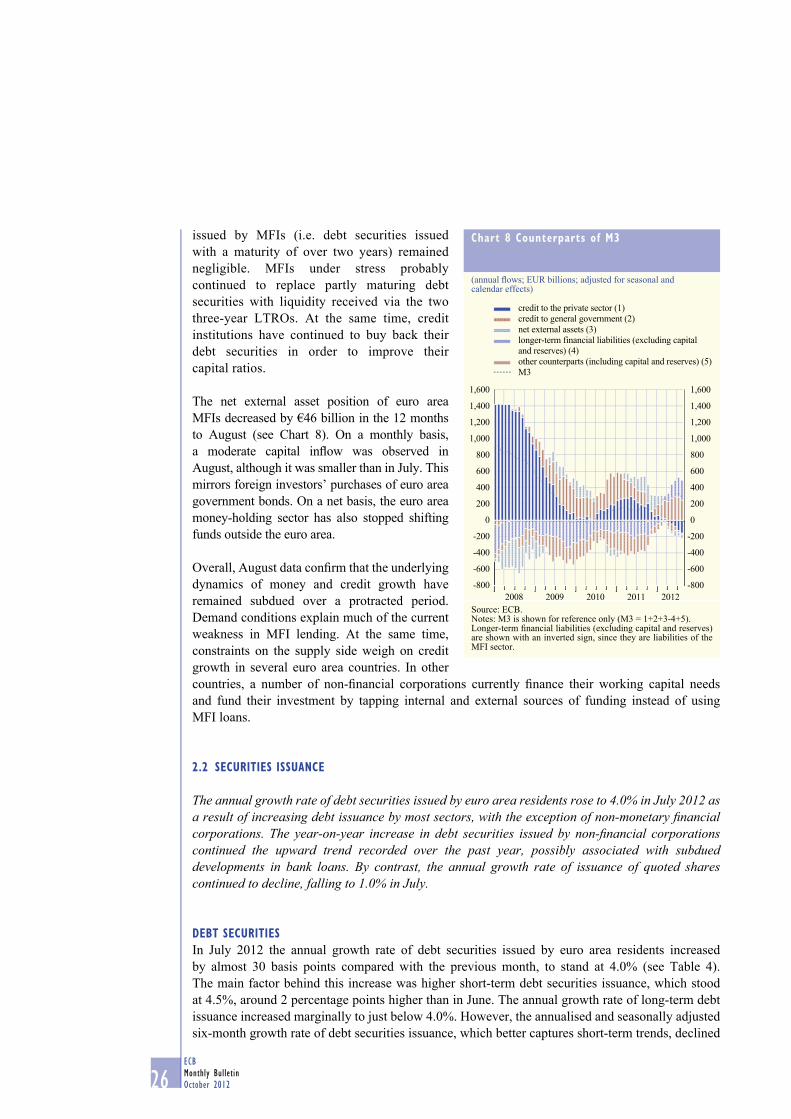
The net external asset position of euro area
MFIs decreased by €46 billion in the 12 months
to August (see Chart 8). On a monthly basis,
a moderate capital infl ow was observed in
August, although it was smaller than in July. This
mirrors foreign investors’ purchases of euro area
government bonds. On a net basis, the euro area
money-holding sector has also stopped shifting
funds outside the euro area.
Overall, August data confi rm that the underlying
dynamics of money and credit growth have
remained subdued over a protracted period.
Demand conditions explain much of the current
weakness in MFI lending. At the same time,
constraints on the supply side weigh on credit
growth in several euro area countries. In other
countries, a number of non-fi nancial corporations currently fi nance their working capital needs
and fund their investment by tapping internal and external sources of funding instead of using
MFI loans.
2.2 SECURITIES ISSUANCE
The annual growth rate of debt securities issued by euro area residents rose to 4.0% in July 2012 as a result of increasing debt issuance by most sectors, with the exception of non-monetary fi nancial corporations. The year-on-year increase in debt securities issued by non-fi nancial corporations continued the upward trend recorded over the past year, possibly associated with subdued developments in bank loans. By contrast, the annual growth rate of issuance of quoted shares continued to decline, falling to 1.0% in July.
DEBT SECURITIES
In July 2012 the annual growth rate of debt securities issued by euro area residents increased
by almost 30 basis points compared with the previous month, to stand at 4.0% (see Table 4).
The main factor behind this increase was higher short-term debt securities issuance, which stood
at 4.5%, around 2 percentage points higher than in June. The annual growth rate of long-term debt
issuance increased marginally to just below 4.0%. However, the annualised and seasonally adjusted
six-month growth rate of debt securities issuance, which better captures short-term trends, declined
Chart 8 Counterparts of M3
(annual fl ows; EUR billions; adjusted for seasonal and calendar effects)
-800
-600
-400
-200
0
200
400
600
800
1,000
1,200
1,400
1,600
-800
-600
-400
-200
0
200
400
600
800
1,000
1,200
1,400
1,600
2008 2009 2010 2011 2012
credit to the private sector (1)
credit to general government (2)
net external assets (3)
longer-term financial liabilities (excluding capital
and reserves) (4)
other counterparts (including capital and reserves) (5)
M3
Source: ECB.Notes: M3 is shown for reference only (M3 = 1+2+3-4+5).Longer-term fi nancial liabilities (excluding capital and reserves) are shown with an inverted sign, since they are liabilities of the MFI sector.

27ECB
Monthly Bulletin
October 2012
ECONOMIC AND MONETARYDEVELOPMENTS
Monetary and
financial
developments
slightly to 3.0%. Using the same measure, debt issuance decreased, or remained broadly unchanged,
in all sectors, with the notable exception of the MFI sector (see Chart 9). Specifi cally, public
borrowing decreased to 3.4% in July, down from 4.2% in the previous month, whereas issuance by
non-fi nancial corporations remained broadly unchanged at 11.0%.
Over recent months, despite some signs of recovery in short-term debt securities issuance,
refi nancing activity has remained concentrated on issuance in the long-term segment, notably at
fi xed rates. The annual rate of increase in the
issuance of fi xed rate long-term debt securities
edged up to 4.9% in July, from 4.8% in June.
At the same time, fl oating rate long-term debt
securities issuance declined to 0.4% in July,
thus remaining at a subdued level.
From a sectoral perspective, and on the basis
of annual rates of growth, debt issuance
increased primarily on the part of MFIs and
general government. Issuance by non-fi nancial
corporations also edged up marginally to 10.2%
in annual terms, thereby continuing the upward
trend recorded since 2011. Specifi cally, in July
a higher pace of expansion in long-term debt
securities issuance more than compensated for
the decline in short-term issuance.
The annual growth of debt securities issued by
the general government sector increased to 4.4%
from 4.2% in June, thereby halting the decline
observed since late 2011. Taking a longer-term
perspective, since the second half of 2009 debt
issuance by the general government sector has
Table 4 Securities issued by euro area residents
Amount outstanding(EUR billions)
2012 July
Annual growth rates 1)
Issuing sector2011
Q32011
Q42012
Q12012
Q22012 June
2012 July
Debt securities 16,858 3.5 3.1 4.1 4.2 3.8 4.0MFIs 5,644 1.9 3.3 4.6 3.8 3.4 4.2
Non-monetary fi nancial corporations 3,289 -0.4 -1.2 -0.5 2.6 1.7 1.4
Non-fi nancial corporations 947 4.9 5.0 6.6 9.1 10.1 10.2
General government 6,977 6.6 4.9 5.8 4.7 4.2 4.4
of which: Central government 6,271 5.9 4.2 4.8 3.8 3.5 3.4
Other general government 706 14.6 13.2 16.8 14.3 11.7 14.8
Quoted shares 4,062 1.9 1.6 1.6 1.4 1.1 1.0MFIs 310 12.4 10.0 10.8 10.0 7.7 5.8
Non-monetary fi nancial corporations 287 5.0 5.2 3.6 3.1 2.8 2.8
Non-fi nancial corporations 3,464 0.4 0.3 0.3 0.3 0.3 0.3
Source: ECB.1) For details, see the technical notes for Sections 4.3 and 4.4 of the “Euro area statistics” section.
Chart 9 Sectoral breakdown of debt securities issued by euro area residents
(six-month annualised growth rates; seasonally adjusted)
-10
0
10
20
30
40
50
60
70
-10
0
10
20
30
40
50
60
70
1999 2001 2003 2005 2007 2009 2011
total
MFIs
non-monetary financial corporations
non-financial corporations
general government
Source: ECB.

28ECB
Monthly Bulletin
October 2012
moderated substantially, refl ecting the fi scal
consolidation efforts undertaken by euro area
countries.
Turning to the fi nancial sector, the annual
growth rate of debt securities issued by MFIs
rose for the second month in a row to 4.2%, up
70 basis points compared with June. This rise
was due primarily to buoyant short-term debt
securities issuance. Finally, the annual growth
rate of debt securities issued by non-monetary
fi nancial corporations fell from 1.7% in June to
1.4% in July.
QUOTED SHARES
The annual growth rate of all quoted shares
issued by euro area residents declined to 1.0%
in July, mainly on account of a moderation in
equity issuance by MFIs (see Chart 10). Indeed,
the annual rate of increase in equity issuance
by MFIs dropped from 7.7% in June to 5.8%
in July – its lowest level since the beginning of
2011. In the fi rst six months of 2012 the sustained level of equity issuance by MFIs refl ected the
need for euro area banks to strengthen their balance sheets by replenishing their capital bases. The
annual growth of quoted shares issued by non-fi nancial corporations and by non-monetary fi nancial
corporations remained broadly unchanged in July at 0.3% and 2.8% respectively.
2.3 MONEY MARKET INTEREST RATES
Money market interest rates decreased slightly between early September and early October 2012. In the ninth maintenance period of 2012, which began on 12 September, the EONIA remained at a low level, refl ecting large amounts of excess liquidity.
Unsecured money market interest rates, as measured by the EURIBOR, decreased slightly
between early September and early October 2012. On 2 October the one-month, three-month,
six-month and twelve-month EURIBOR stood at 0.12%, 0.22%, 0.44% and 0.68% respectively –
i.e. 1, 5, 9 and 10 basis points lower than the levels observed on 5 September. Consequently, the
spread between the twelve-month and the one-month EURIBOR – an indicator of the slope of
the money market yield curve – decreased by 10 basis points, to 57 basis points on 2 October
(see Chart 11).
The three-month EONIA swap rate stood at 0.09% on 2 October, 1 basis point higher than on
5 September. The corresponding EURIBOR decreased by 5 basis points, to 0.22% on 2 October.
This resulted in the spread between the three-month EURIBOR and the three-month EONIA swap
rate decreasing by 6 basis points to stand at 14 basis points, thus remaining broadly in line with the
levels seen prior to summer 2011.
Chart 10 Sectoral breakdown of quoted shares issued by euro area residents
(annual growth rates)
-4
-2
0
2
4
6
8
10
12
14
16
-4
-2
0
2
4
6
8
10
12
14
16
1999 2001 2003 2005 2007 2009 2011
total
MFIs
non-monetary financial corporations
non-financial corporations
Source: ECB.Note: Growth rates are calculated on the basis of fi nancial transactions.

29ECB
Monthly Bulletin
October 2012
ECONOMIC AND MONETARYDEVELOPMENTS
Monetary and
financial
developments
The interest rates implied by the prices of three-month EURIBOR futures maturing in
December 2012 and in March, June and September 2013 stood at 0.19%, 0.20%, 0.23% and 0.26%
respectively on 2 October, thus rising by 2, 2, 1 and 0 basis points respectively in comparison with
the levels observed on 5 September.
Fluctuations in the EONIA were extremely limited in September, continuing the pattern observed
since the beginning of the year. The negative spread between the EONIA and the rate on the main
refi nancing operations refl ected the total amount of excess liquidity. Between 5 September and the
end of the eighth maintenance period of the year on 11 September, the EONIA remained stable at
between 0.10% and 0.11%, amid continued excess liquidity. On 2 October, the EONIA stood at
0.087% (see Chart 12).
The Eurosystem conducted several refi nancing operations between 5 September and 2 October,
all as fi xed rate tender procedures with full allotment. In the main refi nancing operations of the
ninth maintenance period, which were conducted on 11, 18 and 25 September and 2 October, the
Eurosystem allotted €130.3 billion, €119.9 billion, €117.3 billion and €102.9 billion respectively.
The Eurosystem also conducted two longer-term refi nancing operations (LTROs) in September:
a special term refi nancing operation with a maturity of one maintenance period on 11 September
(in which €13.8 billion was allotted) and a three-month LTRO on 26 September (in which
€18.7 billion was allotted).
Moreover, the Eurosystem conducted four one-week liquidity-absorbing operations as variable rate
tender procedures with a maximum bid rate of 0.75% on 11, 18 and 25 September and 2 October.
With these operations, the Eurosystem absorbed in full the liquidity associated with purchases
carried out under the Securities Markets Programme, the outstanding amount of which totalled
€209.5 billion on 2 October.
Chart 11 Money market interest rates
(percentages per annum; spread in percentage points; daily data)
0.5
0.6
0.7
0.8
0.9
1.0
1.1
1.2
1.3
1.4
1.5
0.00
0.25
0.50
0.75
1.00
1.25
1.50
1.75
2.00
2.25
2.50
July July
one-month EURIBOR (left-hand scale)three-month EURIBOR (left-hand scale)
twelve-month EURIBOR (left-hand scale)
spread between twelve-month and one-month
EURIBOR (right-hand scale)
2011 2012Oct. Jan. Apr. Oct.
Sources: ECB and Thomson Reuters.
Chart 12 ECB interest rates and the overnight interest rate
(percentages per annum; daily data)
0.0
0.5
1.0
1.5
2.0
2.5
0.0
0.5
1.0
1.5
2.0
2.5
fixed rate in the main refinancing operations
interest rate on the deposit facility
overnight interest rate (EONIA)
interest rate on the marginal lending facility
July Oct. July Oct.Jan. Apr.2011 2012
Sources: ECB and Thomson Reuters.

30ECB
Monthly Bulletin
October 2012
In the ninth maintenance period of the year, which began on 12 September, average daily recourse
to the deposit facility stood at €311 billion on 2 October.
2.4 BOND MARKETS
Yields on AAA-rated long-term government bonds increased by around 20 basis points in the euro area in the fi rst half of September, before falling back to the levels observed at the end of August. On 2 October they stood at around 1.9%. In the United States, long-term government bond yields increased by around 10 basis points between the end of August and 2 October 2012 to stand at around 1.6% on 2 October. Long-term government bond yields of euro area countries under fi nancial stress fell signifi cantly and, as a result, government bond spreads vis-à-vis Germany narrowed. Over the review period developments in bond markets primarily refl ected improvements in market sentiment following the ECB’s announcement of the modalities for undertaking Outright Monetary Transactions (OMTs) and the fi nal approval of the European Stability Mechanism (ESM) by the German Federal Constitutional Court. Late in the review period market concerns about the economic outlook and fi scal developments in some euro area countries weighed negatively on market sentiment. Uncertainty about future bond market developments in the euro area, as measured by implied bond market volatility, continued to decline. Market-based indicators, although volatile, suggest that infl ation expectations remain fi rmly anchored at levels consistent with price stability.
Between the end of August and 2 October 2012,
yields on AAA-rated long-term euro area
government bonds increased by approximately
20 basis points in the fi rst half of the period
before falling back to the levels observed at the
end of August. On 2 October they stood at around
1.9%. Long-term government bond yields in the
United States increased by 10 basis points over
the review period to around 1.6% on 2 October,
following the same pattern of an increase in the
fi rst half of September with a subsequent decrease
in the second half of the month (see Chart 13).
Developments in sovereign bond markets
in the fi rst half of September refl ect positive
market sentiment in anticipation of the ECB’s
announcement of the OMT modalities and a
further improvement in market sentiment following
the announcement. This was accompanied by an
increase in investors’ appetite for government
bonds of euro area countries under fi nancial
stress, which facilitated an unwinding of
previously observed fl ight-to-safety fl ows. The
positive market momentum in the euro area
was further supported by the fi nal approval of
Chart 13 Long-term government bond yields
(percentages per annum; daily data)
0.6
0.8
1.0
1.2
1.4
1.6
1.8
2.0
2.2
2.4
2.6
1.2
1.4
1.6
1.8
2.0
2.2
2.4
2.6
2.8
3.0
3.2
Oct. Dec. Feb. Apr. June2011 2012
Aug.
euro area (left-hand scale)United States (left-hand scale)Japan (right-hand scale)
Sources: EuroMTS, ECB, Bloomberg and Thomson Reuters.Notes: Long-term government bond yields refer to ten-year bonds or to the closest available bond maturity. The euro area bond yield is based on the ECB’s data on AAA-rated bonds, which currently include bonds from Austria, Finland, France, Germany and the Netherlands.

31ECB
Monthly Bulletin
October 2012
ECONOMIC AND MONETARYDEVELOPMENTS
Monetary and
financial
developments
the ESM by the German Federal Constitutional
Court. Furthermore, the open-ended purchase
programme of agency mortgage-backed
securities announced by the US Federal Reserve
System provided support for riskier assets and
helped to reduce tail risks, thereby pushing up
yields on bonds issued by AAA-rated sovereigns
in general. In the second half of September,
however, market concerns about the economic
outlook and fi scal developments in some euro
area countries, particularly Spain, as well as
the looming “fi scal cliff” in the United States,
offset, to some extent, the positive news that
prevailed in the fi rst half of the month.
The nominal interest rate differential between
ten-year government bond yields in the United
States and those in the euro area slightly
decreased to stand at around 30 basis points on
2 October. In Japan, ten-year government bond
yields remained close to 0.8% over the review
period, staying slightly above the lowest levels
recorded since 2003.
Investors’ uncertainty about short-term bond market developments in the euro area, as measured
by option-implied volatility, further decreased in September by around 100 basis points to stand
at 6.5% on 2 October. Despite the recent decrease, bond market volatility in the euro area remains
high by historical standards, and at levels close to those prevailing just before the default of Lehman
Brothers. In the United States, implied volatility declined by 50 basis points to stand at around
4.3% in early October, which is around 200 basis points below the levels prevailing just before the
default of Lehman Brothers. Implied volatility in Japan remained broadly unchanged, standing at
around 2.0%.
Focusing on developments in the euro area sovereign debt markets, the overall increase in yields on
bonds issued by AAA-rated sovereigns was accompanied by a decline in yields on bonds issued by
sovereigns under fi nancial stress, resulting in the narrowing of government bond spreads across the
majority of euro area countries. More specifi cally, in the period under review the yield spreads on
ten-year sovereign bonds vis-à-vis German sovereign bonds decreased for all euro area countries
but one. By far the largest decrease in the spread – of over 400 basis points – was experienced by
Greece, while the spreads of the other two countries under fi nancial assistance programmes, Ireland
and Portugal, declined by around 100 basis points and 40 basis points respectively. Italy and Spain
also saw signifi cant declines in their spreads of over 100 basis points. The declines took place
in the context of the ECB’s announcement of the OMT modalities, which appeared to lower risk
premia, including those related to fears about a possible break-up of the euro area. Similar or even
more signifi cant improvements for these countries could be observed in market segments for short-
term maturities. As government bond yields of most other euro area countries remained broadly
unchanged, their spreads vis-à-vis German government bonds decreased owing to an increase in the
Chart 14 Implied government bond market volatility
(percentages per annum; fi ve-day moving average of daily data)
0
2
4
6
8
10
12
14
0
2
4
6
8
10
12
14
Oct.2011 2012
Oct.Dec. Feb. Apr. June Aug.
euro areaUnited StatesJapan
Source: Bloomberg.Notes: The implied volatility series refl ects the annualised expected percentage changes in German, Japanese and US ten-year government bond prices over a period of up to three months. It is based on the market values of related traded options contracts.

32ECB
Monthly Bulletin
October 2012
yield on German government bonds. Only Finnish government bond yields grew more than those
on the German Bund, resulting in a wider spread in early October than at the end of August.
The yields on ten-year infl ation-linked euro area government bonds increased by around 20 basis
points in the fi rst half of September, before falling back to the levels observed at the end of August
of around -0.2% (see Chart 15).The yields on the corresponding fi ve-year bonds remained broadly
unchanged, at around -0.8%. The depressed levels of long-term real rates continue to refl ect
investors’ rather gloomy perception of medium-term growth prospects and downside risks to the
economic outlook.
Regarding infl ation perceptions, the implied forward break-even infl ation rate in the euro area
(fi ve-year forward fi ve years ahead) continued to hover around 2.6% in a volatile environment,
infl uenced by the sovereign debt crisis, over the review period (see Chart 16). The infl ation swap
rate with the same time horizon remained broadly unchanged over the period, at around 2.3%. The
somewhat elevated levels of the break-even infl ation rates refl ect a number of technical factors.
First, the partial unwinding of the previous fl ight-to-safety fl ows into AAA-rated nominal bonds
exerted some upward pressure on long-term break-even infl ation rates. Second, Italian non-AAA-
rated infl ation-linked bonds were dropped from some major market indices which led to portfolio
reallocation from these bonds to AAA-rated infl ation-linked bonds, thereby pushing long-term
break-even infl ation rates further upwards. In addition, overall demand for infl ation protection in
the euro area has increased since the ceiling on French bank savings accounts linked to infl ation
(“Livret A” accounts) was raised on 1 October and is expected to be raised again in the coming
Chart 15 Euro area zero coupon inflation-linked bond yields
(percentages per annum; fi ve-day moving averages of daily data; seasonally adjusted)
-1.5
-1.0
-0.5
0.0
0.5
1.0
1.5
2.0
2.5
-1.5
-1.0
-0.5
0.0
0.5
1.0
1.5
2.0
2.5
Oct. Dec. Feb. Apr. June Aug. Oct.
2011 2012
five-year forward inflation-linked bond yield
five years ahead
five-year spot inflation-linked bond yield
ten-year spot inflation-linked bond yield
Sources: Thomson Reuters and ECB calculations.Notes: Since the end of August 2011 real rates have been computed as a GDP-weighted average of separate real rates for France and Germany. Before this date, real rates were computed by estimating a combined real yield curve for France and Germany.
Chart 16 Euro area zero coupon break-even inflation rates and inflation-linked swap rates
(percentages per annum; fi ve-day moving averages of daily data; seasonally adjusted)
1.8
2.0
2.2
2.4
2.6
2.8
1.8
2.0
2.2
2.4
2.6
2.8
Oct. Oct.Dec. Feb. Apr. June Aug.
five-year forward break-even inflation rate
five years ahead
five-year forward inflation-linked swap rate
five years ahead
2011 2012
Sources: Thomson Reuters and ECB calculations.Notes: Since the end of August 2011 break-even infl ation rates have been computed as a GDP-weighted average of separately estimated break-even rates for France and Germany. Before this date, break-even infl ation rates were computed by comparing yields from the nominal yield curve of AAA-rated euro area government bonds with a combined real yield curve derived from French and German infl ation-linked government bonds.

33ECB
Monthly Bulletin
October 2012
ECONOMIC AND MONETARYDEVELOPMENTS
Monetary and
financial
developments
months. Overall, market-based indicators suggest
that infl ation expectations remain fi rmly anchored
at levels consistent with price stability.2
The general pattern of yields on AAA-rated
long-term euro area government bonds can
be broken down into changes in interest rate
expectations (and related risk premia) at different
horizons (see Chart 17). For long maturities, the
implied forward euro area overnight interest
rate prevailing on 2 October shifted upwards
by around 20 basis points compared with that
prevailing at the end of August. For shorter
maturities, however, the implied forward rate
remained broadly unchanged.
Between the end of August and 2 October 2012,
spreads on investment-grade corporate bonds
issued by fi nancial corporations in the euro area
fell (relative to the Merrill Lynch EMU AAA-
rated government bond index). The declines
were more pronounced for lower rated issuers,
while spreads for AA and AAA-rated bonds
decreased only marginally. Over the same
period spreads on investment-grade corporate
bonds issued by non-fi nancial corporations increased slightly for all rating classes except for BBB-
rated issuers whose spreads decreased by around 10 basis points. Overall, recent developments
in corporate bond yields suggest an improvement in market-based fi nancing conditions for fi rms,
especially in the fi nancial sector.
2.5 INTEREST RATES ON LOANS AND DEPOSITS
In July 2012 most MFI interest rates on loans to non-fi nancial corporations and loans to households for house purchase declined or remained broadly unchanged. By contrast, interest rates on loans to households for consumer credit edged up somewhat. The spread between long-term lending rates and the yield on AAA-rated seven-year government bonds widened in July, in a context of high volatility in government bond markets.
In July 2012 the vast majority of short-term MFI interest rates on deposits from households remained
broadly unchanged or increased marginally, while those on deposits from non-fi nancial corporations
declined somewhat. Similarly, short-term interest rates on loans to households remained broadly
unchanged, while those on loans to non-fi nancial corporations declined (see Chart 18). More
precisely, short-term interest rates on loans to households for house purchase remained broadly
unchanged at 3.1%, while those on consumer credit, which are more volatile, increased to 5.8% in
2 For a more thorough analysis of the anchoring of long-term infl ation expectations, see the article entitled “Assessing the anchoring of
longer-term infl ation expectations”, Monthly Bulletin, ECB, July 2012.
Chart 17 Implied forward euro area overnight interest rates
(percentages per annum; daily data)
-0.5
0.0
0.5
1.0
1.5
2.0
2.5
3.0
3.5
4.0
-0.5
0.0
0.5
1.0
1.5
2.0
2.5
3.0
3.5
4.0
2012 2014 2016 2018 2020 2022
2 October 201231 August 2012
Sources: ECB, EuroMTS (underlying data) and Fitch Ratings (ratings).Notes: The implied forward yield curve, which is derived from the term structure of interest rates observed in the market, refl ects market expectations of future levels for short-term interest rates. The method used to calculate these implied forward yield curves is outlined in the “Euro area yield curve” section of the ECB’s website. The data used in the estimate are AAA-rated euro area government bond yields.

34ECB
Monthly Bulletin
October 2012
July from 5.6% in June. On average, rates on households’ overdrafts fell by 15 basis points to 8.5%.
As regards non-fi nancial corporations, banks’ short-term interest rates on small loans (i.e. loans
of up to €1 million) remained broadly unchanged at 4.1%, while those on large loans (i.e. loans
of more than €1 million) declined by 16 basis points to stand at 2.4%. Interest rates on overdrafts
for non-fi nancial corporations also decreased, falling by 12 basis points to 4.1%. Overall, as the
EURIBOR declined by around 25 basis points in July 2012, the spread between the three-month
money market rate and short-term MFI interest rates on loans to households and to non-fi nancial
corporations widened (see Chart 19).
Taking a longer-term perspective, since the beginning of 2012 short-term MFI interest rates on both
loans to households for house purchase and loans to non-fi nancial corporations have decreased.
This development may refl ect the pass-through of changes in market rates to bank lending rates
following the cuts in the key ECB interest rates enacted since November 2011. In addition, the
decline in short-term lending rates may also refl ect the improvements in banks’ liquidity position,
against the background of the two three-year longer-term refi nancing operations conducted in
December 2011 and February 2012 and the broadening of the list of collateral eligible for use in
Eurosystem operations.
Chart 18 Short-term MFI interest rates and a short-term market rate
(percentages per annum; rates on new business)
0
1
2
3
4
5
6
7
8
9
10
0
1
2
3
4
5
6
7
8
9
10
2003 2004 2006 2008 2010 20122005 2007 2009 2011
deposits from households redeemable at notice
of up to three months
deposits from households with an agreed maturity
of up to one yearovernight deposits from non-financial corporations
loans to households for consumption with a floating
rate and an initial rate fixation period of up to one year
loans to households for house purchase with a floating
rate and an initial rate fixation period of up to one year
loans to non-financial corporations of over €1 million
with a floating rate and an initial rate fixation period
of up to one year
three-month money market rate
Source: ECB.Note: Data as of June 2010 may not be fully comparable with those prior to that date owing to methodological changes arising from the implementation of Regulations ECB/2008/32 and ECB/2009/7 (amending Regulation ECB/2001/18).
Chart 19 Spreads of short-term MFI interest rates vis-à-vis the three-month money market rate
(percentage points; rates on new business)
-3.0
-2.5
-2.0
-1.5
-1.0
-0.5
0.0
0.5
1.0
1.5
2.0
2.5
3.0
-3.0
-2.5
-2.0
-1.5
-1.0
-0.5
0.0
0.5
1.0
1.5
2.0
2.5
3.0
2003 2004 2005 2006 2007 2008 2009 2010 2011
loans to non-financial corporations of over €1 million
with a floating rate and an initial rate fixation period
loans to households for house purchase with a floating
rate and an initial rate fixation period of up to one year
deposits from households with an agreed maturity
of up to one year
of up to one year
Source: ECB.Notes: For the loans, the spreads are calculated as the lending rate minus the three-month money market rate. For the deposits, the spread is calculated as the three-month money market rate minus the deposit rate. Data as of June 2010 may not be fully comparable with those prior to that date owing to methodological changes arising from the implementation of Regulations ECB/2008/32 and ECB/2009/7 (amending Regulation ECB/2001/18).

35ECB
Monthly Bulletin
October 2012
ECONOMIC AND MONETARYDEVELOPMENTS
Monetary and
financial
developments
Turning to longer maturities, MFI interest
rates on long-term deposits from households
remained broadly unchanged in July, while those
on deposits from non-fi nancial corporations
declined. Most interest rates on longer-
term loans to households for house purchase
continued to decline, while developments
in interest rates on loans to non-fi nancial
corporations were mixed (see Chart 20).
Specifi cally, rates on loans to households for
house purchase with an initial rate fi xation
period of over fi ve and up to ten years fell to
all-time lows, decreasing by 15 basis points to
3.3%. As regards non-fi nancial corporations,
on average, rates on small loans with an initial
rate fi xation period of over one and up to fi ve
years declined by around 10 basis points to
4.3%. By contrast, the average rates on large
loans with a fi xation period of over one and
up to fi ve years increased by almost 10 basis
points to stand at 3.4%, and those on large
loans with a fi xation period of over fi ve years
remained broadly unchanged at 3.3%.
Taking a longer-term perspective, from January
to July 2012 the spread between long-term
lending rates and the yields on AAA-rated
seven-year government bonds widened overall, primarily refl ecting the downward pressure on
yields on AAA-rated government bonds in the context of fl ight-to-safety fl ows. At the same time,
most long-term lending rates declined, refl ecting the pass-through of past cuts in the key ECB
interest rates as well the effectiveness of the ECB’s non-standard monetary policy measures in
addressing bank funding constraints.
2.6 EQUITY MARKETS
Between the end of August and 2 October 2012 stock prices in both the euro area and the United States increased by around 3%. In particular, fi nancial stock prices in the euro area recorded large increases following the ECB’s announcement of the modalities for undertaking OMTs and the German court ruling on the ESM. Market concerns about fi nancial stability declined, thereby reducing market participants’ worries about tail risks. In the United States, the announcement of further monetary stimulus, with a focus on riskier assets, also signifi cantly reduced risk aversion, thereby bolstering equity prices. In late September data releases pointing to a deterioration in the short-term economic outlook weighed on stock prices in both the euro area and the United States. Stock market uncertainty, as measured by implied volatility, continued to decrease over the review period in both economic areas.
Chart 20 Long-term MFI interest rates and a long-term market rate
(percentages per annum; rates on new business)
1.0
1.5
2.0
2.5
3.0
3.5
4.0
4.5
5.0
5.5
6.0
1.0
1.5
2.0
2.5
3.0
3.5
4.0
4.5
5.0
5.5
6.0
2003 2004 2006 2008 2010 20122005 2007 2009 2011
deposits from non-financial corporations with
an agreed maturity of over two years
deposits from households with an agreed maturity
of over two years
loans to non-financial corporations of over €1 million
with an initial rate fixation period of over five years
loans to households for house purchase with an initial
rate fixation period of over five and up to ten years
seven-year government bond yield
Source: ECB.Note: Data as of June 2010 may not be fully comparable with those prior to that date owing to methodological changes arising from the implementation of Regulations ECB/2008/32 and ECB/2009/7 (amending Regulation ECB/2001/18).

36ECB
Monthly Bulletin
October 2012
In the fi rst half of September stock prices in the euro area, the United States and Japan increased
signifi cantly, but they declined in the second half of the month (see Chart 21). Overall, stock
prices in the euro area, as measured by the broad-based Dow Jones EURO STOXX index, and
stock prices in the United States, as measured by the Standard & Poor’s 500 index, increased by
around 3% between the end of August and 2 October. Over the same period, stock prices in Japan,
as measured by the Nikkei 225 index, remained broadly unchanged.
The increase in the euro area was mainly driven by the strong recovery in fi nancial equity prices,
which increased by around 6% over the review period. Non-fi nancial equity prices also rose, but
at a slower pace, increasing by around 2%. Similarly, in the United States, the fi nancial sector
outperformed the non-fi nancial sector, albeit to a lesser extent.
Market participants’ perceptions of policy-makers’ commitment to taking the necessary steps to
resolve the crisis, as well as the political initiatives to strengthen fi nancial stability, contributed
to the strong performance of the fi nancial market segment in the euro area. In particular, strong
increases in stock prices were recorded following the ECB’s announcement at the beginning of
September of the modalities for undertaking OMTs. The German court ruling on the ESM also
contributed to an improvement in market sentiment. In the United States, the announcement
of further monetary stimulus in mid-September, with a focus on riskier assets, also boosted
investors’ risk appetite signifi cantly. The positive momentum was reversed towards the end
of the month, owing to weaker than expected data releases pointing to a deterioration in the
short-term economic outlook. In particular, the latest survey data signalled weak dynamics in euro
area activity, notably in Germany and France. In the United States, recent data releases provided
Chart 21 Stock price indices
(index: 1 October 2011 = 100; daily data)
90
95
100
105
110
115
120
125
130
135
140
90
95
100
105
110
115
120
125
130
135
140
Oct. Oct.Dec. Feb. Apr. June2011 2012
Aug.
euro area
United States
Japan
Source: Thomson Reuters.Note: The indices used are the Dow Jones EURO STOXX broad index for the euro area, the Standard & Poor’s 500 index for the United States and the Nikkei 225 index for Japan.
Chart 22 Implied stock market volatility
(percentages per annum; fi ve-day moving average of daily data)
10
15
20
25
30
35
40
45
50
10
15
20
25
30
35
40
45
50
2011Oct. Oct.Dec. Feb. Apr. June Aug.
euro area
United StatesJapan
2012
Source: Bloomberg.Notes: The implied volatility series refl ects the expected standard deviation of percentage changes in stock prices over a period of up to three months, as implied in the prices of options on stock price indices. The equity indices to which the implied volatilities refer are the Dow Jones EURO STOXX 50 for the euro area, the Standard & Poor’s 500 for the United States and the Nikkei 225 for Japan.

37ECB
Monthly Bulletin
October 2012
ECONOMIC AND MONETARYDEVELOPMENTS
Monetary and
financial
developments
mixed signals: GDP growth in the second quarter of 2012 was revised down, whereas the housing
market continued to recover. Furthermore, market concerns about fi scal developments in some euro
area countries, particularly Spain, as well as the looming “fi scal cliff” in the United States, weighed
negatively on stock prices. Earnings announcements remained broadly neutral on both sides of the
Atlantic and were not a signifi cant driver of developments in equity prices.
At the country level, stock prices increased in most euro area countries, especially in the fi rst half
of September. Nevertheless, the size of the increases differed across countries, with those where
sovereign debt market tensions have been particularly acute in recent months recording higher
increases.
Stock market uncertainty, as measured by implied volatility, continued to decrease in both the euro
area and the United States, before increasing towards the end of September. Overall, in annualised
terms implied volatility dropped by 3 percentage points to 21% in the euro area and by 2 percentage
points to 13% in the United States (see Chart 22). While implied volatility continues to be lower in
the United States than in the euro area, in both cases the current levels are close to the lowest levels
recorded since the beginning of the year and close to the levels prevailing before the collapse of
Lehman Brothers.

38ECB
Monthly Bulletin
October 2012
3 PRICES AND COSTS
Euro area annual HICP infl ation was 2.7% in September 2012, according to Eurostat’s fl ash estimate, compared with 2.6% in the previous month. This is higher than expected and mainly refl ects increases in indirect taxes and past increases in euro-denominated energy prices. On the basis of current futures prices for oil, infl ation rates could remain at elevated levels, before declining to below 2% again in the course of next year. Over the policy-relevant horizon, in an environment of modest growth in the euro area and well-anchored long-term infl ation expectations, underlying price pressures should remain moderate. Risks to the outlook for price developments continue to be broadly balanced over the medium term.
3.1 CONSUMER PRICES
According to Eurostat’s fl ash estimate, headline HICP infl ation was 2.7% in September 2012,
compared with 2.6% in August (see Table 5). This increase probably refl ects both a lagged
response to past increases in euro-denominated energy prices and increases in indirect taxes. Based
on information from the European Commission’s weekly Oil Bulletin, average consumer prices
for oil products (transport and home heating fuels) in the euro area hit record highs during the
summer of 2012, despite the fact that crude oil prices in US dollar terms remained some way below
the levels reached briefl y in mid-2008. Box 4, entitled “Recent developments in consumer prices
for oil products”, discusses in detail the main components of the pricing chain between crude oil
prices and fi nal consumer prices for oil products, such as exchange rates, refi ning and distribution
margins, and the imposition of taxes.
Table 5 Price developments
(annual percentage changes, unless otherwise indicated)
2010 2011 2012 Apr.
2012 May
2012 June
2012 July
2012 Aug.
2012 Sep.
HICP and its components 1)
Overall index 1.6 2.7 2.6 2.4 2.4 2.4 2.6 2.7Energy 7.4 11.9 8.1 7.3 6.1 6.1 8.9 9.2Food 1.1 2.7 3.1 2.8 3.2 2.9 3.0 2.9
Unprocessed food 1.3 1.8 2.1 1.8 3.1 2.9 3.5 .Processed food 0.9 3.3 3.7 3.4 3.2 2.9 2.7 .
Non-energy industrial goods 0.5 0.8 1.3 1.3 1.3 1.5 1.1 0.8Services 1.4 1.8 1.7 1.8 1.7 1.8 1.8 2.0
Other price indicatorsIndustrial producer prices 2.9 5.9 2.6 2.3 1.8 1.6 2.7 .Oil prices (EUR per barrel) 60.7 79.7 91.4 86.0 76.4 83.4 90.5 87.9
Non-energy commodity prices 44.6 12.2 -3.8 -0.3 0.8 4.7 6.5 4.6
Sources: Eurostat, ECB and ECB calculations based on Thomson Reuters data.1) HICP infl ation and its components (excluding unprocessed food and processed food) in September 2012 refer to Eurostat’s fl ash estimates.
Box 4
RECENT DEVELOPMENTS IN CONSUMER PRICES FOR OIL PRODUCTS
During September 2012 average consumer prices for oil products (transport and home heating
fuels) in the euro area reached record highs, despite the fact that crude oil prices in US dollar
terms remained some way below the levels reached briefl y in mid-2008. Against this background,

39ECB
Monthly Bulletin
October 2012
ECONOMIC AND MONETARYDEVELOPMENTS
Prices
and costs
Chart A Crude oil prices in US dollar and euro terms and the USD/EUR exchange rate
(USD/EUR per barrel; monthly averages)
2004 2005 2006 2007 2008 2009 2010 2011 2012
USD/EUR exchange rate (right-hand scale)
brent crude oil (USD)
brent crude oil (EUR)
0.8
0.9
1.0
1.1
1.2
1.3
1.4
1.5
1.6
1.7
0
20
40
60
80
100
120
140
160
180
Sources: Bloomberg, Thomson Reuters and ECB staff calculations.
Chart B Refining margins (crack spreads)
(USD per barrel; monthly averages)
-5
0
5
10
15
20
25
30
35
40
-5
0
5
10
15
20
25
30
35
40
2004 2005 2006 2007 2008 2009 2010 2011 2012
petrol (gasoline)
diesel (gas oil)
Sources: Bloomberg, Thomson Reuters and ECB staff calculations.
this box discusses the main components of the pricing chain between crude oil prices and fi nal
consumer prices for oil products, such as exchange rates, refi ning and distribution margins, and
the imposition of taxes.1
Crude and refi ned oil prices
Oil products (both crude and refi ned) traded on international markets are generally quoted in US
dollar terms, but it is their price in euro terms that has an impact on euro area consumer prices.
In this regard, the USD/EUR exchange rate stood at around 1.28 in September 2012, compared
with 1.58 in July 2008. Consequently, crude oil prices, which in US dollar terms were
considerably lower in September 2012 than in July 2008 (USD 114 per barrel compared with
USD 134 per barrel), were actually somewhat higher in euro terms (€89 per barrel compared
with €85 per barrel; see Chart A).
Going through the pricing chain, the refi ning of crude oil into either petrol (gasoline) or diesel
(gas oil) adds a further price element. Chart B shows the refi ning margins (or “crack spreads”)
for refi ned petrol and refi ned diesel, which are calculated simply as the difference between the
price of the refi ned product and the price of the crude oil. Refi ning margins are reported in US
dollar terms, as market prices are quoted in US dollars, although it should be noted that it is the
level of refi ning margins in euro terms that matters most for consumer prices for oil products in
the euro area.2 Compared with mid-2008, the refi ning margins for petrol and diesel have moved
in different directions. Those for diesel and gas oil, although still relatively high in a historical
1 See also the box entitled “The evolution of consumer prices for oil products in 2011”, Monthly Bulletin, ECB, Frankfurt am Main,
January 2012.
2 In this box, Brent oil prices are used for crude oil and Rotterdam prices are used for refi ned oil. This is because they are considered to
be the main benchmarks for these prices in Europe.
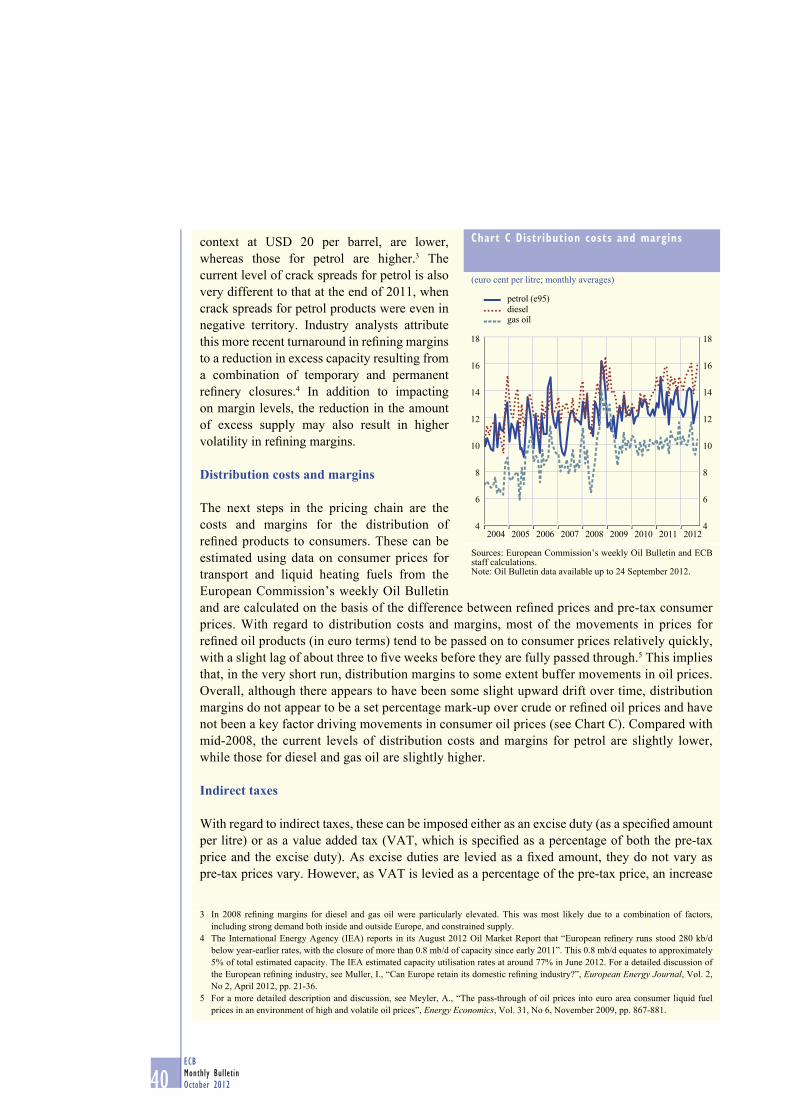
40ECB
Monthly Bulletin
October 2012
context at USD 20 per barrel, are lower,
whereas those for petrol are higher.3 The
current level of crack spreads for petrol is also
very different to that at the end of 2011, when
crack spreads for petrol products were even in
negative territory. Industry analysts attribute
this more recent turnaround in refi ning margins
to a reduction in excess capacity resulting from
a combination of temporary and permanent
refi nery closures.4 In addition to impacting
on margin levels, the reduction in the amount
of excess supply may also result in higher
volatility in refi ning margins.
Distribution costs and margins
The next steps in the pricing chain are the
costs and margins for the distribution of
refi ned products to consumers. These can be
estimated using data on consumer prices for
transport and liquid heating fuels from the
European Commission’s weekly Oil Bulletin
and are calculated on the basis of the difference between refi ned prices and pre-tax consumer
prices. With regard to distribution costs and margins, most of the movements in prices for
refi ned oil products (in euro terms) tend to be passed on to consumer prices relatively quickly,
with a slight lag of about three to fi ve weeks before they are fully passed through.5 This implies
that, in the very short run, distribution margins to some extent buffer movements in oil prices.
Overall, although there appears to have been some slight upward drift over time, distribution
margins do not appear to be a set percentage mark-up over crude or refi ned oil prices and have
not been a key factor driving movements in consumer oil prices (see Chart C). Compared with
mid-2008, the current levels of distribution costs and margins for petrol are slightly lower,
while those for diesel and gas oil are slightly higher.
Indirect taxes
With regard to indirect taxes, these can be imposed either as an excise duty (as a specifi ed amount
per litre) or as a value added tax (VAT, which is specifi ed as a percentage of both the pre-tax
price and the excise duty). As excise duties are levied as a fi xed amount, they do not vary as
pre-tax prices vary. However, as VAT is levied as a percentage of the pre-tax price, an increase
3 In 2008 refi ning margins for diesel and gas oil were particularly elevated. This was most likely due to a combination of factors,
including strong demand both inside and outside Europe, and constrained supply.
4 The International Energy Agency (IEA) reports in its August 2012 Oil Market Report that “European refi nery runs stood 280 kb/d
below year-earlier rates, with the closure of more than 0.8 mb/d of capacity since early 2011”. This 0.8 mb/d equates to approximately
5% of total estimated capacity. The IEA estimated capacity utilisation rates at around 77% in June 2012. For a detailed discussion of
the European refi ning industry, see Muller, I., “Can Europe retain its domestic refi ning industry?”, European Energy Journal, Vol. 2,
No 2, April 2012, pp. 21-36.
5 For a more detailed description and discussion, see Meyler, A., “The pass-through of oil prices into euro area consumer liquid fuel
prices in an environment of high and volatile oil prices”, Energy Economics, Vol. 31, No 6, November 2009, pp. 867-881.
Chart C Distribution costs and margins
(euro cent per litre; monthly averages)
4
6
8
10
12
14
16
18
4
6
8
10
12
14
16
18
petrol (e95)
dieselgas oil
2011 201220052004 2006 2007 2008 2009 2010
Sources: European Commission’s weekly Oil Bulletin and ECB staff calculations.Note: Oil Bulletin data available up to 24 September 2012.

41ECB
Monthly Bulletin
October 2012
ECONOMIC AND MONETARYDEVELOPMENTS
Prices
and costs
in crude oil prices which is passed on to
consumer prices will also result in an increase
in the amount of VAT included in the fi nal
price.
In recent years, partly as a refl ection of the
strong pressures on public fi nances, there have
been a number of increases in both excise
duties on energy products and general VAT
rates, in particular since 2010. Compared with
mid-2008, excise duty and VAT in fuel prices
has increased for all fuel types (see Chart D).
On average, VAT rates have increased by
slightly less than 1 percentage point, while the
amount of excise duty levied has increased
more for petrol and diesel than for gas oil.
Overview
The table illustrates numerically why consumer
prices for oil products in the euro area have
recently reached record highs. Each component has been converted into euro cent per litre terms
for comparability purposes. Considering fi rst fi nal consumer petrol prices including taxes, in
September 2012 these stood, on average, at 171.2 euro cent per litre in the euro area (up 25.1
euro cent from the level – 146.1 euro cent per litre – they stood at in July 2008, when crude
oil prices peaked in US dollar terms). Of this increase, approximately half was attributable to
indirect taxes (which rose from 79.9 euro cent per litre to 92.4 euro cent per litre, refl ecting
a combination of higher excise duties, higher VAT rates and the interaction of VAT with the
increase in pre-tax prices). Pre-tax consumer prices also rose, notwithstanding the decline in
crude oil prices in US dollar terms, refl ecting both exchange rate movements and the increase
Chart D Total indirect taxes
(euro cent per litre; monthly averages)
0
10
20
30
40
50
60
70
80
90
100
0
10
20
30
40
50
60
70
80
90
100
2004 2005 2006 2007 2008 2009 2010 2011 2012
petrol (e95)
diesel
gas oil
Sources: European Commission’s weekly Oil Bulletin and ECB staff calculations.Note: Oil Bulletin data available up to 24 September 2012.
Decomposition of euro area consumer prices for oil products
(euro cent per litre, unless otherwise indicated)
Petrol Diesel Gas oilJuly 2008
September 2012
July2008
September 2012
July2008
September 2012
Crude oil (USD/barrel) 133.9 113.9 133.9 113.9 133.9 133.9
USD/EUR exchange rate 1.58 1.28 1.58 1.28 1.58 1.28
Crude oil (EUR/barrel) 84.9 88.8 84.9 88.8 84.9 88.8
(1) Crude oil 53.4 37% 55.8 33% 53.4 38% 55.8 37% 53.4 53% 55.8 54%(2) Refi ning costs and margins -0.4 0% 9.8 6% 13.2 9% 8.9 6% 13.2 13% 8.9 9%
(3) Distribution costs and margins 13.2 9% 13.2 8% 13.6 10% 16.0 11% 8.8 9% 10.4 10%
(4) Pre-tax consumer price 66.2 45% 78.8 46% 80.2 56% 80.7 53% 75.4 75% 75.2 73%(5) Taxes 79.9 55% 92.4 54% 62.0 44% 70.5 47% 25.8 25% 28.4 27%of which:(5a) Excise duties 56.4 39% 63.8 37% 39.4 28% 45.7 30% 9.6 10% 11.4 11%VAT rate (%) 19.1 20.0 18.8 19.7 19.0 19.7(5b) VAT 23.4 16% 28.6 17% 22.5 16% 24.8 16% 16.2 16% 17.0 16%(6) Final consumer price 146.1 100% 171.2 100% 142.1 100% 151.2 100% 101.2 100% 103.6 100%
Sources: Bloomberg, Thomson Reuters, European Commission’s weekly Oil Bulletin and ECB staff calculations.Note: Oil Bulletin data available up to 24 September 2012.

42ECB
Monthly Bulletin
October 2012
The most recent data from Eurostat include, for the fi rst time, fl ash estimates for the main components
of the HICP, i.e. energy, food, services and non-energy industrial goods. This information shows
that the increase in the annual rate of infl ation in September was due mainly to increases in the
energy and services components, which were only partially offset by decreases in the food and non-
energy industrial goods components.
On the basis of the fl ash estimates published by Eurostat, some preliminary tentative explanations
can be given. The overall increase in HICP infl ation in September 2012 was most likely associated
in refi ning margins. The latter were slightly negative in July 2008, but reached 9.8 euro cent per
litre in September 2012. By contrast, average distribution costs and margins for petrol remained
unchanged at 13.2 euro cent per litre.
With regard to consumer prices for diesel and gas oil, there are some similarities to developments
in petrol prices, but also some noteworthy differences. In terms of similarities, both developments
in exchange rates and indirect taxes contributed to driving up prices, although the increase in
indirect taxes was less strong. However, refi ning margins for diesel and gas oil in September 2012
were lower than the record high levels that prevailed in mid-2008 (accounting for 8.9 euro cent
per litre compared with 13.2 euro cent per litre). Another difference is that average distribution
costs and margins increased somewhat for diesel and gas oil (to 16.0 euro cent per litre and
10.4 euro cent per litre respectively).
To sum up, although crude oil prices in US dollar terms in September 2012 were some way
below their peak in 2008, consumer prices for oil products reached record high levels, owing to
a combination of factors: the lower USD/EUR exchange rate, higher refi ning margins (especially
for petrol) and increases in indirect taxes (both excise duties and VAT).
Chart 23 Breakdown of HICP inflation: main components
(annual percentage changes; monthly data)
-3
-2
-1
0
1
2
3
4
5
-15
-10
-5
0
5
10
15
20
25
2004 2005
total HICP (left-hand scale)
unprocessed food (left-hand scale)
energy (right-hand scale)
2006 2007 2008 2009 2010 2011 2012-1
0
1
2
3
4
-2
0
2
4
6
8
2004 2005 2006 20082007 2009 2010 2011 2012
total HICP excluding energy and unprocessed food
(left-hand scale)processed food (right-hand scale)
non-energy industrial goods (left-hand scale)
services (left-hand scale)
Source: Eurostat.

43ECB
Monthly Bulletin
October 2012
ECONOMIC AND MONETARYDEVELOPMENTS
Prices
and costs
with increases in indirect taxes in a number of countries. Looking at the main components of
the HICP in more detail, energy infl ation rose to 9.2% in September 2012, from 8.9% in August
(see Chart 23). This increase in all likelihood refl ected a combination of a lagged response to the
cumulative increase observed in oil and gas prices earlier this year.
The rate of infl ation in the food component, which comprises processed and unprocessed food,
decreased from 3.0% in August 2012 to 2.9% in September. The downward trend, mainly in
processed food prices, can be attributed to the easing in commodity prices earlier in the year. The
recent increases in international food commodity prices appear to have been short-lived and any
pass-through to consumer prices would take several months.
Eurostat does not publish a fl ash estimate for annual HICP infl ation excluding all food and energy
items, which stood at 1.5% in August 2012, down from 1.7% in July. HICP infl ation excluding
food and energy consists of two main components: non-energy industrial goods and services, which
developed differently.
The annual rate of change in non-energy industrial goods prices fell further to 0.8% in September
2012, from 1.1% in August. Services infl ation stood at 2.0% in September, up from 1.8% in August.
This increase may to some extent refl ect higher indirect taxes and may also be linked to some
pass-through of higher energy prices to components such as transport services. These are transitory
factors and should not affect the underlying infl ationary pressures, which are expected to remain
muted in the current environment.
3.2 INDUSTRIAL PRODUCER PRICES
Industrial producer price infl ation (excluding
construction) stood at 2.7% in August 2012, up
from 1.6% in July (see Table 5 and Chart 24).
This increase is attributable mainly to a strong
increase in the energy component, from 4.5% in
July to 7.9% in August. The producer price index
for industry excluding construction and energy
grew by 1.0% in August year on year, up from
0.8% in July.
Focusing on the later stages of the production
chain, the annual rate of change in the consumer
food component of the producer price index
rose from 2.7% in July to 3.1% in August. In
particular, this increase was driven by hikes in
producer prices for oils and fats that were most
likely related to the recent rise in international
import prices for soybeans and some cereals.
EU import prices for food commodities also
increased in July (see Chart 24), but to a far
lesser extent than international import prices.
Chart 24 Breakdown of industrial producer prices
(annual percentage changes; monthly data)
-10
-8
-6
-4
-2
0
2
4
6
8
10
-25
-20
-15
-10
-5
0
5
10
15
20
25
2004
total industry excluding construction (left-hand scale)
intermediate goods (left-hand scale)capital goods (left-hand scale)
consumer goods (left-hand scale)energy (right-hand scale)
2006 20072005 2008 2009 2010 2011 2012
Sources: Eurostat and ECB calculations.

44ECB
Monthly Bulletin
October 2012
The annual rate of change in the non-food
consumer goods component decreased slightly
to 0.7% in August from 0.8% in July. The
downward trend in non-food consumer goods
prices since the start of 2012, together with
moderate developments in prices for imported
raw materials and intermediate goods, suggests
that pipeline pressures in the non-energy
industrial goods component of the HICP remain
subdued.
Turning to the results of surveys on industrial
producer prices, both the Purchasing Managers’
Index (PMI) survey and European Commission
surveys indicate that price expectations rose again
in September, but nevertheless remained well
below their historical averages (see Chart 25).
The survey data also suggest that the downward
pressure on both input and output prices in industry
continued to wane in September. With regard to the
PMI, the input price index for the manufacturing
sector increased from 48.1 in August to 54.5 in
September, while the output price index also
increased, albeit more moderately, from 48.6 to 49.5 over the same period, remaining just below the
threshold value of 50. Forward-looking European Commission survey data on selling price expectations,
in particular for consumer goods, also increased slightly in September.
Overall, pipeline pressures at the earlier stages of the production and retail chain have remained
relatively muted.
3.3 LABOUR COST INDICATORS
Consistent with the weakness in economic activity and continued slack in the labour market, recent
labour cost indicators have pointed to subdued domestic price pressures (see Table 6 and Chart 26).
Chart 25 Producer input and output price surveys
(diffusion indices; monthly data)
20
30
40
50
60
70
80
90
20
30
40
50
60
70
80
90
2004 2005 2006 2007 2008 2009 2010 2011 2012
manufacturing; input prices
manufacturing; prices charged
services; input prices
services; prices charged
Source: Markit.Note: An index value above 50 indicates an increase in prices, whereas a value below 50 indicates a decrease.
Table 6 Labour cost indicators
(annual percentage changes, unless otherwise indicated)
2010 2011 2011 Q2
2011Q3
2011Q4
2012Q1
2012Q2
Negotiated wages 1.7 2.0 1.9 2.1 2.0 2.0 2.2
Hourly labour cost index 1.6 2.1 2.4 2.2 2.2 1.5 1.6
Compensation per employee 1.7 2.2 2.2 2.2 2.2 1.9 1.6
Memo items:Labour productivity 2.5 1.2 1.2 1.0 0.7 0.4 0.2
Unit labour costs -0.9 1.0 1.0 1.1 1.5 1.5 1.5
Sources: Eurostat, national data and ECB calculations.

45ECB
Monthly Bulletin
October 2012
ECONOMIC AND MONETARYDEVELOPMENTS
Prices
and costs
Compensation per employee grew by 1.6% year
on year in the second quarter of 2012, compared
with 1.9% in the previous quarter. However,
as annual labour productivity growth fell from
0.4% in the fi rst quarter to 0.2% in the second
quarter, year-on-year unit labour cost growth
remained stable, at 1.5%, in the second quarter
of this year.
By contrast, total hourly labour costs in the
euro area grew slightly faster, on average, in
the three months from April to June 2012, by
1.6% year on year, compared with 1.5% in the
previous quarter (see Chart 27). In particular,
this increase was due to an acceleration in
hourly labour cost growth in the industrial
and construction sectors, with hourly labour
cost growth in the services sector remaining
unchanged. In the non-business economy,
there was a slowdown in hourly labour cost
growth. Wages and salaries per hour grew
at nearly the same rate as non-wage costs.
Preliminary data on negotiated wages up to July 2012 confi rm the picture of subdued labour
market conditions, which should help to contain wage pressures via a negative wage drift.
Chart 27 Sectoral labour cost developments
(annual percentage changes; quarterly data)
-2
-1
0
1
2
3
4
5
6
7
-2
-1
0
1
2
3
4
5
6
7
2004 2005 2006 2007 2008 2009 2010 2011 2012
industry excluding construction, CPE
construction, CPE
market services, CPE
services, CPE
-2
-1
0
1
2
3
4
5
6
7
-2
-1
0
1
2
3
4
5
6
7
2004 2005 2006 2007 2008 2009 2010 2011 2012
industry excluding construction, hourly LCIconstruction, hourly LCImarket services, hourly LCI
Sources: Eurostat and ECB calculations.Note: CPE stands for compensation per employee and LCI stands for labour cost index.
Chart 26 Selected labour cost indicators
(annual percentage changes; quarterly data)
1.0
1.5
2.0
2.5
3.0
3.5
4.0
4.5
1.0
1.5
2.0
2.5
3.0
3.5
4.0
4.5
2010 201120092004 20062005 20082007
compensation per employee
negotiated wages
hourly labour cost index
Sources: Eurostat, national data and ECB calculations.

46ECB
Monthly Bulletin
October 2012
3.4 THE OUTLOOK FOR INFLATION
Euro area annual HICP infl ation was 2.7% in September 2012, according to Eurostat’s fl ash
estimate, compared with 2.6% in the previous month. This is higher than expected and mainly
refl ects increases in indirect taxes and past increases euro-denominated energy prices. On the basis
of current futures prices for oil, infl ation rates could remain at elevated levels, before declining to
below 2% again in the course of next year. Over the policy-relevant horizon, in an environment
of modest growth in the euro area and well-anchored long-term infl ation expectations, underlying
price pressures should remain moderate. Current levels of infl ation should thus remain transitory
and not give rise to second-round effects.
Risks to the outlook for price developments continue to be broadly balanced over the medium
term. Upside risks pertain mainly to further increases in indirect taxes, owing to the need for fi scal
consolidation. The main downside risks relate to the impact of weaker than expected growth in the
euro area, in the event of a renewed intensifi cation of fi nancial market tensions, and its effects on
the domestic components of infl ation. If not contained by effective action by all policy-makers in
the euro area, such intensifi cation has the potential to affect the balance of risks on the downside.
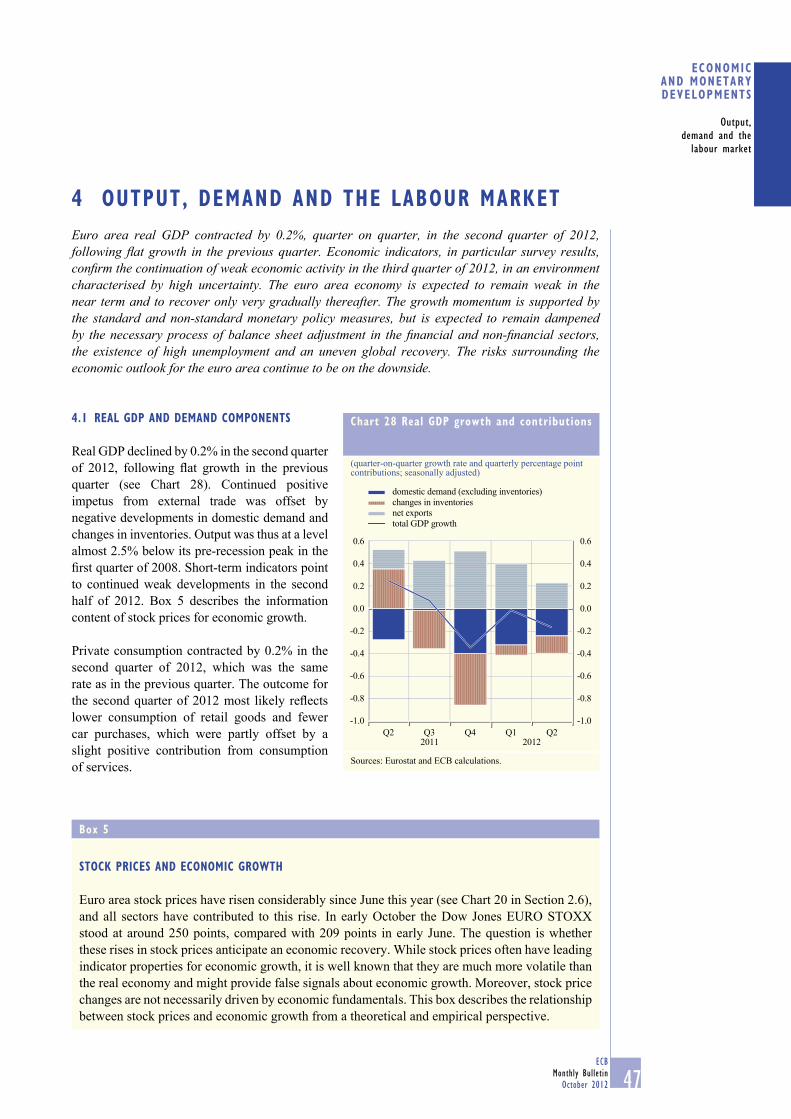
47ECB
Monthly Bulletin
October 2012
ECONOMIC AND MONETARYDEVELOPMENTS
Output,
demand and the
labour market
Euro area real GDP contracted by 0.2%, quarter on quarter, in the second quarter of 2012, following fl at growth in the previous quarter. Economic indicators, in particular survey results, confi rm the continuation of weak economic activity in the third quarter of 2012, in an environment characterised by high uncertainty. The euro area economy is expected to remain weak in the near term and to recover only very gradually thereafter. The growth momentum is supported by the standard and non-standard monetary policy measures, but is expected to remain dampened by the necessary process of balance sheet adjustment in the fi nancial and non-fi nancial sectors, the existence of high unemployment and an uneven global recovery. The risks surrounding the economic outlook for the euro area continue to be on the downside.
4.1 REAL GDP AND DEMAND COMPONENTS
Real GDP declined by 0.2% in the second quarter
of 2012, following fl at growth in the previous
quarter (see Chart 28). Continued positive
impetus from external trade was offset by
negative developments in domestic demand and
changes in inventories. Output was thus at a level
almost 2.5% below its pre-recession peak in the
fi rst quarter of 2008. Short-term indicators point
to continued weak developments in the second
half of 2012. Box 5 describes the information
content of stock prices for economic growth.
Private consumption contracted by 0.2% in the
second quarter of 2012, which was the same
rate as in the previous quarter. The outcome for
the second quarter of 2012 most likely refl ects
lower consumption of retail goods and fewer
car purchases, which were partly offset by a
slight positive contribution from consumption
of services.
4 OUTPUT, DEMAND AND THE LABOUR MARKET
Chart 28 Real GDP growth and contributions
(quarter-on-quarter growth rate and quarterly percentage point contributions; seasonally adjusted)
-1.0
-0.8
-0.6
-0.4
-0.2
0.0
0.2
0.4
0.6
-1.0
-0.8
-0.6
-0.4
-0.2
0.0
0.2
0.4
0.6
Q2 Q3 Q4 Q1 Q22011 2012
domestic demand (excluding inventories)
changes in inventories
net exports
total GDP growth
Sources: Eurostat and ECB calculations.
Box 5
STOCK PRICES AND ECONOMIC GROWTH
Euro area stock prices have risen considerably since June this year (see Chart 20 in Section 2.6),
and all sectors have contributed to this rise. In early October the Dow Jones EURO STOXX
stood at around 250 points, compared with 209 points in early June. The question is whether
these rises in stock prices anticipate an economic recovery. While stock prices often have leading
indicator properties for economic growth, it is well known that they are much more volatile than
the real economy and might provide false signals about economic growth. Moreover, stock price
changes are not necessarily driven by economic fundamentals. This box describes the relationship
between stock prices and economic growth from a theoretical and empirical perspective.

48ECB
Monthly Bulletin
October 2012
Theory
According to common theory, the price of a share equals the sum of all future dividend
payments discounted to its present value. Dividends are often replaced by earnings,
assuming a constant dividend pay-out ratio. The discount factor can be split into a risk-free
component and an equity risk premium. This present value model for the share price implies a
forward-looking passive, or indicator role for stock prices. Higher stock prices refl ect an
increase in the discounted expected earnings, providing potentially useful information about
future economic growth.
Stock prices also play an active role in the economy through various channels. Higher equity
prices provide an extra stimulus for households and fi rms that own, whether directly or indirectly,
for example via pension funds, shares via positive wealth effects. Furthermore, the stock market
is seen as a general measure of the state of the economy through which stock prices affect the
real economy via a confi dence channel. An increase in stock prices provides a stimulus to the
confi dence of households and fi rms and reduces the uncertainty they have about their future
economic situation. Investment also benefi ts from higher stock prices via a lower cost of equity
capital. Firms with a stock exchange notation can fi nance investment more cheaply by issuing
new shares. Higher stock prices also increase the ratio between the market value of installed
capital and the replacement cost of capital. An increase in this ratio, also known as Tobin’s Q,
encourages fi rms to invest more in capital. Higher stock prices also refl ect an increase in the
expected profi ts and thus in the sources of internal fi nance that are ultimately available for
investment. This internal fi nancing channel plays a particularly important role when external
fi nance is not available or is only available against high cost. Another mechanism, through
which stock prices affect the availability and costs of credit, is that higher stock prices improve
the fi nancial position of households and fi rms. This, in turn, allows households and fi rms to
borrow more easily and cheaply and is known as a balance sheet channel. Finally, the equity risk
premium provides an insight into the degree of risk aversion in the economy which, in turn, can
affect the real economy. This channel works through the perceived riskiness of equity and the
risk compensation desired by investors.1
Empirics
Despite a vast empirical literature about the predictive content of stock prices for economic
activity, there is no convincing conclusion. Some studies provide evidence in favour of a positive
relationship between stock prices and economic growth, whereas others argue that this relationship
has broken down.2 A likely explanation for a potential loss of predictive content is more prolonged
bubbles in the stock markets. Stock prices can rise beyond their fundamental or intrinsic value if
they are (temporarily) driven by non-fundamental factors.
1 See the box entitled “Risk-taking and risk compensation as elements in the monetary policy transmission process”, Monthly Bulletin,
ECB, August 2008.
2 For example, using one century of US data, Schwert, G.W. in “Stock returns and real activity: a century of evidence”, Journal of Finance 45(4), 1990, pp. 1237-57, shows that stock prices contain useful information about future economic growth, whereas
Binswanger, M. in “Does the stock market still lead real activity? An investigation for the G-7 countries”, Financial Markets and Portfolio Management 15(1), 2001, pp. 15-29, argues that this relation has broken down in the 1980s and 90s. In a similar vein, Stock
J.H. and Watson M.W. in “Forecasting output and infl ation: the role of asset prices”, NBER Working Paper Series 8180, 2001, show in
their seminal paper that certain asset prices predict output growth in some countries in some periods.
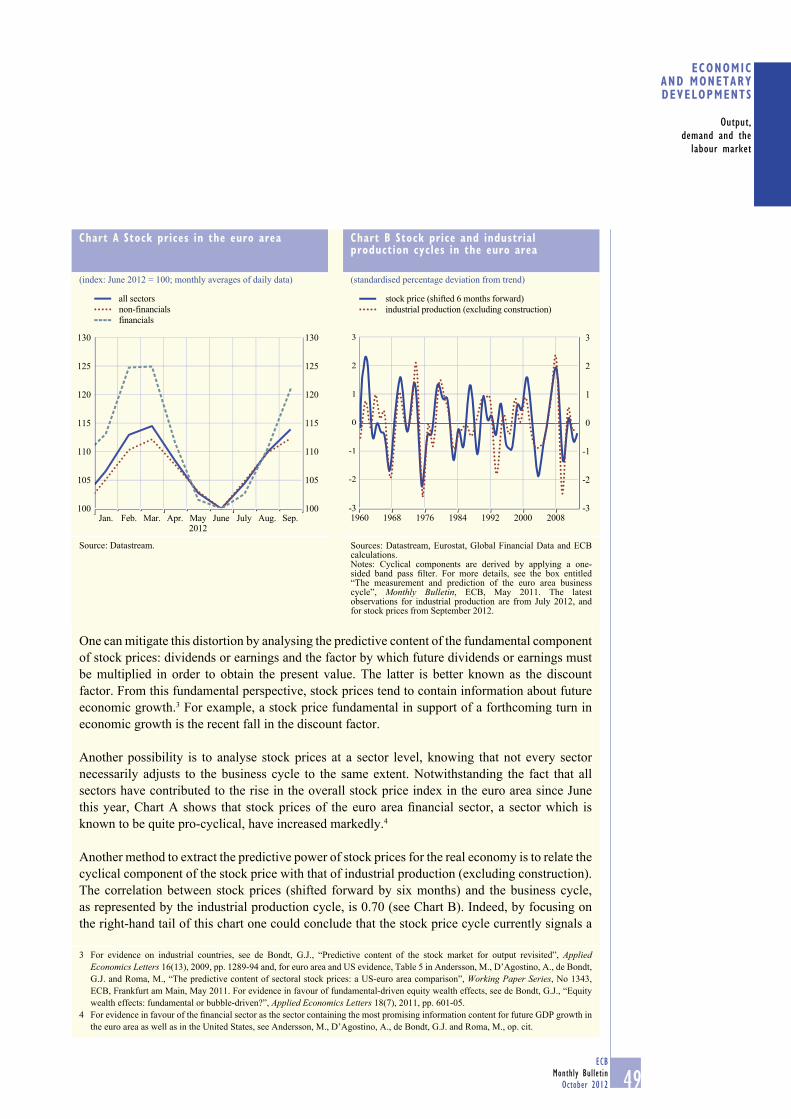
49ECB
Monthly Bulletin
October 2012
ECONOMIC AND MONETARYDEVELOPMENTS
Output,
demand and the
labour market
One can mitigate this distortion by analysing the predictive content of the fundamental component
of stock prices: dividends or earnings and the factor by which future dividends or earnings must
be multiplied in order to obtain the present value. The latter is better known as the discount
factor. From this fundamental perspective, stock prices tend to contain information about future
economic growth.3 For example, a stock price fundamental in support of a forthcoming turn in
economic growth is the recent fall in the discount factor.
Another possibility is to analyse stock prices at a sector level, knowing that not every sector
necessarily adjusts to the business cycle to the same extent. Notwithstanding the fact that all
sectors have contributed to the rise in the overall stock price index in the euro area since June
this year, Chart A shows that stock prices of the euro area fi nancial sector, a sector which is
known to be quite pro-cyclical, have increased markedly.4
Another method to extract the predictive power of stock prices for the real economy is to relate the
cyclical component of the stock price with that of industrial production (excluding construction).
The correlation between stock prices (shifted forward by six months) and the business cycle,
as represented by the industrial production cycle, is 0.70 (see Chart B). Indeed, by focusing on
the right-hand tail of this chart one could conclude that the stock price cycle currently signals a
3 For evidence on industrial countries, see de Bondt, G.J., “Predictive content of the stock market for output revisited”, Applied Economics Letters 16(13), 2009, pp. 1289-94 and, for euro area and US evidence, Table 5 in Andersson, M., D’Agostino, A., de Bondt,
G.J. and Roma, M., “The predictive content of sectoral stock prices: a US-euro area comparison”, Working Paper Series, No 1343,
ECB, Frankfurt am Main, May 2011. For evidence in favour of fundamental-driven equity wealth effects, see de Bondt, G.J., “Equity
wealth effects: fundamental or bubble-driven?”, Applied Economics Letters 18(7), 2011, pp. 601-05.
4 For evidence in favour of the fi nancial sector as the sector containing the most promising information content for future GDP growth in
the euro area as well as in the United States, see Andersson, M., D’Agostino, A., de Bondt, G.J. and Roma, M., op. cit.
Chart A Stock prices in the euro area
(index: June 2012 = 100; monthly averages of daily data)
105
110
115
120
125
130
105
110
115
120
125
130
100Jan. Feb. Mar. Apr. May
2012June July Aug. Sep.
100
all sectors
non-financials
financials
Source: Datastream.
Chart B Stock price and industrial production cycles in the euro area
(standardised percentage deviation from trend)
-2
-1
0
1
2
3
-2
-1
0
1
2
3
-3-31960 1968 1976 1984 1992 2000 2008
stock price (shifted 6 months forward)
industrial production (excluding construction)
Sources: Datastream, Eurostat, Global Financial Data and ECB calculations.Notes: Cyclical components are derived by applying a one-sided band pass fi lter. For more details, see the box entitled “The measurement and prediction of the euro area business cycle”, Monthly Bulletin, ECB, May 2011. The latest observations for industrial production are from July 2012, and for stock prices from September 2012.

50ECB
Monthly Bulletin
October 2012
As regards the short-term outlook, available information tends to confi rm persistent muted
developments in consumer spending. Although retail sales declined by 0.1% in July, they
nonetheless recorded a level somewhat above the average of the second quarter of 2012. Euro area
new passenger car registrations rose by 5.8%, month on month, in August, thereby only partly
reversing the decline of 10.2% in the previous month. The latest volatile developments in car
registrations, which are by no means unusual in a historical comparison, refl ect, at least partly,
the impact of fi scal measures on car purchases in some countries. In the fi rst two months of the
third quarter, car registrations stood almost 7% below the average level in the second quarter.
This represents a signifi cant deterioration
compared with the second quarter when
registrations declined, quarter on quarter,
by 0.5%.
Retail sector survey data for the third quarter
suggest further weakness in the consumption
of retail goods (see Chart 29). Although the
Purchasing Managers’ Index (PMI) for the retail
sector rose from 44.3 in the second quarter to
46.0 in the third quarter, it still remains below
50 thereby indicating a further shrinking of
sales. Moreover, according to the European
Commission’s consumer survey, the indicator
on consumer confi dence declined further in
September. The average level for the third
quarter was signifi cantly below that for the
second quarter. The indicator, which remains
below its long-term average, thus points towards
lacklustre developments in consumer spending.
The indicator of expected major purchases,
which declined in September, continues to
stand at a historically low level, suggesting
that consumers remain cautious when deciding
whether or not to purchase durable goods.
recovery in the euro area growth cycle. However, Chart B also shows that the stock price cycle
did provide false signals in the past. A notable deviation between the two cycles is, for example,
the period between 1986 and early 1987, when the industrial production cycle indicators declined
but the six-month leading stock price cycle picked up strongly and thus provided a clear positive
signal for the growth cycle.
Conclusions
In sum, there are several factors supporting the view that rises in stock prices may anticipate
economic growth, but important caveats apply. From a theoretical perspective, owing to their
passive forward-looking indicator role stock prices have information content for future economic
growth because they are the outcome of discounted future dividends. Stock prices also play an
active role via a wide spectrum of channels through which they affect economic growth. Empirically
speaking the predictive content of stock prices for economic growth is, however, less clear-cut.
Chart 29 Retail sales and confidence in the retail trade and household sectors
(monthly data)
-4
-3
-2
-1
0
1
2
3
4
-40
-30
-20
-10
0
10
20
30
40
2004 2005 2006 2007 2008 2009 2010 2011 2012
total retail sales 1) (left-hand scale)
consumer confidence 2) (right-hand scale)
retail confidence 2) (right-hand scale)
Sources: European Commission Business and Consumer Surveys and Eurostat.1) Annual percentage changes; three-month moving averages; working day-adjusted; including fuel. 2) Percentage balances; seasonally and mean-adjusted.
51ECB
Monthly Bulletin
October 2012
ECONOMIC AND MONETARYDEVELOPMENTS
Output,
demand and the
labour market
Gross fi xed capital formation contracted further, by 0.8% quarter on quarter, in the second quarter
of 2012. Investment has thus fallen for fi ve consecutive quarters, with a cumulative drop of more
than 3% since the fi rst quarter of 2011. With regard to the breakdown of investment in the second
quarter, non-construction as well as construction investment – both accounting for around half of
total investment – fell on a quarterly basis. In line with subdued overall economic activity, capital
formation is expected to continue to contract in the short term.
Industrial production of capital goods (an indicator of future non-construction investment) rose in
July 2012 by 2.1%, month on month. Capital goods production, which declined by 1.4%, quarter on
quarter, in the second quarter, stood in July almost 2% above its average level in the second quarter.
By contrast, more timely survey results, which already cover the three months of the third quarter,
point towards a further decline in the level of non-construction investment activity in that quarter.
The European Commission’s industrial confi dence indicator was well below its historical average,
while the manufacturing PMI remained below the theoretical no-growth threshold of 50 throughout
the third quarter of 2012.
In July 2012 construction production displayed fl at growth, month on month, following a decline
of 0.5% in the previous month. Meanwhile, the construction confi dence indicator published by the
European Commission was still below its historical average in the third quarter. At the same time,
the PMI for construction in the euro area stood signifi cantly below 50 in July and August, pointing
towards further negative developments.
Turning to euro area trade fl ows, they rose in the second quarter of 2012 after a stabilisation in
the fi rst quarter of 2012. Exports of goods and services increased, quarter on quarter, by 1.3%,
while imports rose by 0.9%. Available evidence suggests that both imports and exports slightly
decelerated in the third quarter. The trade fl ows recorded in July were, on average, below the
average level seen in the second quarter. Survey data relating to euro area exports also deteriorated.
In September the PMI new export orders increased to 45.3, but still remained below the theoretical
expansion/contraction threshold of 50. Looking further ahead, growth in euro area exports is
expected to continue at a more moderate pace, on the back of a very gradual, albeit sustained,
strengthening of global economic activity. Broadly consistent with the prospects for economic
activity in the euro area, the near-term outlook for imports remains rather subdued.
4.2 SECTORAL OUTPUT
Real value added shrank, quarter on quarter, by 0.1% in the second quarter of 2012, affected by
weak activity in industry (excluding construction) as well as construction. At the same time, value
added in services recorded fl at growth. The most recent decline in value added, which started in the
third quarter of 2011, is entirely explained by developments in the industrial sector.
With regard to developments in the third quarter of 2012, industrial production (excluding
construction) rose by 0.6% month on month in July, following a decline of the same magnitude in
the previous month. Production in July stood 0.6% above its average level in the second quarter.
This represents an improvement compared with the quarterly decline of 0.5% in the second quarter
of 2012 (see Chart 30). However, considering the volatility of these data, caution is warranted before
drawing conclusions for the quarter as a whole. Furthermore, survey data, which are available for all
months of the third quarter, point to a weakening of industrial activity (see Chart 31). For example,

52ECB
Monthly Bulletin
October 2012
the PMI manufacturing output index declined from 45.2 in the second quarter to 44.6 in the third
quarter, i.e. sliding further below the no-growth threshold of 50.
The latest data confi rm that the underlying growth momentum in the construction industry remains
weak. Production in construction remained stable between June and July, thereby reaching a level
some 0.2% below the outcome for the second quarter. Overall, the feeble start to the third quarter,
combined with negative results from more timely surveys, points to an ongoing contraction in the
construction sector.
Although the PMI index of activity in business services declined between August and September,
it nonetheless marginally improved between the second and third quarters of 2012. The index
continues, however, to record levels below 50, which would be consistent with negative output
developments in the services sector in the third quarter of 2012. Other business surveys, such as
those of the European Commission, paint a slightly more negative picture.
4.3 LABOUR MARKET
The economic and fi nancial crisis has taken a heavy toll on euro area labour markets. Employment
declined further in the fi rst half of 2012, while unemployment has continued to rise. Survey data do
not anticipate an improvement in the period ahead.
Chart 30 Industrial production growth and contributions
(growth rate and percentage point contributions; monthly data; seasonally adjusted)
-11
-10
-9
-8
-7
-6
-5
-4
-3
-2
-1
0
1
2
3
4
-11
-10
-9
-8
-7
-6
-5
-4
-3
-2
-1
0
1
2
3
4
capital goods
consumer goods
intermediate goods
energy
total (excluding construction)
2004 2005 2006 2007 2008 2009 2010 2011 2012
Sources: Eurostat and ECB calculations.Note: Data shown are calculated as three-month moving averages against the corresponding average three months earlier.
Chart 31 Industrial production, industrial confidence and PMI manufacturing output
(monthly data; seasonally adjusted)
-12
-10
-8
-6
-4
-2
0
2
4
-48
-40
-32
-24
-16
-8
0
8
16
2010 2011 20122004 2005 2006 2007 2008 2009
industrial production1) (left-hand scale)
industrial confidence
2) (right-hand scale)
PMI
3) manufacturing output (right-hand scale)
Sources: Eurostat, European Commission Business and Consumer Surveys, Markit and ECB calculations.Note: Survey data refer to manufacturing.1) Three-month-on-three-month percentage changes.2) Percentage balances.3) Purchasing Managers’ Index; deviations from an index value of 50.

53ECB
Monthly Bulletin
October 2012
ECONOMIC AND MONETARYDEVELOPMENTS
Output,
demand and the
labour market
The level of employment remained stable between the fi rst and second quarters of 2012, following
three consecutive quarters of declines (see Table 7). At the sectoral level, on a quarter-on-quarter
basis, the latest fi gure refl ects employment reductions in industry excluding construction as well
as in construction, which were counterbalanced by positive employment growth in the services
sector. In slight contrast to headcount employment, hours worked declined further, by 0.3% quarter
on quarter in the second quarter. The latest survey results point to a further weakening of labour
markets in the third quarter of 2012 (see Chart 32).
Table 7 Employment growth
(percentage changes compared with the previous period; seasonally adjusted)
Persons HoursAnnual rates Quarterly rates Annual rates Quarterly rates2010 2011 2011 2012 2012 2010 2011 2011 2012 2012
Q4 Q1 Q2 Q4 Q1 Q2 Whole economy
of which: -0.5 0.2 -0.2 -0.3 0.0 0.1 0.1 -0.4 -0.1 -0.3
Agriculture and fi shing -0.9 -2.5 -0.9 0.0 0.5 -0.2 -1.5 -0.3 -0.4 -0.3
Industry -3.1 -1.1 -0.8 -0.7 -0.5 -1.5 -1.0 -1.1 0.0 -1.1
Excluding construction -2.9 0.1 -0.3 -0.3 -0.4 -0.3 0.6 -0.4 0.2 -0.6
Construction -3.8 -4.0 -1.8 -1.5 -0.6 -3.8 -4.1 -2.7 -0.5 -2.2
Services 0.4 0.8 -0.1 -0.2 0.2 0.6 0.6 -0.1 -0.1 -0.1
Trade and transport -0.7 0.6 -0.4 -0.3 0.2 -0.3 0.2 -0.7 -0.3 0.1
Information and communication -1.2 1.7 0.6 0.7 0.6 -0.6 1.7 0.6 0.8 0.3
Finance and insurance -0.8 -0.3 0.1 0.0 -0.8 -0.3 0.0 -0.3 -0.2 -1.4
Real estate activities -0.4 3.0 2.4 -1.2 0.7 0.6 3.6 0.9 -1.5 0.9
Professional services 1.7 2.6 0.3 -0.6 0.7 2.3 2.7 0.4 -0.6 0.3
Public administration 1.0 0.1 -0.2 -0.1 0.1 1.1 0.1 0.1 0.3 -0.2
Other services 1) 0.9 0.2 0.2 0.6 -0.5 0.6 -0.3 0.0 0.8 -1.1
Sources: Eurostat and ECB calculations.1) Also includes household services, the arts and activities of extraterritorial organisations.
Chart 32 Employment growth and employment expectations
(annual percentage changes; percentage balances; seasonally adjusted)
-7
-6
-5
-4
-3
-2
-1
0
1
2
3
4
-35
-30
-25
-20
-15
-10
-5
0
5
10
15
20
2004 2005 2007 2009 20112006 2008 2010 2012
employment growth in industry (excluding construction;
left-hand scale)
employment expectations in manufacturing
(right-hand scale)
-25
-20
-15
-10
-5
0
5
10
15
20
25
-25
-20
-15
-10
-5
0
5
10
15
20
25
employment expectations in construction
employment expectations in the retail trade
employment expectations in the services sector
2004 2005 2007 2009 20112006 2008 2010 2012
Sources: Eurostat and European Commission Business and Consumer Surveys.Note: Percentage balances are mean-adjusted.

54ECB
Monthly Bulletin
October 2012
The annual rate of change in productivity per person employed eased further from 0.4% in the fi rst
quarter of 2012 to 0.2% in the second quarter (see Chart 33). This slowdown refl ected developments
in industry excluding construction and services. Similarly, the annual growth rate of hourly labour
productivity decreased further, by 0.4 percentage point, to 0.3% over the same period. Looking
ahead, the latest readings of the PMI productivity index suggest continued low productivity growth
in the third quarter of 2012.
Although the unemployment rate remained unchanged at 11.4% between July and August 2012,
the number of unemployed persons displayed a further rise. The latest outcome is more than
4 percentage points higher than in March 2008, the cyclical low that occurred before the onset of
the fi nancial crisis (see Chart 34).
4.4 THE OUTLOOK FOR ECONOMIC ACTIVITY
Economic indicators, in particular survey results, confi rm the continuation of weak economic
activity in the third quarter of 2012, in an environment characterised by high uncertainty. The euro
area economy is expected to remain weak in the near term and to recover only very gradually
thereafter. The growth momentum is supported by the standard and non-standard monetary policy
measures, but is expected to remain dampened by the necessary process of balance sheet adjustment
in the fi nancial and non-fi nancial sectors, the existence of high unemployment and an uneven
global recovery.
The risks surrounding the economic outlook for the euro area continue to be on the downside.
They relate, in particular, to ongoing tensions in several euro area fi nancial markets and the potential
spillover to the euro area real economy. These risks should be contained by effective action by all
policy-makers in the euro area.
Chart 33 Labour productivity per person employed
(annual percentage changes)
-7
-6
-5
-4
-3
-2
-1
0
1
2
3
4
5
6
7
8
-14
-12
-10
-8
-6
-4
-2
0
2
4
6
8
10
12
14
16
2004
whole economy (left-hand scale)
industry (excluding construction; right-hand scale)
services (left-hand scale)
2006 20072005 20092008 2010 2011 2012
Sources: Eurostat and ECB calculations.
Chart 34 Unemployment
(monthly data; seasonally adjusted)
-200
-100
0
100
200
300
400
500
600
700
7.0
7.5
8.0
8.5
9.0
9.5
10.0
10.5
11.0
11.5
2004 2005 2006 2007 2008 2009 2010 2011 2012
monthly change in thousands (left-hand scale)
percentage of the labour force (right-hand scale)
Source: Eurostat.

55ECB
Monthly Bulletin
October 2012
Global liquidity is a multifaceted concept that can be defi ned and measured in many different ways. There is a broad consensus, however, that in the run-up to the fi nancial crisis the level of global liquidity was an important determinant of asset price and consumer price dynamics in several economic regions. There is also evidence that, more generally, measures of global liquidity are one of the best performing leading indicators of asset price booms and busts. Liquidity is highly pro-cyclical and can quickly evaporate, setting in motion self-sustaining adverse dynamics, as has been observed during the fi nancial crisis.
From a monetary policy perspective, the key issue is the need to understand and assess how domestic and global liquidity can ultimately infl uence domestic price stability. The ECB’s monetary policy strategy, with its monetary pillar and its medium-term orientation, allows for the implications of global liquidity for infl ation to be taken into account and for the adoption of a “leaning against the wind” approach towards fi nancial imbalances, which are often fuelled by global liquidity.
ART ICLES
GLOBAL LIQUIDITY: CONCEPTS, MEASUREMENTS AND IMPLICATIONS FROM A MONETARY POLICY PERSPECTIVE
1 INTRODUCTION
Global liquidity is a multidimensional and
complex phenomenon, which has repeatedly
been proffered as one explanation for fi nancial
developments. It has, at times, been associated
with a number of different developments: stock
market rallies, low bond yields, rising commodity
prices, real estate booms or strong increases in
global monetary and credit aggregates. It has
also been found to infl uence price and output
fl uctuations. The global fi nancial crisis triggered
shortages in global liquidity, at least in certain
markets and regions, risking the setting in motion
of self-sustaining adverse dynamics.
There are several distinct defi nitions of liquidity,
and the most relevant for policy-making are the
following: (i) “monetary liquidity”, which is
defi ned as the ease of converting monetary assets
into goods and services, and (ii) “fi nancial market
liquidity”, which is defi ned as the ease with which
large volumes of fi nancial securities can be
bought or sold without affecting the market price.
Moreover, in the context of fi nancial stability, the
concepts of “offi cial liquidity” – comprising
central bank money including foreign reserves –
and “private liquidity” – largely created in the
private sector – have been defi ned.1
For the conduct of monetary policy, it is
important to understand how global liquidity
can affect price developments via its impact
on international asset and commodity prices,
on risk and term premia in international asset
markets and on money and credit aggregates.
Against this background, Section 2 of this article
provides a detailed defi nition of global liquidity
and discusses possible transmission channels
from a conceptual point of view. Section 3 then
describes the construction and evolution of
various empirical measures of global liquidity.
Section 4 discusses the implications for
monetary policy and Section 5 concludes.
2 UNDERSTANDING GLOBAL LIQUIDITY
Global liquidity is a multifaceted concept, which
cannot be encapsulated by one catch-all defi nition.
This section explores the defi nition of global
liquidity that is most useful from a perspective of
monetary policy geared towards price stability over
the medium term. Further, this section examines
the various sources and implications of global
liquidity conditions from a conceptual viewpoint.
Finally, it discusses the possible transmission
channels of global liquidity.
2.1 DEFINING GLOBAL LIQUIDITY
From a monetary policy perspective, the
relevance of global liquidity derives from its
See 1 Global liquidity – concept, measurement and policy implications, CGFS Publications, No 45, Bank for International
Settlements (BIS), November 2011, to which the ECB
contributed.

56ECB
Monthly Bulletin
October 2012
ultimate effects on consumer price infl ation
over the medium term. Generally, one important
aspect of liquidity is the ease with which an
instrument can be exchanged for goods and
services, giving prominence to the transactions’
motive and suggesting that money can provide
a useful benchmark for liquidity. Money,
notably currency and overnight deposits, is the
asset with the highest degree of liquidity, as it
is the generally accepted medium of exchange
for goods and services. The exchangeability
criterion, therefore, suggests classifying
liquidity into monetary liquidity – closely
associated with the transactions’ motive – and
fi nancial market liquidity – refl ecting the ease
of trading in assets compared with trading in
money. These concepts can be extended to the
global economy.
2.1.1 GLOBAL MONETARY LIQUIDITY
Monetary liquidity can be defi ned as the ease
of converting monetary assets into goods and
services, domestically and across borders. Global
monetary liquidity comprises the holdings of
liquid fi nancial assets by domestic residents and
the portfolio investment in such liquid assets by
non-residents. The former is largely accounted
for by domestic monetary liquidity, while the
cross-border liquidity provided by international
fi nancial markets and internationally active
banks constitutes the incremental element in
global liquidity. However, cross-border capital
fl ows would only constitute liquidity if they
resulted from additional funds provided across
borders, rather than simply from the reallocation
of existing investments.
The concept of monetary liquidity attempts
to capture the ability of economic agents to
settle their transactions using money, an asset
the agents cannot create themselves. Money is
typically seen as the asset which, fi rst, can be
transformed into consumption without incurring
transaction costs, and second, has an exchange
value that is not subject to uncertainty in nominal
terms, rendering it the most liquid asset in the
economy. Strictly speaking, these characteristics
apply only to currency. The question of which
other assets can be defi ned as money depends on
the degree of substitutability between currency
and these other assets. In practice, the defi nition
of money in an economy generally includes
those other assets which can be easily converted
into currency: short-term bank deposits are an
obvious example.
Generally, a higher level of money holdings
allows for a higher volume of immediate
transaction settlement. However, agents’
liquidity, for instance, varies according to the
synchronisation of their receipts and payments.
For a given amount of money held, the more
synchronised the agents’ receipts and payments,
the greater the agents’ liquidity. Additional
factors may affect agents’ ability to obtain
liquidity and thus their “potential” liquidity
situation. For instance, the soundness of agents’
balance sheets determines their credibility as
sound counterparties and, therefore, their ability
to trade less liquid assets for liquid assets.
Translating the main aspects of defi ning
monetary liquidity (i.e. the ease of convertibility
into consumption and capital certainty) into a
multi-country setting is not straightforward,
implying that even if liquidity were
appropriately determined at the domestic level,
a similar measure used for different countries
may not correctly capture the global dimension
of liquidity.
2.1.2 GLOBAL FINANCIAL MARKET LIQUIDITY
Financial market liquidity is generally defi ned as
the ease of trading in assets compared to trading in
money, thus refl ecting the cost of converting a
fi nancial asset into money. Since trading implies a
cost to those conducting the transaction, this notion
of liquidity also embodies the ability of fi nancial
markets to absorb large transactions in securities
without any signifi cant effect on prices.2
In practice, there are few markets in which the
assumption of ideal fi nancial market liquidity
conditions can be maintained on a continuous
basis. Rather, in most cases, fi nancial market
Amihud, Y., Mendelson, H. and Pedersen, L., “Liquidity and 2
Asset Prices”, Foundations and Trends in Finance, Vol. 1, No 4,
2005, pp. 269-364.

57ECB
Monthly Bulletin
October 2012
ARTICLES
Global liquidity:
concepts, measurements
and implications
from a monetary
policy perspective
liquidity is imperfect, mainly refl ecting
the existence of information asymmetries
(e.g. the cost of acquiring and processing
relevant information, and the existence of
private information) and transaction costs
(e.g. brokerage fees).
Greater fi nancial market liquidity brings markets
closer to the theoretical ideal of a frictionless
environment in which two agents can conduct a
mutually benefi cial trade.
2.1.3 THE RELATIONSHIP BETWEEN MONETARY
AND FINANCIAL MARKET LIQUIDITY
Monetary liquidity and fi nancial market
liquidity are related. First, as fi nancial market
liquidity increases for a particular instrument,
the cost of transforming that instrument into
money diminishes, so that at the limit of
zero cost, the instrument could be defi ned as
money. Generally, the choice of which assets
to defi ne as money is based on the degree
of substitutability between banknotes and
coins, and these other assets. This degree of
substitutability refl ects the capital certainty
of the assets, which is in turn related to the
volatility of their prices. Thus, the defi nition
of money in an economy generally includes
assets with high fi nancial market liquidity, in
addition to banknotes and coins. The higher the
fi nancial market liquidity of an asset, the more
likely it is to be included in a specifi c measure
of money. There is thus no absolute standard
by which to classify liquidity, but rather
a continuous scale, as illustrated in Chart 1.
Second, negative interaction between fi nancial
market and monetary liquidity can arise in a
situation of both high volatility and weakening
fi nancial soundness. Financial market
volatility heightens uncertainty in relation to
the appropriate valuation of assets, thereby
exacerbating information asymmetries and
increasing the premia on risky assets, implying
lower asset valuations that lead to higher margin
requirements and less trading. During such
periods of fi nancial market uncertainty, fi nancial
market participants face increased funding
requirements, as they have to cover their margin
calls and attempt to stabilise their liquidity
situation. Some agents in the economy may
experience a “liquidity squeeze”. Uncertainty
regarding the degree to which agents are affected
by such a liquidity squeeze can bring trading
to a standstill and thus dry up fi nancial market
liquidity. At the same time, for those agents
not trading on the fi nancial markets and for
the economy more widely, monetary liquidity
may still be ample, for example as a result of
monetary policy supporting the functioning of
money markets via non-standard measures, with
the ultimate goal of countering downward risks
to price stability.
2.2 SOURCES OF GLOBAL LIQUIDITY
It is useful to distinguish between two major
categories of sources/drivers of global liquidity:
(i) macroeconomic factors including (among
other things) the monetary policy stance and
current account imbalances; and (ii) fi nancial
factors.
Chart 1 Conceptual representation of a liquidity spectrum
1 2 3 4 5 6 7 8
1 notes and coins
2 short-term bank deposits
3 money market funds
4 short-term government
bonds
5 long-term government bonds
6 blue chip stocks
7 corporate bonds/
small-cap stocks
8 lower rated bonds
less
liquid
highly
liquid
well-functioning capital marketsless well-functioning capital markets
Source: ECB.Note: Asset classes are ordered by a priori considerations with regard to their liquidity.

58ECB
Monthly Bulletin
October 2012
As regards macroeconomic factors, the
chosen monetary policy stance is an important
determinant of money and credit growth
domestically, but also at the global level.3
Monetary policy actions affect the setting
of market interest rates and prices in the
economy through various channels, thereby
affecting economic activity and infl ation.
Through its infl uence on market interest
rates, monetary policy can also affect
liquidity conditions in fi nancial markets, for
instance through the risk-taking behaviour of
economic agents. Another important factor is
the existence of global imbalances, which also
have a signifi cant effect on global liquidity
conditions. Over the past two decades, the
magnitude of current account imbalances, as a
share of GDP in the main external surplus and
defi cit economies, has pointed to widening
global imbalances, reaching a peak in the years
2006-08. The bulk of these global imbalances
refl ect a large current account defi cit in the
United States, and a high level of foreign
exchange reserves resulting from substantial
surpluses built up by China and oil-exporting
countries. Many surplus economies have
accumulated large foreign exchange reserves
in order to control the appreciation effect of
capital infl ows on the exchange rate. The bulk
of the assets consisted of low-risk instruments
(such as US Treasury securities or dollar
deposits). Given the tight linkages between
advanced economies’ bond markets, the low
levels of interest rates in the United States
have also created spillover effects in other
major markets. Hence, the widening of global
imbalances and the resulting feedback loop on
asset prices worldwide has also had a marked
impact on global liquidity conditions.
There are well-founded reasons for believing
that certain common global fi nancial factors
affect individual countries’ fi nancial market
liquidity trends. In particular, the following
three factors have probably driven global
fi nancial market liquidity conditions. First, over
recent decades national fi nancial markets have
become better integrated at the global level,
which has, inter alia, reduced information
asymmetries. This has promoted larger cross-
border fi nancial fl ows and increased the diversity
of investors, which, in turn, has had a positive
impact on global market liquidity. The current
fi nancial crisis has partly reversed the integration
of European fi nancial markets,4 however, the
fi nancial integration of emerging market
economies continues. Second, fi nancial market
deregulation has brought about many new
fi nancial instruments, leading to an increase in
risk-sharing and hedging possibilities. It has
also boosted competition, which has resulted in
lower brokerage fees (i.e. lower transaction
costs). Overall, the many new fi nancial
instruments have increased fi nancial market
liquidity.5 Third, fi nancial integration and
innovation have also infl uenced agents’ attitudes
towards risk, spurring elevated risk appetite
during boom periods. More fi nancial innovation
and deeper fi nancial integration have contributed
to a surge in global liquidity, bringing with it the
risk of costly asset price booms and busts with
ultimate risks to price stability.
2.3 GLOBAL LIQUIDITY TRANSMISSION CHANNELS
From a monetary policy perspective, the key
issue is the need to understand how global
liquidity can ultimately infl uence domestic
price stability. This issue is closely related to
the mechanisms of monetary transmission at the
international level.
In theory, an accommodative monetary policy
stance may generate liquidity spillovers at the
global level via two mechanisms. First, via a
“push effect”, in the event of monetary policy
supporting the ample provision of monetary
liquidity in one country through strong money
and credit growth and thus inducing capital
outfl ows to foreign asset markets, with the effect
of raising demand for assets abroad and thereby
exerting upward pressure on prices of fi nancial
See the article entitled “The ECB’s monetary policy stance during 3
the fi nancial crisis”, Monthly Bulletin, ECB, January 2010.
Financial integration in Europe4 , ECB, Frankfurt am Main,
April 2012.
Stark, J., “Globalisation and monetary policy: from virtue to 5
vice?”, speech, Dallas, United States, 29 November 2011.
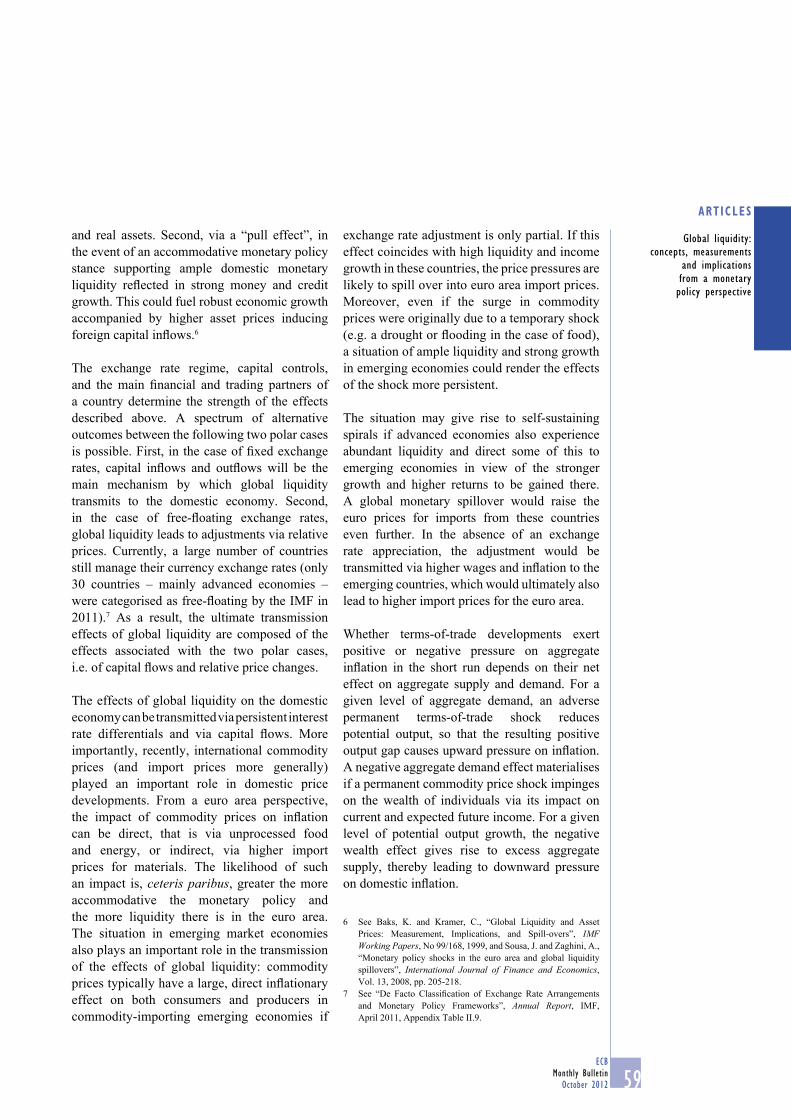
59ECB
Monthly Bulletin
October 2012
ARTICLES
Global liquidity:
concepts, measurements
and implications
from a monetary
policy perspective
and real assets. Second, via a “pull effect”, in
the event of an accommodative monetary policy
stance supporting ample domestic monetary
liquidity refl ected in strong money and credit
growth. This could fuel robust economic growth
accompanied by higher asset prices inducing
foreign capital infl ows.6
The exchange rate regime, capital controls,
and the main fi nancial and trading partners of
a country determine the strength of the effects
described above. A spectrum of alternative
outcomes between the following two polar cases
is possible. First, in the case of fi xed exchange
rates, capital infl ows and outfl ows will be the
main mechanism by which global liquidity
transmits to the domestic economy. Second,
in the case of free-fl oating exchange rates,
global liquidity leads to adjustments via relative
prices. Currently, a large number of countries
still manage their currency exchange rates (only
30 countries – mainly advanced economies –
were categorised as free-fl oating by the IMF in
2011).7 As a result, the ultimate transmission
effects of global liquidity are composed of the
effects associated with the two polar cases,
i.e. of capital fl ows and relative price changes.
The effects of global liquidity on the domestic
economy can be transmitted via persistent interest
rate differentials and via capital fl ows. More
importantly, recently, international commodity
prices (and import prices more generally)
played an important role in domestic price
developments. From a euro area perspective,
the impact of commodity prices on infl ation
can be direct, that is via unprocessed food
and energy, or indirect, via higher import
prices for materials. The likelihood of such
an impact is, ceteris paribus, greater the more
accommodative the monetary policy and
the more liquidity there is in the euro area.
The situation in emerging market economies
also plays an important role in the transmission
of the effects of global liquidity: commodity
prices typically have a large, direct infl ationary
effect on both consumers and producers in
commodity-importing emerging economies if
exchange rate adjustment is only partial. If this
effect coincides with high liquidity and income
growth in these countries, the price pressures are
likely to spill over into euro area import prices.
Moreover, even if the surge in commodity
prices were originally due to a temporary shock
(e.g. a drought or fl ooding in the case of food),
a situation of ample liquidity and strong growth
in emerging economies could render the effects
of the shock more persistent.
The situation may give rise to self-sustaining
spirals if advanced economies also experience
abundant liquidity and direct some of this to
emerging economies in view of the stronger
growth and higher returns to be gained there.
A global monetary spillover would raise the
euro prices for imports from these countries
even further. In the absence of an exchange
rate appreciation, the adjustment would be
transmitted via higher wages and infl ation to the
emerging countries, which would ultimately also
lead to higher import prices for the euro area.
Whether terms-of-trade developments exert
positive or negative pressure on aggregate
infl ation in the short run depends on their net
effect on aggregate supply and demand. For a
given level of aggregate demand, an adverse
permanent terms-of-trade shock reduces
potential output, so that the resulting positive
output gap causes upward pressure on infl ation.
A negative aggregate demand effect materialises
if a permanent commodity price shock impinges
on the wealth of individuals via its impact on
current and expected future income. For a given
level of potential output growth, the negative
wealth effect gives rise to excess aggregate
supply, thereby leading to downward pressure
on domestic infl ation.
See Baks, K. and Kramer, C., “Global Liquidity and Asset 6
Prices: Measurement, Implications, and Spill-overs”, IMF Working Papers, No 99/168, 1999, and Sousa, J. and Zaghini, A.,
“Monetary policy shocks in the euro area and global liquidity
spillovers”, International Journal of Finance and Economics,
Vol. 13, 2008, pp. 205-218.
See “De Facto Classifi cation of Exchange Rate Arrangements 7
and Monetary Policy Frameworks”, Annual Report, IMF,
April 2011, Appendix Table II.9.

60ECB
Monthly Bulletin
October 2012
The discussion in this section shows that the
transmission channels of global liquidity are
complex and that they may be diffi cult to
identify. Therefore, a broad range of indicators
should be used to measure global liquidity.
3 MEASURING GLOBAL LIQUIDITY
This section provides selected examples of
empirical measures of global liquidity conditions,
most of which have also been identifi ed as useful
in the work of the BIS Committee on the Global
Financial System.8 The indicators discussed
below are imperfect measures and are infl uenced
by a variety of factors. For policy-makers, it is,
therefore, important to look at a broad set of
indicators when gauging global liquidity
conditions.
In line with the conceptual distinction made
between monetary and fi nancial market liquidity,
a similar distinction is made below between the
indicators of global liquidity.
3.1 GLOBAL MONETARY LIQUIDITY INDICATORS
Many empirical indicators can be used as global
monetary liquidity indicators. This section limits
the indicators to a core set: those derived from
money and credit aggregates, banking statistics
and interest rates. To gauge global monetary
liquidity conditions, the measures are aggregated
for advanced economies and emerging markets.
Measures of global monetary and credit growth
aggregated from national data are typically
used to construct a proxy for global monetary
liquidity. Such proxies vary according to
choices made regarding (i) the breadth of the
selected monetary or credit aggregate; (ii) the
geographical coverage; and/or (iii) the exchange
rates used to convert the quantities in national
currencies into one single currency.
A measure of global liquidity can be constructed
based on narrow monetary aggregates (typically
banknotes and coins plus highly liquid bank
deposits, such as overnight deposits) or based on
broad monetary aggregates (that also include less
liquid bank deposits and marketable instruments
issued by monetary fi nancial institutions).
A narrow monetary aggregate has the advantage
of components being typically more homogenous
across economies, rendering the resulting
measure easier to interpret. However, broad
monetary aggregates typically provide a less
volatile picture of monetary growth in individual
economies, as they internalise substitution among
the different liquid assets. At the same time, the
broader the monetary aggregate, the greater its
capacity to measure monetary as well as fi nancial
market liquidity.
A comparison of a measure of money growth
for advanced economies (Canada, Japan, the
United Kingdom, the United States and the
euro area) with a similar measure for ten major
emerging market economies (see Chart 2)
See the report mentioned in footnote 1.8
Chart 2 Nominal money and credit growth in advanced economies and emerging market economies
(annual percentage changes)
-5
0
5
10
15
20
25
-5
0
5
10
15
20
25
emerging market economies broad money
advanced economies broad money
advanced economies creditemerging market economies credit
1998 2000 2002 2004 2006 2008 2010 2012
Sources: ECB, Eurostat, BIS, IMF and ECB calculations.Note: Advanced economies broad money and credit is the simple sum of broad money and credit aggregates in Canada, Japan, the United Kingdom and the United States converted into euro using purchasing power parity exchange rates as well as in the euro area. Emerging market economies broad money and credit is the simple sum of broad money and credit aggregates in Brazil, Chile, China, India, Malaysia, Mexico, Russia, South Africa, South Korea, Saudi Arabia converted into euro using purchasing power parity exchange rates.

61ECB
Monthly Bulletin
October 2012
ARTICLES
Global liquidity:
concepts, measurements
and implications
from a monetary
policy perspective
suggests that the patterns are broadly similar,
at least prior to the onset of the fi nancial crisis.
In the period leading up to the fi nancial crisis,
i.e. from 2003 to 2007, both groups of countries
saw high and increasing money and credit
growth, potentially signalling strong increases in
monetary and fi nancial market liquidity. These
developments refl ected fi nancial innovation and
deeper fi nancial integration, which contributed to
improving the fi nancial intermediation process,
ultimately facilitating the provision of money
and credit to the economies. The difference
between the aggregated broad money growth
rates of the two groups was reasonably stable
in the eight years until 2009. It mostly refl ected
different real output growth and infl ation rates.
Monetary growth in the advanced economies
group has slowed considerably during the
fi nancial crisis, following a period of strong
growth. The counterparts of money may provide
some information on the sources and strength
of liquidity creation. Therefore, Chart 2 also
shows credit aggregates constructed in a manner
similar to the monetary aggregates. These credit
growth measures have tended to move closely in
line with broad money growth in advanced and
emerging market economies, with the notable
exception of the period 2001-04. This period
was characterised by heightened fi nancial
market and geopolitical uncertainty, leading to
an unusually widespread preference for holding
liquid instruments that are included in monetary
aggregates. Thus money growth during this
period led to an exaggerated perception of risks
to price stability.9
By design, monetary aggregates generally focus
on the holdings of monetary assets by the
resident money-holding sectors in each
country.10 For the analysis of global asset price
developments, global measures based on cross-
border short-term capital fl ows may provide
useful information,11 as these fl ows are likely to
refl ect the speculative short-term arbitrage
transactions. Developments in banks’ cross-
border asset stocks reported by the Bank for
International Settlements (BIS) 12 can provide
insight into the strengthening of international
fi nancial fl ows. An analysis that examines
linkages between global imbalances and capital
fl ows and/or short-term speculative capital fl ows
needs to include global interbank/credit
relationships and foreign currency holdings of
central banks in a global liquidity aggregate.
Chart 3 illustrates that bank liabilities to non-
resident non-banks and to non-resident banks
follow a broadly similar cycle, with the former
exhibiting, however, much larger fl uctuations.
The measure of bank liabilities to non-resident
affi liates provides an indication of the type of
capital fl ows that may be passed on from a
jurisdiction (where deposits are collected) to
See the article entitled “Money demand and uncertainty”, 9
Monthly Bulletin, ECB, October 2005.
According to the IMF’s Monetary and Financial Statistics 10
Manual, money holders are “usually defi ned to include all
resident sectors except depository corporations and the central
government”.
For each national monetary aggregate, cross-border short-term 11
fl ows are treated as holdings of non-residents.
For recent reports see the “Statistical release: preliminary 12
locational and consolidated international banking statistics at
end-March 2012”, BIS, July 2012 and “International banking
and fi nancial market developments”, BIS Quarterly Review, BIS,
September 2012, pp. 1-20.
Chart 3 Bank liabilities vis-à-vis non-residents
(annual percentage changes; contributions in percentage points)
0
5
10
15
20
25
30
35
1978 1984 1990 1996 2002 2008-15
-10
-5
0
5
10
15
20
25
30
35
-15
-10
-5
liabilities vis-à-vis non-resident banks
liabilities vis-à-vis non-resident non-banks
total liabilities vis-à-vis non-residents
liabilities vis-à-vis related bank offices
Sources: ECB, BIS locational banking statistics and ECB calculations. Note: Series in US dollar are converted in EUR with purchasing power parity exchange rates.
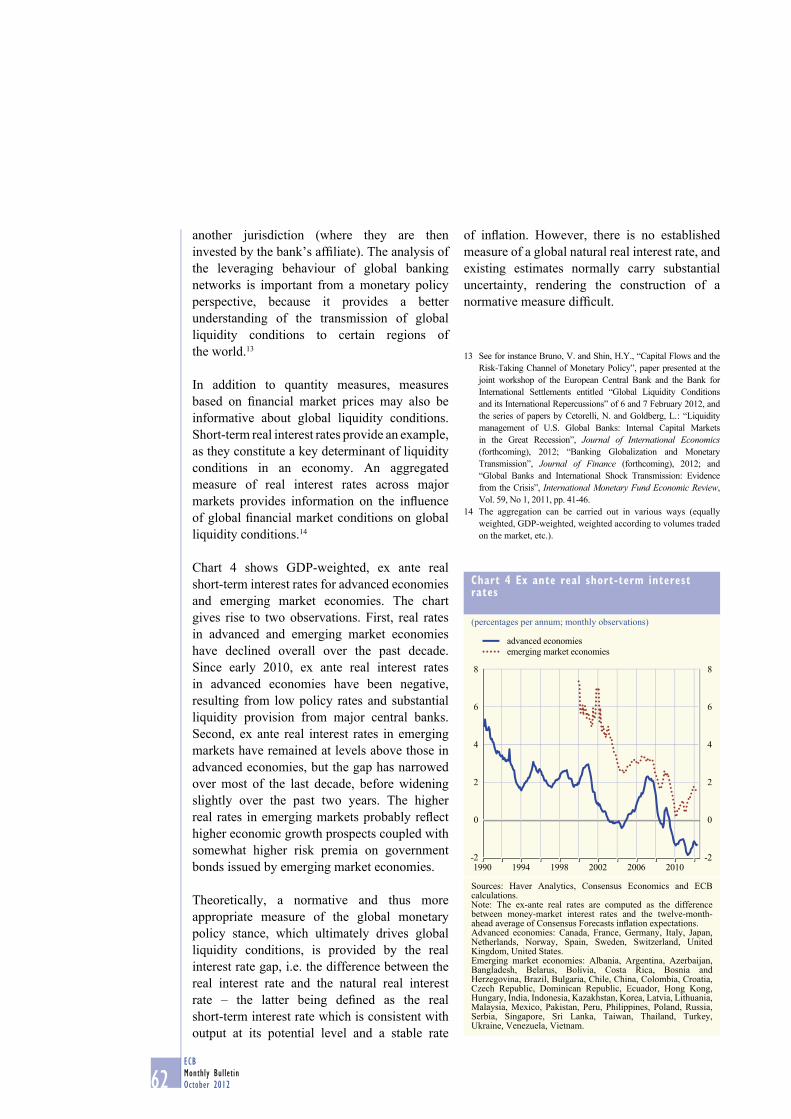
62ECB
Monthly Bulletin
October 2012
another jurisdiction (where they are then
invested by the bank’s affi liate). The analysis of
the leveraging behaviour of global banking
networks is important from a monetary policy
perspective, because it provides a better
understanding of the transmission of global
liquidity conditions to certain regions of
the world.13
In addition to quantity measures, measures
based on fi nancial market prices may also be
informative about global liquidity conditions.
Short-term real interest rates provide an example,
as they constitute a key determinant of liquidity
conditions in an economy. An aggregated
measure of real interest rates across major
markets provides information on the infl uence
of global fi nancial market conditions on global
liquidity conditions.14
Chart 4 shows GDP-weighted, ex ante real
short-term interest rates for advanced economies
and emerging market economies. The chart
gives rise to two observations. First, real rates
in advanced and emerging market economies
have declined overall over the past decade.
Since early 2010, ex ante real interest rates
in advanced economies have been negative,
resulting from low policy rates and substantial
liquidity provision from major central banks.
Second, ex ante real interest rates in emerging
markets have remained at levels above those in
advanced economies, but the gap has narrowed
over most of the last decade, before widening
slightly over the past two years. The higher
real rates in emerging markets probably refl ect
higher economic growth prospects coupled with
somewhat higher risk premia on government
bonds issued by emerging market economies.
Theoretically, a normative and thus more
appropriate measure of the global monetary
policy stance, which ultimately drives global
liquidity conditions, is provided by the real
interest rate gap, i.e. the difference between the
real interest rate and the natural real interest
rate – the latter being defi ned as the real
short-term interest rate which is consistent with
output at its potential level and a stable rate
of infl ation. However, there is no established
measure of a global natural real interest rate, and
existing estimates normally carry substantial
uncertainty, rendering the construction of a
normative measure diffi cult.
See for instance Bruno, V. and Shin, H.Y., “Capital Flows and the 13
Risk-Taking Channel of Monetary Policy”, paper presented at the
joint workshop of the European Central Bank and the Bank for
International Settlements entitled “Global Liquidity Conditions
and its International Repercussions” of 6 and 7 February 2012, and
the series of papers by Cetorelli, N. and Goldberg, L. : “Liquidity
management of U.S. Global Banks: Internal Capital Markets
in the Great Recession”, Journal of International Economics (forthcoming), 2012; “Banking Globalization and Monetary
Transmission”, Journal of Finance (forthcoming), 2012; and
“Global Banks and International Shock Transmission: Evidence
from the Crisis”, International Monetary Fund Economic Review,
Vol. 59, No 1, 2011, pp. 41-46.
The aggregation can be carried out in various ways (equally 14
weighted, GDP-weighted, weighted according to volumes traded
on the market, etc.).
Chart 4 Ex ante real short-term interest rates
(percentages per annum; monthly observations)
-2
0
2
4
6
8
-2
0
2
4
6
8
1990 1994 1998 2002 2006 2010
advanced economies
emerging market economies
Sources: Haver Analytics, Consensus Economics and ECB calculations.Note: The ex-ante real rates are computed as the difference between money-market interest rates and the twelve-month-ahead average of Consensus Forecasts infl ation expectations.Advanced economies: Canada, France, Germany, Italy, Japan, Netherlands, Norway, Spain, Sweden, Switzerland, United Kingdom, United States.Emerging market economies: Albania, Argentina, Azerbaijan, Bangladesh, Belarus, Bolivia, Costa Rica, Bosnia and Herzegovina, Brazil, Bulgaria, Chile, China, Colombia, Croatia, Czech Republic, Dominican Republic, Ecuador, Hong Kong, Hungary, India, Indonesia, Kazakhstan, Korea, Latvia, Lithuania, Malaysia, Mexico, Pakistan, Peru, Philippines, Poland, Russia, Serbia, Singapore, Sri Lanka, Taiwan, Thailand, Turkey, Ukraine, Venezuela, Vietnam.

63ECB
Monthly Bulletin
October 2012
ARTICLES
Global liquidity:
concepts, measurements
and implications
from a monetary
policy perspective
3.2 GLOBAL FINANCIAL MARKET LIQUIDITY
INDICATORS
This section puts forward two specifi c examples
of how fi nancial market indicators can provide
complementary insight into global liquidity
conditions.
As stated in Section 2, one important aspect
of global liquidity is the ease with which
an instrument can be exchanged for goods
and services. This concept can be applied to
fi nancial market instruments by computing the
“illiquidity ratio” (ILR) for various assets. In
its basic version, the ILR captures the extent to
which the price of a certain security changes for
each volume unit of trades, and can therefore
be characterised as an elasticity measure. As
its name suggests, the ILR attempts to quantify
the lack of liquidity in the market, so that a high
ILR estimate indicates low liquidity since it
refl ects a high price impact conditional on the
trading volume. This concept is generalised
here to serve as a measure of global liquidity by
aggregating a large number of individual equity
fi rm data on prices and volumes into indicators
for advanced and emerging market economies.
The indicators in Chart 5 seem to support the
general perception that fi nancial market liquidity
conditions in the two groups of countries largely
improved between 2003 and the onset of the
fi nancial crisis in mid-2007. This pattern can
probably be attributed to fi nancial innovation
and deeper real and fi nancial integration, but
the misperception of risk by market participants
probably also played a role. Moreover, the
illiquidity indicator peaked, understandably,
during periods of severe fi nancial stress: (i) in the
aftermath of 11 September 2001; (ii) following
the Lehman collapse in the autumn of 2008 and;
(iii) during the intensifi cation of the sovereign
debt crisis in some euro area countries in the
summer of 2011.
Further information about liquidity conditions
can be inferred from developments in global
bond markets. These markets have taken centre
stage in international policy debates over the
past decade and there is broad agreement that
abundant global liquidity in the years leading
up to the fi nancial crisis contributed to the surge
in private sector leverage and risk-taking in
many economies. Chart 6 compares long-term
government bond yields in advanced economies
with nominal economic growth expectations,
which, under certain mild conditions, should
be closely correlated. The chart shows GDP-
weighted ten-year government bond yields for
Japan, the United Kingdom, the United States,
and the euro area, and comparable nominal
long-term GDP growth expectations proxied by
summing consumer price infl ation expectations
and real GDP growth expectations provided
by Consensus Economics. In the years from
2002 to 2006, advanced economies’ bond yields
diverged from nominal growth expectations,
falling to lower levels, signalling that global
liquidity increased. This decoupling has
intensifi ed during the fi nancial crisis, largely
refl ecting the strong actions taken by monetary
authorities to improve liquidity conditions and
Chart 5 Financial market illiquidity indicator for advanced economies and emerging markets
(index: 25 January 1999 = 100; weekly observations)
0
100
200
300
400
500
600
700
0
100
200
300
400
500
600
700
advanced economies
emerging market economies
1999 2001 2003 2005 2007 2009 2011
Sources: Datastream and ECB calculations.Notes: The vertical lines correspond to the terrorist attacks on 11 September 2001, the Lehman collapse in September 2008, and the intensifi cation of the EMU sovereign debt crisis in August 2011. Advanced economies: Australia, Canada, France, Germany, Italy, Japan, Spain, United Kingdom, United States. Emerging market economies: China, India, Indonesia, South Africa, South Korea. Latest observations: July 2012.

64ECB
Monthly Bulletin
October 2012
to counteract the economic downturn and the
associated risks to price stability. Although, at the
present time, the bond markets indicator depicts
ample liquidity conditions at the global level, the
signal from this indicator is probably blurred.
4 IMPLICATIONS FOR MONETARY POLICY
The link between global liquidity conditions and
both consumer price infl ation and asset price
infl ation (see the box for a survey of available
empirical evidence), and, more generally, the
destabilising potential of global liquidity, raises
several issues for monetary policy.
First, money, credit and, more broadly,
domestic liquidity conditions have long
been part of monetary policy considerations,
although they have faded into oblivion in most
monetary policy frameworks over the past
couple of decades owing to the prevalence
of infl ation targeting strategies. However,
monetary developments convey important
information that is relevant to the assessment
of risks to price stability over the medium
to longer term, as the money stock and the
price level are closely related in the long run.
Furthermore, the empirical evidence points to
monetary trends leading infl ationary trends, thus
supporting the case for monetary analysis in a
forward-looking monetary policy framework.
However, there is, as yet, no consensus among
central banks on how best to include money,
credit and, more broadly, (global) liquidity in
monetary policy strategies.
Second, the ECB’s monetary policy strategy is
an exception, as it enables liquidity conditions
to be taken into account, mainly via its
medium-term orientation. The monetary
analysis under the monetary pillar allows the
ECB to fi lter out the information in monetary
data that is relevant for the longer term and
more persistent trends in infl ation. However,
the detailed analysis of monetary dynamics
also generates a wealth of information on
monetary developments and on the transmission
of monetary shocks and price formation.
Analysing higher-frequency data on monetary
developments also facilitates the assessment
and comprehension of shorter-term
macroeconomic and fi nancial phenomena,
which can give rise to risks to price stability in
the longer run, if left unchecked. Monetary
developments may also provide useful
information on the state of the business cycle,
liquidity conditions, fi nancing conditions,
monetary policy transmission and the condition
and behaviour of banks. Moreover, the analysis
of monetary dynamics helps to put asset price
dynamics into perspective and to provide an
indication as to the possible build-up of
fi nancial imbalances. The external dimension
of monetary analysis – on which further
analytical work is underway at the ECB – can
complement the domestic analysis via the
monitoring of global liquidity and the study of
both its impact on commodity, equity and bond
Chart 6 Ten-year bond yields and long-term nominal economic growth expectations for advanced economies
(annual percentage changes; percentages per annum)
0
1
2
3
4
5
6
7
0
1
2
3
4
5
6
7
1999 2001 2003 2005 2007 2009 2011
nominal economic growth expectation for
the next ten years
ten-year government bond yield
Sources: ECB, IMF, Consensus Economics and ECB calculations.Note: GDP-weighted data based on data from Japan, the United Kingdom, the United States, and the euro area. Long-term nominal economic growth expectations for each economic region are computed as the sum of real GDP growth expectations and consumer price infl ation expectations.

65ECB
Monthly Bulletin
October 2012
ARTICLES
Global liquidity:
concepts, measurements
and implications
from a monetary
policy perspective
prices (i.e. international asset prices) and its
infl uence on domestic infl ation. In addition,
monitoring the effects of capital fl ows and
international asset prices can lead to a better
measure of the underlying domestic monetary
trends and the associated signals concerning
price developments.15
Third, the ECB’s monetary pillar implicitly
facilitates a forward-looking “leaning against
the wind” approach to fi nancial cycles and the
associated risks to medium-term price stability.
Leaning against the wind can be defi ned as a
strategy whereby a central bank, confronted with
an infl ating fi nancial bubble, adopts a somewhat
tighter policy stance than would be the case under
circumstances with a similar macroeconomic
outlook but with more normal fi nancial market
conditions.16 Importantly, leaning against the wind
does not mean that monetary policy targets asset
prices or implicitly adopts a fi nancial stability
mandate. Rather, it means that monetary policy
duly takes into account the adverse implications
of increasing systemic risk for medium-term
price stability. A “leaning against the wind”
approach is, therefore, fully consistent with the
ECB’s mandate to maintain price stability in the
euro area on a lasting basis.17
Fourth, in the long term, under normal
economic conditions and a fl exible exchange
rate regime, active domestic monetary policy is
the vehicle best suited to addressing the effects
of global liquidity on domestic infl ation. Even
if global developments affect domestic price
developments in the short term, this does not
impinge on the central bank’s ability to control
domestic infl ation through its domestically-
oriented monetary policy, as monetary policy
probably continues to exert the most infl uence
on domestic price developments. Policy-
makers should, therefore, be responsible for
safeguarding the stability of consumer prices at
the domestic level.18
Fifth, given the high degree of fi nancial
integration at the global level, there is a need for
shared principles in terms of stability orientation
in all macroeconomic policy domains. These
have to encompass the principles of fi scal and
economic sustainability, monetary and fi nancial
stability. In this respect, central banks are
working together, notably on global liquidity
in the scope of the Committee on the Global
Financial System.19 They also collaborate more
broadly, for example within the scope of the
G20 meetings and the Basel III consultations,
to strengthen the overall resilience of banks.
Central banks also have the opportunity to
cooperate in a broader setting, for instance
through the exchange of views on the economic
outlook in international fora, such as the
meetings of central bank governors at the BIS
or the Working Party No 3 work stream at the
OECD. Clearly, these initiatives do not equate to
monetary policy coordination in the traditional
sense, but the idea behind them is to share the
goal of stability and the “rules of the game”.
At the same time, in truly exceptional
circumstances, monetary authorities have also
coordinated interest rate decisions: in
September 2001, the Federal Reserve System and
the ECB coordinated their response to the
fi nancial consequences of the terrorist attacks in
New York. In addition, on 8 October 2008, in a
concerted and historic move, the ECB and other
major central banks reduced policy interest rates
by 50 basis points. However, in the case of the
For more details, see the article entitled “The external dimension 15
of monetary analysis”, Monthly Bulletin, ECB, August 2008.
With regard to the “leaning against the wind” approach, 16
see the article entitled “Asset price bubbles and monetary
policy revisited”, Monthly Bulletin, ECB, November 2010,
and Papademos, L.D. and Stark, J. (eds.), Enhancing Monetary
Analysis, ECB, 2010, Chapter 6.
Scepticism toward the “leaning against the wind” approach is 17
primarily based on the view that it involves high output costs
(see, for example, Assenmacher-Wesche, K. and Gerlach, S.,
“Monetary policy and fi nancial imbalances: facts and fi ction”,
Economic Policy, Vol. 25, No 63, 2010, pp. 437-482, and Bean,
C., Paustian, M., Penalver, A. and Taylor, T., “Monetary policy
after the fall”, a paper presented at the Federal Reserve Bank
of Kansas City Annual Conference, Jackson Hole, Wyoming,
August 2010.) Yet the high output costs associated with the
current global crisis, together with the evidence mentioned
earlier, which suggests that too loose a monetary policy might
have played an important role in the run-up to the crisis, have
probably strengthened the case for leaning against the wind.
See Woodford, M., “Globalization and Monetary Control”, 18
in Galí, J. and Gertler, M. (eds.), International Dimensions of Monetary Policy, Chapter 1, University of Chicago Press, 2010.
See the report mentioned in footnote 1.19

66ECB
Monthly Bulletin
October 2012
ECB, even in exceptional circumstances,
monetary policy has always remained clearly
focused on its primary objective of maintaining
price stability in the euro area. Overall, no general
conclusions regarding monetary policy can be
drawn from such exceptional events. The
economic literature on monetary policy
coordination is vast but not conclusive. A number
of empirical investigations suggest that, in
general, gains from monetary policy coordination
seem to be small.20 The results of theoretical
studies tend to point to a similar conclusion,21
although some authors can generate signifi cant
gains in specifi cally parameterised models.22 In
practice, a number of aspects are likely to hamper
the implementation of formal monetary policy
coordination.23 First, some kind of commitment
would be required to refl ect the agreed policy
plans. The implementation of these plans would
also require a common understanding of the
nature and propagation of economic disturbances
in real time. Second, the different mandates of
central banks would make it diffi cult to reach
common policy conclusions. Third, it would be
diffi cult to hold policy-makers accountable at the
national level if their policy actions were based
on considerations that go beyond their assigned
mandate. Fourth, individual policy-makers may
neglect to implement coordinated policy actions
in their countries owing to the possible lack of
enforcement mechanisms.
Coenen, G., Lombardo, G., Smets, F. and Straub, R., 20
“International transmission and monetary policy cooperation”,
in Galí, J. and Gertler, M. (eds.), International Dimensions of Monetary Policy, Chapter 3, University of Chicago Press, 2008.
Corsetti, G. and Pesenti, P., “Welfare and Macroeconomic 21
Interdependence,” Journal of Quarterly Economics, Vol. 116,
2001, pp. 421-446 and Obstfeld, M. and Rogoff, K., “Global
Implications of Self-Oriented National Monetary Rules”, Journal of Quarterly Economics, Vol. 17 , 2002, pp. 503-535.
Sutherland, A., “International Monetary Policy Coordination 22
and Financial Market Integration”, CEPR Discussion Papers,
No 4251, 2004, and Pappa, E. and Liu, Z., “Gains from
International Monetary Policy Coordination: Does it Pay to
be Different?”, Journal of Economic Dynamics and Control, Vol. 32, No 7, 2008, pp. 2085-2117.
Issing, O., “On Macroeconomic Policy Co-ordination in EMU”, 23
Journal of Common Market Studies, Vol. 40, No 2, 2002,
pp. 345-358.
Box
THE EFFECTS OF GLOBAL LIQUIDITY ON CONSUMER AND ASSET PRICE INFLATION
Disentangling empirical evidence of the effects of global liquidity on asset and consumer
price infl ation is not a straightforward exercise. Recent academic literature has put most of the
emphasis on the effects of global monetary liquidity, which is therefore the focus of this box.
Effects on consumer price infl ation
Berger and Harjes fi nd that in the euro area excess liquidity, measured as the difference between
M2 and estimated long-run demand for M2, shows strong co-movement with excess liquidity
in the United States and Japan. They show that US excess liquidity exerts a positive impact on
euro area infl ation for up to 12 quarters.1 Sousa and Zaghini use a similar approach and fi nd a
positive effect of global liquidity on euro area infl ation. While the authors fi nd that the precise
contribution of global liquidity shocks to euro area infl ation depends on the model specifi cation
and the metric used to measure global liquidity, it is always sizeable, and can account for up to
around a third of the variability of the price level in the longer run.2 Rüffer and Stracca estimate a
vector autoregression (VAR), including a measure of global liquidity, proxied by a global broad
1 Berger, H. and Harjes, T., “Does Global Liquidity Matter for Monetary Policy in the Euro Area?”, IMF Working Papers, No 09/17,
2009.
2 Sousa, J.M. and Zaghini, A., “Monetary Policy Shocks in the Euro Area and Global Liquidity Spillovers”, International Journal of Finance and Economics, Vol. 13, 2008, pp. 205-218.

67ECB
Monthly Bulletin
October 2012
ARTICLES
Global liquidity:
concepts, measurements
and implications
from a monetary
policy perspective
monetary aggregate constructed as the GDP-weighted sum of the domestic broad monetary
aggregates of Canada, Japan, the United Kingdom, the United States, and the euro area.3 They
fi nd that global liquidity has a signifi cant positive impact on the price level in the euro area
economy.
These fi ndings for the euro area are in line with related studies for the United Kingdom. Mumtaz
and Surico, for instance, provide evidence that monetary easing in the rest of the world leads to
an increase in CPI infl ation and real house price infl ation in the United Kingdom.4 Moreover,
D’Agostino and Surico show that forecasts of US infl ation that are based, inter alia, on measures
of global liquidity constructed with monetary aggregates are signifi cantly more accurate than
those of other models including only national variables.5
Effects on asset price infl ation
When assessing the effects of global liquidity on asset prices, it is useful to distinguish between
different asset price categories, such as house prices and commodity prices.
Belke, Bordon and Hendricks study aggregate data for ten OECD countries and the euro area,
and fi nd that a global liquidity measure based on broad money aggregates is a useful indicator of
commodity price infl ation.6 Belke, Orth and Setzer show that ample global liquidity, measured
by broad monetary aggregates, contributed to house price infl ation between 2002 and 2006. They
also suggest that the fall in house prices resulting from the subprime crisis caused liquidity to
infl ate commodity prices.7 In addition, the IMF has recently examined the links between global
liquidity expansion, asset prices and capital infl ows in emerging market economies.8 It found
that rising global liquidity is associated with rising equity returns and declining real interest rates
in 34 “liquidity-receiving” economies. Alessi and Detken show that global monetary liquidity
measures derived from a narrow money aggregate and a credit aggregate are more informative
than real variables in detecting boom and bust cycles.9
Using a measure of global monetary liquidity constructed by obtaining the sum of the US
monetary base and international reserves, Darius and Radde fi nd an asymmetric impact on the
different asset price classes, with a much stronger effect on house prices compared to equity and
commodity prices.10 Their result is broadly consistent with the fi ndings of other studies in the
literature that are based on more standard measures of global liquidity.
3 Rüffer, R. and Stracca, L., “What is Global Excess Liquidity, and does it Matter?”, Working Paper Series, No 696, ECB, 2006.
4 Mumtaz, H. and Surico, P., “The Transmission of International Shocks: A Factor-Augmented VAR Approach”, Journal of Money Credit and Banking, Vol. 41, No 1, 2009, pp. 71-100.
5 D’Agostino, A. and Surico, P., “Does Global Liquidity Help to Forecast U.S. Infl ation?”, Journal of Money Credit and Banking,
Vol. 41, No 2-3, 2009, pp. 479-489.
6 Belke, A., Bordon, I.G. and Hendricks, T.W., “Global Liquidity and Commodity Prices – a Cointegrated VAR Approach for OECD
Countries”, Applied Financial Economics, Vol. 20, 2010, pp. 227-242.
7 Belke, A., Orth, W. and Setzer, R., “Liquidity and the Dynamic Pattern of Asset Price Adjustment: A Global View”, Journal of Banking and Finance, Vol. 34, 2010, pp. 1933-1945.
8 “Global Liquidity Expansion: Effects on ‘Receiving’ Economies and Policy Response Options”, Global Financial Stability Report, IMF, Chapter 4, April 2010.
9 Alessi, L. and Detken, C., “Quasi realtime early warning indicators for costly asset price boom/bust cycles: a role for global liquidity”,
European Journal of Political Economy, Vol. 27, No 3, 2011, pp. 520-533.
10 Darius, R. and Radde, S., “Can Global Liquidity Forecast Asset Prices?”, IMF Working Papers, No 10/196, 2010.

68ECB
Monthly Bulletin
October 2012
5 CONCLUSIONS
This article has defi ned global liquidity from
the viewpoint that is most convenient for the
purpose of monetary policy. This defi nition
of global liquidity builds on the two concepts
of global monetary liquidity, defi ned as the
ease of converting monetary assets into goods
and services, domestically and across borders,
and global fi nancial market liquidity, defi ned as
the ease of trading in assets relative to trading
in money, refl ecting the cost of converting a
fi nancial asset into money. From a monetary
policy perspective, monetary and fi nancial
market liquidity should not be seen in isolation,
but as two concepts that infl uence each other.
Global monetary liquidity conditions have an
impact on domestic price developments. Global
fi nancial market liquidity is important for the
functioning of fi nancial markets. However,
excessive fi nancial market liquidity can trigger
asset price infl ation, with ultimate consequences
for domestic price stability. The fi nancial crisis
has shown that liquidity can evaporate quickly,
with important consequences for output and for
risks to price stability.
These observations suggest that the implications
of global liquidity need to be adequately
refl ected in the monetary policy strategies of
central banks. In particular, monetary policy
needs to take into account the impact of global
liquidity in its assessment of risks to price
stability over the medium term, granting a
signifi cant role to the analysis from a domestic
and global perspective of money, credit and,
more broadly, liquidity conditions.
Given the multi-dimensional nature of global
liquidity and the lack of a catch-all indicator to
capture its development, it is important that a
broad range of measures are monitored, with a
view to maximising the information available to
policy-makers.

69ECB
Monthly Bulletin
October 2012
ARTICLES
Euro area labour
markets and the crisis
EURO AREA LABOUR MARKETS AND THE CRISIS
Between the start of the economic and fi nancial crisis in 2008 and the beginning of 2010, almost 4 million jobs were lost in the euro area. This notwithstanding, in historical comparison, given the extent of the fall in GDP, the employment adjustment was relatively muted at the euro area aggregate level. However, the impact on some countries and some specifi c worker groups was especially strong. The heterogeneity of cross-country reactions refl ects not only differences in the severity of the crisis and policy responses, but also the different nature of the shocks hitting euro area economies and the presence of imbalances in the run-up to the crisis.
Regarding the more medium-term consequences of the crisis, increasing signs of a growing mismatch between worker attributes and job requirements can be observed, as well as recent increases in structural unemployment across the euro area countries. In addition, downward wage rigidities limit the necessary fl exible response of wages to labour market conditions to foster employment creation. The rise in structural unemployment underlines the urgent need for continued and further comprehensive reforms to remove rigidities in the labour markets of euro area countries.
1 INTRODUCTION
Since 2008 the condition of euro area labour
markets has worsened dramatically, with a sharp
increase in the unemployment rate, which
reached 11.3% in July 2012. However, substantial
cross-country heterogeneity emerged and some
euro area countries experienced dramatic changes
in employment and unemployment rates, while the
crisis had a more limited impact in other countries.
The main goal of this article is to document these
developments, to analyse the role of different
factors in shaping countries’ labour market
reactions and to assess what this implies for euro
area labour market prospects.1
The fi rst section presents labour market
developments since the start of the crisis by
analysing heterogeneity across countries and
identifying those worker groups more heavily
affected by the crisis. The impact of the crisis on
the labour force is also examined and the extent of
wage adjustment in response to the weakening of
the labour market is shown. In the second section,
the possible impact of these developments on
some key structural features of euro area labour
markets is examined. In particular, the possible
increase in mismatch between labour demand
and supply arising from the crisis and its impact
on structural unemployment is investigated.
This is followed by a description of the main
policy responses adopted since the start of the
crisis. A fi nal section concludes.
2 LABOUR MARKET DEVELOPMENTS SINCE
THE START OF THE CRISIS
2.1 EMPLOYMENT AND UNEMPLOYMENT
EVOLUTION
After the start of the fi nancial crisis in 2008,
almost 4 million jobs were lost in euro area labour
markets, with employment decreasing by 2.6%
from the peak in the fi rst quarter of 2008 to the
trough in the fi rst quarter of 2010.2 In the same
period the employment rate fell by 1.7 percentage
points to 64.2%. The unemployment rate increased
from 7.3% in the fi rst quarter of 2008 – its lowest
level since the introduction of the euro – to 10.1%
at the beginning of 2010 and, after a brief decline,
rose further to 11.3% by July 2012.
However, given the severity of the crisis
(see Chart 1), which entailed a fall of euro area
GDP of 5.6% between the fi rst quarter of 2008
and the second quarter of 2009,3 employment
adjustment was relatively muted at the aggregate
euro area level. Labour hoarding practices in euro
area labour markets during the initial phases of
the crisis contributed to mitigate employment
adjustment (measured in heads) as fi rms showed
This article is based on “Euro area labour markets and the crisis”, 1
Structural Issues Report, ECB, September 2012.
By the fi rst quarter of 2012 employment had declined by more 2
than 4 million (or 2.8%) compared with its peak.
This was the most severe recession experienced in euro area 3
economies since the Second World War.

70ECB
Monthly Bulletin
October 2012
a widespread preference for forms of internal
fl exibility, such as cutting overtime and making
use of short-time working schemes. In particular,
the fall in total hours worked in the euro area
(-4.5%) was considerably larger than the decline
in headcount employment (-2.6%).4
Indeed, a key feature of the crisis is the very
substantial degree of heterogeneity observed
across individual euro area countries, where
accumulated employment losses from peak to
trough ranged from -16% to -0.4%. For instance,
the number of jobs declined by less than 1% in
Belgium, Germany and Luxembourg, despite
their GDP fall being similar to the euro area
average. By contrast, the number of jobs fell by
more than 15% in Estonia and Ireland and by
more than 10% in Greece and Spain. Differences
in the severity of the crisis provide only a
partial explanation of these developments since
employment and unemployment elasticities
to GDP differed remarkably across the euro
area countries over this period (see Chart 2).
In particular, the employment reaction to the
change in economic activity was very strong in
Spain and Ireland.
The nature of the shock may be a crucial factor
infl uencing the transmission of the decline in
GDP to the labour market. For example, the
external component of the downturn (i.e. the
collapse in world trade and exports during the
initial quarters of the crisis) turned out to be
temporary. As fi rms may have expected the
output loss to be transitory, they may have
retained workers in anticipation of the trade
recovery. In contrast, a bursting property bubble
(implying more permanent restructuring)
implied a need for more labour adjustment so
that fi rms were less able to retain staff. In this
respect, panel a) of Chart 3 suggests a positive
(and signifi cant) link between the relative size
of the change in exports (in percentage points of
This is the peak-to-trough decline between the second quarter of 4
2008 and the third quarter of 2009 and between the fi rst quarter
of 2008 and the fi rst quarter of 2010 respectively.
Chart 1 Euro area GDP, employment and unemployment
(percentages; year-on-year growth)
-6
-4
-2
0
2
4
6
6
7
8
9
10
11
12
unemployment rate (left-hand scale)
employment growth (right-hand scale)
GDP growth (right-hand scale)
1999 2001 2003 2005 2007 2009 2011
Sources: European Commission (national accounts for GDP and employment, and Labour Force Survey for unemployment).
Chart 2 Elasticity of employment and unemployment with respect to output during the crisis
(change in employment or unemployment divided by change in output)
0.0
0.2
0.4
0.6
0.8
1.0
1.2
1.4
0.0
0.2
0.4
0.6
0.8
1.0
1.2
1.4
unemployment elasticity
employment elasticity
1 2 3 4 5 6 7 8 9 10 11 12 13 14 1615 17 18
13 SI
14 BE
15 MT
16 SK
17 LU
18 DE
1 ES
2 IE
3 EE
4 FI
5 NL
6 PT
7 GR
8 CY
9 euro area
10 IT
11 FR
12 AT
Sources: European Commission (national accounts), EU Labour Force Survey and ECB calculations.Notes: Elasticities are computed using country-specifi c peak-to-trough data and annualised growth rates. Peaks are chosen in the period from the fi rst quarter of 2007 to the fi rst quarter of 2009 and troughs in the period from the fi rst quarter of 2009 to the fourth quarter of 2011. Unemployment elasticities are shown in absolute value using the percentage point change in the unemployment rate as numerator.
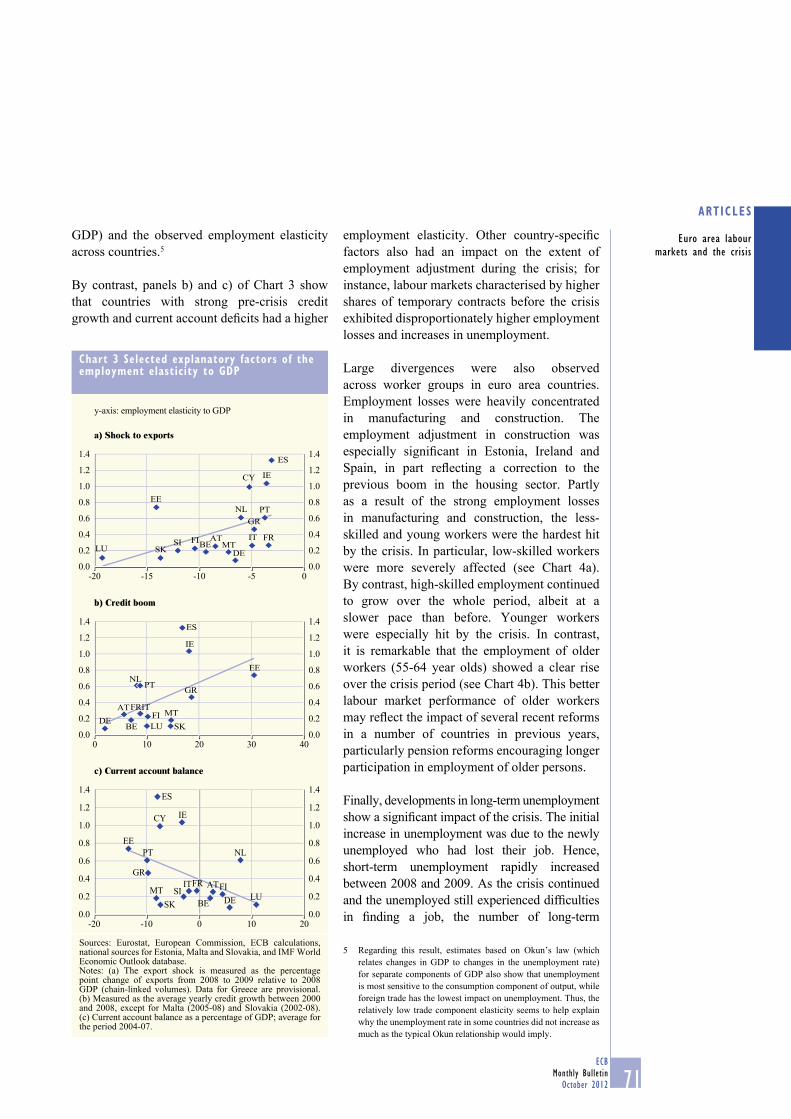
71ECB
Monthly Bulletin
October 2012
ARTICLES
Euro area labour
markets and the crisis
GDP) and the observed employment elasticity
across countries.5
By contrast, panels b) and c) of Chart 3 show
that countries with strong pre-crisis credit
growth and current account defi cits had a higher
employment elasticity. Other country-specifi c
factors also had an impact on the extent of
employment adjustment during the crisis; for
instance, labour markets characterised by higher
shares of temporary contracts before the crisis
exhibited disproportionately higher employment
losses and increases in unemployment.
Large divergences were also observed
across worker groups in euro area countries.
Employment losses were heavily concentrated
in manufacturing and construction. The
employment adjustment in construction was
especially signifi cant in Estonia, Ireland and
Spain, in part refl ecting a correction to the
previous boom in the housing sector. Partly
as a result of the strong employment losses
in manufacturing and construction, the less-
skilled and young workers were the hardest hit
by the crisis. In particular, low-skilled workers
were more severely affected (see Chart 4a).
By contrast, high-skilled employment continued
to grow over the whole period, albeit at a
slower pace than before. Younger workers
were especially hit by the crisis. In contrast,
it is remarkable that the employment of older
workers (55-64 year olds) showed a clear rise
over the crisis period (see Chart 4b). This better
labour market performance of older workers
may refl ect the impact of several recent reforms
in a number of countries in previous years,
particularly pension reforms encouraging longer
participation in employment of older persons.
Finally, developments in long-term unemployment
show a signifi cant impact of the crisis. The initial
increase in unemployment was due to the newly
unemployed who had lost their job. Hence,
short-term unemployment rapidly increased
between 2008 and 2009. As the crisis continued
and the unemployed still experienced diffi culties
in fi nding a job, the number of long-term
Regarding this result, estimates based on Okun’s law (which 5
relates changes in GDP to changes in the unemployment rate)
for separate components of GDP also show that unemployment
is most sensitive to the consumption component of output, while
foreign trade has the lowest impact on unemployment. Thus, the
relatively low trade component elasticity seems to help explain
why the unemployment rate in some countries did not increase as
much as the typical Okun relationship would imply.
Chart 3 Selected explanatory factors of the employment elasticity to GDP
y-axis: employment elasticity to GDP
a) Shock to exports
0.0
0.2
0.4
0.6
0.8
1.0
1.2
1.4
0.0
0.2
0.4
0.6
0.8
1.0
1.2
1.4
ATBE
CY
EE
FI FR
DE
GR
IE
IT
LU MT
NL PT
SKSI
ES
-20 -15 -10 -5 0
b) Credit boom
0.0
0.2
0.4
0.6
0.8
1.0
1.2
1.4
0.0
0.2
0.4
0.6
0.8
1.0
1.2
1.4
AT
BE
EE
FIFR
DE
GR
IE
IT
LU
MT
NLPT
SK
ES
0 10 20 30 40
c) Current account balance
0.0
0.2
0.4
0.6
0.8
1.0
1.2
1.4
0.0
0.2
0.4
0.6
0.8
1.0
1.2
1.4
AT
BE
CY
EE
FIFR
DE
GR
IE
IT
LUMT
NLPT
SK
SI
ES
-20 -10 0 10 20
Sources: Eurostat, European Commission, ECB calculations, national sources for Estonia, Malta and Slovakia, and IMF World Economic Outlook database.Notes: (a) The export shock is measured as the percentage point change of exports from 2008 to 2009 relative to 2008 GDP (chain-linked volumes). Data for Greece are provisional. (b) Measured as the average yearly credit growth between 2000 and 2008, except for Malta (2005-08) and Slovakia (2002-08). (c) Current account balance as a percentage of GDP; average for the period 2004-07.

72ECB
Monthly Bulletin
October 2012
unemployed (defi ned as unemployment spells
lasting longer than six months) started to increase
at the beginning of 2009. Long-term
unemployment in the euro area reached 67.3% of
total unemployment in the second quarter
of 2010, 7 percentage points higher than in the
fi rst quarter of 2008.6 Box 1 below adds to the
above analysis by looking at labour market
fl ows.
See Box 2 for a comparison between euro area and US 6
unemployment developments.
Chart 4 Employment developments in the euro area
(annual percentage changes and contributions in percentage points)
a) Employment breakdown according to educational level b) Employment breakdown according to age group
-3
-2
-1
0
1
2
-3
-2
-1
0
1
2
2008 2009 2010 2011 2012
low
medium
high
total
2008 2009 2010 2011 2012
-3
-2
-1
0
1
2
-3
-2
-1
0
1
2
15-24
25-54
55-64
total
Sources: EU Labour Force Survey and ECB calculations.
Box 1
A FLOWS ANALYSIS OF THE IMPACT OF THE CRISIS IN EURO AREA LABOUR MARKETS
An analysis of the recent evolution of gross worker fl ows (i.e. movements between employment,
unemployment and inactivity) in euro area countries1 can be very useful in gaining insights into
labour market dynamics, since it may uncover differences in the dynamic properties of labour
markets across euro area countries and their capacity to adjust to different shocks. This box
uses Labour Force Survey (LFS) microdata for 13 euro area countries to analyse labour market
dynamics, as these data allow changes in the labour market status of individuals to be tracked.
Chart A shows the average size of fl ows into and out of employment over the pre-crisis period
(from the fi rst quarter of 2004 to the second quarter of 2008) compared with the period since the
start of the crisis (from the third quarter of 2008 to the third quarter of 2010). For the euro area
13 as a whole, workers representing around 4% of the total labour force have on average moved
out of employment in each quarter since 2004. However, there are large differences across euro
area countries: fl ows are around fi ve times higher in countries such as Spain and Finland than in
1 Belgium, Germany, Luxembourg and Portugal are excluded from this analysis due to the lack of EU Labour Force Survey linked
microdata.

73ECB
Monthly Bulletin
October 2012
ARTICLES
Euro area labour
markets and the crisis
Greece and Slovakia. Focusing solely upon the period since 2008, as expected, the fall in activity
led to an increase in the job destruction rate (measuring movements out of employment) and a
decrease in the job creation rate (measuring infl ows into a new job). However, a larger increase
was observed in the job destruction rate, with fl ows out of employment increasing from 4.2% to
4.7% of the labour force for the euro area 13 as a whole.
Regarding the impact of the crisis, the differences across countries are considerable. Employment
outfl ows increased markedly in Estonia, Ireland and Spain. In this respect, the increase in exit
fl ows from employment since the start of the crisis was signifi cantly associated with the severity
of the GDP fall, with a correlation coeffi cient of 0.7 between the changes in employment outfl ows
and the accumulated fall in GDP across euro area countries.
LFS microdata allow an analysis of the impact of personal and job-related characteristics on
these fl ows. The main results show that there is a clear pattern between age and the probability
of losing a job, with younger workers facing much higher exit probabilities than older workers.2
There is also a clear inverse correlation between educational level and the probability of exiting
from employment. As regards job characteristics, the employment adjustment is concentrated
amongst those on fi xed-term (i.e. temporary) contracts, especially in some euro area countries
(Spain, France and Finland). Looking at sectors of activity, construction tends to show higher
exit rates from employment to unemployment as the scale of the employment adjustment in the
construction sector was much more pronounced than in other sectors.
Regarding unemployment fl ows, unemployment exit probabilities generally decreased in euro area
countries during the crisis, albeit to varying degrees (see Chart B, which shows the fl ows out of
unemployment as a percentage of unemployment). As expected, a marked negative relationship
is observed between the exit rate probability and the duration of unemployment, suggesting
2 This result holds after controlling for the varying incidence of non-regular contracts and the sectoral composition of employment.
Chart A Employment inflows and outflows
(percentage of labour force)
0
1
2
3
4
5
6
7
0
1
2
3
4
5
6
7
FI ES SI AT IT euroarea
FR IE NL CY EE SK GR MT
outflows, Q1 2004 - Q2 2008
outflows, Q3 2008 - Q3 2010
inflows, Q1 2004 - Q2 2008
inflows, Q3 2008 - Q3 2010
Sources: EU Labour Force Survey and ECB calculations.Note: BE, DE, LU and PT are not included in the euro area.
Chart B Unemployment outflows by duration
(percentage of unemployment)
0
5
10
15
20
25
30
35
40
45
0
5
10
15
20
25
30
35
40
45
AT ES SI FI FR IT EE IE SK GR
pre-crisis, 0-6 months crisis, 0-6 months
pre-crisis, 6-12 months crisis, 6-12 months
pre-crisis, >12 months crisis, >12 months
euroarea
Sources: EU Labour Force Survey and ECB calculations.Note: BE, CY, DE, LU, MT, NL and PT are not included in the euro area.

74ECB
Monthly Bulletin
October 2012
the existence of diffi culties faced by the longer-term unemployed in returning to employment.
However, short-term unemployment spells have also been directly affected by the crisis. In a
number of countries, short-term unemployment has increased rapidly as the probability of fi nding a
new job has decreased markedly given low job creation rates.
Box 2
COMPARING RECENT UNEMPLOYMENT DEVELOPMENTS IN THE EURO AREA AND THE UNITED STATES
Between the start of the recession in 2008 and the end of 2011, total employment decreased by
almost 6 million in the United States (around 4.5% of the total prior to the recession), while euro
area employment contracted by around 4 million (i.e. 2.6%).1 At the same time, the contraction
in economic activity was of a similar magnitude, with peak-to-trough declines in real GDP of
around 5% in both economies.
There are a number of reasons which may help to explain the lower employment losses observed
in the euro area relative to the United States. These include a relatively lower overall exposure
of the euro area to sectoral shocks in the construction and fi nancial sectors, and a greater reliance
on short-time working schemes in many euro area countries. The United States also experienced
considerable labour supply reductions, which – though adverse in nature – helped to contain the
rise in the unemployment rate.
These different labour market dynamics have
led to a smaller increase in unemployment in
the euro area than in the United States – albeit
from a higher initial level (see Chart A).
Overall, since the beginning of the crisis,
the aggregate euro area unemployment rate
has risen by around 4.0 percentage points to
11.3% in July 2012. The US unemployment
rate rose initially from 4.8% in February
2008 to a peak of 10.1% in October 2009.
By early 2010 both economies recorded
unemployment rates of around 10%, but
since then developments have been rather
different. While the US unemployment rate
has been declining, euro area unemployment
has continued to climb.
Both economies have seen a considerable
increase in the duration of unemployment
since the onset of the crisis. Chart B shows
1 For methodological differences in the compilation of employment data in the euro area and the United States, see the article entitled
“Comparability of statistics for the euro area, the United States and Japan”, Monthly Bulletin, ECB, April 2005.
Chart A Evolution of unemployment in the euro area and the United States
(percentage of the civilian labour force)
3
6
9
12
3
6
9
12
1980 1985 1990 1995 2000 2005 2010
euro area 121)
United States
Sources: Eurostat, US Bureau of Labor Statistics and ECB calculations.Note: The latest observations are for the fi rst quarter of 2012.1) Data to 1995 are computed on the basis of developments in the euro area 12, i.e. excluding Cyprus, Estonia, Malta, Slovakia and Slovenia (as data are not available for all euro area countries).Subsequent data are for all 17 euro area countries.

75ECB
Monthly Bulletin
October 2012
ARTICLES
Euro area labour
markets and the crisis
2.2 THE LABOUR SUPPLY REACTION
TO THE CRISIS
Regarding labour supply developments, in the
years preceding the crisis, the euro area labour
force was growing at an annual average rate of
around 1.3%. In 2009 and 2010 labour force
growth decelerated to an annual average of 0.2%.
The latest data (up to the fourth quarter of 2011)
show a similar picture, with an annual growth
of 0.3% in total labour supply. Both population
growth and participation rate evolutions
contributed to this deceleration, although the
slowdown in participation rates was stronger
than that in population growth. Developments
by age and gender show that the female labour
force only experienced a deceleration in the
positive growth rate, while the male labour force
actually shrank during the crisis. By age groups,
the labour supply of older workers (55-64 year
olds) continued to grow during the crisis at rates
similar to previous years, while the labour force
of prime-age workers and especially younger
workers was heavily negatively affected by the
crisis.
Overall, given the intensity of the crisis, labour
supply seems to have shown a relatively mild
reaction to the deterioration of the euro area
labour market. This may be linked to the “added
worker effect” (i.e. women entering the labour
force in order to replace the lost income when
the male of the same household loses his job),
as well as the increased participation of older
workers partly related to past pension reforms.
2.3 WAGE RESPONSES TO THE ECONOMIC
DOWNTURN
Turning to the evolution of wages, all four
euro area nominal wage indicators presented in
Chart 5 continued their upward movement at the
beginning of the downturn in 2008. As regards
compensation per employee and negotiated
wages, this mostly refl ected stipulations in wage
contracts concluded before the crisis, since the
average length of wage contracts in the euro area
ranges between one and three years. The upward
trend in negotiated wages and compensation per
employee started to reverse around the second
half of 2008. When hours worked are taken into
the marked increases in the proportions of
long-term unemployment (those out of work
for six months or more as a percentage of
total unemployment). Typically, the share of
long-term unemployed in the United States
is generally much lower than in the euro
area. By contrast, the latest recession has
resulted in a considerable increase in long-
term unemployment in the United States due,
in part, to the severity of the recession, but
part is also likely to be due to the extension
of unemployment benefi t duration from 26 to
99 weeks in 2008, which raised the incentive
to register as unemployed beyond the six-
month horizon.
All in all, the impact of the crisis was deep in
both economies, with a marked increase in
unemployment rates, which raises some concerns
about a possible increase in unemployment
persistence due to the current crisis in both the
euro area and the United States.
Chart B Unemployment duration in the euro area and the United States
(those out of work for at least six months as a percentage share of total unemployment)
0
25
50
75
0
25
50
75
1980 1985 1990 1995 2000 2005 2010
euro area
United States
Sources: Eurostat, US Bureau of Labor Statistics and ECB calculations.Notes: Euro area data from the fi rst quarter of 2000. The latest observations are for the fourth quarter of 2011.

76ECB
Monthly Bulletin
October 2012
account, the upward movement in labour costs
continued until the beginning of 2009. This
refl ected the downward adjustment in hours
worked in some euro area countries.
In terms of labour costs, labour hoarding resulted
in a sharp drop in productivity per employee
during the recession. As a consequence, unit
labour costs increased sharply during the early
stages of the recession, and then decelerated
in the course of 2009 before falling in 2010
as compensation growth moderated and
productivity growth rebounded strongly.
However, taking into account the intensity of the
crisis, the wage response in euro area countries
appears to have been rather limited. This refl ects
general downward wage rigidities in the euro area
countries.7 Meanwhile, Box 3 gives a different
perspective of wage developments by taking
into account employment composition effects.
See Section 2.4 of “Euro area labour markets and the crisis”, 7
Structural Issues Report, ECB, September 2012.
Box 3
REAL WAGE EVOLUTION NET OF COMPOSITION EFFECTS IN EMPLOYMENT
The dynamics of the aggregate wage not only refl ect changes in wages of individual workers, but
are also infl uenced by changes in the composition of employment. Composition effects appear
to have been particularly important during the most recent recession episode and, in this respect,
may also partly explain the limited wage adjustment in the euro area since the start of the crisis.
Therefore, this box investigates the relevance of these composition effects in explaining the
moderate changes in real wages before and after the recession in fi ve euro area countries, namely
Belgium, Germany, France, Italy and Portugal.
The characteristics of the employed have changed in the aftermath of the crisis because many
workers with low wages, such as young workers, immigrants and construction workers became
unemployed (see Section 2.1). To investigate the effect of this composition change in the wage
structure, the changes in the distribution of real wages during the crisis are decomposed into
changes due to employees’ characteristics and changes due to wages at constant composition.1
In the chart, the solid blue bar (for each country) displays the observed change in aggregate
1 To do so, a counterfactual wage density is computed as if the distribution of the chosen characteristics of individuals had stayed the
same as in the initial period. For the methodology, see DiNardo, J., Fortin, N. M. and Lemieux, T., “Labour Market Institutions and the
Distribution of Wages, 1973-1992: A Semiparametric Approach”, Econometrica, Vol. 64 (5), September 1996, pp. 1001-44; Chiquiar, D.
and Hanson, G., “International Migration, Self-selection, and the Distribution of Wages: Evidence from Mexico and the United States”,
Journal of Political Economy, Vol. 113 (2), April 2005, pp. 239-281; and Machado, J. A. F. and Mata, J., “Counterfactual Decomposition
of Changes in Wage Distributions Using Quantile Regression”, Journal of Applied Econometrics, Vol. 20 (4), 2005, pp. 445-465.
Chart 5 Euro area wage indicators
(annual percentage changes)
0
1
2
3
4
5
0
1
2
3
4
5
2002 2004 2006 2008 20102003 2005 2007 2009 2011
compensation per employee
negotiated wages
hourly labour cost
compensation per hour
Sources: Eurostat and ECB calculations.
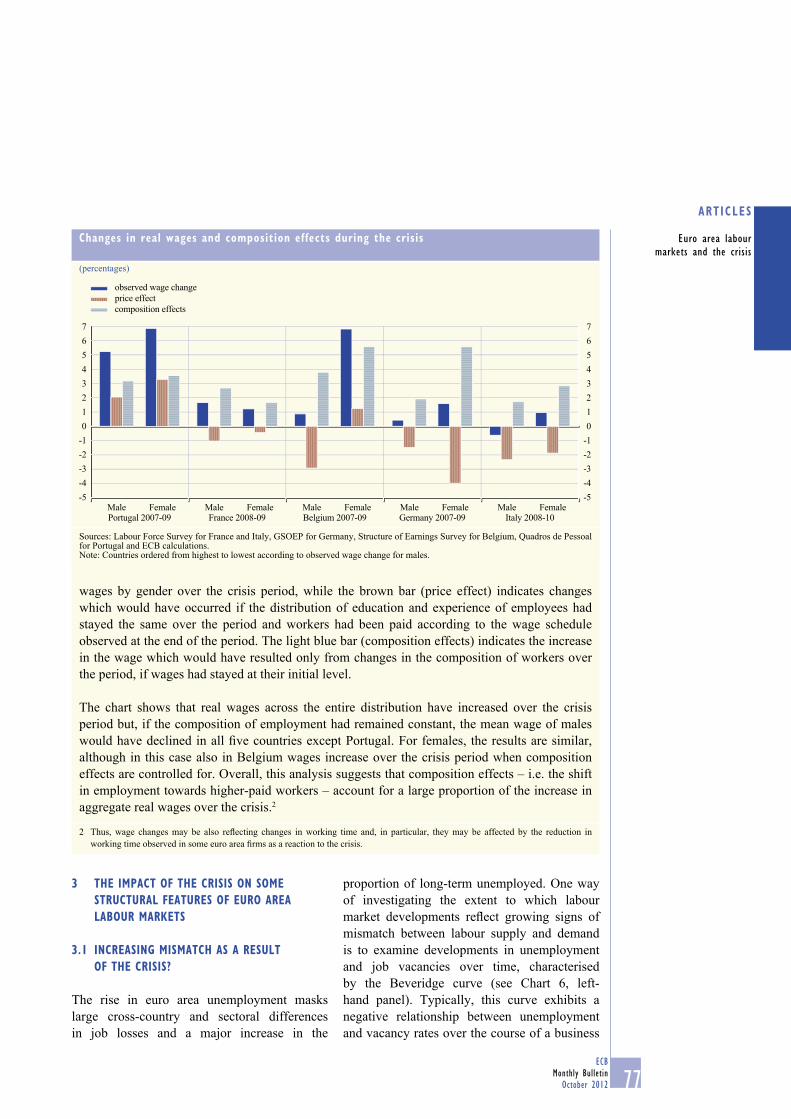
77ECB
Monthly Bulletin
October 2012
ARTICLES
Euro area labour
markets and the crisis
3 THE IMPACT OF THE CRISIS ON SOME
STRUCTURAL FEATURES OF EURO AREA
LABOUR MARKETS
3.1 INCREASING MISMATCH AS A RESULT
OF THE CRISIS?
The rise in euro area unemployment masks
large cross-country and sectoral differences
in job losses and a major increase in the
proportion of long-term unemployed. One way
of investigating the extent to which labour
market developments refl ect growing signs of
mismatch between labour supply and demand
is to examine developments in unemployment
and job vacancies over time, characterised
by the Beveridge curve (see Chart 6, left-
hand panel). Typically, this curve exhibits a
negative relationship between unemployment
and vacancy rates over the course of a business
wages by gender over the crisis period, while the brown bar (price effect) indicates changes
which would have occurred if the distribution of education and experience of employees had
stayed the same over the period and workers had been paid according to the wage schedule
observed at the end of the period. The light blue bar (composition effects) indicates the increase
in the wage which would have resulted only from changes in the composition of workers over
the period, if wages had stayed at their initial level.
The chart shows that real wages across the entire distribution have increased over the crisis
period but, if the composition of employment had remained constant, the mean wage of males
would have declined in all fi ve countries except Portugal. For females, the results are similar,
although in this case also in Belgium wages increase over the crisis period when composition
effects are controlled for. Overall, this analysis suggests that composition effects – i.e. the shift
in employment towards higher-paid workers – account for a large proportion of the increase in
aggregate real wages over the crisis.2
2 Thus, wage changes may be also refl ecting changes in working time and, in particular, they may be affected by the reduction in
working time observed in some euro area fi rms as a reaction to the crisis.
Changes in real wages and composition effects during the crisis
(percentages)
-5
-4
-3
-2
-1
0
1
2
3
4
5
6
7
-5
-4
-3
-2
-1
0
1
2
3
4
5
6
7
FemaleMale FemaleMale FemaleMale FemaleMale FemaleMalePortugal 2007-09 France 2008-09 Belgium 2007-09 Germany 2007-09 Italy 2008-10
observed wage change
price effect
composition effects
Sources: Labour Force Survey for France and Italy, GSOEP for Germany, Structure of Earnings Survey for Belgium, Quadros de Pessoal for Portugal and ECB calculations.Note: Countries ordered from highest to lowest according to observed wage change for males.

78ECB
Monthly Bulletin
October 2012
cycle, tracing the evolution of the economy from
expansionary phases to contractions in activity.
Shifts in the Beveridge curve – to the right or
the left – are suggestive of structural changes in
the unemployment/vacancy relationship.
Chart 6 (left-hand panel) shows developments
in the aggregate euro area Beveridge curve since
the fi rst quarter of 2006 on the basis of new
vacancy data available from Eurostat.8 As the
recession took hold, the vacancy rate fell sharply
and unemployment increased strongly,
represented by a downward movement along the
Beveridge curve. Since the onset of the recovery
in economic growth, and despite a strong initial
increase in vacancy rates in many countries, the
euro area unemployment rate has further
increased, possibly indicating an outward shift
of the Beveridge curve. Chart 6 (right-hand
panel) uses a longer time series on labour
shortages (as a proxy for vacancies) to trace the
evolution of the Beveridge curve. This also
suggests that, despite some signs of structural
improvements following the launch of EMU, in
the aftermath of the most recent recession there
are signs of an outward shift of the aggregate
euro area Beveridge curve, indicating that a
higher level of unemployment is associated with
a given level of vacancies.
The increase in mismatch between the
unemployed and vacancies may be partly
related to an increasing discrepancy between the
skills of those unemployed and the requirements
of new jobs. These mismatches can hinder the
reallocation of the labour force and therefore
may increase structural unemployment and
push down potential growth. A skill mismatch
index is computed to assess the extent of skill
mismatches in euro area countries by taking the
difference between skill demand and supply
using EU Labour Force Survey data for the period
1998-2010. Chart 7 shows the skill mismatch
index for the euro area as a whole computed at
three different levels of aggregation. It shows
See “The euro area job vacancy rate: a new statistical series”, 8
Monthly Bulletin, ECB, October 2010. A number of issues
remain with regard to the cross-country comparability of the data
and statistical discrepancies in the compilation of the national
series which underlie the euro area aggregate.
Chart 6 Movements in the euro area Beveridge curve
(percentages)
Q1 06
Q1 07
Q1 08
Q1 09
Q1 10
Q1 11
Q1 12
1.2
1.4
1.6
1.8
2.0
2.2
2.4
2.6
1.2
1.4
1.6
1.8
2.0
2.2
2.4
2.6
7 8 9 10
Q1 2006 - Q1 2008
Q1 2008 - Q1 2012
x-axis: unemployment rate
y-axis: vacancy rate
Q1 99
Q1 01
Q1 08
Q1 09
Q1 10
Q1 11
Q1 12
0
3
6
9
12
0
3
6
9
12
Q1 1999 - Q1 2001
Q1 2001 - Q1 2008
Q1 2008 - Q1 2012
x-axis: unemployment rate
y-axis: labour shortages
7 8 9 10
Sources: Eurostat (harmonised euro area unemployment rate, vacancy rate and manufacturing employers’ perceptions of labour shortages) and ECB calculations.Note: Labour shortages are shown using a diffusion index.
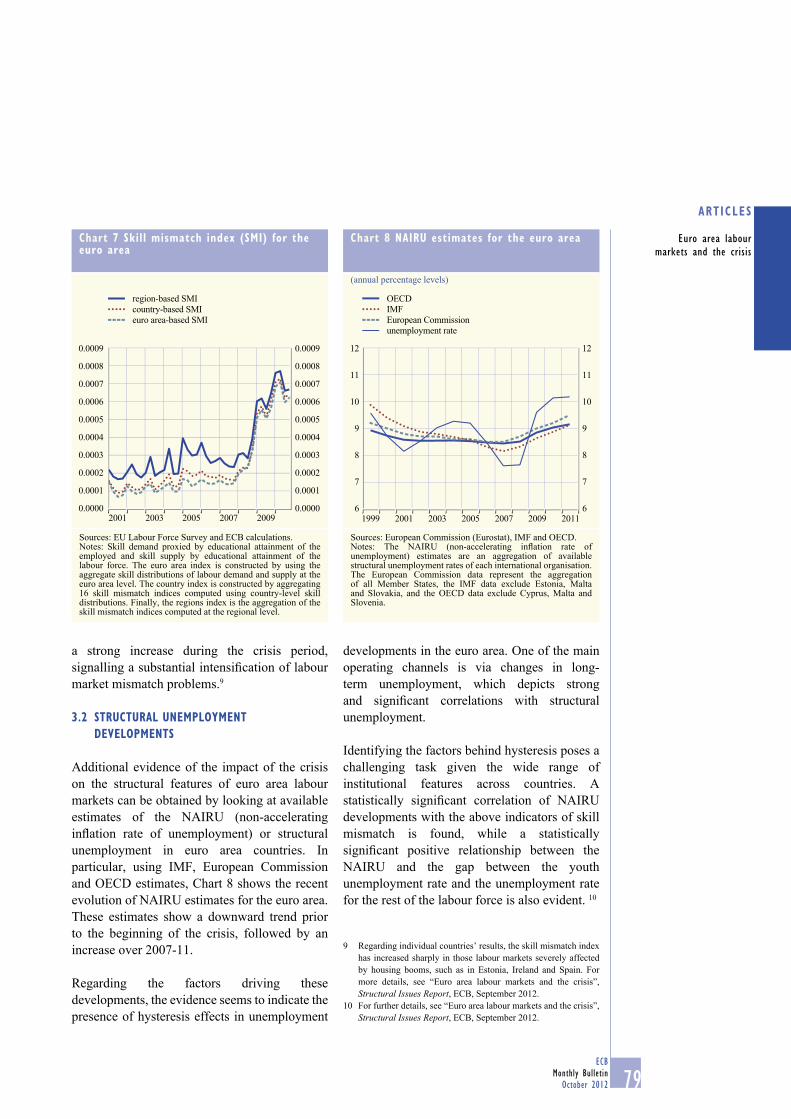
79ECB
Monthly Bulletin
October 2012
ARTICLES
Euro area labour
markets and the crisis
a strong increase during the crisis period,
signalling a substantial intensifi cation of labour
market mismatch problems.9
3.2 STRUCTURAL UNEMPLOYMENT
DEVELOPMENTS
Additional evidence of the impact of the crisis
on the structural features of euro area labour
markets can be obtained by looking at available
estimates of the NAIRU (non-accelerating
infl ation rate of unemployment) or structural
unemployment in euro area countries. In
particular, using IMF, European Commission
and OECD estimates, Chart 8 shows the recent
evolution of NAIRU estimates for the euro area.
These estimates show a downward trend prior
to the beginning of the crisis, followed by an
increase over 2007-11.
Regarding the factors driving these
developments, the evidence seems to indicate the
presence of hysteresis effects in unemployment
developments in the euro area. One of the main
operating channels is via changes in long-
term unemployment, which depicts strong
and signifi cant correlations with structural
unemployment.
Identifying the factors behind hysteresis poses a
challenging task given the wide range of
institutional features across countries. A
statistically signifi cant correlation of NAIRU
developments with the above indicators of skill
mismatch is found, while a statistically
signifi cant positive relationship between the
NAIRU and the gap between the youth
unemployment rate and the unemployment rate
for the rest of the labour force is also evident. 10
Regarding individual countries’ results, the skill mismatch index 9
has increased sharply in those labour markets severely affected
by housing booms, such as in Estonia, Ireland and Spain. For
more details, see “Euro area labour markets and the crisis”,
Structural Issues Report, ECB, September 2012.
For further details, see “Euro area labour markets and the crisis”, 10
Structural Issues Report, ECB, September 2012.
Chart 7 Skill mismatch index (SMI) for the euro area
0.0000
0.0001
0.0002
0.0003
0.0004
0.0005
0.0006
0.0007
0.0008
0.0009
0.0000
0.0001
0.0002
0.0003
0.0004
0.0005
0.0006
0.0007
0.0008
0.0009
region-based SMI
country-based SMI
euro area-based SMI
2001 2003 2005 2007 2009
Sources: EU Labour Force Survey and ECB calculations.Notes: Skill demand proxied by educational attainment of the employed and skill supply by educational attainment of the labour force. The euro area index is constructed by using the aggregate skill distributions of labour demand and supply at the euro area level. The country index is constructed by aggregating 16 skill mismatch indices computed using country-level skill distributions. Finally, the regions index is the aggregation of the skill mismatch indices computed at the regional level.
Chart 8 NAIRU estimates for the euro area
(annual percentage levels)
6
7
8
9
10
11
12
6
7
8
9
10
11
12
1999 2001 2003 2005 2007 2009 2011
OECD
European Commission
IMF
unemployment rate
Sources: European Commission (Eurostat), IMF and OECD.Notes: The NAIRU (non-accelerating infl ation rate of unemployment) estimates are an aggregation of available structural unemployment rates of each international organisation. The European Commission data represent the aggregation of all Member States, the IMF data exclude Estonia, Malta and Slovakia, and the OECD data exclude Cyprus, Malta and Slovenia.

80ECB
Monthly Bulletin
October 2012
3.3 POLICY REACTIONS TO THE CRISIS
Following the fi nancial crisis in 2008, initial
policy measures focused on supporting
aggregate demand and boosting employment
in the euro area. To mitigate the impact of the
crisis on employment, measures encouraging
shorter working-time arrangements also
emerged. As the crisis evolved, policy reactions
changed in more fundamental ways, especially
in those euro area countries more affected
by the crisis where the need for far-reaching
structural reforms became more evident.
During the crisis, labour market reforms have
been particularly intense in Greece, Ireland
and Portugal, which are countries currently
receiving international fi nancial assistance. In
the case of labour market institutions, in Greece
these reforms included the reduction in the
level of the minimum wage, the shift away from
sectoral-level collective agreements to fi rm-
level collective agreements, the possibility for
fi rms to opt out of the sectoral-level agreement,
and the relaxation of severance payments.
In Ireland, sectoral wage agreements are being
reformed to ensure that they are more fl exible
and responsive to economic conditions, while
labour market activation and training policies
have also been strengthened. In Portugal, a
signifi cant reduction of severance payments was
implemented, together with an increase in the
fl exibility of working time and a larger scope
for collective bargaining at the fi rm level. In
addition, the unemployment insurance system
has been revised by reducing benefi t replacement
rates and the maximum duration of benefi ts.
Several other countries, such as Spain and Italy,
have also recently implemented labour market
reforms with the objectives to increase fl exibility
and enhance employment.
4 CONCLUSIONS
This article has shown that differences in the
severity of the economic downturn during the
crisis provide only a partial explanation of
heterogeneous labour market developments
across countries: other explanatory factors include
the different nature of the shocks hitting euro area
economies and the presence of imbalances in the
run-up to the crisis (such as previous booms in
the construction sector). Labour supply reacted
in a relatively muted fashion to the downturn
compared with previous cyclical adjustments,
with participation rates for females and older
workers evolving favourably. A relatively limited
wage adjustment in euro area countries has been
observed despite the severity of the recession,
consistent with downward wage rigidities,
although the marked changes in employment
composition towards higher-paid workers partly
explain the aggregate wage evolution.
In terms of the medium-term consequences of
the crisis, it seems to have heralded a signifi cant
outward shift of the aggregate euro area Beveridge
curve – that is, a higher level of unemployment
associated with a given level of vacancies, along
with a signifi cant increase in skill disparities
between labour demand and supply indicative of
a higher degree of labour market mismatch. Also,
available estimates show a recent marked upward
trend in structural unemployment.
In this context, a fl exible response of wages
to labour market conditions should be a key
priority in euro area labour markets, so as to
also facilitate the necessary sectoral reallocation
which underpins employment creation and
reductions in unemployment. This clearly calls
for further major labour market reforms across
the euro area countries in order to limit the risks
of a permanent increase in the NAIRU and a
decrease in potential output growth. This reform
strategy is also a key ingredient for a solid
economic recovery in euro area economies,
which would also facilitate additional positive
spillovers regarding the correction and
prevention of macroeconomic imbalances, fi scal
consolidation and fi nancial stability.

S 1ECB
Monthly Bulletin
October 2012
EURO AREA STATISTICS

S 3ECB
Monthly Bulletin
October 2012
CONTENTS1
For further information, please contact us at: [email protected]. See the ECB’s Statistical Data Warehouse in the “Statistics” section of the ECB’s website 1
(http://sdw.ecb.europa.eu) for longer runs and more detailed data.
EURO AREA OVERVIEW
Summary of economic indicators for the euro area S5
1 MONETARY POLICY STATISTICS
1.1 Consolidated fi nancial statement of the Eurosystem S6
1.2 Key ECB interest rates S7
1.3 Eurosystem monetary policy operations allotted through tender procedures S8
1.4 Minimum reserve and liquidity statistics S9
2 MONEY, BANKING AND OTHER FINANCIAL CORPORATIONS
2.1 Aggregated balance sheet of euro area MFIs S10
2.2 Consolidated balance sheet of euro area MFIs S11
2.3 Monetary statistics S12
2.4 MFI loans: breakdown S15
2.5 Deposits held with MFIs: breakdown S17
2.6 MFI holdings of securities: breakdown S20
2.7 Currency breakdown of selected MFI balance sheet items S21
2.8 Aggregated balance sheet of euro area investment funds S22
2.9 Securities held by investment funds broken down by issuer of securities S23
2.10 Aggregated balance sheet of euro area fi nancial vehicle corporations S24
2.11 Aggregated balance sheet of euro area insurance corporations and pension funds S25
3 EURO AREA ACCOUNTS
3.1 Integrated economic and fi nancial accounts by institutional sector S26
3.2 Euro area non-fi nancial accounts S30
3.3 Households S32
3.4 Non-fi nancial corporations S33
3.5 Insurance corporations and pension funds S34
4 FINANCIAL MARKETS
4.1 Securities other than shares by original maturity, residency of the issuer and currency S35
4.2 Securities other than shares issued by euro area residents, by sector of the issuer and instrument type S36
4.3 Growth rates of securities other than shares issued by euro area residents S38
4.4 Quoted shares issued by euro area residents S40
4.5 MFI interest rates on euro-denominated deposits from and loans to euro area residents S42
4.6 Money market interest rates S44
4.7 Euro area yield curves S45
4.8 Stock market indices S46
5 PRICES, OUTPUT, DEMAND AND LABOUR MARKETS
5.1 HICP, other prices and costs S47
5.2 Output and demand S50
5.3 Labour markets S54
6 GOVERNMENT FINANCE
6.1 Revenue, expenditure and defi cit/surplus S56
6.2 Debt S57
6.3 Change in debt S58

S 4ECB
Monthly Bulletin
October 2012
6.4 Quarterly revenue, expenditure and defi cit/surplus S59
6.5 Quarterly debt and change in debt S60
7 EXTERNAL TRANSACTIONS AND POSITIONS
7.1 Summary balance of payments S61
7.2 Current and capital accounts S62
7.3 Financial account S64
7.4 Monetary presentation of the balance of payments S70
7.5 Trade in goods S71
8 EXCHANGE RATES
8.1 Effective exchange rates S73
8.2 Bilateral exchange rates S74
9 DEVELOPMENTS OUTSIDE THE EURO AREA
9.1 Economic and fi nancial developments other EU Member States S75
9.2 Economic and fi nancial developments in the United States and Japan S76
LIST OF CHARTS S77
TECHNICAL NOTES S79
GENERAL NOTES S85
Conventions used in the tables
“-” data do not exist/data are not applicable
“.” data are not yet available
“…” nil or negligible
“billion” 109
(p) provisional
s.a. seasonally adjusted
n.s.a. non-seasonally adjusted

EURO AREA OVERVIEW
Summary of economic indicators for the euro area (annual percentage changes, unless otherwise indicated)
S 5ECB
Monthly BulletinOctober 2012
1. Monetary developments and interest rates 1)
M1 2) M2 2) M3 2), 3) M3 2), 3) MFI loans to Securities other 3-month 10-year3-month euro area than shares issued interest rate spot rate
moving average residents in euro by non-MFI (EURIBOR; (% per annum;(centred) excluding MFIs corporations 2) % per annum; end of
and general period period) 4)
government 2) averages)
1 2 3 4 5 6 7 8
2010 8.5 1.8 0.3 - 0.5 4.2 0.81 3.362011 2.0 2.3 1.5 - 2.2 0.8 1.39 2.65
2011 Q4 1.9 2.1 1.5 - 1.8 -0.4 1.50 2.652012 Q1 2.3 2.5 2.2 - 0.7 0.3 1.04 2.60 Q2 2.8 2.8 2.8 - -0.1 2.7 0.69 2.32 Q3 . . . - . . 0.36 1.94
2012 Apr. 1.8 2.5 2.4 2.7 0.0 2.9 0.74 2.47 May 3.3 2.9 2.9 2.8 -0.2 3.0 0.68 1.89 June 3.5 3.0 3.1 3.2 -0.4 2.1 0.66 2.32 July 4.5 3.5 3.6 3.2 -0.4 1.2 0.50 1.87 Aug. 5.1 3.2 2.9 . -0.6 . 0.33 1.91 Sep. . . . . . . 0.25 1.94
2. Prices, output, demand and labour markets 5)
HICP 1) Industrial Hourly Real GDP Industrial Capacity Employment Unemploymentproducer labour (s.a.) production utilisation in (s.a.) (% of labour
prices costs excluding manufacturing force; s.a.)construction (%)
1 2 3 4 5 6 7 8
2010 1.6 2.9 1.6 2.0 7.3 76.8 -0.5 10.12011 2.7 5.9 2.1 1.4 3.4 80.4 0.2 10.1
2011 Q4 2.9 5.1 2.2 0.6 -0.2 79.8 -0.1 10.62012 Q1 2.7 3.7 1.5 0.0 -1.8 79.8 -0.5 10.9 Q2 2.5 2.2 1.6 -0.5 -2.4 78.8 -0.6 11.3
2012 Apr. 2.6 2.6 - - -2.6 79.7 - 11.2 May 2.4 2.3 - - -2.6 - - 11.3 June 2.4 1.8 - - -2.0 - - 11.4 July 2.4 1.6 - - -2.8 77.8 - 11.4 Aug. 2.6 2.7 - - . - - 11.4 Sep. 2.7 . - - . - - .
3. External statistics(EUR billions, unless otherwise indicated)
Balance of payments (net transactions) Reserve assets Net Gross Effective exchange rate of USD/EUR
(end-of-period international external debt the euro: EER-20 6) exchange rateCurrent and Combined positions) investment (as a % of GDP) (index: 1999 Q1 = 100)
capital Goods direct and positionaccounts portfolio (as a % of GDP) Nominal Real (CPI)
investment1 2 3 4 5 6 7 8 9
2010 -0.4 15.1 51.2 591.2 -13.4 120.1 103.6 101.6 1.32572011 8.4 4.9 156.9 667.1 -11.5 120.4 103.4 100.7 1.3920
2011 Q4 40.8 14.6 -59.4 667.1 -11.5 120.4 102.1 99.4 1.34822012 Q1 -4.1 5.3 -82.4 671.2 -11.0 120.8 99.5 96.9 1.3108 Q2 17.7 25.1 57.8 701.5 . . 98.2 95.9 1.2814 Q3 . . . . . . 95.9 93.7 1.2502
2012 Apr. 1.7 5.4 -8.3 679.7 . . 99.5 97.2 1.3162 May -1.8 5.5 36.6 695.7 . . 98.0 95.7 1.2789 June 17.8 14.2 29.5 701.5 . . 97.2 94.9 1.2526 July 16.2 12.5 17.6 724.8 . . 95.3 93.2 1.2288 Aug. . . . 716.1 . . 95.2 93.0 1.2400 Sep. . . . . . . 97.2 95.0 1.2856
Sources: ECB, European Commission (Eurostat and Economic and Financial Affairs DG) and Thomson Reuters.Note: For more information on the data, see the relevant tables later in this section.1) Data refer to the changing composition of the euro area. For further information, see the General Notes.2) Annual percentage changes for monthly data refer to the end of the month, whereas those for quarterly and yearly data refer to the annual change in the period average.
See the Technical Notes for details.3) M3 and its components exclude holdings by non-euro area residents of money market fund shares/units and debt securities with a maturity of up to two years.4) Based on AAA-rated euro area central government bond yield curves. For further information, see Section 4.7.5) Data refer to the Euro 17, unless otherwise indicated.6) For a definition of the trading partner groups and other information, please refer to the General Notes.

1 MONETARY POLICY STATISTICS
1.1 Consolidated financial statement of the Eurosystem (EUR millions)
S 6ECBMonthly BulletinOctober 2012
1. Assets
31 August 2012 7 September 2012 14 September 2012 21 September 2012 28 September 2012
Gold and gold receivables 433,778 433,778 433,778 433,779 479,292 Claims on non-euro area residents in foreign currency 262,946 262,895 262,555 261,479 256,413 Claims on euro area residents in foreign currency 49,048 46,346 42,682 42,001 39,858 Claims on non-euro area residents in euro 19,172 18,654 19,325 17,865 16,512 Lending to euro area credit institutions in euro 1,209,827 1,205,288 1,197,841 1,187,200 1,178,184 Main refinancing operations 131,484 126,334 130,342 119,838 117,383 Longer-term refinancing operations 1,077,721 1,077,721 1,066,386 1,066,296 1,058,750 Fine-tuning reverse operations 0 0 0 0 0 Structural reverse operations 0 0 0 0 0 Marginal lending facility 590 891 1,044 971 2,047 Credits related to margin calls 32 341 70 96 4 Other claims on euro area credit institutions in euro 218,803 216,250 214,542 213,426 212,652 Securities of euro area residents in euro 599,298 598,717 598,416 597,641 597,655 Securities held for monetary policy purposes 279,038 278,923 279,165 279,383 280,207 Other securities 320,259 319,794 319,251 318,259 317,448 General government debt in euro 30,041 30,042 30,042 30,042 30,010 Other assets 261,857 261,523 261,831 266,107 271,857
Total assets 3,084,769 3,073,494 3,061,012 3,049,539 3,082,432
2. Liabilities
31 August 2012 7 September 2012 14 September 2012 21 September 2012 28 September 2012
Banknotes in circulation 896,434 896,584 894,502 892,185 892,496 Liabilities to euro area credit institutions in euro 1,098,605 1,088,019 1,073,119 1,067,643 1,052,529 Current accounts (covering the minimum reserve system) 541,046 549,287 526,420 550,482 525,830 Deposit facility 345,956 326,805 335,048 305,647 315,754 Fixed-term deposits 209,000 209,000 209,000 209,000 209,000 Fine-tuning reverse operations 0 0 0 0 0 Deposits related to margin calls 2,603 2,927 2,650 2,515 1,945 Other liabilities to euro area credit institutions in euro 4,549 4,692 5,538 5,832 5,224 Debt certificates issued 0 0 0 0 0 Liabilities to other euro area residents in euro 110,410 113,726 121,098 115,778 119,439 Liabilities to non-euro area residents in euro 177,863 174,233 170,176 170,639 171,667 Liabilities to euro area residents in foreign currency 6,205 6,374 5,581 3,560 4,198 Liabilities to non-euro area residents in foreign currency 7,024 7,038 7,899 8,006 6,626 Counterpart of special drawing rights allocated by the IMF 56,886 56,886 56,886 56,886 56,243 Other liabilities 231,206 230,352 230,625 233,421 235,635 Revaluation accounts 409,840 409,840 409,840 409,840 452,824 Capital and reserves 85,750 85,750 85,750 85,749 85,551
Total liabilities 3,084,769 3,073,494 3,061,012 3,049,539 3,082,432
Source: ECB.
1

EURO AREASTATISTICS
Monetarypolicy
statistics
1.2 Key ECB interest rates (levels in percentages per annum; changes in percentage points)
S 7ECB
Monthly BulletinOctober 2012
With effect from: 1) Deposit facility Main refinancing operations Marginal lending facility
Fixed rate tenders Variable rate tenders Fixed rate Minimum bid rate
Level Change Level Level Change Level Change
1 2 3 4 5 6 7
1999 1 Jan. 2.00 - 3.00 - - 4.50 - 4 2) 2.75 0.75 3.00 - ... 3.25 -1.25
22 2.00 -0.75 3.00 - ... 4.50 1.259 Apr. 1.50 -0.50 2.50 - -0.50 3.50 -1.005 Nov. 2.00 0.50 3.00 - 0.50 4.00 0.50
2000 4 Feb. 2.25 0.25 3.25 - 0.25 4.25 0.2517 Mar. 2.50 0.25 3.50 - 0.25 4.50 0.2528 Apr. 2.75 0.25 3.75 - 0.25 4.75 0.25
9 June 3.25 0.50 4.25 - 0.50 5.25 0.5028 3) 3.25 ... - 4.25 ... 5.25 ...
1 Sep. 3.50 0.25 - 4.50 0.25 5.50 0.256 Oct. 3.75 0.25 - 4.75 0.25 5.75 0.25
2001 11 May 3.50 -0.25 - 4.50 -0.25 5.50 -0.2531 Aug. 3.25 -0.25 - 4.25 -0.25 5.25 -0.2518 Sep. 2.75 -0.50 - 3.75 -0.50 4.75 -0.50
9 Nov. 2.25 -0.50 - 3.25 -0.50 4.25 -0.50
2002 6 Dec. 1.75 -0.50 - 2.75 -0.50 3.75 -0.50
2003 7 Mar. 1.50 -0.25 - 2.50 -0.25 3.50 -0.256 June 1.00 -0.50 - 2.00 -0.50 3.00 -0.50
2005 6 Dec. 1.25 0.25 - 2.25 0.25 3.25 0.25
2006 8 Mar. 1.50 0.25 - 2.50 0.25 3.50 0.2515 June 1.75 0.25 - 2.75 0.25 3.75 0.25
9 Aug. 2.00 0.25 - 3.00 0.25 4.00 0.2511 Oct. 2.25 0.25 - 3.25 0.25 4.25 0.2513 Dec. 2.50 0.25 - 3.50 0.25 4.50 0.25
2007 14 Mar. 2.75 0.25 - 3.75 0.25 4.75 0.2513 June 3.00 0.25 - 4.00 0.25 5.00 0.25
2008 9 July 3.25 0.25 - 4.25 0.25 5.25 0.258 Oct. 2.75 -0.50 - - - 4.75 -0.509 4) 3.25 0.50 - - - 4.25 -0.50
15 5) 3.25 ... 3.75 - -0.50 4.25 ... 12 Nov. 2.75 -0.50 3.25 - -0.50 3.75 -0.5010 Dec. 2.00 -0.75 2.50 - -0.75 3.00 -0.75
2009 21 Jan. 1.00 -1.00 2.00 - -0.50 3.00 ... 11 Mar. 0.50 -0.50 1.50 - -0.50 2.50 -0.50
8 Apr. 0.25 -0.25 1.25 - -0.25 2.25 -0.2513 May 0.25 ... 1.00 - -0.25 1.75 -0.50
2011 13 Apr. 0.50 0.25 1.25 - 0.25 2.00 0.2513 July 0.75 0.25 1.50 - 0.25 2.25 0.25
9 Nov. 0.50 -0.25 1.25 - -0.25 2.00 -0.2514 Dec. 0.25 -0.25 1.00 - -0.25 1.75 -0.25
2012 11 July 0.00 -0.25 0.75 - -0.25 1.50 -0.25
Source: ECB.1) From 1 January 1999 to 9 March 2004, the date refers to the deposit and marginal lending facilities. For main refinancing operations, changes in the rate are effective from the
first operation following the date indicated. The change on 18 September 2001 was effective on that same day. From 10 March 2004 onwards, the date refers both to the depositand marginal lending facilities and to the main refinancing operations (with changes effective from the first main refinancing operation following the Governing Councildecision), unless otherwise indicated.
2) On 22 December 1998 the ECB announced that, as an exceptional measure between 4 and 21 January 1999, a narrow corridor of 50 basis points would be applied between theinterest rates for the marginal lending facility and the deposit facility, aimed at facilitating the transition to the new monetary regime by market participants.
3) On 8 June 2000 the ECB announced that, starting from the operation to be settled on 28 June 2000, the main refinancing operations of the Eurosystem would be conducted asvariable rate tenders. The minimum bid rate refers to the minimum interest rate at which counterparties may place their bids.
4) As of 9 October 2008 the ECB reduced the standing facilities corridor from 200 basis points to 100 basis points around the interest rate on the main refinancing operations.The standing facilities corridor was restored to 200 basis points as of 21 January 2009.
5) On 8 October 2008 the ECB announced that, starting from the operation to be settled on 15 October, the weekly main refinancing operations would be carried out through afixed rate tender procedure with full allotment at the interest rate on the main refinancing operations. This change overrode the previous decision (made on the same day)to cut by 50 basis points the minimum bid rate on the main refinancing operations conducted as variable rate tenders.

1.3 Eurosystem monetary policy operations allotted through tender procedures 1), 2) (EUR millions; interest rates in percentages per annum)
S 8ECBMonthly BulletinOctober 2012
1. Main and longer-term refinancing operations 3)
Main refinancing operations
Date of Bids Number of Allotment Fixed rate tender Variable rate tender Running for
settlement (amount) participants (amount) procedures procedures (...) days
Fixed rate Minimum Marginal Weightedbid rate rate 4) average rate
1 2 3 4 5 6 7 8
2012 27 June 180,378 105 180,378 1.00 - - - 74 July 163,629 92 163,629 1.00 - - - 7
11 163,707 90 163,707 0.75 - - - 718 156,752 98 156,752 0.75 - - - 725 130,669 98 130,669 0.75 - - - 7
1 Aug. 132,768 97 132,768 0.75 - - - 78 133,426 87 133,426 0.75 - - - 7
15 130,578 86 130,578 0.75 - - - 722 131,245 91 131,245 0.75 - - - 729 131,484 92 131,484 0.75 - - - 7
5 Sep. 126,334 84 126,334 0.75 - - - 712 130,342 80 130,342 0.75 - - - 719 119,838 84 119,838 0.75 - - - 726 117,383 85 117,383 0.75 - - - 7
3 Oct. 102,886 84 102,886 0.75 - - - 7
Longer-term refinancing operations 5)
2012 11 Apr. 11,389 20 11,389 1.00 - - - 2826 21,338 39 21,338 0.96 - - - 91
9 May 12,988 20 12,988 1.00 - - - 3531 8,307 33 8,307 0.86 - - - 9113 June 18,905 21 18,905 1.00 - - - 2828 26,295 50 26,295 0.79 - - - 9111 July 24,398 27 24,398 0.75 - - - 2826 6) 8,450 36 8,450 . - - - 98
8 Aug. 25,180 28 25,180 0.75 - - - 3530 6) 9,746 36 9,746 . - - - 9112 Sep. 13,844 26 13,844 0.75 - - - 2827 6) 18,709 55 18,709 . - - - 84
2. Other tender operations
Date of settlement Type of Bids Number of Allotment Fixed rate tender Variable rate tender Running
operation (amount) participants (amount) procedures procedures for(...) days
Fixed rate Minimum Maximum Marginal Weightedbid rate bid rate rate 4) average rate
1 2 3 4 5 6 7 8 9 10
2012 27 June Collection of fixed-term deposits 288,426 62 210,500 - - 1.00 0.26 0.26 74 July Collection of fixed-term deposits 398,078 73 210,500 - - 1.00 0.26 0.26 7
11 Collection of fixed-term deposits 424,810 95 211,500 - - 0.75 0.03 0.02 718 Collection of fixed-term deposits 440,138 78 211,500 - - 0.75 0.02 0.02 725 Collection of fixed-term deposits 397,541 69 211,500 - - 0.75 0.02 0.01 7
1 Aug. Collection of fixed-term deposits 463,066 72 211,500 - - 0.75 0.02 0.01 78 Collection of fixed-term deposits 419,957 67 211,500 - - 0.75 0.01 0.01 7
15 Collection of fixed-term deposits 419,503 58 211,500 - - 0.75 0.01 0.01 722 Collection of fixed-term deposits 446,823 57 211,500 - - 0.75 0.01 0.01 729 Collection of fixed-term deposits 452,904 56 209,000 - - 0.75 0.01 0.01 7
5 Sep. Collection of fixed-term deposits 460,886 57 209,000 - - 0.75 0.01 0.01 712 Collection of fixed-term deposits 433,177 58 209,000 - - 0.75 0.01 0.01 719 Collection of fixed-term deposits 468,232 59 209,000 - - 0.75 0.01 0.01 726 Collection of fixed-term deposits 385,607 49 209,000 - - 0.75 0.01 0.01 7
3 Oct. Collection of fixed-term deposits 420,868 56 209,000 - - 0.75 0.01 0.01 7 Source: ECB.1) The amounts shown may differ slightly from those in Section 1.1 owing to operations that have been allotted but not settled.2) With effect from April 2002, split tender operations (i.e. operations with a one-week maturity conducted as standard tender procedures in parallel with a main refinancing
operation) are classified as main refinancing operations.3) On 8 June 2000 the ECB announced that, starting from the operation to be settled on 28 June 2000, the main refinancing operations of the Eurosystem would be conducted as
variable rate tender procedures. The minimum bid rate refers to the minimum interest rate at which counterparties may place their bids. On 8 October 2008 the ECB announcedthat, starting from the operation to be settled on 15 October 2008, the weekly main refinancing operations would be carried out through a fixed rate tender procedure with fullallotment at the interest rate on the main refinancing operations. On 4 March 2010 the ECB decided to return to variable rate tender procedures in the regular three-monthlonger-term refinancing operations, starting with the operation to be allotted on 28 April 2010 and settled on 29 April 2010.
4) In liquidity-providing (absorbing) operations, the marginal rate refers to the lowest (highest) rate at which bids were accepted.5) For the operations settled on 22 December 2011 and 1 March 2012, after one year counterparties have the option to repay any part of the liquidity that they have been allotted
in these operations, on any day that coincides with the settlement day of a main refinancing operation.6) In this longer-term refinancing operation, the rate at which all bids are satisfied is indexed to the average minimum bid rate in the main refinancing operations over the life of the
operation. The interest rates displayed for these indexed longer-term refinancing operations have been rounded to two decimal places. For the precise calculation method,please refer to the Technical Notes.

EURO AREASTATISTICS
Monetarypolicy
statistics
1.4 Minimum reserve and liquidity statistics (EUR billions; period averages of daily positions, unless otherwise indicated; interest rates as percentages per annum)
S 9ECB
Monthly BulletinOctober 2012
1. Reserve base of credit institutions subject to reserve requirements
Reserve Total Liabilities to which a positive reserve coefficient is applied 1) Liabilities to which a 0% reserve coefficient is applied
baseas at Overnight deposits and Debt securities Deposits with an agreed Repos Debt securities
(end of period): deposits with an agreed maturity issued with a maturity maturity or notice period issued with a maturityor notice period of up to 2 years of up to 2 years of over 2 years of over 2 years
1 2 3 4 5 6
2008 18,169.6 10,056.8 848.7 2,376.9 1,243.5 3,643.72009 18,318.2 9,808.5 760.4 2,475.7 1,170.1 4,103.52010 18,948.1 9,962.6 644.3 2,683.3 1,335.4 4,322.52011 18,970.0 9,790.9 687.7 2,781.2 1,303.5 4,406.8
2012 Mar. 19,178.8 9,981.7 725.5 2,758.8 1,336.0 4,376.8 Apr. 19,172.3 10,013.4 726.5 2,736.0 1,349.9 4,346.5 May 19,253.6 10,031.6 716.1 2,736.6 1,406.7 4,362.6 June 19,077.1 10,059.8 701.3 2,708.9 1,284.8 4,322.3 July 19,077.4 10,026.0 724.6 2,655.6 1,332.9 4,338.4
2. Reserve maintenance
Maintenance Required Credit institutions’ Excess Deficiencies Interest rate onperiod reserves current accounts reserves minimum reserves
ending on:1 2 3 4 5
2008 217.2 218.7 1.5 0.0 3.252009 210.2 211.4 1.2 0.0 1.002010 211.8 212.5 0.7 0.5 1.002011 207.7 212.2 4.5 0.0 1.25
2012 8 May 105.2 110.5 5.3 0.0 1.0012 June 106.6 110.8 4.2 0.0 1.0010 July 106.9 111.5 4.6 0.0 1.00
7 Aug. 107.0 510.2 403.2 0.0 0.7511 Sep. 107.1 540.0 432.9 0.0 0.75
9 Oct. 107.0 . . . .
3. Liquidity
Maintenance Liquidity-providing factors Liquidity-absorbing factors Credit Base
period institutions’ moneyending on: Monetary policy operations of the Eurosystem current
accountsEurosystem’s Main Longer-term Marginal Other Deposit Other Banknotes Central Other
net assets refinancing refinancing lending liquidity- facility liquidity- in government factorsin gold operations operations facility providing absorbing circulation deposits (net)
and foreign operations 2) operations 3) with thecurrency Eurosystem
1 2 3 4 5 6 7 8 9 10 11 12
2008 580.5 337.3 457.2 2.7 0.0 200.9 4.9 731.1 107.8 114.3 218.7 1,150.72009 407.6 55.8 593.4 0.7 24.6 65.7 9.9 775.2 150.1 -130.2 211.4 1,052.32010 511.1 179.5 336.3 1.9 130.4 44.7 70.8 815.9 94.4 -79.1 212.5 1,073.12011 622.1 238.0 389.0 4.4 260.3 253.7 200.5 869.4 63.8 -85.9 212.2 1,335.3
2012 10 Apr. 667.6 56.4 1,093.4 3.0 280.6 771.3 215.8 871.2 146.3 -13.3 109.6 1,752.18 May 659.3 47.0 1,088.7 1.0 281.3 771.4 214.0 872.7 137.1 -28.5 110.5 1,754.6
12 June 656.8 58.1 1,071.0 1.6 281.1 770.8 212.8 880.8 117.8 -24.2 110.8 1,762.310 July 666.7 160.7 1,074.9 1.8 280.7 770.6 210.9 892.5 138.8 60.6 111.5 1,774.6
7 Aug. 678.9 146.0 1,079.9 0.8 281.0 343.1 211.5 897.7 130.7 93.5 510.2 1,751.011 Sep. 676.8 130.6 1,076.8 0.8 279.7 328.6 210.5 897.6 107.0 81.0 540.0 1,766.2
Source: ECB.1) A coefficient of 1% is applied as of the maintenance period beginning on 18 January 2012. A coefficient of 2% is applied to all previous maintenance periods.2) Includes liquidity provided under the Eurosystem’s covered bond purchase programmes and the Eurosystem’s Securities Markets Programme.3) Includes liquidity absorbed as a result of the Eurosystem’s foreign exchange swap operations.
For more information, please see: http://www.ecb.europa.eu/mopo/liq/html/index.en.html
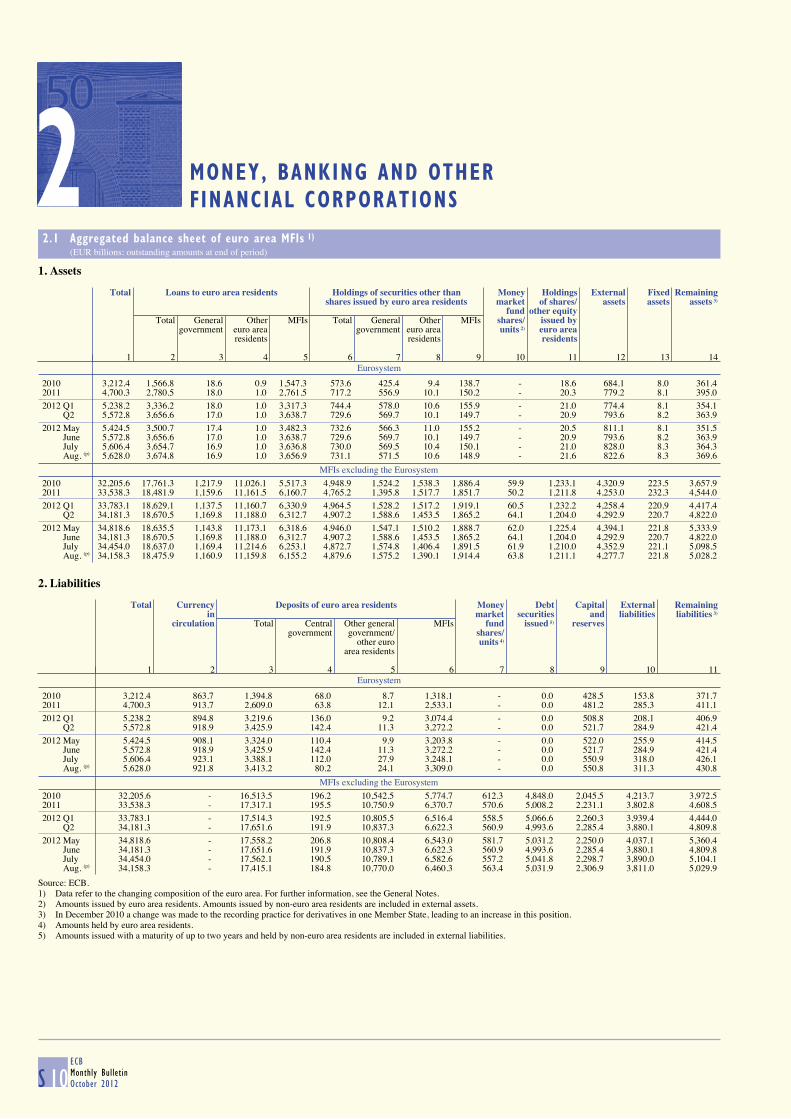
FINANCIAL CORPORATIONS2 MONEY, BANKING AND OTHER
2.1 Aggregated balance sheet of euro area MFIs 1) (EUR billions; outstanding amounts at end of period)
S 10ECBMonthly BulletinOctober 2012
1. Assets
Eurosystem
Total Loans to euro area residents Holdings of securities other than Money Holdings External Fixed Remaining
shares issued by euro area residents market of shares/ assets assets assets 3)
fund other equityTotal General Other MFIs Total General Other MFIs shares/ issued by
government euro area government euro area units 2) euro arearesidents residents residents
1 2 3 4 5 6 7 8 9 10 11 12 13 14
2010 3,212.4 1,566.8 18.6 0.9 1,547.3 573.6 425.4 9.4 138.7 - 18.6 684.1 8.0 361.42011 4,700.3 2,780.5 18.0 1.0 2,761.5 717.2 556.9 10.1 150.2 - 20.3 779.2 8.1 395.0
2012 Q1 5,238.2 3,336.2 18.0 1.0 3,317.3 744.4 578.0 10.6 155.9 - 21.0 774.4 8.1 354.1 Q2 5,572.8 3,656.6 17.0 1.0 3,638.7 729.6 569.7 10.1 149.7 - 20.9 793.6 8.2 363.9
2012 May 5,424.5 3,500.7 17.4 1.0 3,482.3 732.6 566.3 11.0 155.2 - 20.5 811.1 8.1 351.5 June 5,572.8 3,656.6 17.0 1.0 3,638.7 729.6 569.7 10.1 149.7 - 20.9 793.6 8.2 363.9 July 5,606.4 3,654.7 16.9 1.0 3,636.8 730.0 569.5 10.4 150.1 - 21.0 828.0 8.3 364.3 Aug. (p) 5,628.0 3,674.8 16.9 1.0 3,656.9 731.1 571.5 10.6 148.9 - 21.6 822.6 8.3 369.6
MFIs excluding the Eurosystem
2010 32,205.6 17,761.3 1,217.9 11,026.1 5,517.3 4,948.9 1,524.2 1,538.3 1,886.4 59.9 1,233.1 4,320.9 223.5 3,657.92011 33,538.3 18,481.9 1,159.6 11,161.5 6,160.7 4,765.2 1,395.8 1,517.7 1,851.7 50.2 1,211.8 4,253.0 232.3 4,544.0
2012 Q1 33,783.1 18,629.1 1,137.5 11,160.7 6,330.9 4,964.5 1,528.2 1,517.2 1,919.1 60.5 1,232.2 4,258.4 220.9 4,417.4 Q2 34,181.3 18,670.5 1,169.8 11,188.0 6,312.7 4,907.2 1,588.6 1,453.5 1,865.2 64.1 1,204.0 4,292.9 220.7 4,822.0
2012 May 34,818.6 18,635.5 1,143.8 11,173.1 6,318.6 4,946.0 1,547.1 1,510.2 1,888.7 62.0 1,225.4 4,394.1 221.8 5,333.9 June 34,181.3 18,670.5 1,169.8 11,188.0 6,312.7 4,907.2 1,588.6 1,453.5 1,865.2 64.1 1,204.0 4,292.9 220.7 4,822.0 July 34,454.0 18,637.0 1,169.4 11,214.6 6,253.1 4,872.7 1,574.8 1,406.4 1,891.5 61.9 1,210.0 4,352.9 221.1 5,098.5 Aug. (p) 34,158.3 18,475.9 1,160.9 11,159.8 6,155.2 4,879.6 1,575.2 1,390.1 1,914.4 63.8 1,211.1 4,277.7 221.8 5,028.2
2. Liabilities
Eurosystem
Total Currency Deposits of euro area residents Money Debt Capital External Remaining
in market securities and liabilities liabilities 3)
circulation Total Central Other general MFIs fund issued 5) reservesgovernment government/ shares/
other euro units 4)
area residents
1 2 3 4 5 6 7 8 9 10 11
2010 3,212.4 863.7 1,394.8 68.0 8.7 1,318.1 - 0.0 428.5 153.8 371.72011 4,700.3 913.7 2,609.0 63.8 12.1 2,533.1 - 0.0 481.2 285.3 411.1
2012 Q1 5,238.2 894.8 3,219.6 136.0 9.2 3,074.4 - 0.0 508.8 208.1 406.9 Q2 5,572.8 918.9 3,425.9 142.4 11.3 3,272.2 - 0.0 521.7 284.9 421.4
2012 May 5,424.5 908.1 3,324.0 110.4 9.9 3,203.8 - 0.0 522.0 255.9 414.5 June 5,572.8 918.9 3,425.9 142.4 11.3 3,272.2 - 0.0 521.7 284.9 421.4 July 5,606.4 923.1 3,388.1 112.0 27.9 3,248.1 - 0.0 550.9 318.0 426.1 Aug. (p) 5,628.0 921.8 3,413.2 80.2 24.1 3,309.0 - 0.0 550.8 311.3 430.8
MFIs excluding the Eurosystem
2010 32,205.6 - 16,513.5 196.2 10,542.5 5,774.7 612.3 4,848.0 2,045.5 4,213.7 3,972.52011 33,538.3 - 17,317.1 195.5 10,750.9 6,370.7 570.6 5,008.2 2,231.1 3,802.8 4,608.5
2012 Q1 33,783.1 - 17,514.3 192.5 10,805.5 6,516.4 558.5 5,066.6 2,260.3 3,939.4 4,444.0 Q2 34,181.3 - 17,651.6 191.9 10,837.3 6,622.3 560.9 4,993.6 2,285.4 3,880.1 4,809.8
2012 May 34,818.6 - 17,558.2 206.8 10,808.4 6,543.0 581.7 5,031.2 2,250.0 4,037.1 5,360.4 June 34,181.3 - 17,651.6 191.9 10,837.3 6,622.3 560.9 4,993.6 2,285.4 3,880.1 4,809.8 July 34,454.0 - 17,562.1 190.5 10,789.1 6,582.6 557.2 5,041.8 2,298.7 3,890.0 5,104.1 Aug. (p) 34,158.3 - 17,415.1 184.8 10,770.0 6,460.3 563.4 5,031.9 2,306.9 3,811.0 5,029.9
Source: ECB.1) Data refer to the changing composition of the euro area. For further information, see the General Notes.2) Amounts issued by euro area residents. Amounts issued by non-euro area residents are included in external assets.3) In December 2010 a change was made to the recording practice for derivatives in one Member State, leading to an increase in this position.4) Amounts held by euro area residents.5) Amounts issued with a maturity of up to two years and held by non-euro area residents are included in external liabilities.
2

EURO AREASTATISTICS
Money, bankingand other
financial corporations
2.2 Consolidated balance sheet of euro area MFIs 1) (EUR billions; outstanding amounts at end of period; transactions during period)
S 11ECB
Monthly BulletinOctober 2012
1. Assets
Outstanding amounts
Total Loans to euro area residents Holdings of securities other than shares Holdings External Fixed Remaining
issued by euro area residents of shares/ assets assets assets 2)
other equityTotal General Other Total General Other issued by
government euro area government euro area other euro arearesidents residents residents
1 2 3 4 5 6 7 8 9 10 11
2010 25,762.1 12,263.6 1,236.5 11,027.1 3,497.4 1,949.7 1,547.7 800.6 5,005.0 231.5 3,964.12011 26,715.5 12,340.1 1,177.6 11,162.5 3,480.5 1,952.7 1,527.8 739.4 5,032.2 240.4 4,882.8
2012 Q1 26,690.5 12,317.2 1,155.5 11,161.7 3,633.9 2,106.2 1,527.7 755.9 5,032.9 229.0 4,721.6 Q2 27,179.0 12,375.7 1,186.8 11,189.0 3,621.9 2,158.3 1,463.6 731.3 5,086.5 228.9 5,134.7
2012 May 27,789.2 12,335.2 1,161.2 11,174.1 3,634.7 2,113.4 1,521.2 750.6 5,205.2 229.9 5,633.6 June 27,179.0 12,375.7 1,186.8 11,189.0 3,621.9 2,158.3 1,463.6 731.3 5,086.5 228.9 5,134.7 July 27,519.7 12,401.9 1,186.3 11,215.5 3,561.0 2,144.3 1,416.7 735.5 5,180.9 229.4 5,410.9 Aug. (p) 27,300.7 12,338.6 1,177.9 11,160.8 3,547.4 2,146.7 1,400.7 738.0 5,100.4 230.1 5,346.2
Transactions
2010 575.8 409.9 203.3 206.5 139.4 140.4 -1.0 5.7 -112.5 2.4 130.82011 990.6 60.4 -55.6 116.0 125.3 149.3 -24.0 -30.1 -37.1 7.8 864.2
2012 Q1 112.8 -0.1 -21.2 21.1 153.8 149.8 4.0 19.2 68.9 -12.2 -116.8 Q2 410.1 54.2 33.8 20.4 -1.1 41.5 -42.6 -11.8 -69.3 -0.1 438.2
2012 May 832.8 6.1 1.6 4.4 26.9 27.5 -0.6 -9.9 29.9 0.3 779.5 June -543.6 49.1 25.2 23.9 -19.4 17.4 -36.8 -22.8 -85.8 -1.0 -463.7 July 273.1 28.4 -0.6 29.0 -71.6 -17.3 -54.3 5.5 8.9 0.5 301.4 Aug. (p) -168.5 -55.7 -8.3 -47.3 -26.6 -11.3 -15.4 0.2 -26.4 1.1 -61.2
2. Liabilities
Outstanding amounts
Total Currency in Deposits of Deposits of Money market Debt Capital External Remaining Excess ofcirculation central other general fund shares/ securities and liabilities liabilities 2) inter-MFI
government government/ units 3) issued 4) reserves liabilitiesother euro area over inter-MFI
residents assets
1 2 3 4 5 6 7 8 9 10
2010 25,762.1 808.6 264.2 10,551.2 552.4 2,823.0 2,022.9 4,367.5 4,344.2 28.22011 26,715.5 857.5 259.3 10,763.0 520.4 3,006.4 2,219.6 4,088.2 5,019.5 -18.5
2012 Q1 26,690.5 844.9 328.5 10,814.7 498.0 2,991.6 2,271.8 4,147.5 4,850.9 -57.4 Q2 27,179.0 867.7 334.4 10,848.6 496.8 2,978.7 2,313.4 4,165.1 5,231.2 -56.9
2012 May 27,789.2 856.3 317.2 10,818.2 519.7 2,987.3 2,276.7 4,293.0 5,774.9 -54.2 June 27,179.0 867.7 334.4 10,848.6 496.8 2,978.7 2,313.4 4,165.1 5,231.2 -56.9 July 27,519.7 871.3 302.5 10,817.0 495.3 3,000.2 2,354.2 4,208.0 5,530.3 -59.1 Aug. (p) 27,300.7 870.2 265.0 10,794.0 499.6 2,968.6 2,363.1 4,122.3 5,460.8 -42.8
Transactions
2010 575.8 38.6 11.8 332.7 -98.5 39.4 99.8 -26.3 143.4 35.02011 990.6 49.1 -0.8 167.8 -29.0 50.6 137.8 -198.9 860.4 -46.6
2012 Q1 112.8 -12.4 69.3 59.1 19.7 -0.4 17.6 117.2 -147.5 -9.8 Q2 410.1 22.8 8.2 31.1 -0.8 -48.6 54.2 -75.6 436.8 -18.0
2012 May 832.8 8.7 27.4 5.2 12.3 -29.5 14.2 15.1 795.2 -15.8 June -543.6 11.4 17.1 31.5 -22.8 -5.4 35.8 -104.0 -504.3 -2.9 July 273.1 3.7 -31.8 -36.6 -1.5 8.8 11.9 -2.3 323.0 -2.1 Aug. (p) -168.5 -1.1 -37.7 -16.9 4.2 -10.4 -0.5 -46.8 -73.8 14.6
Source: ECB.1) Data refer to the changing composition of the euro area. For further information, see the General Notes.2) In December 2010 a change was made to the recording practice for derivatives in one Member State, leading to an increase in this position.3) Amounts held by euro area residents.4) Amounts issued with a maturity of up to two years and held by non-euro area residents are included in external liabilities.
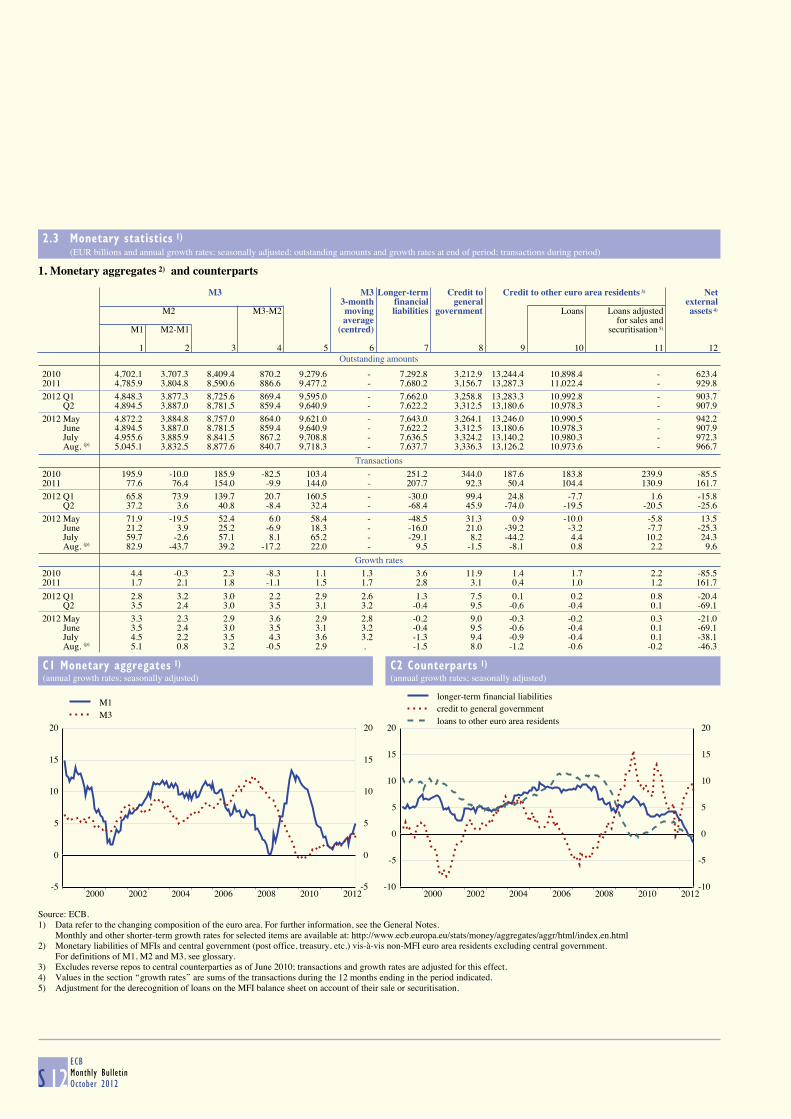
2.3 Monetary statistics 1) (EUR billions and annual growth rates; seasonally adjusted; outstanding amounts and growth rates at end of period; transactions during period)
S 12ECBMonthly BulletinOctober 2012
1. Monetary aggregates 2) and counterparts
Outstanding amounts
M3 M3 Longer-term Credit to Credit to other euro area residents 3) Net
3-month financial general external M2 M3-M2 moving liabilities government Loans Loans adjusted assets 4)
average for sales andM1 M2-M1 (centred) securitisation 5)
1 2 3 4 5 6 7 8 9 10 11 12
2010 4,702.1 3,707.3 8,409.4 870.2 9,279.6 - 7,292.8 3,212.9 13,244.4 10,898.4 - 623.42011 4,785.9 3,804.8 8,590.6 886.6 9,477.2 - 7,680.2 3,156.7 13,287.3 11,022.4 - 929.8
2012 Q1 4,848.3 3,877.3 8,725.6 869.4 9,595.0 - 7,662.0 3,258.8 13,283.3 10,992.8 - 903.7 Q2 4,894.5 3,887.0 8,781.5 859.4 9,640.9 - 7,622.2 3,312.5 13,180.6 10,978.3 - 907.9
2012 May 4,872.2 3,884.8 8,757.0 864.0 9,621.0 - 7,643.0 3,264.1 13,246.0 10,990.5 - 942.2 June 4,894.5 3,887.0 8,781.5 859.4 9,640.9 - 7,622.2 3,312.5 13,180.6 10,978.3 - 907.9 July 4,955.6 3,885.9 8,841.5 867.2 9,708.8 - 7,636.5 3,324.2 13,140.2 10,980.3 - 972.3 Aug. (p) 5,045.1 3,832.5 8,877.6 840.7 9,718.3 - 7,637.7 3,336.3 13,126.2 10,973.6 - 966.7
Transactions
2010 195.9 -10.0 185.9 -82.5 103.4 - 251.2 344.0 187.6 183.8 239.9 -85.52011 77.6 76.4 154.0 -9.9 144.0 - 207.7 92.3 50.4 104.4 130.9 161.7
2012 Q1 65.8 73.9 139.7 20.7 160.5 - -30.0 99.4 24.8 -7.7 1.6 -15.8 Q2 37.2 3.6 40.8 -8.4 32.4 - -68.4 45.9 -74.0 -19.5 -20.5 -25.6
2012 May 71.9 -19.5 52.4 6.0 58.4 - -48.5 31.3 0.9 -10.0 -5.8 13.5 June 21.2 3.9 25.2 -6.9 18.3 - -16.0 21.0 -39.2 -3.2 -7.7 -25.3 July 59.7 -2.6 57.1 8.1 65.2 - -29.1 8.2 -44.2 4.4 10.2 24.3 Aug. (p) 82.9 -43.7 39.2 -17.2 22.0 - 9.5 -1.5 -8.1 0.8 2.2 9.6
Growth rates
2010 4.4 -0.3 2.3 -8.3 1.1 1.3 3.6 11.9 1.4 1.7 2.2 -85.52011 1.7 2.1 1.8 -1.1 1.5 1.7 2.8 3.1 0.4 1.0 1.2 161.7
2012 Q1 2.8 3.2 3.0 2.2 2.9 2.6 1.3 7.5 0.1 0.2 0.8 -20.4 Q2 3.5 2.4 3.0 3.5 3.1 3.2 -0.4 9.5 -0.6 -0.4 0.1 -69.1
2012 May 3.3 2.3 2.9 3.6 2.9 2.8 -0.2 9.0 -0.3 -0.2 0.3 -21.0 June 3.5 2.4 3.0 3.5 3.1 3.2 -0.4 9.5 -0.6 -0.4 0.1 -69.1 July 4.5 2.2 3.5 4.3 3.6 3.2 -1.3 9.4 -0.9 -0.4 0.1 -38.1 Aug. (p) 5.1 0.8 3.2 -0.5 2.9 . -1.5 8.0 -1.2 -0.6 -0.2 -46.3
C1 Monetary aggregates 1)
(annual growth rates; seasonally adjusted)
C2 Counterparts 1)
(annual growth rates; seasonally adjusted)
-5
0
5
10
15
20
2000 2002 2004 2006 2008 2010 2012-5
0
5
10
15
20
M1M3
-10
-5
0
5
10
15
20
2000 2002 2004 2006 2008 2010 2012-10
-5
0
5
10
15
20
longer-term financial liabilitiescredit to general governmentloans to other euro area residents
Source: ECB.1) Data refer to the changing composition of the euro area. For further information, see the General Notes.
Monthly and other shorter-term growth rates for selected items are available at: http://www.ecb.europa.eu/stats/money/aggregates/aggr/html/index.en.html2) Monetary liabilities of MFIs and central government (post office, treasury, etc.) vis-à-vis non-MFI euro area residents excluding central government.
For definitions of M1, M2 and M3, see glossary.3) Excludes reverse repos to central counterparties as of June 2010; transactions and growth rates are adjusted for this effect.4) Values in the section ‘‘growth rates’’ are sums of the transactions during the 12 months ending in the period indicated.5) Adjustment for the derecognition of loans on the MFI balance sheet on account of their sale or securitisation.
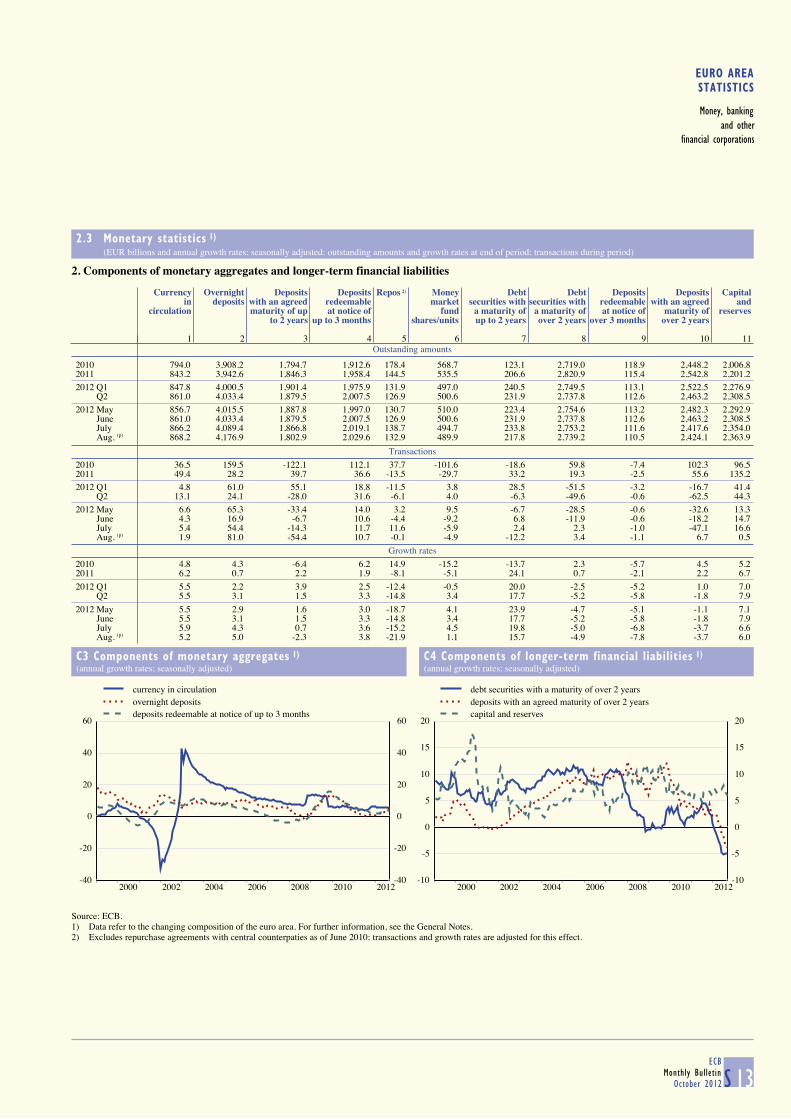
EURO AREASTATISTICS
Money, bankingand other
financial corporations
2.3 Monetary statistics 1) (EUR billions and annual growth rates; seasonally adjusted; outstanding amounts and growth rates at end of period; transactions during period)
S 13ECB
Monthly BulletinOctober 2012
2. Components of monetary aggregates and longer-term financial liabilities
Outstanding amounts
Currency Overnight Deposits Deposits Repos 2) Money Debt Debt Deposits Deposits Capitalin deposits with an agreed redeemable market securities with securities with redeemable with an agreed and
circulation maturity of up at notice of fund a maturity of a maturity of at notice of maturity of reservesto 2 years up to 3 months shares/units up to 2 years over 2 years over 3 months over 2 years
1 2 3 4 5 6 7 8 9 10 11
2010 794.0 3,908.2 1,794.7 1,912.6 178.4 568.7 123.1 2,719.0 118.9 2,448.2 2,006.82011 843.2 3,942.6 1,846.3 1,958.4 144.5 535.5 206.6 2,820.9 115.4 2,542.8 2,201.2
2012 Q1 847.8 4,000.5 1,901.4 1,975.9 131.9 497.0 240.5 2,749.5 113.1 2,522.5 2,276.9 Q2 861.0 4,033.4 1,879.5 2,007.5 126.9 500.6 231.9 2,737.8 112.6 2,463.2 2,308.5
2012 May 856.7 4,015.5 1,887.8 1,997.0 130.7 510.0 223.4 2,754.6 113.2 2,482.3 2,292.9 June 861.0 4,033.4 1,879.5 2,007.5 126.9 500.6 231.9 2,737.8 112.6 2,463.2 2,308.5 July 866.2 4,089.4 1,866.8 2,019.1 138.7 494.7 233.8 2,753.2 111.6 2,417.6 2,354.0 Aug. (p) 868.2 4,176.9 1,802.9 2,029.6 132.9 489.9 217.8 2,739.2 110.5 2,424.1 2,363.9
Transactions
2010 36.5 159.5 -122.1 112.1 37.7 -101.6 -18.6 59.8 -7.4 102.3 96.52011 49.4 28.2 39.7 36.6 -13.5 -29.7 33.2 19.3 -2.5 55.6 135.2
2012 Q1 4.8 61.0 55.1 18.8 -11.5 3.8 28.5 -51.5 -3.2 -16.7 41.4 Q2 13.1 24.1 -28.0 31.6 -6.1 4.0 -6.3 -49.6 -0.6 -62.5 44.3
2012 May 6.6 65.3 -33.4 14.0 3.2 9.5 -6.7 -28.5 -0.6 -32.6 13.3 June 4.3 16.9 -6.7 10.6 -4.4 -9.2 6.8 -11.9 -0.6 -18.2 14.7 July 5.4 54.4 -14.3 11.7 11.6 -5.9 2.4 2.3 -1.0 -47.1 16.6 Aug. (p) 1.9 81.0 -54.4 10.7 -0.1 -4.9 -12.2 3.4 -1.1 6.7 0.5
Growth rates
2010 4.8 4.3 -6.4 6.2 14.9 -15.2 -13.7 2.3 -5.7 4.5 5.22011 6.2 0.7 2.2 1.9 -8.1 -5.1 24.1 0.7 -2.1 2.2 6.7
2012 Q1 5.5 2.2 3.9 2.5 -12.4 -0.5 20.0 -2.5 -5.2 1.0 7.0 Q2 5.5 3.1 1.5 3.3 -14.8 3.4 17.7 -5.2 -5.8 -1.8 7.9
2012 May 5.5 2.9 1.6 3.0 -18.7 4.1 23.9 -4.7 -5.1 -1.1 7.1 June 5.5 3.1 1.5 3.3 -14.8 3.4 17.7 -5.2 -5.8 -1.8 7.9 July 5.9 4.3 0.7 3.6 -15.2 4.5 19.8 -5.0 -6.8 -3.7 6.6 Aug. (p) 5.2 5.0 -2.3 3.8 -21.9 1.1 15.7 -4.9 -7.8 -3.7 6.0
C3 Components of monetary aggregates 1)
(annual growth rates; seasonally adjusted)
C4 Components of longer-term financial liabilities 1)
(annual growth rates; seasonally adjusted)
-40
-20
0
20
40
60
2000 2002 2004 2006 2008 2010 2012-40
-20
0
20
40
60
currency in circulationovernight depositsdeposits redeemable at notice of up to 3 months
-10
-5
0
5
10
15
20
2000 2002 2004 2006 2008 2010 2012-10
-5
0
5
10
15
20
debt securities with a maturity of over 2 yearsdeposits with an agreed maturity of over 2 yearscapital and reserves
Source: ECB.1) Data refer to the changing composition of the euro area. For further information, see the General Notes.2) Excludes repurchase agreements with central counterpaties as of June 2010; transactions and growth rates are adjusted for this effect.

2.3 Monetary Statistics 1) (EUR billions and annual growth rates; seasonally adjusted; outstanding amounts and growth rates at end of period; transactions during period)
S 14ECBMonthly BulletinOctober 2012
3. Loans as counterpart to M3
Outstanding amounts
Insurance Other Non-financial corporations Households 3)
corporations financial and pension inter-
funds mediaries 2)
Total Total Total TotalUp to Over 1 Over Consumer Loans Other
Loans adjusted 1 year and up to 5 years Loans adjusted credit for house loansfor sales and 5 years for sales and purchase
securitisation 4) securitisation 4)
1 2 3 4 5 6 7 8 9 10 11 12
2010 93.8 978.1 4,668.6 - 1,127.7 899.0 2,641.9 5,158.0 - 638.5 3,700.6 819.02011 91.1 977.5 4,721.3 - 1,146.7 859.6 2,715.0 5,232.5 - 626.3 3,777.6 828.6
2012 Q1 88.0 965.0 4,698.3 - 1,136.4 846.9 2,715.0 5,241.4 - 620.3 3,792.8 828.3 Q2 83.9 951.7 4,692.0 - 1,151.4 844.6 2,696.0 5,250.7 - 614.1 3,811.0 825.6
2012 May 82.5 959.0 4,698.0 - 1,149.3 844.9 2,703.8 5,251.0 - 620.7 3,802.1 828.2 June 83.9 951.7 4,692.0 - 1,151.4 844.6 2,696.0 5,250.7 - 614.1 3,811.0 825.6 July 83.2 959.0 4,698.7 - 1,165.3 841.5 2,691.9 5,239.3 - 609.2 3,804.4 825.7 Aug. (p) 86.5 960.2 4,682.0 - 1,158.3 835.3 2,688.4 5,245.0 - 607.5 3,810.1 827.4
Transactions
2010 6.4 32.3 -1.8 45.1 -37.4 -26.3 62.0 146.9 155.5 -8.5 133.7 21.72011 1.3 -35.1 57.7 63.5 23.0 -22.0 56.7 80.5 101.2 -11.5 84.7 7.3
2012 Q1 -2.9 -9.8 -9.7 -6.6 -7.0 -8.6 5.9 14.6 20.4 -2.8 16.4 1.0 Q2 -4.2 -19.4 -6.3 -0.2 13.5 -3.6 -16.3 10.5 3.2 -5.0 18.3 -2.8
2012 May 1.1 -0.8 -10.7 -6.5 -5.4 -1.5 -3.8 0.4 0.3 1.3 -0.2 -0.8 June 1.4 -5.1 -3.2 -1.2 1.1 -1.5 -2.8 3.6 -2.9 -4.6 9.7 -1.5 July -0.7 4.9 8.6 7.9 15.9 -2.7 -4.6 -8.4 -1.4 -4.0 -4.8 0.5 Aug. (p) 3.3 1.1 -10.1 -9.8 -4.8 -5.0 -0.3 6.6 7.4 -1.4 5.7 2.3
Growth rates
2010 7.3 3.6 0.0 1.0 -3.2 -2.8 2.4 2.9 3.1 -1.3 3.8 2.82011 1.5 -3.6 1.2 1.4 2.0 -2.5 2.1 1.6 2.0 -1.8 2.3 0.9
2012 Q1 -0.3 -2.2 0.3 0.4 -0.4 -3.1 1.6 0.6 1.7 -2.1 1.1 0.7 Q2 -5.9 -2.1 -0.6 -0.4 -1.7 -2.7 0.5 0.2 1.1 -1.9 0.8 -0.5
2012 May -6.4 -3.7 0.0 0.3 0.2 -2.7 0.8 0.3 1.3 -1.9 0.8 0.0 June -5.9 -2.1 -0.6 -0.4 -1.7 -2.7 0.5 0.2 1.1 -1.9 0.8 -0.5 July -8.6 -2.8 -0.4 -0.2 0.1 -2.7 0.1 0.3 1.0 -2.1 0.8 -0.5 Aug. (p) -11.2 -3.4 -0.8 -0.5 -0.3 -3.3 -0.1 0.2 1.0 -2.4 0.8 -0.4
C5 Loans to other financial intermediaries and non-financial
corporations 1) (annual growth rates; not seasonally adjusted)
C6 Loans to households 1)
(annual growth rates; not seasonally adjusted)
-5
0
5
10
15
20
25
30
2000 2002 2004 2006 2008 2010 2012-5
0
5
10
15
20
25
30
other financial intermediariesnon-financial corporations
-5
0
5
10
15
2000 2002 2004 2006 2008 2010 2012-5
0
5
10
15
consumer creditloans for house purchaseother loans
Source: ECB.1) Data refer to the changing composition of the euro area. For further information, see the General Notes.2) Excludes reverse repos to central counterparties as of June 2010; transactions and growth rates are adjusted for this effect.3) Including non-profit institutions serving households.4) Adjusted for the derecognition of loans on the MFI balance sheet on account of their sale or securitisation.

EURO AREASTATISTICS
Money, bankingand other
financial corporations
2.4 MFI loans: breakdown 1), 2) (EUR billions and annual growth rates; not seasonally adjusted; outstanding amounts and growth rates at end of period; transactions during period)
S 15ECB
Monthly BulletinOctober 2012
1. Loans to financial intermediaries and non-financial corporations
Outstanding amounts
Insurance corporations and pension funds Other financial intermediaries Non-financial corporations
Total Up to Over 1 Over Total Up to Over 1 Over Total Up to Over 1 Over
1 year and up to 5 years 1 year and up to 5 years 1 year and up to 5 years5 years Reverse repos 5 years 5 years
to centralcounterparties
1 2 3 4 5 6 7 8 9 10 11 12 13
2011 83.4 63.7 6.3 13.4 1,116.4 155.6 579.0 214.7 322.6 4,719.0 1,138.9 859.5 2,720.5
2012 Q1 86.1 67.5 5.4 13.2 1,145.8 184.8 589.7 222.0 334.2 4,697.7 1,136.8 847.9 2,713.1 Q2 85.3 67.5 5.4 12.4 1,148.4 177.1 582.5 223.3 342.6 4,697.8 1,161.1 843.9 2,692.7
2012 June 85.3 67.5 5.4 12.4 1,148.4 177.1 582.5 223.3 342.6 4,697.8 1,161.1 843.9 2,692.7 July 85.2 67.7 5.0 12.4 1,179.4 209.6 613.9 223.1 342.5 4,703.6 1,166.8 841.3 2,695.5 Aug. (p) 88.7 71.0 5.3 12.5 1,159.3 199.3 588.8 225.0 345.6 4,667.1 1,144.9 833.7 2,688.5
Transactions
2011 1.8 2.8 1.0 -2.0 -23.5 12.8 -20.7 -9.0 6.2 56.5 22.1 -22.0 56.4
2012 Q1 3.0 3.9 -0.9 0.0 32.2 29.1 12.9 7.4 11.9 -8.0 1.3 -7.7 -1.6 Q2 -0.9 -0.1 0.0 -0.8 -5.4 -9.6 -12.0 -0.4 6.9 0.0 22.8 -5.2 -17.6
2012 June 0.5 1.4 -0.1 -0.8 5.1 -3.8 2.1 1.8 1.2 -2.6 7.2 -4.0 -5.8 July -0.2 0.2 -0.4 0.0 28.6 32.5 30.1 -0.7 -0.8 7.8 7.7 -2.2 2.3 Aug. (p) 3.6 3.2 0.3 0.1 -20.2 -10.3 -25.3 1.6 3.5 -30.0 -19.8 -6.4 -3.8
Growth rates
2011 1.9 3.9 19.6 -13.3 -2.0 8.9 -3.4 -4.3 2.0 1.2 2.0 -2.5 2.1
2012 Q1 -0.4 1.2 -2.2 -7.6 2.2 34.4 -0.1 4.4 5.1 0.3 -0.4 -3.1 1.6 Q2 -6.0 -5.4 2.1 -11.6 0.3 14.4 -4.6 6.7 5.2 -0.6 -1.7 -2.7 0.5
2012 June -6.0 -5.4 2.1 -11.6 0.3 14.4 -4.6 6.7 5.2 -0.6 -1.7 -2.7 0.5 July -8.6 -8.2 -6.0 -11.8 1.9 30.3 -0.7 6.1 4.3 -0.4 0.0 -2.7 0.1 Aug. (p) -10.9 -11.6 0.0 -11.4 -0.8 12.8 -6.4 6.7 5.1 -0.8 -0.3 -3.3 -0.1
2. Loans to households 3)
Outstanding amounts
Total Consumer credit Loans for house purchase Other loans
Total Up to Over 1 Over Total Up to Over 1 Over Total Up to Over 1 Over
1 year and up to 5 years 1 year and up to 5 years 1 year and up to 5 years5 years 5 years Sole 5 years
proprietors1 2 3 4 5 6 7 8 9 10 11 12 13 14
2011 5,242.8 628.5 140.9 183.8 303.7 3,784.4 14.5 56.7 3,713.3 829.9 419.7 142.8 87.5 599.6
2012 Q1 5,231.0 617.6 136.1 179.9 301.7 3,787.2 14.0 56.6 3,716.5 826.2 417.4 141.8 85.9 598.5 Q2 5,256.5 617.2 137.7 179.8 299.6 3,807.9 14.2 56.6 3,737.1 831.4 417.4 144.8 85.4 601.2
2012 June 5,256.5 617.2 137.7 179.8 299.6 3,807.9 14.2 56.6 3,737.1 831.4 417.4 144.8 85.4 601.2 July 5,246.3 611.5 136.7 179.0 295.8 3,809.4 14.3 57.0 3,738.0 825.4 416.6 139.8 84.2 601.4 Aug. (p) 5,244.6 608.0 134.7 178.2 295.0 3,810.6 14.4 57.0 3,739.2 826.0 415.0 138.5 83.7 603.9
Transactions
2011 81.1 -11.6 -3.7 -6.3 -1.6 85.2 -0.2 2.7 82.7 7.4 8.8 -6.4 -2.5 16.3
2012 Q1 -6.0 -7.7 -4.5 -2.1 -1.0 4.1 -0.4 0.1 4.3 -2.4 -2.6 -0.7 -1.0 -0.7 Q2 26.7 0.7 1.1 0.4 -0.7 20.7 0.2 0.1 20.4 5.2 -2.9 4.2 -0.8 1.8
2012 June 20.9 0.5 0.2 0.3 0.0 14.8 0.1 -0.2 14.8 5.6 -0.6 5.2 -0.5 0.9 July -7.2 -4.8 -0.5 -0.9 -3.4 3.3 0.1 0.4 2.7 -5.7 -0.4 -4.7 -1.0 0.0 Aug. (p) -0.8 -3.2 -1.7 -0.9 -0.6 1.3 0.0 0.0 1.2 1.2 -1.7 -1.4 -0.4 3.0
Growth rates
2011 1.6 -1.8 -2.5 -3.3 -0.5 2.3 -1.7 5.0 2.3 0.9 2.1 -4.3 -2.9 2.8
2012 Q1 0.7 -2.1 -1.7 -3.7 -1.3 1.1 1.1 5.2 1.0 0.7 2.0 -4.3 -2.1 2.4 Q2 0.2 -1.9 -2.7 -2.4 -1.3 0.8 -0.7 3.3 0.7 -0.5 0.8 -4.7 -3.2 1.0
2012 June 0.2 -1.9 -2.7 -2.4 -1.3 0.8 -0.7 3.3 0.7 -0.5 0.8 -4.7 -3.2 1.0 July 0.2 -2.1 -1.9 -2.4 -2.1 0.8 -0.7 3.2 0.8 -0.5 1.0 -3.2 -4.3 0.7 Aug. (p) 0.2 -2.4 -3.7 -2.4 -1.8 0.8 -0.3 2.4 0.8 -0.4 0.6 -4.1 -4.1 1.1
Source: ECB.1) MFI sector excluding the Eurosystem; sectoral classification is based on the ESA 95.2) Data refer to the changing composition of the euro area. For further information, see the General Notes.3) Including non-profit institutions serving households.

2.4 MFI loans: breakdown 1), 2) (EUR billions and annual growth rates; not seasonally adjusted; outstanding amounts and growth rates at end of period; transactions during period)
S 16ECBMonthly BulletinOctober 2012
3. Loans to government and non-euro area residents
Outstanding amounts
General government Non-euro area residents
Total Central Other general government Total Banks 3) Non-banks
governmentState Local Social Total General Other
government government security governmentfunds
1 2 3 4 5 6 7 8 9 10
2010 1,217.9 397.5 225.2 549.1 46.1 2,962.9 2,010.9 952.1 49.5 902.62011 1,159.6 348.9 221.7 567.4 21.7 3,020.8 2,022.5 998.3 62.4 935.9
2011 Q3 1,145.4 343.5 224.0 553.2 24.7 3,155.7 2,133.1 1,022.7 62.7 960.0 Q4 1,159.6 348.9 221.7 567.4 21.7 3,020.8 2,022.5 998.3 62.4 935.92012 Q1 1,137.5 322.6 224.0 566.9 24.0 3,004.9 1,997.7 1,007.2 59.4 947.8 Q2 (p) 1,169.8 339.7 240.1 565.1 25.1 3,084.7 2,062.3 1,023.7 58.0 965.7
Transactions
2010 204.2 156.3 14.9 21.1 11.9 6.3 8.3 -2.3 0.6 -2.92011 -54.9 -45.9 -0.4 14.6 -23.3 16.0 -26.1 42.0 13.0 29.1
2011 Q3 -6.7 -3.4 0.6 -1.6 -2.4 65.9 59.6 6.3 1.4 4.9 Q4 13.3 4.7 1.2 10.3 -2.9 -150.7 -107.7 -43.1 -1.4 -41.62012 Q1 -21.2 -25.9 -1.7 4.1 2.3 40.2 17.0 23.2 -2.2 25.4 Q2 (p) 34.8 19.6 16.1 -1.8 1.2 -13.3 -3.6 -8.6 -3.0 -5.6
Growth rates
2010 20.3 67.1 7.1 4.0 35.1 0.6 0.5 -0.1 0.8 -0.22011 -4.5 -11.6 -0.2 2.7 -51.6 0.7 -1.1 4.4 26.7 3.2
2011 Q3 6.3 28.9 0.2 1.9 -43.3 5.2 4.0 7.4 24.6 6.4 Q4 -4.5 -11.6 -0.2 2.7 -51.6 0.7 -1.1 4.4 26.7 3.22012 Q1 -4.2 -10.4 -2.8 1.9 -41.6 0.1 -0.3 0.9 7.1 0.6 Q2 (p) 1.8 -1.4 7.2 2.0 -6.6 -1.8 -1.6 -2.2 -8.5 -1.8
C7 Loans to government 2)
(annual growth rates; not seasonally adjusted)
C8 Loans to non-euro area residents 2)
(annual growth rates; not seasonally adjusted)
-20
-10
0
10
20
30
40
50
60
70
2000 2002 2004 2006 2008 2010-20
-10
0
10
20
30
40
50
60
70
central governmentother general government
-30
-20
-10
0
10
20
30
40
2000 2002 2004 2006 2008 2010-30
-20
-10
0
10
20
30
40
non-resident banksnon-resident non-banks
Source: ECB.1) MFI sector excluding the Eurosystem; sectoral classification is based on the ESA 95.2) Data refer to the changing composition of the euro area. For further information, see the General Notes.3) The term ‘‘banks’’ is used in this table to indicate institutions similar to MFIs which are resident outside the euro area.
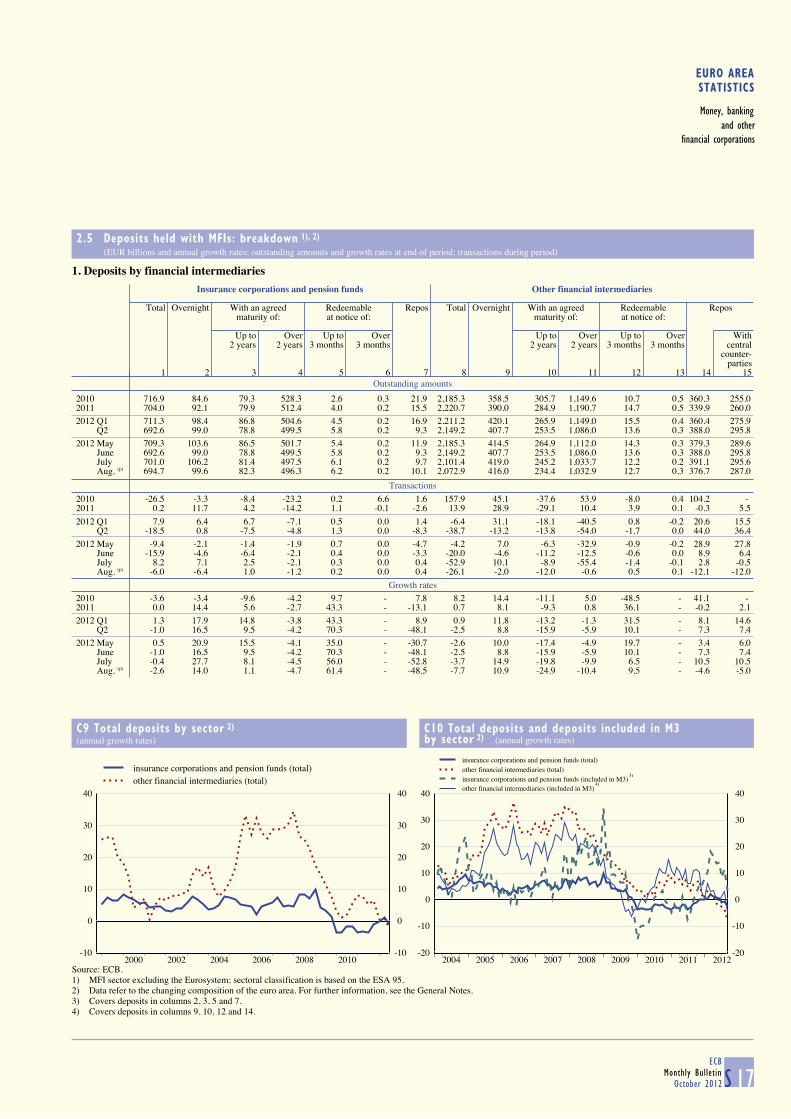
EURO AREASTATISTICS
Money, bankingand other
financial corporations
2.5 Deposits held with MFIs: breakdown 1), 2) (EUR billions and annual growth rates; outstanding amounts and growth rates at end of period; transactions during period)
S 17ECB
Monthly BulletinOctober 2012
1. Deposits by financial intermediaries
Outstanding amounts
Insurance corporations and pension funds Other financial intermediaries
Total Overnight With an agreed Redeemable Repos Total Overnight With an agreed Redeemable Repos
maturity of: at notice of: maturity of: at notice of:
Up to Over Up to Over Up to Over Up to Over With2 years 2 years 3 months 3 months 2 years 2 years 3 months 3 months central
counter-parties
1 2 3 4 5 6 7 8 9 10 11 12 13 14 15
2010 716.9 84.6 79.3 528.3 2.6 0.3 21.9 2,185.3 358.5 305.7 1,149.6 10.7 0.5 360.3 255.02011 704.0 92.1 79.9 512.4 4.0 0.2 15.5 2,220.7 390.0 284.9 1,190.7 14.7 0.5 339.9 260.0
2012 Q1 711.3 98.4 86.8 504.6 4.5 0.2 16.9 2,211.2 420.1 265.9 1,149.0 15.5 0.4 360.4 275.9 Q2 692.6 99.0 78.8 499.5 5.8 0.2 9.3 2,149.2 407.7 253.5 1,086.0 13.6 0.3 388.0 295.8
2012 May 709.3 103.6 86.5 501.7 5.4 0.2 11.9 2,185.3 414.5 264.9 1,112.0 14.3 0.3 379.3 289.6 June 692.6 99.0 78.8 499.5 5.8 0.2 9.3 2,149.2 407.7 253.5 1,086.0 13.6 0.3 388.0 295.8 July 701.0 106.2 81.4 497.5 6.1 0.2 9.7 2,101.4 419.0 245.2 1,033.7 12.2 0.2 391.1 295.6 Aug. (p) 694.7 99.6 82.3 496.3 6.2 0.2 10.1 2,072.9 416.0 234.4 1,032.9 12.7 0.3 376.7 287.0
Transactions
2010 -26.5 -3.3 -8.4 -23.2 0.2 6.6 1.6 157.9 45.1 -37.6 53.9 -8.0 0.4 104.2 - 2011 0.2 11.7 4.2 -14.2 1.1 -0.1 -2.6 13.9 28.9 -29.1 10.4 3.9 0.1 -0.3 5.5
2012 Q1 7.9 6.4 6.7 -7.1 0.5 0.0 1.4 -6.4 31.1 -18.1 -40.5 0.8 -0.2 20.6 15.5 Q2 -18.5 0.8 -7.5 -4.8 1.3 0.0 -8.3 -38.7 -13.2 -13.8 -54.0 -1.7 0.0 44.0 36.4
2012 May -9.4 -2.1 -1.4 -1.9 0.7 0.0 -4.7 -4.2 7.0 -6.3 -32.9 -0.9 -0.2 28.9 27.8 June -15.9 -4.6 -6.4 -2.1 0.4 0.0 -3.3 -20.0 -4.6 -11.2 -12.5 -0.6 0.0 8.9 6.4 July 8.2 7.1 2.5 -2.1 0.3 0.0 0.4 -52.9 10.1 -8.9 -55.4 -1.4 -0.1 2.8 -0.5 Aug. (p) -6.0 -6.4 1.0 -1.2 0.2 0.0 0.4 -26.1 -2.0 -12.0 -0.6 0.5 0.1 -12.1 -12.0
Growth rates
2010 -3.6 -3.4 -9.6 -4.2 9.7 - 7.8 8.2 14.4 -11.1 5.0 -48.5 - 41.1 - 2011 0.0 14.4 5.6 -2.7 43.3 - -13.1 0.7 8.1 -9.3 0.8 36.1 - -0.2 2.1
2012 Q1 1.3 17.9 14.8 -3.8 43.3 - 8.9 0.9 11.8 -13.2 -1.3 31.5 - 8.1 14.6 Q2 -1.0 16.5 9.5 -4.2 70.3 - -48.1 -2.5 8.8 -15.9 -5.9 10.1 - 7.3 7.4
2012 May 0.5 20.9 15.5 -4.1 35.0 - -30.7 -2.6 10.0 -17.4 -4.9 19.7 - 3.4 6.0 June -1.0 16.5 9.5 -4.2 70.3 - -48.1 -2.5 8.8 -15.9 -5.9 10.1 - 7.3 7.4 July -0.4 27.7 8.1 -4.5 56.0 - -52.8 -3.7 14.9 -19.8 -9.9 6.5 - 10.5 10.5 Aug. (p) -2.6 14.0 1.1 -4.7 61.4 - -48.5 -7.7 10.9 -24.9 -10.4 9.5 - -4.6 -5.0
C9 Total deposits by sector 2)
(annual growth rates)
C10 Total deposits and deposits included in M3
by sector 2) (annual growth rates)
-10
0
10
20
30
40
2000 2002 2004 2006 2008 2010-10
0
10
20
30
40
insurance corporations and pension funds (total)other financial intermediaries (total)
-20
-10
0
10
20
30
40
2004 2005 2006 2007 2008 2009 2010 2011 2012-20
-10
0
10
20
30
40
insurance corporations and pension funds (total)other financial intermediaries (total)insurance corporations and pension funds (included in M3)other financial intermediaries (included in M3)
Source: ECB.1) MFI sector excluding the Eurosystem; sectoral classification is based on the ESA 95.2) Data refer to the changing composition of the euro area. For further information, see the General Notes.3) Covers deposits in columns 2, 3, 5 and 7.4) Covers deposits in columns 9, 10, 12 and 14.
3)
4)

2.5 Deposits held with MFIs: breakdown 1), 2) (EUR billions and annual growth rates; outstanding amounts and growth rates at end of period; transactions during period)
S 18ECBMonthly BulletinOctober 2012
2. Deposits by non-financial corporations and households
Outstanding amounts
Non-financial corporations Households 3)
TotalOvernight With an agreed maturity of: Redeemable at notice of: Repos TotalOvernight With an agreed maturity of: Redeemable at notice of: Repos
Up to Over Up to Over Up to Over Up to Over2 years 2 years 3 months 3 months 2 years 2 years 3 months 3 months
1 2 3 4 5 6 7 8 9 10 11 12 13 14
2010 1,670.7 1,036.4 455.5 87.2 75.8 1.5 14.2 5,739.1 2,244.5 901.0 665.0 1,788.5 110.3 29.82011 1,685.9 1,044.1 453.5 97.7 72.3 2.0 16.3 5,894.0 2,255.7 948.3 723.7 1,837.0 106.7 22.7
2012 Q1 1,663.6 1,019.5 451.5 100.6 76.0 2.2 13.8 5,945.1 2,223.2 995.4 737.0 1,864.7 105.0 19.9 Q2 1,678.5 1,057.9 421.8 103.2 80.5 1.7 13.4 6,000.8 2,288.5 975.3 741.4 1,878.0 103.4 14.3
2012 May 1,661.3 1,031.9 430.8 102.3 79.5 1.7 15.2 5,961.7 2,244.3 983.6 740.9 1,872.4 104.3 16.2 June 1,678.5 1,057.9 421.8 103.2 80.5 1.7 13.4 6,000.8 2,288.5 975.3 741.4 1,878.0 103.4 14.3 July 1,672.3 1,052.7 420.1 104.7 79.9 1.5 13.3 6,000.1 2,280.2 975.9 742.3 1,885.1 102.6 14.1 Aug. (p) 1,689.1 1,080.0 407.8 105.0 81.8 1.6 12.8 6,005.8 2,282.3 973.0 743.6 1,892.5 101.2 13.3
Transactions
2010 78.1 40.3 23.2 9.0 7.8 -0.2 -2.1 132.9 81.7 -98.9 58.7 113.6 -14.6 -7.52011 2.6 3.6 -2.7 8.7 -7.3 0.4 -0.2 134.3 7.4 42.6 50.5 43.5 -2.6 -7.0
2012 Q1 -20.8 -23.1 -2.8 4.3 3.2 0.2 -2.4 52.4 -32.0 47.2 13.6 28.9 -2.6 -2.8 Q2 9.8 33.7 -30.4 3.2 4.3 -0.4 -0.5 52.2 63.1 -21.3 4.4 13.2 -1.6 -5.6
2012 May 7.5 16.1 -12.7 0.6 2.5 -0.1 1.0 -9.2 -3.3 -10.0 2.0 4.1 -0.7 -1.4 June 15.9 24.3 -8.6 1.0 1.0 0.0 -1.7 39.5 44.2 -8.1 0.5 5.6 -0.9 -1.8 July -4.8 -4.9 -2.2 3.2 -0.4 -0.2 -0.2 -1.7 -8.8 0.1 0.9 7.1 -0.8 -0.3 Aug. (p) 19.0 19.3 -2.2 0.4 1.9 0.0 -0.4 6.6 2.5 -2.5 1.2 7.4 -1.4 -0.8
Growth rates
2010 4.9 4.1 5.3 11.2 11.4 -10.1 -12.8 2.4 3.8 -9.9 9.7 6.8 -11.7 -20.22011 0.1 0.3 -0.6 9.9 -9.3 29.0 -3.4 2.3 0.3 4.7 7.5 2.4 -2.4 -23.6
2012 Q1 1.0 1.8 -1.8 12.0 -6.5 3.5 -2.2 2.9 0.0 9.6 7.3 2.8 -4.8 -36.4 Q2 0.8 3.9 -7.3 10.6 0.0 -18.4 -16.7 2.9 1.2 7.5 5.0 3.4 -5.4 -57.2
2012 May 0.1 2.9 -6.4 10.3 -1.9 -14.5 -27.1 2.7 0.4 8.2 5.9 3.0 -4.7 -52.9 June 0.8 3.9 -7.3 10.6 0.0 -18.4 -16.7 2.9 1.2 7.5 5.0 3.4 -5.4 -57.2 July 0.8 4.5 -8.6 13.3 0.5 -25.4 -30.0 2.4 0.6 6.4 4.6 3.6 -6.3 -60.1 Aug. (p) 1.9 7.2 -10.3 14.1 1.8 -12.6 -35.2 2.9 1.9 5.6 5.2 3.7 -7.5 -62.1
C11 Total deposits by sector 2)
(annual growth rates)
C12 Total deposits and deposits included in M3
by sector 2) (annual growth rates)
-2
0
2
4
6
8
10
12
14
2000 2002 2004 2006 2008 2010-2
0
2
4
6
8
10
12
14
non-financial corporations (total)households (total)
-5
0
5
10
15
20
2004 2005 2006 2007 2008 2009 2010 2011 2012-5
0
5
10
15
20
non-financial corporations (total)households (total)non-financial corporations (included in M3)households (included in M3)
Source: ECB.1) MFI sector excluding the Eurosystem; sectoral classification is based on the ESA 95.2) Data refer to the changing composition of the euro area. For further information, see the General Notes.3) Including non-profit institutions serving households.4) Covers deposits in columns 2, 3, 5 and 7.5) Covers deposits in columns 9, 10, 12 and 14.
4)
5)

EURO AREASTATISTICS
Money, bankingand other
financial corporations
2.5 Deposits held with MFIs: breakdown 1), 2) (EUR billions and annual growth rates; outstanding amounts and growth rates at end of period; transactions during period)
S 19ECB
Monthly BulletinOctober 2012
3. Deposits by government and non-euro area residents
Outstanding amounts
General government Non-euro area residents
Total Central Other general government Total Banks 3) Non-banks
governmentState Local Social Total General Other
government government security governmentfunds
1 2 3 4 5 6 7 8 9 10
2010 426.7 196.2 47.7 108.7 74.1 3,484.4 2,487.5 996.9 45.9 950.92011 441.8 195.5 48.6 112.6 85.2 3,153.0 2,175.4 977.5 44.3 933.2
2011 Q3 464.2 211.4 54.3 110.5 88.0 3,343.0 2,295.3 1,047.7 50.0 997.7 Q4 441.8 195.5 48.6 112.6 85.2 3,153.0 2,175.4 977.5 44.3 933.22012 Q1 466.7 192.5 65.0 113.4 95.9 3,312.0 2,331.9 980.1 54.7 925.4 Q2 (p) 508.2 191.9 98.4 112.2 105.4 3,239.7 2,293.2 945.9 39.6 906.3
Transactions
2010 50.0 47.4 4.3 -5.0 2.9 0.7 -83.9 84.7 7.5 77.12011 16.9 3.3 0.6 2.3 10.6 -334.0 -313.5 -20.5 -2.1 -18.4
2011 Q3 -56.7 -55.1 -1.0 -1.2 0.4 0.9 -45.0 45.9 1.4 44.5 Q4 -22.5 -15.9 -5.9 2.1 -2.7 -234.1 -151.5 -82.6 -6.2 -76.42012 Q1 25.9 -2.9 16.5 1.3 10.9 190.6 180.2 10.4 10.9 -0.6 Q2 (p) 26.0 1.8 18.8 -1.3 6.6 -135.8 -75.9 -60.4 -15.9 -44.6
Growth rates
2010 13.3 32.2 9.9 -4.4 4.1 0.3 -3.2 9.9 12.7 9.62011 3.9 1.3 1.3 2.1 14.3 -9.7 -12.8 -2.0 -4.3 -1.9
2011 Q3 10.6 21.6 -7.8 -1.9 17.3 -5.6 -10.5 7.0 3.3 7.2 Q4 3.9 1.3 1.3 2.1 14.3 -9.7 -12.8 -2.0 -4.3 -1.92012 Q1 -1.6 -18.3 23.5 5.6 21.2 -1.9 -2.6 -0.4 29.6 -1.7 Q2 (p) -5.3 -27.0 51.4 0.8 17.4 -5.3 -4.1 -8.6 -20.3 -8.0
C13 Deposits by government and non-euro area residents 2)
(annual growth rates)
-20
-15
-10
-5
0
5
10
15
20
25
30
1999 2000 2001 2002 2003 2004 2005 2006 2007 2008 2009 2010 2011-20
-15
-10
-5
0
5
10
15
20
25
30
general governmentnon-resident banksnon-resident non-banks
Source: ECB.1) MFI sector excluding the Eurosystem; sectoral classification is based on the ESA 95.2) Data refer to the changing composition of the euro area. For further information, see the General Notes.3) The term ‘‘banks’’ is used in this table to indicate institutions similar to MFIs which are resident outside the euro area.

2.6 MFI holdings of securities: breakdown 1), 2) (EUR billions and annual growth rates; outstanding amounts and growth rates at end of period; transactions during period)
S 20ECBMonthly BulletinOctober 2012
Outstanding amounts
Securities other than shares Shares and other equity
Total MFIs General Other euro Non-euro area Total MFIs Non-MFIs Non-euro area
government area residents residents residents
Euro Non-euro Euro Non-euro Euro Non-euro
1 2 3 4 5 6 7 8 9 10 11 12
2010 6,001.0 1,779.0 107.4 1,507.8 16.4 1,510.0 28.3 1,052.1 1,535.8 445.1 788.0 302.72011 5,697.7 1,763.9 87.8 1,373.0 22.9 1,489.4 28.3 932.5 1,507.2 485.4 726.4 295.4
2012 Q1 5,919.6 1,821.1 98.0 1,496.1 32.1 1,492.2 24.9 955.1 1,527.3 490.1 742.2 295.0 Q2 5,826.4 1,766.6 98.5 1,554.6 33.9 1,428.0 25.5 919.1 1,489.3 486.3 717.7 285.4
2012 May 5,900.1 1,786.6 102.1 1,512.5 34.7 1,485.4 24.7 954.1 1,516.5 488.0 737.4 291.1 June 5,826.4 1,766.6 98.5 1,554.6 33.9 1,428.0 25.5 919.1 1,489.3 486.3 717.7 285.4 July 5,789.6 1,790.7 100.8 1,538.5 36.3 1,380.8 25.6 917.0 1,498.9 488.1 721.8 289.0 Aug. (p) 5,785.3 1,807.3 107.1 1,542.6 32.6 1,364.9 25.2 905.7 1,502.4 487.4 723.7 291.3
Transactions
2010 -268.6 -166.5 -6.8 42.8 -2.0 11.6 -14.8 -132.9 54.2 28.0 5.2 20.92011 -32.7 44.4 7.8 -5.2 5.5 -24.7 -0.1 -60.5 16.5 60.0 -31.8 -11.7
2012 Q1 253.2 60.0 13.0 135.4 10.7 5.6 -1.8 30.3 31.4 12.4 19.2 -0.2 Q2 -95.8 -50.8 -3.7 46.0 -0.2 -41.7 -0.5 -44.9 -19.4 0.6 -12.1 -7.9
2012 May 10.3 -11.3 -0.4 27.1 -0.5 -0.5 -0.2 -3.8 -9.1 1.7 -10.0 -0.8 June -51.6 -15.7 -2.4 16.9 -0.2 -37.0 1.1 -14.1 -30.6 -1.7 -22.8 -6.1 July -66.4 22.1 -0.1 -19.4 1.5 -54.0 -0.5 -15.9 10.1 1.6 5.4 3.0 Aug. (p) -7.2 12.2 7.3 -5.8 -2.9 -15.7 0.1 -2.5 1.8 -1.0 0.1 2.6
Growth rates
2010 -4.3 -8.5 -5.4 2.9 -11.1 0.8 -35.4 -11.2 3.6 6.4 0.6 7.52011 -0.6 2.6 7.7 -0.4 33.7 -1.6 -0.8 -6.2 1.1 13.7 -4.2 -3.8
2012 Q1 4.4 7.6 22.9 8.8 56.4 1.1 -14.3 -4.4 3.1 16.4 -2.5 -1.8 Q2 3.3 6.8 12.0 8.6 47.6 -0.5 -4.7 -6.4 -0.7 7.5 -3.4 -6.3
2012 May 3.3 6.3 5.5 9.7 60.4 0.5 -10.2 -7.6 -0.5 8.9 -3.9 -6.2 June 3.3 6.8 12.0 8.6 47.6 -0.5 -4.7 -6.4 -0.7 7.5 -3.4 -6.3 July 2.7 8.9 12.5 8.3 59.4 -4.6 -4.3 -6.8 -0.3 6.4 -2.4 -5.6 Aug. (p) 2.8 7.4 25.4 9.4 25.3 -5.2 -13.7 -5.0 0.9 5.8 -1.2 -1.8
C14 MFI holdings of securities 2)
(annual growth rates)
-10
-5
0
5
10
15
20
25
30
1999 2000 2001 2002 2003 2004 2005 2006 2007 2008 2009 2010 2011 2012-10
-5
0
5
10
15
20
25
30
securities other than sharesshares and other equity
Source: ECB.1) MFI sector excluding the Eurosystem; sectoral classification is based on the ESA 95.2) Data refer to the changing composition of the euro area. For further information, see the General Notes.
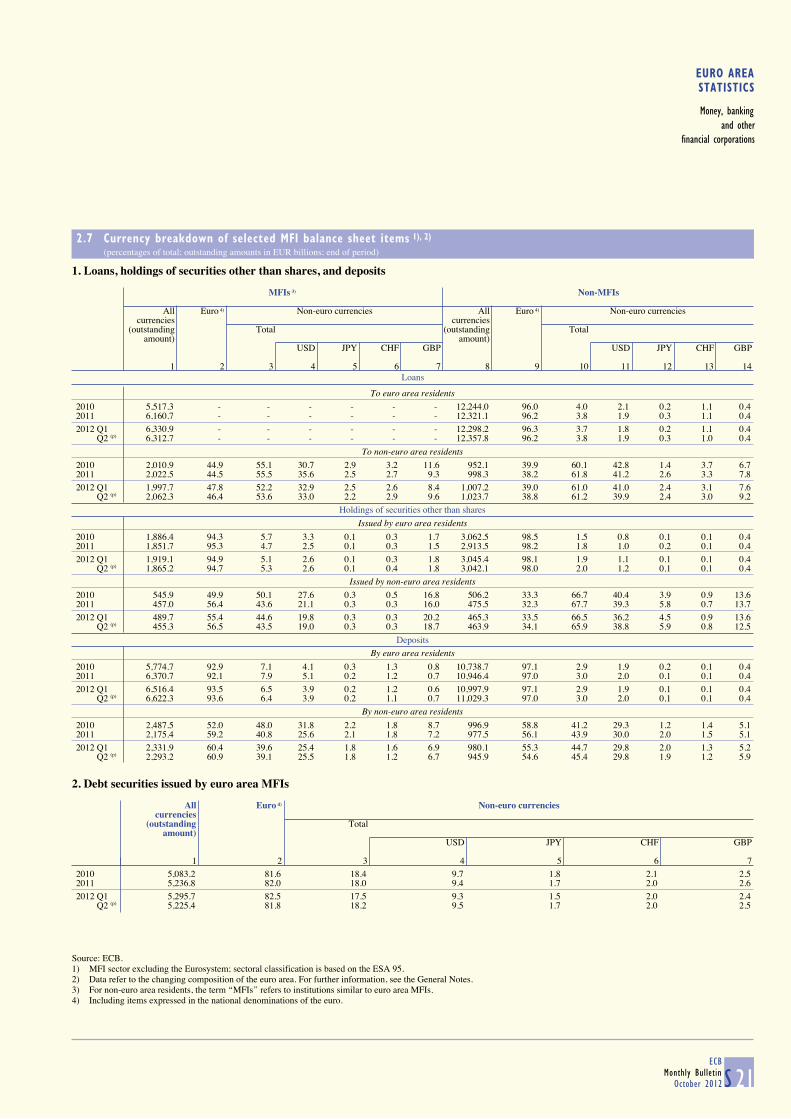
EURO AREASTATISTICS
Money, bankingand other
financial corporations
2.7 Currency breakdown of selected MFI balance sheet items 1), 2) (percentages of total; outstanding amounts in EUR billions; end of period)
S 21ECB
Monthly BulletinOctober 2012
1. Loans, holdings of securities other than shares, and deposits
Loans
MFIs 3) Non-MFIs
All Euro 4) Non-euro currencies All Euro 4) Non-euro currencies
currencies currencies (outstanding Total (outstanding Total
amount) amount)USD JPY CHF GBP USD JPY CHF GBP
1 2 3 4 5 6 7 8 9 10 11 12 13 14
To euro area residents
2010 5,517.3 - - - - - - 12,244.0 96.0 4.0 2.1 0.2 1.1 0.42011 6,160.7 - - - - - - 12,321.1 96.2 3.8 1.9 0.3 1.1 0.4
2012 Q1 6,330.9 - - - - - - 12,298.2 96.3 3.7 1.8 0.2 1.1 0.4 Q2 (p) 6,312.7 - - - - - - 12,357.8 96.2 3.8 1.9 0.3 1.0 0.4
To non-euro area residents
2010 2,010.9 44.9 55.1 30.7 2.9 3.2 11.6 952.1 39.9 60.1 42.8 1.4 3.7 6.72011 2,022.5 44.5 55.5 35.6 2.5 2.7 9.3 998.3 38.2 61.8 41.2 2.6 3.3 7.8
2012 Q1 1,997.7 47.8 52.2 32.9 2.5 2.6 8.4 1,007.2 39.0 61.0 41.0 2.4 3.1 7.6 Q2 (p) 2,062.3 46.4 53.6 33.0 2.2 2.9 9.6 1,023.7 38.8 61.2 39.9 2.4 3.0 9.2
Holdings of securities other than shares
Issued by euro area residents
2010 1,886.4 94.3 5.7 3.3 0.1 0.3 1.7 3,062.5 98.5 1.5 0.8 0.1 0.1 0.42011 1,851.7 95.3 4.7 2.5 0.1 0.3 1.5 2,913.5 98.2 1.8 1.0 0.2 0.1 0.4
2012 Q1 1,919.1 94.9 5.1 2.6 0.1 0.3 1.8 3,045.4 98.1 1.9 1.1 0.1 0.1 0.4 Q2 (p) 1,865.2 94.7 5.3 2.6 0.1 0.4 1.8 3,042.1 98.0 2.0 1.2 0.1 0.1 0.4
Issued by non-euro area residents
2010 545.9 49.9 50.1 27.6 0.3 0.5 16.8 506.2 33.3 66.7 40.4 3.9 0.9 13.62011 457.0 56.4 43.6 21.1 0.3 0.3 16.0 475.5 32.3 67.7 39.3 5.8 0.7 13.7
2012 Q1 489.7 55.4 44.6 19.8 0.3 0.3 20.2 465.3 33.5 66.5 36.2 4.5 0.9 13.6 Q2 (p) 455.3 56.5 43.5 19.0 0.3 0.3 18.7 463.9 34.1 65.9 38.8 5.9 0.8 12.5
Deposits
By euro area residents
2010 5,774.7 92.9 7.1 4.1 0.3 1.3 0.8 10,738.7 97.1 2.9 1.9 0.2 0.1 0.42011 6,370.7 92.1 7.9 5.1 0.2 1.2 0.7 10,946.4 97.0 3.0 2.0 0.1 0.1 0.4
2012 Q1 6,516.4 93.5 6.5 3.9 0.2 1.2 0.6 10,997.9 97.1 2.9 1.9 0.1 0.1 0.4 Q2 (p) 6,622.3 93.6 6.4 3.9 0.2 1.1 0.7 11,029.3 97.0 3.0 2.0 0.1 0.1 0.4
By non-euro area residents
2010 2,487.5 52.0 48.0 31.8 2.2 1.8 8.7 996.9 58.8 41.2 29.3 1.2 1.4 5.12011 2,175.4 59.2 40.8 25.6 2.1 1.8 7.2 977.5 56.1 43.9 30.0 2.0 1.5 5.1
2012 Q1 2,331.9 60.4 39.6 25.4 1.8 1.6 6.9 980.1 55.3 44.7 29.8 2.0 1.3 5.2 Q2 (p) 2,293.2 60.9 39.1 25.5 1.8 1.2 6.7 945.9 54.6 45.4 29.8 1.9 1.2 5.9
2. Debt securities issued by euro area MFIs
All Euro 4) Non-euro currencies
currencies (outstanding Total
amount)USD JPY CHF GBP
1 2 3 4 5 6 7
2010 5,083.2 81.6 18.4 9.7 1.8 2.1 2.52011 5,236.8 82.0 18.0 9.4 1.7 2.0 2.6
2012 Q1 5,295.7 82.5 17.5 9.3 1.5 2.0 2.4 Q2 (p) 5,225.4 81.8 18.2 9.5 1.7 2.0 2.5
Source: ECB.1) MFI sector excluding the Eurosystem; sectoral classification is based on the ESA 95.2) Data refer to the changing composition of the euro area. For further information, see the General Notes.3) For non-euro area residents, the term ‘‘MFIs’’ refers to institutions similar to euro area MFIs.4) Including items expressed in the national denominations of the euro.

2.8 Aggregated balance sheet of euro area investment funds 1) (EUR billions; outstanding amounts at end of period; transactions during period)
S 22ECBMonthly BulletinOctober 2012
1. Assets
Outstanding amounts
Total Deposits and Securities other Shares and other Investment fund/ Non-financial Other assetsloan claims than shares equity (excl. money market fund assets (incl. financial
investment fund/ shares derivatives)money market fund
shares)1 2 3 4 5 6 7
2012 Jan. 6,486.9 436.1 2,581.8 1,823.6 865.9 240.0 539.5 Feb. 6,645.5 445.6 2,636.0 1,882.7 885.3 240.2 555.6 Mar. 6,679.8 442.3 2,674.2 1,886.9 889.2 241.2 546.0 Apr. 6,679.3 447.8 2,694.2 1,860.7 886.8 242.1 547.6 May 6,674.6 474.5 2,732.3 1,774.4 879.4 242.7 571.3 June 6,729.6 490.8 2,732.2 1,815.5 876.5 242.8 571.9 July (p) 6,960.8 494.5 2,820.8 1,882.5 912.9 244.4 605.6
Transactions
2011 Q4 -179.8 -34.5 -1.0 -24.4 -11.1 1.7 -110.62012 Q1 151.1 17.0 73.0 4.6 11.5 4.4 40.6 Q2 40.3 22.2 29.6 -11.0 -5.9 1.8 3.7
2. Liabilities
Outstanding amounts
Total Loans and Investment fund shares issued Other
deposits liabilitiesreceived Total Held by euro area residents Held by (incl. financial
non-euro area derivatives)Investment residents
funds1 2 3 4 5 6 7
2012 Jan. 6,486.9 124.9 5,880.3 4,424.5 650.9 1,455.8 481.8 Feb. 6,645.5 134.1 6,016.6 4,533.6 677.2 1,482.9 494.8 Mar. 6,679.8 127.3 6,066.5 4,562.0 684.1 1,504.5 486.0 Apr. 6,679.3 129.6 6,062.6 4,544.4 678.2 1,518.1 487.2 May 6,674.6 137.6 6,021.5 4,470.6 665.7 1,550.9 515.5 June 6,729.6 142.1 6,065.1 4,492.9 663.3 1,572.2 522.4 July (p) 6,960.8 143.4 6,266.6 4,623.2 698.3 1,643.4 550.8
Transactions
2011 Q4 -179.8 -13.7 -37.2 -60.7 -2.9 23.4 -128.92012 Q1 151.1 9.4 94.8 60.6 30.9 34.2 46.8 Q2 40.3 15.7 33.9 -0.6 -10.1 34.7 -9.3
3. Investment fund shares issued broken down by investment policy and type of fund
Outstanding amounts
Total Funds by investment policy Funds by type Memo item:
Money marketBond Equity Mixed Real estate Hedge Other Open-end Closed-end fundsfunds funds funds funds funds funds funds funds
1 2 3 4 5 6 7 8 9 10
2011 Dec. 5,665.8 1,924.9 1,500.1 1,429.0 298.5 128.6 384.6 5,580.7 85.1 991.9
2012 Jan. 5,880.3 2,019.4 1,582.8 1,455.9 302.9 128.6 390.6 5,791.6 88.6 949.8 Feb. 6,016.6 2,056.8 1,637.5 1,488.4 304.7 128.3 400.8 5,930.9 85.7 935.4 Mar. 6,066.5 2,087.5 1,640.5 1,498.9 307.5 132.4 399.7 5,980.6 85.9 956.8 Apr. 6,062.6 2,108.8 1,616.3 1,496.0 309.6 133.8 398.0 5,976.3 86.3 972.3 May 6,021.5 2,157.9 1,539.9 1,480.3 311.2 136.3 396.0 5,935.0 86.5 999.9 June 6,065.1 2,172.5 1,568.8 1,478.5 311.3 136.2 397.7 5,984.3 80.9 969.5 July (p) 6,266.6 2,251.0 1,627.4 1,529.3 314.5 138.8 405.5 6,185.3 81.3 964.5
Transactions
2012 Jan. 20.6 15.7 4.2 -1.2 3.1 -0.3 -0.8 16.1 4.5 6.1 Feb. 32.7 13.4 2.2 12.2 0.9 -0.8 4.9 35.0 -2.3 2.8 Mar. 41.6 29.3 5.7 5.0 1.7 0.9 -1.0 40.8 0.7 18.5 Apr. 8.3 14.2 -8.8 0.6 1.3 0.4 0.5 8.5 -0.2 9.3 May 15.3 24.5 -5.3 -4.0 0.1 -1.0 1.1 15.5 -0.2 12.0 June 10.3 15.2 -0.6 -5.1 1.1 0.0 -0.4 14.6 -4.3 -25.7 July (p) 33.3 25.1 -4.9 15.0 -0.5 -0.5 -0.9 33.2 0.1 -14.9
Source: ECB.1) Other than money market funds (which are shown as a memo item in column 10 in Table 3 of this section). For further details, see the General Notes.

EURO AREASTATISTICS
Money, bankingand other
financial corporations
2.9 Securities held by investment funds 1) broken down by issuer of securities (EUR billions; outstanding amounts at end of period; transactions during period)
S 23ECB
Monthly BulletinOctober 2012
1. Securities other than shares
Outstanding amounts
Total Euro area Rest of the world
Total MFIs General Other Insurance Non-financial EU United Japangovernment financial corporations corporations Member States States
intermediaries and pension outside thefunds euro area
1 2 3 4 5 6 7 8 9 10 11
2011 Q3 2,380.3 1,413.4 380.6 680.9 184.0 4.8 163.0 967.0 252.1 368.3 19.0 Q4 2,505.2 1,424.4 390.5 675.2 186.2 4.5 167.8 1,080.8 271.3 436.0 20.52012 Q1 2,674.2 1,502.9 424.6 678.9 209.0 5.7 184.5 1,171.3 313.1 453.4 15.5 Q2 (p) 2,732.2 1,507.6 415.4 694.2 207.9 5.1 184.9 1,224.6 315.2 469.5 18.0
Transactions
2011 Q4 -1.0 1.3 3.1 -5.4 -0.9 -0.3 4.7 -0.9 -2.5 1.7 -0.22012 Q1 73.0 13.7 10.4 -21.1 14.8 0.5 9.1 59.2 20.5 15.6 -4.3 Q2 (p) 29.6 9.3 -9.1 15.9 0.3 -0.5 2.7 20.3 -5.9 -11.3 1.1
2. Shares and other equity (other than investment fund and money market fund shares)
Outstanding amounts
Total Euro area Rest of the world
Total MFIs General Other Insurance Non-financial EU United Japangovernment financial corporations corporations Member States States
intermediaries and pension outside thefunds euro area
1 2 3 4 5 6 7 8 9 10 11
2011 Q3 1,636.1 620.9 53.8 - 37.7 20.4 508.9 1,015.2 141.5 322.8 71.9 Q4 1,734.6 636.3 47.6 - 39.0 21.4 528.3 1,098.2 154.5 358.1 71.82012 Q1 1,886.9 689.1 56.4 - 41.7 24.1 566.7 1,197.8 162.5 389.7 75.3 Q2 (p) 1,815.5 637.7 45.4 - 38.7 21.9 531.7 1,177.7 162.8 392.1 78.3
Transactions
2011 Q4 -24.4 -8.7 -1.7 - -1.9 0.4 -5.6 -15.6 -1.0 -6.6 1.12012 Q1 4.6 -3.8 4.1 - 0.8 -1.2 -7.7 8.4 -2.3 -0.1 -1.6 Q2 (p) -11.0 -8.5 -3.0 - -0.7 -0.2 -4.6 -2.1 1.6 -0.7 3.7
3. Investment fund/money market fund shares
Outstanding amounts
Total Euro area Rest of the world
Total MFIs 2) General Other Insurance Non-financial EU United Japangovernment financial corporations corporations Member States States
intermediaries 2) and pension outside thefunds euro area
1 2 3 4 5 6 7 8 9 10 11
2011 Q3 830.0 694.5 94.4 - 600.1 - - 135.5 20.2 43.2 0.6 Q4 839.4 708.0 94.7 - 613.4 - - 131.4 20.9 40.5 0.62012 Q1 889.2 753.1 69.0 - 684.1 - - 136.1 25.2 41.2 0.6 Q2 (p) 876.5 741.1 77.8 - 663.3 - - 135.4 25.0 42.7 0.6
Transactions
2011 Q4 -11.1 -2.9 0.0 - -2.9 - - -8.2 -0.8 -9.0 0.02012 Q1 11.5 11.5 -19.4 - 30.9 - - 0.0 2.2 -0.6 -0.1 Q2 (p) -5.9 -2.8 7.3 - -10.1 - - -3.2 -0.1 0.4 0.0
Source: ECB.1) Other than money market funds. For further details, see the General Notes.2) Investment fund shares (other than money market fund shares) are issued by other financial intermediaries. Money market fund shares are issued by MFIs.

2.10 Aggregated balance sheet of euro area financial vehicle corporations (EUR billions; outstanding amounts at end of period; transactions during period)
S 24ECBMonthly BulletinOctober 2012
1. Assets
Outstanding amounts
Total Deposits Securitised loans Securities Other Shares Other
and loan other than securitised and other assetsclaims Total Originated in euro area Originated shares assets equity
outside MFIs Other financial in- Non- General euro area
termediaries, insur- financial governmentRemaining ance corporations corporationson the MFI and pension funds
balance sheet 1)
1 2 3 4 5 6 7 8 9 10 11 12 13
2011 Q2 2,216.1 340.0 1,461.2 1,167.2 585.5 144.1 20.4 5.2 124.4 232.6 88.6 35.7 58.0 Q3 2,204.5 324.8 1,464.5 1,154.9 590.5 144.9 21.6 5.1 138.0 228.5 86.9 37.8 62.0 Q4 2,276.9 327.4 1,531.6 1,219.2 583.1 149.8 21.9 4.8 135.9 226.9 90.1 36.8 64.12012 Q1 2,224.1 320.7 1,500.9 1,198.3 553.7 144.3 21.7 4.8 131.9 214.4 87.0 35.6 65.4 Q2 2,146.4 305.6 1,454.0 1,148.0 515.2 148.9 21.2 4.4 131.6 213.1 83.2 30.2 60.2
Transactions
2011 Q2 -43.7 -11.1 -25.7 -20.9 - 1.5 -0.7 -0.3 -5.2 -7.9 0.0 0.0 1.1 Q3 -32.5 -15.9 0.2 10.9 - -2.1 0.0 0.0 -8.5 -5.5 -2.1 -1.1 -8.1 Q4 67.5 2.7 63.6 63.1 - 4.2 0.3 -0.4 -3.6 -1.3 2.3 -1.0 1.12012 Q1 -54.1 -6.4 -28.8 -19.5 - -5.4 -0.1 0.0 -3.8 -12.9 -1.9 -0.9 -3.2 Q2 -82.8 -14.8 -48.2 -50.5 - 5.1 -0.7 -0.4 -1.8 -2.0 -2.8 -5.3 -9.7
2. Liabilities
Outstanding amounts
Total Loans and deposits Debt securities issued Capital and reserves Other liabilities
receivedTotal Up to 2 years Over 2 years
1 2 3 4 5 6 7
2011 Q2 2,216.1 135.9 1,840.1 66.4 1,773.7 35.2 204.9 Q3 2,204.5 134.8 1,819.2 64.5 1,754.7 34.8 215.7 Q4 2,276.9 152.4 1,879.6 67.3 1,812.3 33.6 211.32012 Q1 2,224.1 152.6 1,821.9 60.3 1,761.6 32.7 216.8 Q2 2,146.4 146.9 1,752.3 58.1 1,694.1 27.6 219.7
Transactions
2011 Q2 -43.7 1.4 -47.7 -7.5 -40.2 -0.8 3.4 Q3 -32.5 -2.2 -25.5 -3.0 -22.6 -2.4 -2.3 Q4 67.5 17.4 61.7 2.8 58.9 -1.5 -10.12012 Q1 -54.1 1.1 -56.3 -8.2 -48.1 -0.9 1.9 Q2 -82.8 -5.4 -72.4 -1.9 -70.5 -5.3 0.3
3. Holdings of securitised loans originated by euro area MFIs and securities other than shares
Outstanding amounts
Securitised loans originated by euro area MFIs Securities other than shares
Total Euro area borrowing sector 2) Non-euro Total Euro area residents Non-euro
area areaHouseholds Non- Other Insurance General borrowing Total MFIs Non-MFIs residents
financial financial corporations government sectorcorporations intermediaries and pension Financial
funds vehiclecorporations
1 2 3 4 5 6 7 8 9 10 11 12 13
2011 Q2 1,167.2 820.4 254.9 19.3 0.4 9.8 42.3 232.6 124.2 41.0 83.2 35.4 108.4 Q3 1,154.9 836.8 234.5 18.4 0.3 9.5 36.5 228.5 121.7 42.2 79.5 33.0 106.8 Q4 1,219.2 902.6 242.9 17.6 0.2 6.6 32.5 226.9 119.7 41.0 78.7 32.5 107.22012 Q1 1,198.3 891.5 234.5 17.6 0.2 6.4 32.4 214.4 114.2 40.3 73.9 31.8 100.2 Q2 1,148.0 844.4 233.9 18.1 0.2 6.3 31.5 213.1 113.9 41.5 72.4 30.5 99.2
Transactions
2011 Q2 -20.9 -21.3 0.8 0.8 0.2 2.6 -1.8 -7.9 0.4 -0.4 0.7 -0.7 -8.3 Q3 10.9 11.8 -0.2 -0.7 0.0 -0.2 1.4 -5.5 -3.1 -0.1 -3.0 -1.3 -2.3 Q4 63.1 65.9 7.5 -0.7 -0.1 -3.0 -4.4 -1.3 -1.7 -1.6 -0.2 -0.2 0.42012 Q1 -19.5 -11.2 -7.2 0.1 0.0 -0.2 0.2 -12.9 -5.5 -0.7 -4.8 -0.6 -7.4 Q2 -50.5 -48.7 -0.5 0.5 0.0 -0.1 0.5 -2.0 -0.5 0.7 -1.1 -1.4 -1.6
Source: ECB.1) Loans securitised using euro area financial vehicle corporations which remain on the balance sheet of the relevant MFI - i.e. which have not been derecognised. Whether or notloans are derecognised from the balance sheet of the MFI depends on the relevant accounting rules. For further information, see the General Notes.2) Excludes securitisations of inter-MFI loans.

EURO AREASTATISTICS
Money, bankingand other
financial corporations
2.11 Aggregated balance sheet of euro area insurance corporations and pension funds (EUR billions; outstanding amounts at end of period)
S 25ECB
Monthly BulletinOctober 2012
1. Assets
Total Currency Loans Securities Shares and Investment Money market Prepayments of Other Non-financialand other than other equity fund shares fund shares insurance accounts assets
deposits shares premiums and receivable/reserves for payable andoutstanding financial
claims derivatives
1 2 3 4 5 6 7 8 9 10
2009 Q3 6,506.0 782.0 431.7 2,425.8 790.2 1,364.9 94.0 246.9 221.7 148.9 Q4 6,638.4 785.8 431.5 2,468.5 805.0 1,446.1 92.6 251.5 209.2 148.0
2010 Q1 6,866.2 782.4 437.7 2,592.1 810.5 1,521.5 91.6 259.7 227.3 143.4 Q2 6,884.4 783.6 441.2 2,621.9 787.6 1,508.5 88.2 265.2 242.9 145.2 Q3 7,057.6 782.1 449.6 2,710.8 803.9 1,548.7 84.5 267.1 265.9 145.1 Q4 6,991.5 770.7 453.7 2,650.1 831.5 1,580.9 72.0 267.2 218.2 147.0
2011 Q1 7,083.5 771.6 454.4 2,705.3 841.2 1,594.0 72.5 274.5 220.8 149.2 Q2 7,097.0 774.6 461.7 2,716.6 839.8 1,594.5 78.2 265.5 218.1 148.0 Q3 7,098.8 791.5 458.3 2,745.8 792.2 1,543.0 89.6 265.1 265.5 147.8 Q4 7,087.7 784.5 466.7 2,692.9 801.3 1,570.9 94.4 260.6 266.7 149.7
2012 Q1 7,344.4 794.1 467.1 2,807.2 811.9 1,679.2 97.2 264.4 272.1 151.1 Q2 7,399.4 780.9 467.9 2,847.2 804.2 1,680.0 102.0 268.0 296.4 152.8
2. Holdings of securities other than shares
Total Issued by euro area residents Issued by non-euro
area residentsTotal MFIs General Other financial Insurance Non-financial
government intermediaries corporations and corporationspension funds
1 2 3 4 5 6 7 8
2009 Q3 2,425.8 2,022.0 550.0 1,091.5 228.2 15.2 137.2 403.8 Q4 2,468.5 2,059.6 542.4 1,122.0 239.0 16.7 139.4 408.9
2010 Q1 2,592.1 2,170.7 575.7 1,198.5 233.7 15.8 146.9 421.4 Q2 2,621.9 2,196.4 579.4 1,207.5 242.7 15.9 150.9 425.5 Q3 2,710.8 2,278.3 593.4 1,261.1 251.8 18.4 153.5 432.5 Q4 2,650.1 2,221.7 588.9 1,229.8 230.3 17.1 155.6 428.4
2011 Q1 2,705.3 2,282.5 610.4 1,267.4 233.9 16.9 154.0 422.7 Q2 2,716.6 2,293.0 614.9 1,270.3 233.7 16.5 157.6 423.6 Q3 2,745.8 2,313.6 626.8 1,282.2 226.6 16.6 161.4 432.2 Q4 2,692.9 2,258.7 621.5 1,231.8 223.7 16.2 165.5 434.2
2012 Q1 2,807.2 2,346.6 645.6 1,271.4 233.4 16.7 179.4 460.6 Q2 2,847.2 2,365.1 643.7 1,269.0 233.1 16.6 202.8 482.1
3. Liabilities and net worth
Liabilities Net worth
Total Loans Securities Shares and Insurance technical reserves Otherreceived other other equity accounts
than shares Net equity of Net equity of Prepayments of receivable/Total households households insurance payable and
in life in pension premiums and financialinsurance fund reserves for derivatives
reserves reserves outstanding claims
1 2 3 4 5 6 7 8 9 10
2009 Q3 6,338.8 250.8 36.1 442.1 5,413.9 2,967.4 1,646.3 800.2 195.9 167.2 Q4 6,439.9 233.1 39.4 438.8 5,530.8 3,034.2 1,695.1 801.4 197.8 198.5
2010 Q1 6,633.8 249.8 39.5 456.8 5,697.5 3,121.6 1,751.3 824.6 190.2 232.5 Q2 6,711.7 252.0 40.8 428.6 5,796.3 3,150.7 1,820.6 825.0 193.9 172.7 Q3 6,869.2 276.8 39.7 437.5 5,934.9 3,214.4 1,900.3 820.2 180.3 188.4 Q4 6,823.3 252.4 42.5 445.1 5,914.9 3,252.4 1,843.2 819.3 168.4 168.2
2011 Q1 6,880.6 264.8 40.5 462.2 5,937.8 3,282.4 1,820.2 835.2 175.2 202.8 Q2 6,902.5 265.0 43.5 451.2 5,967.0 3,299.4 1,839.2 828.4 175.8 194.5 Q3 7,013.6 272.6 42.5 406.4 6,102.8 3,283.7 1,991.6 827.4 189.4 85.2 Q4 7,023.5 265.7 42.2 406.6 6,123.9 3,287.5 2,013.4 823.0 185.1 64.2
2012 Q1 7,186.5 274.4 44.5 437.9 6,241.3 3,334.8 2,061.4 845.1 188.4 157.9 Q2 7,254.4 282.4 43.7 423.5 6,300.7 3,364.5 2,088.8 847.4 204.1 145.1
Source: ECB.

3 EURO AREA ACCOUNTS
3.1 Integrated economic and financial accounts by institutional sector (EUR billions)
S 26ECBMonthly BulletinOctober 2012
Uses Euro Households Non-financial Financial General Rest ofarea corporations corporations government the world
2012 Q1
External account
Exports of goods and services 595 Trade balance 1) -17
Generation of income account
Gross value added (basic prices) Taxes less subsidies on products Gross domestic product (market prices) Compensation of employees 1,104 115 693 56 240 Other taxes less subsidies on production 16 4 5 3 4 Consumption of fixed capital 367 97 209 11 50 Net operating surplus and mixed income 1) 580 273 266 40 2
Allocation of primary income account
Net operating surplus and mixed income Compensation of employees 6 Taxes less subsidies on production Property income 692 38 269 312 73 115 Interest 395 36 68 218 73 53 Other property income 297 2 201 93 0 61 Net national income 1) 1,951 1,591 103 48 209
Secondary distribution of income account
Net national income Current taxes on income, wealth, etc. 253 212 32 8 0 1 Social contributions 426 426 1 Social benefits other than social transfers in kind 458 1 18 35 405 1 Other current transfers 203 69 25 48 62 8 Net non-life insurance premiums 46 33 11 1 1 2 Non-life insurance claims 46 46 1 Other 112 36 14 1 61 6 Net disposable income 1) 1,913 1,428 59 55 371
Use of income account
Net disposable income Final consumption expenditure 1,846 1,359 487 Individual consumption expenditure 1,666 1,359 307 Collective consumption expenditure 180 180 Adjustment for the change in the net equity of households in pension fund reserves 15 0 0 15 0 0 Net saving/current external account 1) 67 83 59 40 -116 15
Capital account
Net saving/current external account Gross capital formation 448 138 254 12 45 Gross fixed capital formation 433 135 242 11 45 Changes in inventories and acquisitions less disposals of valuables 15 3 13 0 0 Consumption of fixed capital Acquisitions less disposals of non-produced non-financial assets 1 -1 4 0 -2 -1 Capital transfers 26 6 -1 2 19 4 Capital taxes 5 5 0 0 0 Other capital transfers 20 1 -1 2 19 4 Net lending (+)/net borrowing (-) (from capital account) 1) -13 48 22 39 -122 13 Statistical discrepancy 0 10 -10 0 0 0
Sources: ECB and Eurostat.1) For details of the calculation of the balancing items, see the Technical Notes.
3

EURO AREASTATISTICS
Euro areaaccounts
3.1 Integrated economic and financial accounts by institutional sector (cont'd) (EUR billions)
S 27ECB
Monthly BulletinOctober 2012
Resources Euro Households Non-financial Financial General Rest ofarea corporations corporations government the world
2012 Q1
External account
Imports of goods and services 577 Trade balance
Generation of income account
Gross value added (basic prices) 2,067 489 1,172 110 295 Taxes less subsidies on products 245 Gross domestic product (market prices)2) 2,312 Compensation of employees Other taxes less subsidies on production Consumption of fixed capital Net operating surplus and mixed income
Allocation of primary income account
Net operating surplus and mixed income 580 273 266 40 2 Compensation of employees 1,108 1,108 2 Taxes less subsidies on production 259 259 2 Property income 696 248 106 320 21 110 Interest 383 63 42 270 8 65 Other property income 313 185 65 50 13 45 Net national income
Secondary distribution of income account
Net national income 1,951 1,591 103 48 209 Current taxes on income, wealth, etc. 254 254 0 Social contributions 425 1 18 50 356 1 Social benefits other than social transfers in kind 457 457 2 Other current transfers 166 87 14 47 19 45 Net non-life insurance premiums 46 46 2 Non-life insurance claims 45 35 8 1 0 2 Other 75 51 5 0 18 42 Net disposable income
Use of income account
Net disposable income 1,913 1,428 59 55 371 Final consumption expenditure Individual consumption expenditure Collective consumption expenditure Adjustment for the change in the net equity of households in pension fund reserves 15 15 0 Net saving/current external account
Capital account
Net saving/current external account 67 83 59 40 -116 15 Gross capital formation Gross fixed capital formation Changes in inventories and acquisitions less disposals of valuables Consumption of fixed capital 367 97 209 11 50 Acquisitions less disposals of non-produced non-financial assets Capital transfers 28 10 12 1 5 2 Capital taxes 5 5 0 Other capital transfers 23 10 12 1 0 2 Net lending (+)/net borrowing (-) (from capital account) Statistical discrepancy
Sources: ECB and Eurostat.2) Gross domestic product is equal to the gross value added of all domestic sectors plus net taxes (i.e. taxes less subsidies) on products.
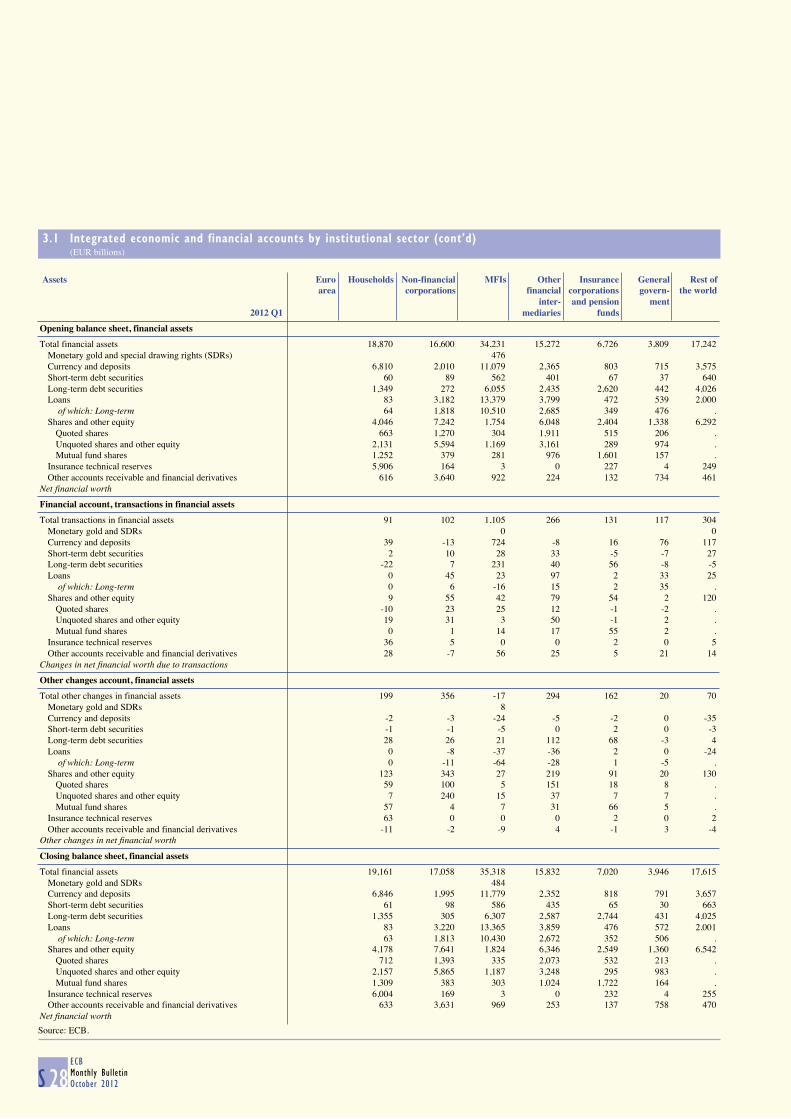
3.1 Integrated economic and financial accounts by institutional sector (cont'd) (EUR billions)
S 28ECBMonthly BulletinOctober 2012
Assets Euro Households Non-financial MFIs Other Insurance General Rest ofarea corporations financial corporations govern- the world
inter- and pension ment2012 Q1 mediaries funds
Opening balance sheet, financial assets
Total financial assets 18,870 16,600 34,231 15,272 6,726 3,809 17,242 Monetary gold and special drawing rights (SDRs) 476 Currency and deposits 6,810 2,010 11,079 2,365 803 715 3,575 Short-term debt securities 60 89 562 401 67 37 640 Long-term debt securities 1,349 272 6,055 2,435 2,620 442 4,026 Loans 83 3,182 13,379 3,799 472 539 2,000 of which: Long-term 64 1,818 10,510 2,685 349 476 . Shares and other equity 4,046 7,242 1,754 6,048 2,404 1,338 6,292 Quoted shares 663 1,270 304 1,911 515 206 . Unquoted shares and other equity 2,131 5,594 1,169 3,161 289 974 . Mutual fund shares 1,252 379 281 976 1,601 157 . Insurance technical reserves 5,906 164 3 0 227 4 249 Other accounts receivable and financial derivatives 616 3,640 922 224 132 734 461 Net financial worth
Financial account, transactions in financial assets
Total transactions in financial assets 91 102 1,105 266 131 117 304 Monetary gold and SDRs 0 0 Currency and deposits 39 -13 724 -8 16 76 117 Short-term debt securities 2 10 28 33 -5 -7 27 Long-term debt securities -22 7 231 40 56 -8 -5 Loans 0 45 23 97 2 33 25 of which: Long-term 0 6 -16 15 2 35 . Shares and other equity 9 55 42 79 54 2 120 Quoted shares -10 23 25 12 -1 -2 . Unquoted shares and other equity 19 31 3 50 -1 2 . Mutual fund shares 0 1 14 17 55 2 . Insurance technical reserves 36 5 0 0 2 0 5 Other accounts receivable and financial derivatives 28 -7 56 25 5 21 14 Changes in net financial worth due to transactions
Other changes account, financial assets
Total other changes in financial assets 199 356 -17 294 162 20 70 Monetary gold and SDRs 8 Currency and deposits -2 -3 -24 -5 -2 0 -35 Short-term debt securities -1 -1 -5 0 2 0 -3 Long-term debt securities 28 26 21 112 68 -3 4 Loans 0 -8 -37 -36 2 0 -24 of which: Long-term 0 -11 -64 -28 1 -5 . Shares and other equity 123 343 27 219 91 20 130 Quoted shares 59 100 5 151 18 8 . Unquoted shares and other equity 7 240 15 37 7 7 . Mutual fund shares 57 4 7 31 66 5 . Insurance technical reserves 63 0 0 0 2 0 2 Other accounts receivable and financial derivatives -11 -2 -9 4 -1 3 -4 Other changes in net financial worth
Closing balance sheet, financial assets
Total financial assets 19,161 17,058 35,318 15,832 7,020 3,946 17,615 Monetary gold and SDRs 484 Currency and deposits 6,846 1,995 11,779 2,352 818 791 3,657 Short-term debt securities 61 98 586 435 65 30 663 Long-term debt securities 1,355 305 6,307 2,587 2,744 431 4,025 Loans 83 3,220 13,365 3,859 476 572 2,001 of which: Long-term 63 1,813 10,430 2,672 352 506 . Shares and other equity 4,178 7,641 1,824 6,346 2,549 1,360 6,542 Quoted shares 712 1,393 335 2,073 532 213 . Unquoted shares and other equity 2,157 5,865 1,187 3,248 295 983 . Mutual fund shares 1,309 383 303 1,024 1,722 164 . Insurance technical reserves 6,004 169 3 0 232 4 255 Other accounts receivable and financial derivatives 633 3,631 969 253 137 758 470 Net financial worth
Source: ECB.

EURO AREASTATISTICS
Euro areaaccounts
3.1 Integrated economic and financial accounts by institutional sector (cont'd) (EUR billions)
S 29ECB
Monthly BulletinOctober 2012
Liabilities Euro Households Non-financial MFIs Other Insurance General Rest ofarea corporations financial corporations govern- the world
inter- and pension ment2012 Q1 mediaries funds
Opening balance sheet, liabilities
Total liabilities 6,736 25,595 33,348 14,966 6,933 9,308 15,387 Monetary gold and special drawing rights (SDRs) Currency and deposits 29 24,312 33 0 274 2,708 Short-term debt securities 84 710 72 1 714 276 Long-term debt securities 839 4,554 2,873 33 5,968 2,934 Loans 6,204 8,572 3,411 290 1,804 3,175 of which: Long-term 5,847 6,104 1,875 116 1,491 . Shares and other equity 7 12,101 2,453 8,409 380 6 5,768 Quoted shares 3,300 333 192 97 0 . Unquoted shares and other equity 7 8,801 1,129 2,736 281 6 . Mutual fund shares 992 5,481 . Insurance technical reserves 35 337 66 1 6,113 1 Other accounts payable and financial derivatives 490 3,633 1,254 168 117 541 527 Net financial worth 1) -1,378 12,134 -8,995 883 306 -207 -5,499
Financial account, transactions in liabilities
Total transactions in liabilities 34 90 1,099 262 103 239 290 Monetary gold and SDRs Currency and deposits 1 937 -2 0 -16 31 Short-term debt securities 4 15 13 0 22 34 Long-term debt securities 32 65 -5 0 126 80 Loans -7 27 73 9 79 43 of which: Long-term 0 8 -6 0 85 . Shares and other equity 0 76 45 162 1 0 78 Quoted shares 3 12 0 0 0 . Unquoted shares and other equity 0 74 6 67 1 0 . Mutual fund shares 27 95 . Insurance technical reserves 0 0 -1 0 49 0 Other accounts payable and financial derivatives 41 -52 37 21 44 28 24 Changes in net financial worth due to transactions 1) -13 58 12 6 4 29 -122 13
Other changes account, liabilities
Total other changes in liabilities 0 431 97 288 77 139 43 Monetary gold and SDRs Currency and deposits 0 -22 0 0 0 -47 Short-term debt securities 0 -4 -3 0 1 -1 Long-term debt securities 16 102 -12 0 128 21 Loans -3 -31 -21 0 0 -49 of which: Long-term -2 -19 -14 1 0 . Shares and other equity 0 451 17 321 31 0 134 Quoted shares 268 25 25 16 0 . Unquoted shares and other equity 0 183 54 -9 16 0 . Mutual fund shares -63 305 . Insurance technical reserves 0 0 0 0 67 0 Other accounts payable and financial derivatives 3 -5 3 4 -22 9 -15 Other changes in net financial worth 1) -18 199 -75 -114 5 86 -118 26
Closing balance sheet, liabilities
Total liabilities 6,770 26,116 34,544 15,516 7,113 9,685 15,721 Monetary gold and SDRs Currency and deposits 31 25,227 31 0 257 2,692 Short-term debt securities 88 721 81 1 738 309 Long-term debt securities 887 4,722 2,855 34 6,222 3,036 Loans 6,194 8,568 3,463 299 1,883 3,169 of which: Long-term 5,845 6,092 1,855 117 1,576 . Shares and other equity 7 12,628 2,515 8,892 412 6 5,979 Quoted shares 3,570 370 216 113 0 . Unquoted shares and other equity 7 9,058 1,188 2,794 297 6 . Mutual fund shares 957 5,882 . Insurance technical reserves 36 337 65 1 6,229 1 Other accounts payable and financial derivatives 533 3,577 1,294 193 140 578 535 Net financial worth 1) -1,409 12,391 -9,058 774 316 -93 -5,739
Source: ECB.

3.2 Euro area non-financial accounts (EUR billions; four-quarter cumulated flows)
S 30ECBMonthly BulletinOctober 2012
Uses 2010 Q2- 2010 Q3- 2010 Q4- 2011 Q1- 2011 Q2-2008 2009 2010 2011 Q1 2011 Q2 2011 Q3 2011 Q4 2012 Q1
Generation of income account
Gross value added (basic prices) Taxes less subsidies on products Gross domestic product (market prices) Compensation of employees 4,462 4,444 4,494 4,521 4,552 4,581 4,606 4,623 Other taxes less subsidies on production 94 85 83 85 88 93 96 98 Consumption of fixed capital 1,361 1,386 1,418 1,429 1,438 1,447 1,454 1,460 Net operating surplus and mixed income 1) 2,364 2,105 2,210 2,238 2,259 2,270 2,269 2,273
Allocation of primary income account
Net operating surplus and mixed income Compensation of employees Taxes less subsidies on production Property income 3,946 2,973 2,801 2,845 2,911 2,968 2,986 3,021 Interest 2,383 1,606 1,394 1,423 1,466 1,512 1,553 1,574 Other property income 1,563 1,367 1,407 1,422 1,446 1,456 1,433 1,447 Net national income 1) 7,805 7,527 7,745 7,813 7,870 7,923 7,960 7,993
Secondary distribution of income account
Net national income Current taxes on income, wealth, etc. 1,145 1,029 1,055 1,073 1,084 1,102 1,111 1,122 Social contributions 1,672 1,676 1,700 1,710 1,722 1,736 1,751 1,757 Social benefits other than social transfers in kind 1,656 1,773 1,818 1,824 1,830 1,837 1,847 1,857 Other current transfers 771 775 778 778 781 781 780 783 Net non-life insurance premiums 187 181 182 181 181 181 181 181 Non-life insurance claims 188 182 183 182 182 182 181 182 Other 395 412 413 415 418 418 418 421 Net disposable income 1) 7,704 7,419 7,633 7,700 7,760 7,814 7,849 7,881
Use of income account
Net disposable income Final consumption expenditure 7,140 7,146 7,309 7,357 7,403 7,441 7,466 7,497 Individual consumption expenditure 6,403 6,375 6,536 6,584 6,630 6,668 6,693 6,723 Collective consumption expenditure 737 771 773 773 773 772 772 774 Adjustment for the change in the net equity of households in pension fund reserves 70 62 55 55 56 57 57 58 Net saving 1) 564 273 324 344 357 374 383 384
Capital account
Net saving Gross capital formation 2,075 1,710 1,786 1,832 1,857 1,875 1,874 1,850 Gross fixed capital formation 2,010 1,755 1,769 1,796 1,811 1,825 1,834 1,832 Changes in inventories and acquisitions less disposals of valuables 64 -45 16 36 45 51 39 18 Consumption of fixed capital Acquisitions less disposals of non-produced non-financial assets 1 1 1 1 1 1 0 1 Capital transfers 152 184 224 212 204 169 165 160 Capital taxes 24 34 25 26 26 27 31 29 Other capital transfers 128 150 199 186 178 142 134 131 Net lending (+)/net borrowing (-) (from capital account) 1) -141 -43 -34 -50 -53 -46 -25 4
Sources: ECB and Eurostat.1) For details of the calculation of the balancing items, see the Technical Notes.
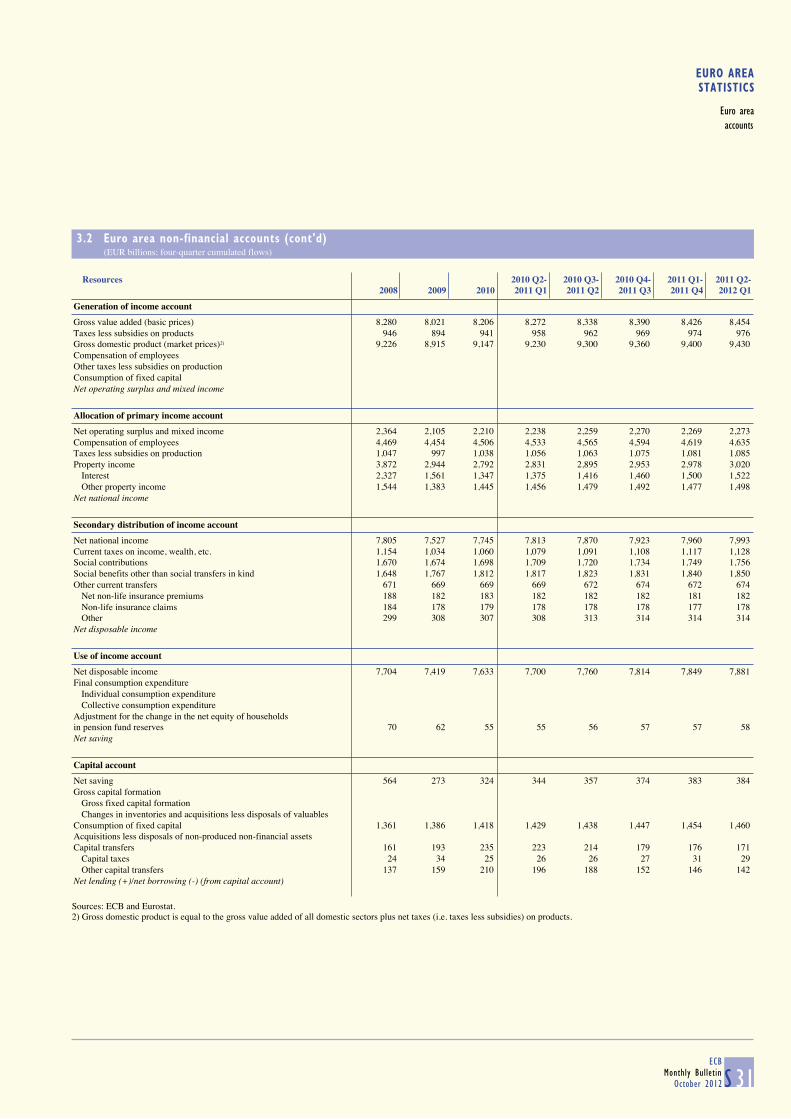
EURO AREASTATISTICS
Euro areaaccounts
3.2 Euro area non-financial accounts (cont'd) (EUR billions; four-quarter cumulated flows)
S 31ECB
Monthly BulletinOctober 2012
Resources 2010 Q2- 2010 Q3- 2010 Q4- 2011 Q1- 2011 Q2-2008 2009 2010 2011 Q1 2011 Q2 2011 Q3 2011 Q4 2012 Q1
Generation of income account
Gross value added (basic prices) 8,280 8,021 8,206 8,272 8,338 8,390 8,426 8,454 Taxes less subsidies on products 946 894 941 958 962 969 974 976 Gross domestic product (market prices)2) 9,226 8,915 9,147 9,230 9,300 9,360 9,400 9,430 Compensation of employees Other taxes less subsidies on production Consumption of fixed capital Net operating surplus and mixed income
Allocation of primary income account
Net operating surplus and mixed income 2,364 2,105 2,210 2,238 2,259 2,270 2,269 2,273 Compensation of employees 4,469 4,454 4,506 4,533 4,565 4,594 4,619 4,635 Taxes less subsidies on production 1,047 997 1,038 1,056 1,063 1,075 1,081 1,085 Property income 3,872 2,944 2,792 2,831 2,895 2,953 2,978 3,020 Interest 2,327 1,561 1,347 1,375 1,416 1,460 1,500 1,522 Other property income 1,544 1,383 1,445 1,456 1,479 1,492 1,477 1,498 Net national income
Secondary distribution of income account
Net national income 7,805 7,527 7,745 7,813 7,870 7,923 7,960 7,993 Current taxes on income, wealth, etc. 1,154 1,034 1,060 1,079 1,091 1,108 1,117 1,128 Social contributions 1,670 1,674 1,698 1,709 1,720 1,734 1,749 1,756 Social benefits other than social transfers in kind 1,648 1,767 1,812 1,817 1,823 1,831 1,840 1,850 Other current transfers 671 669 669 669 672 674 672 674 Net non-life insurance premiums 188 182 183 182 182 182 181 182 Non-life insurance claims 184 178 179 178 178 178 177 178 Other 299 308 307 308 313 314 314 314 Net disposable income
Use of income account
Net disposable income 7,704 7,419 7,633 7,700 7,760 7,814 7,849 7,881 Final consumption expenditure Individual consumption expenditure Collective consumption expenditure Adjustment for the change in the net equity of households in pension fund reserves 70 62 55 55 56 57 57 58 Net saving
Capital account
Net saving 564 273 324 344 357 374 383 384 Gross capital formation Gross fixed capital formation Changes in inventories and acquisitions less disposals of valuables Consumption of fixed capital 1,361 1,386 1,418 1,429 1,438 1,447 1,454 1,460 Acquisitions less disposals of non-produced non-financial assets Capital transfers 161 193 235 223 214 179 176 171 Capital taxes 24 34 25 26 26 27 31 29 Other capital transfers 137 159 210 196 188 152 146 142 Net lending (+)/net borrowing (-) (from capital account)
Sources: ECB and Eurostat.2) Gross domestic product is equal to the gross value added of all domestic sectors plus net taxes (i.e. taxes less subsidies) on products.

3.3 Households (EUR billions; four-quarter cumulated flows; outstanding amounts at end of period)
S 32ECBMonthly BulletinOctober 2012
2010 Q2- 2010 Q3- 2010 Q4- 2011 Q1- 2011 Q2-2008 2009 2010 2011 Q1 2011 Q2 2011 Q3 2011 Q4 2012 Q1
Income, saving and changes in net worth
Compensation of employees (+) 4,469 4,454 4,506 4,533 4,565 4,594 4,619 4,635 Gross operating surplus and mixed income (+) 1,522 1,444 1,450 1,462 1,476 1,484 1,489 1,492 Interest receivable (+) 351 240 212 218 227 235 241 245 Interest payable (-) 249 146 126 130 136 142 146 147 Other property income receivable (+) 785 718 721 728 734 743 744 754 Other property income payable (-) 10 10 10 10 10 10 10 10 Current taxes on income and wealth (-) 872 842 848 857 864 876 881 892 Net social contributions (-) 1,667 1,672 1,695 1,705 1,717 1,731 1,746 1,753 Net social benefits (+) 1,643 1,762 1,806 1,812 1,818 1,825 1,835 1,845 Net current transfers receivable (+) 70 71 72 70 71 70 70 71 = Gross disposable income 6,042 6,020 6,088 6,121 6,163 6,193 6,215 6,241 Final consumption expenditure (-) 5,240 5,157 5,293 5,337 5,380 5,416 5,438 5,463 Changes in net worth in pension funds (+) 69 61 55 55 55 56 57 58 = Gross saving 871 923 849 839 838 833 834 836 Consumption of fixed capital (-) 373 376 383 385 386 387 388 389 Net capital transfers receivable (+) -1 10 12 11 11 10 8 7 Other changes in net worth (+) -1,688 -777 770 746 584 -118 -576 -756 = Changes in net worth -1,190 -220 1,248 1,211 1,047 339 -122 -302
Investment, financing and changes in net worth
Net acquisition of non-financial assets (+) 646 551 559 566 570 576 579 577 Consumption of fixed capital (-) 373 376 383 385 386 387 388 389 Main items of financial investment (+) Short-term assets 448 9 40 100 114 127 125 145 Currency and deposits 437 121 118 137 135 146 118 156 Money market fund shares -4 -41 -59 -41 -35 -24 -22 -22 Debt securities 1) 15 -72 -19 5 14 5 29 11 Long-term assets 40 463 368 264 240 228 185 179 Deposits -24 76 55 41 51 51 50 50 Debt securities 27 -2 -20 4 17 39 43 21 Shares and other equity -96 164 96 17 -4 -17 -31 8 Quoted and unquoted shares and other equity 75 123 92 43 22 30 28 51 Mutual fund shares -172 41 4 -25 -27 -47 -58 -43 Life insurance and pension fund reserves 133 226 236 201 177 154 122 100 Main items of financing (-) Loans 257 111 129 125 140 126 93 76 of which: From euro area MFIs 83 65 147 170 168 148 81 34 Other changes in assets (+) Non-financial assets -375 -1,094 620 663 296 258 -239 -576 Financial assets -1,392 294 173 107 273 -403 -386 -232 Shares and other equity -1,138 92 92 120 232 -330 -373 -331 Life insurance and pension fund reserves -239 190 117 48 67 -24 18 98 Remaining net flows (+) 73 45 1 20 79 66 95 70 = Changes in net worth -1,190 -220 1,248 1,211 1,047 339 -122 -302
Balance sheet
Non-financial assets (+) 27,989 27,069 27,865 27,903 27,947 28,206 27,817 27,515 Financial assets (+) Short-term assets 5,775 5,774 5,817 5,852 5,890 5,889 5,957 5,969 Currency and deposits 5,321 5,475 5,598 5,596 5,648 5,656 5,729 5,754 Money market fund shares 317 243 186 204 191 188 169 154 Debt securities 1) 137 55 34 52 50 45 60 61 Long-term assets 10,760 11,573 12,105 12,177 12,186 11,762 11,909 12,163 Deposits 913 969 1,026 1,036 1,055 1,069 1,081 1,092 Debt securities 1,344 1,397 1,331 1,330 1,354 1,333 1,349 1,355 Shares and other equity 3,811 4,099 4,286 4,318 4,253 3,828 3,878 4,024 Quoted and unquoted shares and other equity 2,882 2,987 3,094 3,154 3,087 2,762 2,794 2,869 Mutual fund shares 929 1,112 1,192 1,164 1,166 1,066 1,083 1,155 Life insurance and pension fund reserves 4,692 5,108 5,461 5,494 5,523 5,533 5,601 5,692 Remaining net assets (+) 340 351 392 388 467 485 471 453 Liabilities (-) Loans 5,820 5,942 6,106 6,113 6,171 6,190 6,204 6,194 of which: From euro area MFIs 4,914 4,968 5,213 5,256 5,304 5,313 5,281 5,269 = Net worth 39,045 38,824 40,073 40,207 40,317 40,151 39,951 39,906Sources: ECB and Eurostat.1) Securities issued by MFIs with a maturity of less than two years and securities issued by other sectors with a maturity of less than one year.

EURO AREASTATISTICS
Euro areaaccounts
3.4 Non-financial corporations (EUR billions; four-quarter cumulated flows; outstanding amounts at end of period)
S 33ECB
Monthly BulletinOctober 2012
2010 Q2- 2010 Q3- 2010 Q4- 2011 Q1- 2011 Q2-2008 2009 2010 2011 Q1 2011 Q2 2011 Q3 2011 Q4 2012 Q1
Income and saving
Gross value added (basic prices) (+) 4,758 4,499 4,638 4,686 4,732 4,770 4,794 4,811 Compensation of employees (-) 2,833 2,777 2,808 2,831 2,858 2,883 2,905 2,915 Other taxes less subsidies on production (-) 46 40 34 35 37 40 42 44 = Gross operating surplus (+) 1,879 1,682 1,796 1,820 1,837 1,847 1,847 1,852 Consumption of fixed capital (-) 767 784 803 809 816 821 826 830 = Net operating surplus (+) 1,112 898 993 1,011 1,021 1,025 1,020 1,022 Property income receivable (+) 644 535 583 586 583 588 568 565 Interest receivable 239 169 153 154 158 164 169 171 Other property income receivable 405 366 430 432 425 424 400 394 Interest and rents payable (-) 421 297 257 263 272 281 288 290 = Net entrepreneurial income (+) 1,335 1,137 1,319 1,334 1,332 1,332 1,300 1,297 Distributed income (-) 1,023 919 919 939 953 975 976 985 Taxes on income and wealth payable (-) 236 152 168 176 178 183 187 187 Social contributions receivable (+) 68 70 69 69 70 70 70 71 Social benefits payable (-) 65 68 69 69 69 69 70 70 Other net transfers (-) 48 46 44 44 43 43 43 44 = Net saving 31 23 188 175 158 131 95 81
Investment, financing and saving
Net acquisition of non-financial assets (+) 369 75 157 189 200 211 209 189 Gross fixed capital formation (+) 1,077 906 944 964 977 990 998 999 Consumption of fixed capital (-) 767 784 803 809 816 821 826 830 Net acquisition of other non-financial assets (+) 59 -47 15 34 38 43 37 21 Main items of financial investment (+) Short-term assets 62 95 45 36 45 2 -33 10 Currency and deposits 14 88 68 65 68 45 0 9 Money market fund shares 33 39 -23 -25 -24 -40 -43 -18 Debt securities 1) 15 -32 -1 -4 1 -3 11 19 Long-term assets 632 221 538 529 583 577 495 479 Deposits 41 -2 17 44 39 54 66 51 Debt securities -33 18 21 19 25 13 -2 -4 Shares and other equity 326 99 286 293 334 319 248 232 Other (mainly intercompany loans) 298 106 213 173 185 190 183 200 Remaining net assets (+) 5 20 11 4 -23 -30 -42 -47 Main items of financing (-) Debt 648 63 252 261 315 297 256 252 of which: Loans from euro area MFIs 394 -112 -15 27 75 79 46 -4 of which: Debt securities 48 88 67 46 45 49 44 66 Shares and other equity 311 240 238 248 260 260 208 228 Quoted shares 5 53 31 29 28 29 27 20 Unquoted shares and other equity 307 186 207 219 232 231 181 208 Net capital transfers receivable (-) 74 83 72 71 70 70 71 69 = Net saving 31 23 188 175 158 131 95 81
Financial balance sheet
Financial assets Short-term assets 1,848 1,932 1,965 1,933 1,923 1,917 1,940 1,933 Currency and deposits 1,538 1,632 1,694 1,669 1,676 1,681 1,705 1,679 Money market fund shares 192 213 191 184 173 158 146 156 Debt securities 1) 118 87 79 80 75 78 89 98 Long-term assets 9,403 10,299 11,014 11,187 11,279 10,647 10,856 11,325 Deposits 255 243 266 276 261 294 305 316 Debt securities 212 228 264 275 269 266 272 305 Shares and other equity 6,279 7,084 7,506 7,640 7,683 6,936 7,096 7,485 Other (mainly intercompany loans) 2,657 2,744 2,977 2,997 3,066 3,151 3,182 3,220 Remaining net assets 250 247 129 195 142 141 200 253 Liabilities Debt 9,313 9,369 9,607 9,648 9,731 9,808 9,831 9,880 of which: Loans from euro area MFIs 4,870 4,711 4,691 4,726 4,751 4,763 4,717 4,701 of which: Debt securities 700 824 888 864 877 920 923 975 Shares and other equity 11,120 12,388 13,036 13,322 13,298 11,857 12,101 12,628 Quoted shares 2,941 3,502 3,813 3,922 3,914 3,142 3,300 3,570 Unquoted shares and other equity 8,179 8,886 9,224 9,401 9,385 8,715 8,801 9,058
Sources: ECB and Eurostat.1) Securities issued by MFIs with a maturity of less than two years and securities issued by other sectors with a maturity of less than one year.

3.5 Insurance corporations and pension funds (EUR billions; four-quarter cumulated flows; outstanding amounts at end of period)
S 34ECBMonthly BulletinOctober 2012
2010 Q2- 2010 Q3- 2010 Q4- 2011 Q1- 2011 Q2-2008 2009 2010 2011 Q1 2011 Q2 2011 Q3 2011 Q4 2012 Q1
Financial account, financial transactions
Main items of financial investment (+) Short-term assets 70 -47 -16 -20 -29 8 49 74 Currency and deposits 57 -33 -9 -9 -15 5 16 31 Money market fund shares 12 0 -17 -21 -18 -7 11 30 Debt securities 1) 1 -14 10 10 4 10 22 13 Long-term assets 130 288 288 271 284 234 123 102 Deposits 7 14 -5 5 8 10 9 -1 Debt securities 75 104 177 173 157 96 27 6 Loans 21 7 29 19 18 15 6 8 Quoted shares -10 -49 13 15 15 10 5 3 Unquoted shares and other equity 13 -20 4 6 6 11 -7 -10 Mutual fund shares 25 232 71 51 80 92 82 96 Remaining net assets (+) 8 17 11 -7 -42 -40 -41 -64 Main items of financing (-) Debt securities 4 5 0 0 3 3 3 3 Loans 32 -2 9 10 14 14 6 8 Shares and other equity 7 3 1 4 2 3 3 3 Insurance technical reserves 123 240 273 221 186 150 117 102 Net equity of households in life insurance and pension fund reserves 121 233 253 201 172 139 116 103 Prepayments of insurance premiums and reserves for outstanding claims 1 7 20 20 14 11 2 -1 = Changes in net financial worth due to transactions 43 12 0 8 8 31 1 -4
Other changes account
Other changes in financial assets (+) Shares and other equity -553 202 111 50 76 -99 -112 -17 Other net assets 41 29 -7 -87 -62 -74 17 143 Other changes in liabilities (-) Shares and other equity -172 10 -7 -6 12 -41 -47 -31 Insurance technical reserves -253 167 131 57 72 -11 25 105 Net equity of households in life insurance and pension fund reserves -243 196 122 56 74 -10 24 98 Prepayments of insurance premiums and reserves for outstanding claims -10 -29 9 1 -3 -1 1 7 = Other changes in net financial worth -86 55 -21 -88 -70 -122 -72 51
Financial balance sheet
Financial assets (+) Short-term assets 377 325 314 311 312 344 348 368 Currency and deposits 224 195 190 181 181 199 193 208 Money market fund shares 101 93 77 79 81 87 87 95 Debt securities 1) 52 37 46 50 50 58 67 65 Long-term assets 5,084 5,650 6,034 6,112 6,141 6,040 6,019 6,284 Deposits 599 612 604 617 619 618 610 610 Debt securities 2,277 2,452 2,617 2,660 2,674 2,676 2,620 2,744 Loans 433 436 466 466 471 469 472 476 Quoted shares 491 513 553 563 557 508 515 532 Unquoted shares and other equity 313 301 298 297 295 295 289 295 Mutual fund shares 971 1,335 1,497 1,508 1,525 1,474 1,513 1,627 Remaining net assets (+) 236 208 230 221 210 240 242 229 Liabilities (-) Debt securities 23 31 33 31 34 31 34 34 Loans 281 272 286 291 294 301 290 299 Shares and other equity 416 429 424 439 426 381 380 412 Insurance technical reserves 5,160 5,566 5,971 6,021 6,046 6,051 6,113 6,229 Net equity of households in life insurance and pension fund reserves 4,359 4,789 5,164 5,199 5,228 5,234 5,303 5,401 Prepayments of insurance premiums and reserves for outstanding claims 800 778 807 822 818 817 810 828 = Net financial wealth -182 -116 -136 -139 -136 -140 -207 -93
Source: ECB.1) Securities issued by MFIs with a maturity of less than two years and securities issued by other sectors with a maturity of less than one year.

4FINANCIAL MARKETS
4.1 Securities other than shares by original maturity, residency of the issuer and currency (EUR billions and period growth rates; seasonally adjusted; transactions during the month and end-of-period outstanding amounts; nominal values)
S 35ECB
Monthly BulletinOctober 2012
Total
By euro area residents
Total in euro 1) In euro In all currencies
Outstanding Gross issues Net issues Outstanding Gross issues Net issues Outstanding Gross issues Net issues Annual Seasonally adjusted 2)
amounts amounts amounts growth rates6-month
Net issues growth rates1 2 3 4 5 6 7 8 9 10 11 12
2011 July 16,585.3 852.8 -30.3 14,418.1 825.4 -10.3 16,215.1 907.4 -11.0 3.6 15.5 2.5 Aug. 16,616.6 808.3 31.6 14,450.3 773.9 32.5 16,224.1 859.8 20.2 3.2 51.6 2.7 Sep. 16,647.6 1,002.1 31.3 14,455.0 926.1 5.1 16,268.4 1,026.7 6.9 3.2 63.9 3.5 Oct. 16,698.7 1,034.7 51.9 14,533.7 993.1 79.4 16,312.2 1,086.7 69.8 3.3 57.4 3.7 Nov. 16,784.8 1,064.4 85.5 14,627.1 1,017.2 92.6 16,442.2 1,128.3 100.8 2.4 31.9 3.3 Dec. 16,843.3 1,127.3 58.4 14,684.9 1,084.9 57.8 16,526.8 1,176.1 56.2 3.9 145.2 4.6
2012 Jan. 16,940.9 1,190.1 97.6 14,774.9 1,118.6 90.2 16,600.1 1,247.7 82.7 3.9 62.6 5.2 Feb. 17,127.3 1,134.6 186.9 14,919.3 1,047.6 144.9 16,744.2 1,165.1 162.6 4.2 98.2 5.7 Mar. 17,175.0 1,233.7 142.7 14,868.1 1,091.7 43.1 16,734.3 1,226.2 79.8 4.7 82.2 5.9 Apr. 17,130.7 837.3 -33.5 14,851.0 799.5 -6.5 16,736.5 902.8 -0.2 4.4 -6.7 5.1 May 17,170.2 907.7 41.1 14,891.5 856.4 41.8 16,837.6 963.7 57.5 4.0 -4.0 4.6 June 17,181.1 919.2 11.2 14,893.1 858.0 2.2 16,809.4 945.0 -15.4 3.8 16.3 3.0 July . . . 14,880.2 825.4 -7.5 16,857.5 949.0 30.2 4.0 57.8 3.0
Long-term
2011 July 15,190.0 203.4 -20.4 13,095.2 192.2 -13.3 14,667.8 213.9 -12.8 4.4 24.7 2.8 Aug. 15,186.0 123.1 -4.0 13,095.5 113.5 0.2 14,649.0 123.5 -8.4 4.0 32.8 2.8 Sep. 15,175.9 229.2 -9.5 13,081.5 189.8 -13.2 14,675.9 214.0 -5.9 4.0 51.4 3.3 Oct. 15,249.6 278.4 75.6 13,161.3 251.1 81.6 14,722.1 268.1 70.0 4.0 66.6 3.4 Nov. 15,320.7 212.0 70.9 13,243.4 192.7 81.6 14,839.6 213.4 92.0 3.3 25.6 3.4 Dec. 15,369.0 238.1 47.2 13,306.2 228.9 61.7 14,928.8 246.5 63.6 4.0 107.9 4.3
2012 Jan. 15,454.3 347.6 85.7 13,369.0 303.4 63.3 14,973.0 332.4 52.0 3.9 69.3 4.9 Feb. 15,625.7 366.6 171.0 13,506.2 310.0 136.8 15,104.7 340.7 147.5 4.2 88.6 5.7 Mar. 15,660.1 386.9 129.9 13,463.6 280.2 52.1 15,087.6 330.6 75.4 4.6 75.8 6.0 Apr. 15,629.1 188.7 -20.3 13,444.2 175.1 -8.8 15,091.0 206.6 3.9 4.2 -5.8 4.9 May 15,679.8 231.9 50.8 13,495.1 208.4 50.7 15,200.3 244.2 69.7 4.1 16.7 4.8 June 15,719.4 272.8 40.3 13,536.7 240.5 42.7 15,213.0 256.2 24.4 3.9 17.7 3.5 July . . . 13,501.4 228.9 -30.3 15,226.7 267.5 -2.0 4.0 36.2 3.1
C15 Total outstanding amounts and gross issues of securities other than shares issued by euro area residents
(EUR billions)
0
2000
4000
6000
8000
10000
12000
14000
16000
18000
1994 1995 1996 1997 1998 1999 2000 2001 2002 2003 2004 2005 2006 2007 2008 2009 2010 2011 20120
200
400
600
800
1000
1200
1400
1600
1800
total gross issues (right-hand scale)total outstanding amounts (left-hand scale)outstanding amounts in euro (left-hand scale)
Sources: ECB and BIS (for issues by non-euro area residents).1) Total euro-denominated securities other than shares issued by euro area residents and non-euro area residents.2) For details of the calculation of the growth rates, see the Technical Notes. The six-month growth rates have been annualised.
4

4.2 Securities other than shares issued by euro area residents, by sector of the issuer and instrument type (EUR billions ; transactions during the month and end-of-period outstanding amounts; nominal values)
S 36ECBMonthly BulletinOctober 2012
1. Outstanding amounts and gross issues
Total
Outstanding amounts Gross issues 1)
Total MFIs Non-MFI corporations General government Total MFIs Non-MFI corporations General government
(including (includingEurosystem) Financial Non-financial Central Other Eurosystem) Financial Non-financial Central Other
corporations corporations government general corporations corporations government generalother than government other than government
MFIs MFIs1 2 3 4 5 6 7 8 9 10 11 12
2010 15,870 5,246 3,284 854 5,932 554 1,007 625 80 69 205 292011 16,527 5,529 3,285 872 6,216 624 1,000 609 98 62 191 39
2011 Q3 16,268 5,425 3,218 858 6,160 607 931 580 79 60 180 33 Q4 16,527 5,529 3,285 872 6,216 624 1,130 714 138 70 172 362012 Q1 16,734 5,633 3,319 904 6,208 670 1,213 765 106 70 223 49 Q2 16,809 5,598 3,298 933 6,284 697 937 577 77 70 183 30
2012 Apr. 16,737 5,610 3,350 921 6,190 665 903 557 59 73 190 24 May 16,838 5,609 3,370 936 6,253 669 964 573 103 69 186 33 June 16,809 5,598 3,298 933 6,284 697 945 600 71 68 171 35 July 16,858 5,644 3,289 947 6,271 706 949 596 69 65 192 27
Short-term
2010 1,540 572 120 69 724 54 759 534 34 57 115 192011 1,598 702 106 79 634 77 748 511 48 53 107 29
2011 Q3 1,593 613 110 86 712 72 747 512 42 53 114 26 Q4 1,598 702 106 79 634 77 888 629 76 60 94 282012 Q1 1,647 711 122 83 641 91 878 609 61 54 125 29 Q2 1,596 678 120 93 623 83 702 491 31 57 102 20
2012 Apr. 1,646 709 126 95 633 83 696 483 33 62 103 15 May 1,637 699 127 100 629 82 719 500 29 61 104 25 June 1,596 678 120 93 623 83 689 490 32 47 99 20 July 1,631 703 117 94 630 87 681 486 24 52 102 17
Long-term 2)
2010 14,329 4,674 3,164 785 5,207 499 248 91 46 12 90 92011 14,929 4,827 3,178 793 5,583 547 252 98 51 9 84 10
2011 Q3 14,676 4,812 3,108 772 5,448 535 184 67 36 7 66 7 Q4 14,929 4,827 3,178 793 5,583 547 243 85 61 10 78 82012 Q1 15,088 4,922 3,196 821 5,567 580 335 156 45 16 98 20 Q2 15,213 4,920 3,178 840 5,661 614 236 86 46 13 81 10
2012 Apr. 15,091 4,901 3,224 827 5,557 582 207 75 26 10 87 8 May 15,200 4,910 3,243 837 5,624 586 244 73 74 8 82 7 June 15,213 4,920 3,178 840 5,661 614 256 111 38 20 72 15 July 15,227 4,941 3,172 853 5,641 619 268 110 45 13 90 10
of which: Long-term fixed rate
2010 9,478 2,633 1,098 673 4,697 377 156 50 13 10 77 62011 10,028 2,777 1,150 699 4,994 408 151 54 12 8 70 7
2011 Q3 9,889 2,773 1,148 680 4,887 400 112 35 8 6 58 5 Q4 10,028 2,777 1,150 699 4,994 408 123 41 7 9 61 52012 Q1 10,239 2,890 1,198 727 5,003 421 228 103 17 15 83 11 Q2 10,420 2,891 1,244 748 5,100 437 148 42 21 12 68 6
2012 Apr. 10,254 2,885 1,207 732 5,008 423 134 37 9 9 73 6 May 10,384 2,893 1,248 742 5,075 425 161 43 37 7 71 3 June 10,420 2,891 1,244 748 5,100 437 149 45 16 19 60 9 July 10,432 2,900 1,264 758 5,073 437 149 42 13 11 79 4
of which: Long-term variable rate
2010 4,380 1,761 1,961 106 432 121 78 34 29 1 10 42011 4,398 1,781 1,875 90 513 139 84 37 32 1 11 3
2011 Q3 4,281 1,767 1,801 88 491 133 56 26 21 0 5 3 Q4 4,398 1,781 1,875 90 513 139 107 36 51 1 15 32012 Q1 4,338 1,766 1,838 91 486 157 90 46 25 1 10 8 Q2 4,334 1,762 1,822 89 486 175 75 37 23 1 9 4
2012 Apr. 4,334 1,749 1,856 91 479 158 60 31 14 1 11 3 May 4,354 1,747 1,879 91 477 159 68 22 33 1 8 4 June 4,334 1,762 1,822 89 486 175 96 60 21 1 9 6 July 4,331 1,772 1,795 91 492 180 106 61 29 2 8 6
Source: ECB.1) Monthly data on gross issues refer to transactions during the month. For the purposes of comparison, quarterly and annual data refer to the respective monthly averages.2) The residual difference between total long-term debt securities and fixed and variable rate long-term debt securities consists of zero coupon bonds and revaluation effects.

EURO AREASTATISTICS
Financialmarkets
4.2 Securities other than shares issued by euro area residents, by sector of the issuer and instrument type (EUR billions unless otherwise indicated; transactions during the period; nominal values)
S 37ECB
Monthly BulletinOctober 2012
2. Net issues
Total
Non-seasonally adjusted 1) Seasonally adjusted 1)
Total MFIs Non-MFI corporations General government Total MFIs Non-MFI corporations General government
(including (includingEurosystem) Financial Non-financial Central Other Eurosystem) Financial Non-financial Central Other
corporations corporations government general corporations corporations government generalother than government other than government
MFIs MFIs1 2 3 4 5 6 7 8 9 10 11 12
2010 45.2 -1.2 4.4 5.0 31.6 5.3 - - - - - - 2011 52.0 22.6 -3.3 3.7 23.4 5.6 - - - - - -
2011 Q3 5.4 12.8 -10.2 4.6 -3.8 2.0 43.7 18.7 5.0 5.9 10.6 3.5 Q4 75.6 29.7 20.3 3.3 17.6 4.9 78.2 40.8 -1.9 6.8 31.3 1.22012 Q1 108.4 38.5 12.6 11.7 29.6 15.9 81.0 16.9 22.7 9.3 15.7 16.3 Q2 14.0 -19.2 -4.0 8.8 27.6 0.7 1.9 -13.8 -6.6 6.4 13.1 2.7
2012 Apr. -0.2 -29.8 29.2 14.8 -8.2 -6.2 -6.7 -29.5 24.2 8.8 -7.3 -3.0 May 57.5 -23.6 12.7 9.4 59.3 -0.3 -4.0 -37.7 6.3 2.2 25.7 -0.5 June -15.4 -4.2 -53.7 2.3 31.6 8.6 16.3 25.9 -50.3 8.2 20.9 11.7 July 30.2 36.3 -9.6 10.7 -14.3 7.2 57.8 37.9 -9.9 7.0 15.5 7.4
Long-term
2010 53.8 1.9 1.7 5.3 41.3 3.5 - - - - - -2011 47.6 12.0 -2.0 2.8 31.0 3.9 - - - - - -
2011 Q3 -9.0 3.0 -6.6 0.9 -6.9 0.6 36.3 10.0 6.5 2.5 14.4 2.9 Q4 75.2 0.7 21.6 5.5 43.8 3.6 66.7 13.7 0.2 6.8 42.7 3.32012 Q1 91.6 35.5 7.4 10.4 27.3 11.1 77.9 21.1 18.2 9.9 19.0 9.8 Q2 32.7 -7.0 -3.3 5.6 33.6 3.8 9.5 -12.7 -5.1 3.1 21.5 2.8
2012 Apr. 3.9 -26.2 25.6 3.1 -0.4 1.9 -5.8 -29.5 21.1 -0.3 2.0 0.9 May 69.7 -10.9 11.4 4.2 63.1 1.8 16.7 -24.2 7.2 0.6 31.2 1.9 June 24.4 16.0 -46.8 9.5 38.0 7.7 17.7 15.7 -43.6 9.0 31.1 5.5 July -2.0 12.6 -6.8 9.1 -21.0 4.0 36.2 13.1 -10.3 9.4 15.3 8.6
C16 Net issues of securities other than shares: seasonally adjusted and non-seasonally adjusted
(EUR billions; transactions during the month; nominal values)
-200
-150
-100
-50
0
50
100
150
200
250
2003 2004 2005 2006 2007 2008 2009 2010 2011 2012-200
-150
-100
-50
0
50
100
150
200
250
net issuesseasonally adjusted net issues
Source: ECB.1) Monthly data on net issues refer to transactions during the month. For the purposes of comparison, quarterly and annual data refer to the respective monthly averages.

4.3 Growth rates of securities other than shares issued by euro area residents 1) (percentage changes)
S 38ECBMonthly BulletinOctober 2012
Total
Annual growth rates (non-seasonally adjusted) 6-month seasonally adjusted growth rates
Total MFIs Non-MFI corporations General government Total MFIs Non-MFI corporations General government
(including (includingEurosystem) Financial Non-financial Central Other Eurosystem) Financial Non-financial Central Other
corporations corporations government general corporations corporations government generalother than government other than government
MFIs MFIs1 2 3 4 5 6 7 8 9 10 11 12
2011 July 3.6 1.8 0.2 4.9 6.2 13.3 2.5 1.9 -3.4 3.2 5.0 16.5 Aug. 3.2 1.9 -1.3 5.2 5.6 15.3 2.7 2.0 -3.9 4.6 4.9 23.4 Sep. 3.2 2.3 -0.8 4.8 5.1 14.2 3.5 3.1 -0.2 4.5 4.4 17.7 Oct. 3.3 2.9 -0.3 4.7 4.7 12.9 3.7 3.5 0.7 7.2 4.1 13.2 Nov. 2.4 3.2 -2.2 5.1 3.0 13.6 3.3 3.6 0.3 6.9 3.5 11.2 Dec. 3.9 5.2 -1.2 5.4 4.7 12.1 4.6 6.7 0.6 9.3 4.1 4.8
2012 Jan. 3.9 4.3 -1.2 6.2 4.8 15.4 5.2 6.8 1.0 9.3 4.5 14.3 Feb. 4.2 4.5 -0.6 6.9 4.8 19.8 5.7 7.0 2.9 9.3 4.6 16.2 Mar. 4.7 4.8 1.8 8.0 4.5 17.9 5.9 6.5 3.9 11.6 4.6 17.8 Apr. 4.4 4.2 2.7 9.5 3.7 15.7 5.1 4.8 4.5 11.6 3.5 18.5 May 4.0 3.0 3.3 8.8 3.8 12.6 4.6 2.4 6.4 10.6 4.0 14.1 June 3.8 3.4 1.7 10.1 3.5 11.7 3.0 0.3 3.0 11.0 2.8 19.2 July 4.0 4.2 1.4 10.2 3.4 14.8 3.0 1.7 1.9 11.0 2.3 15.4
Long-term
2011 July 4.4 2.6 -0.7 4.8 8.7 9.8 2.8 1.7 -3.1 2.5 6.7 12.0 Aug. 4.0 2.7 -1.9 4.4 8.4 10.3 2.8 1.6 -3.9 3.3 6.9 12.8 Sep. 4.0 2.7 -1.3 3.5 7.9 9.4 3.3 2.7 -0.4 1.9 5.6 10.3 Oct. 4.0 2.6 -0.4 3.5 7.6 8.7 3.4 2.1 1.2 3.5 5.3 9.1 Nov. 3.3 2.7 -2.3 4.0 6.4 10.0 3.4 2.1 0.8 5.1 5.2 9.2 Dec. 4.0 3.1 -0.8 4.4 7.2 9.4 4.3 3.0 1.3 7.5 6.4 7.2
2012 Jan. 3.9 2.4 -0.7 5.7 7.0 11.1 4.9 3.2 1.6 9.1 7.1 10.3 Feb. 4.2 3.0 -0.6 6.5 7.0 13.5 5.7 4.3 2.8 9.7 7.1 14.4 Mar. 4.6 3.5 1.6 7.6 6.2 12.7 6.0 4.4 3.5 13.4 6.9 15.2 Apr. 4.2 2.7 2.5 7.2 5.4 11.7 4.9 3.2 3.6 10.8 5.5 14.4 May 4.1 1.9 3.2 7.1 5.5 10.6 4.8 1.6 5.6 9.2 5.8 11.9 June 3.9 2.0 1.8 8.7 5.4 10.7 3.5 1.0 2.5 10.0 4.4 14.2 July 4.0 2.2 1.5 9.6 5.3 12.1 3.1 1.3 1.4 10.3 3.6 13.9
C17 Annual growth rates of long-term debt securities, by sector of the issuer, in all currencies combined
(annual percentage changes)
-5
0
5
10
15
20
25
30
35
1994 1995 1996 1997 1998 1999 2000 2001 2002 2003 2004 2005 2006 2007 2008 2009 2010 2011 2012-5
0
5
10
15
20
25
30
35
general governmentMFIs (including Eurosystem)non-MFI corporations
Source: ECB.1) For details of the calculation of the growth rates, see the Technical Notes. The six-month growth rates have been annualised.

EURO AREASTATISTICS
Financialmarkets
4.3 Growth rates of securities other than shares issued by euro area residents 1) (cont'd) (percentage changes)
S 39ECB
Monthly BulletinOctober 2012
In all currencies combined
Long-term fixed rate Long-term variable rate
Total MFIs Non-MFI corporations General government Total MFIs Non-MFI corporations General government
(including (includingEurosystem) Financial Non-financial Central Other Eurosystem) Financial Non-financial Central Other
corporations corporations government general corporations corporations government generalother than government other than government
MFIs MFIs13 14 15 16 17 18 19 20 21 22 23 24
2010 8.8 5.7 6.4 19.7 9.9 8.8 -0.6 -4.0 0.6 -2.0 6.4 27.62011 6.4 5.0 3.4 6.3 7.8 7.7 -0.7 -1.4 -5.5 -1.9 22.3 16.1
2011 Q3 6.6 6.2 4.2 5.2 7.4 8.9 -1.6 -1.3 -7.9 -2.4 25.7 13.0 Q4 5.6 5.7 2.6 4.5 6.1 8.1 -1.1 -0.5 -7.1 -2.5 21.0 13.92012 Q1 5.8 5.7 2.1 6.6 6.4 9.0 -0.2 0.2 -5.4 -0.8 15.3 21.5 Q2 5.3 5.3 1.9 8.1 5.6 6.7 0.4 -0.6 -2.2 -1.2 8.1 25.9
2012 Feb. 6.1 5.7 2.9 6.9 6.7 10.1 -0.3 0.4 -6.0 -0.2 15.3 24.4 Mar. 5.8 6.4 2.0 8.1 5.9 8.3 0.6 0.9 -3.8 -1.6 11.4 26.9 Apr. 5.4 5.7 2.0 7.9 5.6 7.3 -0.2 -0.3 -3.4 -0.9 6.4 25.9 May 5.2 4.9 1.9 7.6 5.7 5.7 0.9 -1.4 -0.3 -1.1 7.6 26.0 June 4.8 4.4 1.4 9.4 5.1 6.1 0.6 -0.9 -1.7 -1.7 9.0 24.9 July 4.9 4.7 1.2 10.0 5.0 7.1 0.4 -0.8 -2.6 1.3 9.2 27.1
In euro
2010 9.1 5.6 7.4 20.1 10.0 8.3 -0.4 -3.3 0.3 -2.5 5.9 26.22011 6.5 4.2 3.6 6.6 8.1 7.2 -0.2 0.0 -6.1 -2.9 22.2 15.3
2011 Q3 6.7 5.5 4.4 5.9 7.6 8.6 -1.3 -0.2 -8.7 -3.6 25.6 11.1 Q4 5.7 5.5 2.6 4.7 6.4 8.6 -0.8 0.9 -7.9 -3.5 20.8 12.32012 Q1 6.2 6.0 2.5 6.5 6.6 9.8 0.4 2.1 -6.0 -2.0 15.0 20.2 Q2 5.6 5.8 1.6 8.5 5.7 6.6 0.6 1.8 -4.0 -2.5 7.9 25.3
2012 Feb. 6.4 6.1 3.5 6.6 6.8 10.7 0.5 2.5 -6.4 -1.5 15.1 22.6 Mar. 6.2 7.0 2.3 8.5 6.1 9.1 0.8 2.8 -5.3 -2.9 11.3 26.1 Apr. 5.7 6.0 1.9 8.3 5.8 7.0 -0.1 1.9 -5.2 -2.6 6.2 25.4 May 5.3 5.4 1.2 8.2 5.7 5.3 1.1 1.1 -2.2 -2.4 7.4 24.8 June 5.2 5.2 1.4 9.8 5.2 5.7 1.0 1.9 -3.7 -2.0 8.9 25.1 July 5.1 5.6 0.6 10.3 5.0 6.5 0.6 2.0 -5.0 1.5 8.8 27.1
C18 Annual growth rates of short-term debt securities, by sector of the issuer, in all currencies combined
(annual percentage changes)
-60
-40
-20
0
20
40
60
80
1994 1995 1996 1997 1998 1999 2000 2001 2002 2003 2004 2005 2006 2007 2008 2009 2010 2011 2012-60
-40
-20
0
20
40
60
80
general governmentMFIs (including Eurosystem)non-MFI corporations
Source: ECB.1) Annual percentage changes for monthly data refer to the end of the month, whereas those for quarterly and yearly data refer to the annual change in the period average. See the Technical Notes for details.

4.4 Quoted shares issued by euro area residents 1) (EUR billions, unless otherwise indicated; market values)
S 40ECBMonthly BulletinOctober 2012
1. Outstanding amounts and annual growth rates(outstanding amounts as at end of period)
Total MFIs Financial corporations other than MFIs Non-financial corporations
Total Index: Annual Total Annual Total Annual Total AnnualDec. 2008 = 100 growth growth growth growth
rates (%) rates (%) rates (%) rates (%)
1 2 3 4 5 6 7 8 9
2010 July 4,255.2 103.7 1.7 520.0 5.1 338.1 4.5 3,397.0 0.9 Aug. 4,119.5 103.7 1.7 479.0 5.1 314.4 4.1 3,326.2 1.0 Sep. 4,341.2 103.8 1.6 487.3 5.1 326.7 4.0 3,527.2 0.9 Oct. 4,515.5 104.2 1.8 514.7 7.3 333.6 4.0 3,667.2 0.8 Nov. 4,397.9 104.4 1.8 438.0 6.8 316.6 5.4 3,643.3 0.8 Dec. 4,580.5 104.4 1.4 458.7 6.5 334.0 2.3 3,787.7 0.7
2011 Jan. 4,744.5 104.6 1.4 514.6 6.1 365.9 3.0 3,864.0 0.6 Feb. 4,830.5 104.7 1.5 535.3 6.7 379.0 3.9 3,916.2 0.6 Mar. 4,752.5 104.8 1.4 492.0 6.2 363.3 4.1 3,897.2 0.5 Apr. 4,876.0 105.0 1.5 497.9 6.8 371.6 4.1 4,006.5 0.6 May 4,760.8 105.0 1.5 476.3 7.4 356.3 4.1 3,928.1 0.4 June 4,705.6 105.5 1.7 492.0 10.1 350.6 4.6 3,863.0 0.4 July 4,488.0 105.7 1.9 459.1 12.1 325.6 4.9 3,703.3 0.4 Aug. 3,960.2 105.9 2.1 383.3 13.4 281.7 4.9 3,295.2 0.4 Sep. 3,733.4 105.9 2.0 350.9 13.1 264.4 5.8 3,118.1 0.3 Oct. 4,026.4 105.9 1.7 360.8 9.9 288.0 5.8 3,377.6 0.3 Nov. 3,875.5 106.0 1.5 330.1 8.9 271.6 4.6 3,273.8 0.3 Dec. 3,888.1 106.1 1.6 339.7 9.3 270.8 4.9 3,277.6 0.4
2012 Jan. 4,101.0 106.3 1.7 375.9 11.3 298.1 4.0 3,427.0 0.4 Feb. 4,267.1 106.3 1.5 395.1 10.7 311.4 3.1 3,560.6 0.3 Mar. 4,251.1 106.4 1.5 373.5 11.3 311.1 2.8 3,566.5 0.3 Apr. 4,078.2 106.5 1.4 327.7 10.7 292.0 3.1 3,458.6 0.2 May 3,772.2 106.5 1.5 281.2 10.0 260.2 3.4 3,230.8 0.4 June 3,935.4 106.6 1.1 318.0 7.7 280.3 2.8 3,337.1 0.3 July 4,062.0 106.8 1.0 310.1 5.8 287.5 2.8 3,464.4 0.3
C19 Annual growth rates for quoted shares issued by euro area residents
(annual percentage changes)
-4
-2
0
2
4
6
8
10
12
14
2000 2001 2002 2003 2004 2005 2006 2007 2008 2009 2010 2011 2012-4
-2
0
2
4
6
8
10
12
14
MFIsfinancial corporations other than MFIsnon-financial corporations
Source: ECB.1) For details of the calculation of the index and the growth rates, see the Technical Notes.

EURO AREASTATISTICS
Financialmarkets
4.4 Quoted shares issued by euro area residents (EUR billions; market values)
S 41ECB
Monthly BulletinOctober 2012
2. Transactions during the month
Total MFIs Financial corporations other than MFIs Non-financial corporations
Gross issues Redemptions Net issues Gross issues Redemptions Net issues Gross issues Redemptions Net issues Gross issues Redemptions Net issues
1 2 3 4 5 6 7 8 9 10 11 12
2010 July 3.6 0.8 2.7 0.7 0.0 0.7 0.5 0.0 0.5 2.4 0.8 1.6 Aug. 1.5 1.2 0.3 0.0 0.0 0.0 0.0 0.0 0.0 1.4 1.2 0.3 Sep. 1.6 0.2 1.4 0.2 0.0 0.2 0.0 0.0 0.0 1.4 0.2 1.2 Oct. 16.3 0.2 16.0 14.0 0.0 14.0 0.2 0.1 0.1 2.0 0.2 1.9 Nov. 13.5 1.5 12.0 5.9 0.0 5.9 5.5 0.1 5.4 2.1 1.4 0.7 Dec. 3.7 3.5 0.2 0.2 0.0 0.2 0.9 0.3 0.5 2.7 3.2 -0.5
2011 Jan. 6.0 1.3 4.7 1.6 0.0 1.6 2.6 0.0 2.6 1.8 1.3 0.5 Feb. 7.1 0.2 6.9 2.9 0.0 2.9 3.2 0.0 3.2 1.1 0.2 0.8 Mar. 4.4 1.0 3.5 0.1 0.0 0.1 1.0 0.2 0.8 3.3 0.7 2.6 Apr. 9.3 0.6 8.8 2.7 0.0 2.7 0.1 0.0 0.1 6.5 0.6 5.9 May 8.6 8.8 -0.2 6.8 2.1 4.6 0.2 0.0 0.2 1.6 6.6 -5.0 June 23.7 1.3 22.5 14.7 0.0 14.7 2.3 0.3 2.0 6.7 1.0 5.7 July 12.5 0.7 11.8 9.3 0.0 9.3 1.6 0.0 1.6 1.6 0.7 0.9 Aug. 7.1 1.0 6.1 5.5 0.0 5.5 0.3 0.2 0.1 1.3 0.8 0.5 Sep. 2.9 2.9 0.0 0.0 0.9 -0.9 2.3 0.0 2.3 0.5 2.0 -1.4 Oct. 2.4 0.4 2.0 0.0 0.0 0.0 0.1 0.0 0.1 2.3 0.4 1.9 Nov. 2.6 1.5 1.1 0.7 0.0 0.7 1.4 0.0 1.4 0.6 1.5 -1.0 Dec. 5.5 1.0 4.5 1.5 0.0 1.5 1.2 0.0 1.2 2.8 1.0 1.8
2012 Jan. 8.4 0.4 7.9 7.5 0.0 7.5 0.0 0.1 -0.1 0.9 0.3 0.6 Feb. 1.1 1.4 -0.3 0.0 0.0 0.0 0.0 0.2 -0.2 1.0 1.2 -0.1 Mar. 4.9 0.7 4.3 2.0 0.0 2.0 0.0 0.1 -0.1 2.9 0.6 2.3 Apr. 3.1 0.3 2.8 0.0 0.0 0.0 1.1 0.0 1.1 2.0 0.3 1.7 May 4.7 1.8 2.9 1.1 0.0 1.1 1.1 0.1 1.0 2.5 1.7 0.8 June 4.8 1.2 3.6 2.6 0.0 2.6 0.0 0.1 -0.1 2.2 1.1 1.1 July 4.8 0.3 4.5 0.2 0.0 0.2 1.1 0.0 1.1 3.5 0.3 3.2
C20 Gross issues of quoted shares by sector of the issuer
(EUR billions; transactions during the month; market values)
0
5
10
15
20
25
30
35
40
45
1999 2000 2001 2002 2003 2004 2005 2006 2007 2008 2009 2010 2011 20120
5
10
15
20
25
30
35
40
45
non-financial corporationsMFIsfinancial corporations other than MFIs
Source: ECB.

4.5 MFI interest rates on euro-denominated deposits from and loans to euro area residents 1) (percentages per annum; outstanding amounts as at end of period, new business as period average, unless otherwise indicated)
S 42ECBMonthly BulletinOctober 2012
1. Interest rates on deposits (new business)
Deposits from households Deposits from non-financial corporations Repos
Overnight With an agreed maturity of: Redeemable at notice of: 2) Overnight With an agreed maturity of:
Up to 1 year Over 1 and Over 2 years Up to 3 months Over 3 months Up to 1 year Over 1 and Over 2 yearsup to 2 years up to 2 years
1 2 3 4 5 6 7 8 9 10 11
2011 Aug. 0.54 2.73 3.16 2.99 1.74 1.93 0.68 1.67 2.69 2.99 1.42 Sep. 0.55 2.73 3.15 2.92 1.76 1.94 0.70 1.75 2.72 2.79 1.47 Oct. 0.55 2.88 3.17 3.14 1.77 1.96 0.70 1.72 2.74 2.72 1.65 Nov. 0.55 2.78 3.08 3.03 1.78 1.96 0.67 1.53 2.61 2.85 1.62 Dec. 0.54 2.78 3.20 3.06 1.79 1.97 0.65 1.53 2.76 2.90 1.38
2012 Jan. 0.53 2.94 3.49 3.15 1.81 1.96 0.61 1.34 2.95 2.92 1.23 Feb. 0.52 2.90 3.38 3.16 1.81 1.96 0.59 1.26 2.96 3.01 1.05 Mar. 0.51 2.88 3.04 3.03 1.79 1.95 0.58 1.31 2.75 2.98 0.97 Apr. 0.49 2.82 2.92 2.84 1.76 1.95 0.55 1.16 2.70 3.07 1.28 May 0.48 2.65 2.70 2.68 1.74 1.91 0.54 1.07 2.31 2.75 0.93 June 0.47 2.72 2.73 2.63 1.73 1.88 0.52 1.11 2.32 2.69 0.98 July 0.45 2.80 2.89 2.61 1.70 1.85 0.48 1.14 2.01 2.53 1.26
2. Interest rates on loans to households (new business)
Revolving Extended Consumer credit Lending for house purchase Lending to sole proprietors andloans and credit card unincorporated partnerships
overdrafts debt 3) By initial rate fixation APRC 4) By initial rate fixation APRC 4) By initial rate fixation
Floating rate Over 1 Over Floating rate Over 1 Over 5 Over Floating rate Over 1 Overand up to and up to 5 years and up to and up to and up to 10 years and up to and up to 5 years
1 year 5 years 1 year 5 years 10 years 1 year 5 years
1 2 3 4 5 6 7 8 9 10 11 12 13 14
2011 Aug. 8.31 17.10 5.34 6.54 7.97 7.57 3.47 3.96 4.20 4.15 4.16 3.95 4.96 4.39 Sep. 8.41 17.18 5.77 6.57 7.94 7.64 3.41 3.86 4.02 4.02 4.02 3.97 4.86 4.21 Oct. 8.43 17.17 5.60 6.53 7.94 7.54 3.44 3.79 3.86 3.94 3.95 3.98 4.76 4.16 Nov. 8.41 17.11 5.56 6.47 7.78 7.39 3.43 3.74 3.84 3.94 3.96 4.22 4.93 4.02 Dec. 8.37 17.08 5.27 6.44 7.64 7.16 3.49 3.74 3.81 3.95 4.02 4.13 4.84 3.92
2012 Jan. 8.46 17.06 5.62 6.58 8.08 7.57 3.50 3.71 3.75 4.03 4.03 3.88 4.76 3.93 Feb. 8.41 17.05 5.70 6.58 8.09 7.63 3.44 3.64 3.70 3.95 3.92 3.86 4.71 4.04 Mar. 8.39 16.98 5.55 6.44 7.94 7.45 3.31 3.57 3.61 3.91 3.83 3.73 4.74 3.90 Apr. 8.26 17.10 5.43 6.31 7.95 7.35 3.20 3.58 3.59 3.96 3.79 3.65 4.68 3.89 May 8.26 17.10 5.65 6.39 7.95 7.48 3.14 3.54 3.53 3.84 3.72 3.80 4.74 3.83 June 8.25 17.06 5.61 6.27 7.73 7.27 3.11 3.48 3.46 3.69 3.66 3.61 4.73 3.71 July 8.14 17.01 5.76 6.26 7.82 7.37 3.09 3.40 3.31 3.62 3.58 3.64 4.45 3.49
3. Interest rates on loans to non-financial corporations (new business)
Revolving Other loans of up to EUR 0.25 million Other loans of over EUR 1 millionloans and by initial rate fixation by initial rate fixation
overdraftsFloating rate Over 3 months Over 1 Over 3 Over 5 Over Floating rate Over 3 months Over 1 Over 3 Over 5 Over
and up to and up to and up to and up to and up to 10 years and up to and up to and up to and up to and up to 10 years3 months 1 year 3 years 5 years 10 years 3 months 1 year 3 years 5 years 10 years
1 2 3 4 5 6 7 8 9 10 11 12 13
2011 Aug. 4.49 4.44 4.94 4.85 5.03 4.58 4.35 2.79 3.56 3.64 3.99 3.87 4.06 Sep. 4.54 4.59 4.94 4.79 4.94 4.46 4.31 2.84 3.44 3.69 3.63 3.64 3.74 Oct. 4.61 4.70 5.10 4.86 4.99 4.56 4.27 2.98 3.54 3.78 3.89 3.60 3.71 Nov. 4.61 4.77 5.26 4.98 5.10 4.65 4.26 2.80 3.65 3.42 3.92 3.60 3.71 Dec. 4.66 4.89 5.15 4.98 5.05 4.59 4.27 3.04 3.74 3.11 3.95 3.73 3.75
2012 Jan. 4.64 4.93 5.35 4.78 5.04 4.40 4.33 2.66 3.70 3.06 3.45 2.70 3.80 Feb. 4.59 4.86 5.25 4.74 5.02 4.65 4.41 2.50 3.76 3.36 3.89 3.77 3.64 Mar. 4.61 4.81 5.17 4.66 5.00 4.63 4.32 2.39 3.43 3.06 3.09 3.37 3.57 Apr. 4.46 4.96 5.09 4.61 4.85 4.57 4.39 2.39 3.52 3.43 3.40 3.51 3.59 May 4.43 4.82 5.11 4.60 4.84 4.49 4.20 2.37 3.75 3.41 3.48 3.60 3.51 June 4.39 4.81 5.03 4.58 4.76 4.41 4.16 2.44 3.20 3.44 3.03 3.34 3.22 July 4.30 4.86 5.17 4.58 4.56 4.13 4.12 2.23 3.31 3.62 3.13 3.19 3.50
Source: ECB.1) Data refer to the changing composition of the euro area. For further information, see the General Notes.2) For this instrument category, households and non-financial corporations are merged and allocated to the household sector, since the outstanding amounts of non-financial
corporations are negligible compared with those of the household sector when all participating Member States are combined.3) This instrument category excludes convenience credit card debt, i.e. credit granted at an interest rate of 0% during the billing cycle.4) The annual percentage rate of charge (APRC) covers the total cost of a loan. The total cost comprises both an interest rate component and a component incorporating
other (related) charges, such as the cost of inquiries, administration, preparation of documents and guarantees.

EURO AREASTATISTICS
Financialmarkets
4.5 MFI interest rates on euro-denominated deposits from and loans to euro area residents 1), * (percentages per annum; outstanding amounts as at end of period, new business as period average, unless otherwise indicated)
S 43ECB
Monthly BulletinOctober 2012
4. Interest rates on deposits (outstanding amounts)
Deposits from households Deposits from non-financial corporations Repos
Overnight 2) With an agreed maturity of: Redeemable at notice of: 2),3) Overnight 2) With an agreed maturity of:
Up to 2 years Over 2 years Up to 3 months Over 3 months Up to 2 years Over 2 years
1 2 3 4 5 6 7 8 9
2011 Aug. 0.54 2.59 2.77 1.74 1.93 0.68 2.14 3.14 1.97 Sep. 0.55 2.62 2.79 1.76 1.94 0.70 2.18 3.15 2.07 Oct. 0.55 2.66 2.78 1.77 1.96 0.70 2.19 3.14 2.15 Nov. 0.55 2.70 2.80 1.78 1.96 0.67 2.18 3.16 2.24 Dec. 0.54 2.73 2.78 1.79 1.97 0.65 2.18 3.13 2.37
2012 Jan. 0.53 2.76 2.78 1.81 1.96 0.61 2.15 3.16 2.46 Feb. 0.52 2.79 2.80 1.81 1.96 0.59 2.13 3.20 2.62 Mar. 0.51 2.81 2.81 1.79 1.95 0.58 2.05 3.13 2.58 Apr. 0.49 2.78 2.82 1.76 1.95 0.55 2.00 3.09 2.57 May 0.48 2.76 2.80 1.74 1.91 0.54 1.96 3.06 2.39 June 0.47 2.73 2.82 1.73 1.88 0.52 1.94 3.08 2.48 July 0.45 2.72 2.78 1.70 1.85 0.48 1.89 3.04 2.47
5. Interest rates on loans (outstanding amounts)
Loans to households Loans to non-financial corporations
Lending for house purchase Consumer credit and other loans With a maturity of:
with a maturity of: with a maturity of:
Up to 1 year Over 1 and Over 5 years Up to 1 year Over 1 and Over 5 years Up to 1 year Over 1 and Over 5 yearsup to 5 years up to 5 years up to 5 years
1 2 3 4 5 6 7 8 9
2011 Aug. 4.06 3.78 3.89 8.07 6.42 5.31 4.06 3.84 3.72 Sep. 4.13 3.79 3.92 8.14 6.48 5.32 4.11 3.85 3.73 Oct. 4.12 3.78 3.91 8.17 6.44 5.33 4.19 3.86 3.74 Nov. 4.12 3.77 3.91 8.09 6.44 5.34 4.20 3.89 3.75 Dec. 4.12 3.74 3.89 8.11 6.43 5.31 4.26 3.87 3.72
2012 Jan. 4.06 3.71 3.87 8.14 6.40 5.29 4.24 3.82 3.68 Feb. 4.04 3.69 3.86 8.09 6.39 5.27 4.18 3.78 3.67 Mar. 4.03 3.68 3.85 8.07 6.37 5.25 4.16 3.66 3.60 Apr. 3.93 3.64 3.80 7.97 6.31 5.20 4.05 3.61 3.54 May 3.88 3.62 3.77 7.95 6.29 5.16 3.99 3.58 3.50 June 3.86 3.60 3.76 7.83 6.30 5.14 3.96 3.53 3.46 July 3.78 3.54 3.72 7.78 6.26 5.08 3.89 3.47 3.40
C21 New deposits with an agreed maturity
(percentages per annum excluding charges; period averages)
C22 New loans with a floating rate and up to 1 year's initial
rate fixation (percentages per annum excluding charges; period averages)
0.50
1.00
1.50
2.00
2.50
3.00
3.50
4.00
4.50
5.00
2003 2004 2005 2006 2007 2008 2009 2010 2011 20120.50
1.00
1.50
2.00
2.50
3.00
3.50
4.00
4.50
5.00
by households, up to 1 yearby non-financial corporations, up to 1 yearby households, over 2 yearsby non-financial corporations, over 2 years
1.00
2.00
3.00
4.00
5.00
6.00
7.00
8.00
9.00
2003 2004 2005 2006 2007 2008 2009 2010 2011 20121.00
2.00
3.00
4.00
5.00
6.00
7.00
8.00
9.00
to households for consumptionto households for house purchaseto non-financial corporations, up to EUR 1 millionto non-financial corporations, over EUR 1 million
Source: ECB.* For the source of the data in the table and the related footnotes, please see page S42.

4.6 Money market interest rates (percentages per annum; period averages)
S 44ECBMonthly BulletinOctober 2012
Euro area 1), 2) United States Japan
Overnight 1-month 3-month 6-month 12-month 3-month 3-monthdeposits deposits deposits deposits deposits deposits deposits
(EONIA) (EURIBOR) (EURIBOR) (EURIBOR) (EURIBOR) (LIBOR) (LIBOR)
1 2 3 4 5 6 7
2009 0.71 0.89 1.22 1.43 1.61 0.69 0.472010 0.44 0.57 0.81 1.08 1.35 0.34 0.232011 0.87 1.18 1.39 1.64 2.01 0.34 0.19
2011 Q3 0.97 1.38 1.56 1.77 2.11 0.30 0.19 Q4 0.79 1.24 1.50 1.72 2.05 0.48 0.202012 Q1 0.37 0.64 1.04 1.34 1.67 0.51 0.20 Q2 0.34 0.39 0.69 0.98 1.28 0.47 0.20 Q3 0.13 0.16 0.36 0.63 0.90 0.43 0.19
2011 Sep. 1.01 1.35 1.54 1.74 2.07 0.35 0.19 Oct. 0.96 1.36 1.58 1.78 2.11 0.41 0.19 Nov. 0.79 1.23 1.48 1.71 2.04 0.48 0.20 Dec. 0.63 1.14 1.43 1.67 2.00 0.56 0.20
2012 Jan. 0.38 0.84 1.22 1.50 1.84 0.57 0.20 Feb. 0.37 0.63 1.05 1.35 1.68 0.50 0.20 Mar. 0.36 0.47 0.86 1.16 1.50 0.47 0.20 Apr. 0.35 0.41 0.74 1.04 1.37 0.47 0.20 May 0.34 0.39 0.68 0.97 1.27 0.47 0.20 June 0.33 0.38 0.66 0.93 1.22 0.47 0.20 July 0.18 0.22 0.50 0.78 1.06 0.45 0.20 Aug. 0.11 0.13 0.33 0.61 0.88 0.43 0.19 Sep. 0.10 0.12 0.25 0.48 0.74 0.39 0.19
C23 Euro area money market rates 1), 2)
(monthly averages; percentages per annum)
C24 3-month money market rates
(monthly averages; percentages per annum)
0.00
1.00
2.00
3.00
4.00
5.00
6.00
7.00
8.00
9.00
1994 1996 1998 2000 2002 2004 2006 2008 2010 20120.00
1.00
2.00
3.00
4.00
5.00
6.00
7.00
8.00
9.00
1-month rate3-month rate12-month rate
0.00
1.00
2.00
3.00
4.00
5.00
6.00
7.00
8.00
9.00
1994 1996 1998 2000 2002 2004 2006 2008 2010 20120.00
1.00
2.00
3.00
4.00
5.00
6.00
7.00
8.00
9.00
euro areaJapanUnited States
Source: ECB.1) Before January 1999 synthetic euro area rates were calculated on the basis of national rates weighted by GDP. For further information, see the General Notes.2) Data refer to the changing composition of the euro area. For further information, see the General Notes.
1), 2)

EURO AREASTATISTICS
Financialmarkets
4.7 Euro area yield curves 1)
(AAA-rated euro area central government bonds; end of period; rates in percentages per annum; spreads in percentage points)
S 45ECB
Monthly BulletinOctober 2012
Spot rates Instantaneous forward rates
3 months 1 year 2 years 5 years 7 years 10 years 10 years 10 years 1 year 2 years 5 years 10 years- 3 months - 2 years
(spread) (spread)1 2 3 4 5 6 7 8 9 10 11 12
2009 0.38 0.81 1.38 2.64 3.20 3.76 3.38 2.38 1.41 2.44 4.27 5.202010 0.49 0.60 0.93 2.15 2.78 3.36 2.87 2.43 0.85 1.70 3.99 4.692011 0.00 0.09 0.41 1.56 2.13 2.65 2.65 2.24 0.32 1.15 3.24 3.84
2011 Q4 0.00 0.09 0.41 1.56 2.13 2.65 2.65 2.24 0.32 1.15 3.24 3.842012 Q1 0.07 0.16 0.39 1.36 1.95 2.60 2.53 2.21 0.34 0.95 2.97 4.26 Q2 0.04 0.08 0.27 1.17 1.73 2.32 2.27 2.05 0.20 0.76 2.69 3.82 Q3 0.02 -0.01 0.07 0.76 1.29 1.94 1.92 1.87 0.00 0.36 2.10 3.75
2011 Sep. 0.27 0.47 0.75 1.55 1.99 2.48 2.21 1.74 0.74 1.31 2.77 3.79 Oct. 0.38 0.54 0.81 1.71 2.22 2.79 2.41 1.98 0.78 1.39 3.12 4.29 Nov. 0.20 0.38 0.74 1.92 2.51 3.07 2.87 2.33 0.69 1.53 3.64 4.41 Dec. 0.00 0.09 0.41 1.56 2.13 2.65 2.65 2.24 0.32 1.15 3.24 3.84
2012 Jan. 0.11 0.21 0.45 1.44 2.03 2.67 2.55 2.22 0.39 1.03 3.07 4.26 Feb. 0.11 0.15 0.37 1.39 1.99 2.59 2.49 2.22 0.29 0.95 3.06 4.06 Mar. 0.07 0.16 0.39 1.36 1.95 2.60 2.53 2.21 0.34 0.95 2.97 4.26 Apr. 0.03 0.10 0.32 1.26 1.84 2.47 2.44 2.15 0.26 0.85 2.84 4.10 May 0.07 0.05 0.17 0.89 1.36 1.89 1.82 1.72 0.10 0.52 2.17 3.23 June 0.04 0.08 0.27 1.17 1.73 2.32 2.27 2.05 0.20 0.76 2.69 3.82 July 0.00 -0.09 -0.02 0.71 1.25 1.87 1.87 1.89 -0.11 0.26 2.12 3.52 Aug. 0.03 -0.05 0.01 0.75 1.29 1.91 1.88 1.90 -0.08 0.30 2.17 3.55 Sep. 0.02 -0.01 0.07 0.76 1.29 1.94 1.92 1.87 0.00 0.36 2.10 3.75
C25 Euro area spot yield curves 2)
(percentages per annum; end of period)
C26 Euro area spot rates and spreads 2)
(daily data; rates in percentages per annum; spreads in percentage points)
-0.5
0.0
0.5
1.0
1.5
2.0
2.5
3.0
3.5
4.0
0 5yrs 10yrs 15yrs 20yrs 25yrs 30yrs
September 2012August 2012July 2012
-0.5
0.0
0.5
1.0
1.5
2.0
2.5
3.0
3.5
4.0
2010 2011 2012
1-year rate10-year ratespread between 10-year and 3-month ratesspread between 10-year and 2-year rates
Sources: ECB calculations based on underlying data provided by EuroMTS and ratings provided by Fitch Ratings.1) Data refer to the changing composition of the euro area. For further information, see the General Notes.2) Data cover AAA-rated euro area central government bonds.

4.8 Stock market indices (index levels in points; period averages)
S 46ECBMonthly BulletinOctober 2012
Dow Jones EURO STOXX indices 1) United Japan
States Benchmark Main industry indices
Broad 50 Basic Consumer Consumer Oil and Financials Industrials Technology Utilities Telecoms Health care Standard Nikkeiindex materials services goods gas & Poor’s 225
500
1 2 3 4 5 6 7 8 9 10 11 12 13 14
2009 234.2 2,521.0 353.2 140.5 244.5 293.5 172.1 269.7 200.7 353.7 380.4 363.5 946.2 9,321.62010 265.5 2,779.3 463.1 166.2 323.4 307.2 182.8 337.6 224.1 344.9 389.6 408.4 1,140.0 10,006.52011 256.0 2,611.0 493.4 158.1 351.2 311.6 152.6 349.4 222.5 301.7 358.4 432.7 1,267.6 9,425.4
2011 Q3 236.0 2,381.6 463.7 146.0 341.5 282.0 133.8 323.0 199.8 270.2 333.0 435.0 1,225.3 9,246.3 Q4 222.4 2,277.8 427.1 142.1 327.1 295.5 117.2 296.6 201.8 256.5 320.3 432.4 1,225.7 8,580.62012 Q1 243.7 2,473.6 499.1 150.3 372.3 324.6 129.7 333.3 221.7 253.7 300.6 480.6 1,348.8 9,295.3 Q2 224.0 2,226.2 472.5 140.8 370.7 285.3 108.2 311.6 207.4 223.4 261.9 493.2 1,349.7 9,026.5 Q3 238.7 2,400.9 505.9 152.7 392.3 307.8 117.2 327.7 215.9 234.0 265.6 548.5 1,400.9 8,886.4
2011 Sep. 212.6 2,124.3 401.4 137.0 312.8 262.4 113.3 289.2 190.1 246.7 311.1 419.0 1,173.9 8,695.4 Oct. 226.1 2,312.3 424.8 142.4 325.6 290.2 123.1 302.3 203.0 269.9 334.1 426.1 1,207.2 8,733.6 Nov. 219.2 2,239.6 423.6 141.5 325.9 293.5 112.8 292.2 205.7 250.6 316.6 423.3 1,226.4 8,506.1 Dec. 222.2 2,283.3 433.2 142.4 329.9 302.9 115.9 295.5 196.6 249.3 310.3 448.4 1,243.3 8,506.0
2012 Jan. 233.4 2,382.1 477.6 146.9 351.8 317.3 120.4 319.2 206.9 248.8 305.0 473.6 1,300.6 8,616.7 Feb. 247.2 2,508.2 507.2 152.1 377.3 327.0 134.4 336.3 223.9 254.6 300.1 477.6 1,352.5 9,242.3 Mar. 250.7 2,532.2 512.9 152.0 388.0 329.5 134.6 344.6 234.3 257.7 296.7 490.5 1,389.2 9,962.3 Apr. 235.0 2,340.8 497.6 145.9 380.9 301.1 116.8 327.8 221.2 237.7 275.2 488.5 1,386.4 9,627.4 May 221.9 2,198.5 469.5 139.7 373.7 281.6 105.0 310.4 204.5 218.9 261.4 492.0 1,341.3 8,842.5 June 216.2 2,152.7 453.1 137.4 358.3 275.1 104.0 298.4 198.0 215.4 250.4 498.9 1,323.5 8,638.1 July 226.5 2,258.4 479.1 145.8 379.4 290.4 106.5 313.9 204.4 224.3 257.3 534.2 1,359.8 8,760.7 Aug. 240.5 2,424.5 509.4 154.6 399.7 313.0 116.8 330.3 220.8 231.8 265.7 552.5 1,403.4 8,949.9 Sep. 250.1 2,530.7 531.4 158.2 398.1 321.0 129.5 339.8 223.0 247.2 274.6 559.7 1,443.4 8,948.6
C27 Dow Jones EURO STOXX broad index, Standard & Poor's 500 and Nikkei 225
(January 1994 = 100; monthly averages)
0
50
100
150
200
250
300
350
1994 1995 1996 1997 1998 1999 2000 2001 2002 2003 2004 2005 2006 2007 2008 2009 2010 2011 20120
50
100
150
200
250
300
350
Dow Jones EURO STOXX broad indexStandard & Poor’s 500Nikkei 225
Source: ECB.1) Data refer to the changing composition of the euro area. For further information, see the General Notes.
1)
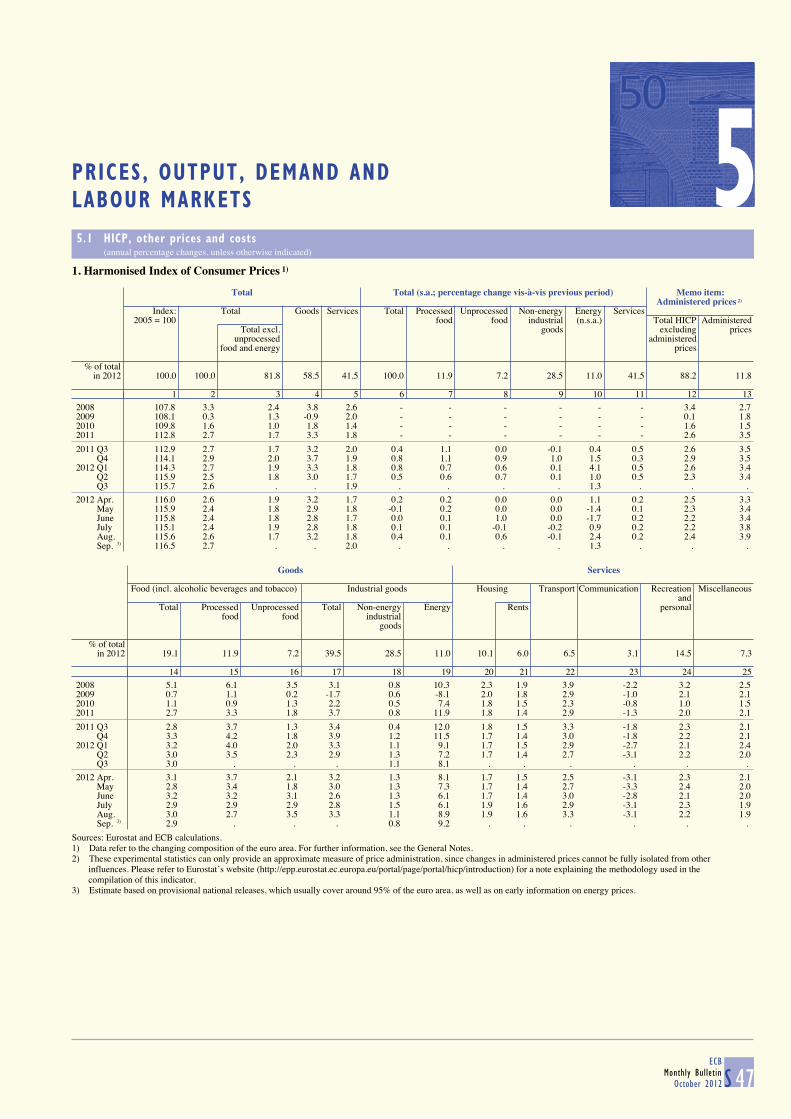
LABOUR MARKETS 5PRICES, OUTPUT, DEMAND AND
5.1 HICP, other prices and costs (annual percentage changes, unless otherwise indicated)
S 47ECB
Monthly BulletinOctober 2012
1. Harmonised Index of Consumer Prices 1)
Total Total (s.a.; percentage change vis-à-vis previous period) Memo item: Administered prices 2)
Index: Total Goods Services Total Processed Unprocessed Non-energy Energy Services2005 = 100 food food industrial (n.s.a.) Total HICP Administered
Total excl. goods excluding pricesunprocessed administered
food and energy prices
% of totalin 2012 100.0 100.0 81.8 58.5 41.5 100.0 11.9 7.2 28.5 11.0 41.5 88.2 11.8
1 2 3 4 5 6 7 8 9 10 11 12 13
2008 107.8 3.3 2.4 3.8 2.6 - - - - - - 3.4 2.72009 108.1 0.3 1.3 -0.9 2.0 - - - - - - 0.1 1.82010 109.8 1.6 1.0 1.8 1.4 - - - - - - 1.6 1.52011 112.8 2.7 1.7 3.3 1.8 - - - - - - 2.6 3.5
2011 Q3 112.9 2.7 1.7 3.2 2.0 0.4 1.1 0.0 -0.1 0.4 0.5 2.6 3.5 Q4 114.1 2.9 2.0 3.7 1.9 0.8 1.1 0.9 1.0 1.5 0.3 2.9 3.52012 Q1 114.3 2.7 1.9 3.3 1.8 0.8 0.7 0.6 0.1 4.1 0.5 2.6 3.4 Q2 115.9 2.5 1.8 3.0 1.7 0.5 0.6 0.7 0.1 1.0 0.5 2.3 3.4 Q3 115.7 2.6 . . 1.9 . . . . 1.3 . . .
2012 Apr. 116.0 2.6 1.9 3.2 1.7 0.2 0.2 0.0 0.0 1.1 0.2 2.5 3.3 May 115.9 2.4 1.8 2.9 1.8 -0.1 0.2 0.0 0.0 -1.4 0.1 2.3 3.4 June 115.8 2.4 1.8 2.8 1.7 0.0 0.1 1.0 0.0 -1.7 0.2 2.2 3.4 July 115.1 2.4 1.9 2.8 1.8 0.1 0.1 -0.1 -0.2 0.9 0.2 2.2 3.8 Aug. 115.6 2.6 1.7 3.2 1.8 0.4 0.1 0.6 -0.1 2.4 0.2 2.4 3.9 Sep. 3) 116.5 2.7 . . 2.0 . . . . 1.3 . . .
Goods Services
Food (incl. alcoholic beverages and tobacco) Industrial goods Housing Transport Communication Recreation Miscellaneous
andTotal Processed Unprocessed Total Non-energy Energy Rents personal
food food industrialgoods
% of totalin 2012 19.1 11.9 7.2 39.5 28.5 11.0 10.1 6.0 6.5 3.1 14.5 7.3
14 15 16 17 18 19 20 21 22 23 24 25
2008 5.1 6.1 3.5 3.1 0.8 10.3 2.3 1.9 3.9 -2.2 3.2 2.52009 0.7 1.1 0.2 -1.7 0.6 -8.1 2.0 1.8 2.9 -1.0 2.1 2.12010 1.1 0.9 1.3 2.2 0.5 7.4 1.8 1.5 2.3 -0.8 1.0 1.52011 2.7 3.3 1.8 3.7 0.8 11.9 1.8 1.4 2.9 -1.3 2.0 2.1
2011 Q3 2.8 3.7 1.3 3.4 0.4 12.0 1.8 1.5 3.3 -1.8 2.3 2.1 Q4 3.3 4.2 1.8 3.9 1.2 11.5 1.7 1.4 3.0 -1.8 2.2 2.12012 Q1 3.2 4.0 2.0 3.3 1.1 9.1 1.7 1.5 2.9 -2.7 2.1 2.4 Q2 3.0 3.5 2.3 2.9 1.3 7.2 1.7 1.4 2.7 -3.1 2.2 2.0 Q3 3.0 . . . 1.1 8.1 . . . . . .
2012 Apr. 3.1 3.7 2.1 3.2 1.3 8.1 1.7 1.5 2.5 -3.1 2.3 2.1 May 2.8 3.4 1.8 3.0 1.3 7.3 1.7 1.4 2.7 -3.3 2.4 2.0 June 3.2 3.2 3.1 2.6 1.3 6.1 1.7 1.4 3.0 -2.8 2.1 2.0 July 2.9 2.9 2.9 2.8 1.5 6.1 1.9 1.6 2.9 -3.1 2.3 1.9 Aug. 3.0 2.7 3.5 3.3 1.1 8.9 1.9 1.6 3.3 -3.1 2.2 1.9 Sep. 3) 2.9 . . . 0.8 9.2 . . . . . .
Sources: Eurostat and ECB calculations.1) Data refer to the changing composition of the euro area. For further information, see the General Notes.2) These experimental statistics can only provide an approximate measure of price administration, since changes in administered prices cannot be fully isolated from other influences. Please refer to Eurostat’s website (http://epp.eurostat.ec.europa.eu/portal/page/portal/hicp/introduction) for a note explaining the methodology used in the compilation of this indicator.3) Estimate based on provisional national releases, which usually cover around 95% of the euro area, as well as on early information on energy prices.
5

5.1 HICP, other prices and costs (annual percentage changes, unless otherwise indicated)
S 48ECBMonthly BulletinOctober 2012
2. Industry, construction and residential property prices
Industrial producer prices excluding construction Construct- Residential
ion 1) propertyTotal Total Industry excluding construction and energy Energy prices 2)
(index: 2005 = 100) Manu- Total Intermediate Capital Consumer goods
facturing goods goodsTotal Durable Non-durable
% of totalin 2005 100.0 100.0 82.8 75.6 30.0 22.0 23.7 2.7 21.0 24.4
1 2 3 4 5 6 7 8 9 10 11 12
2008 114.4 6.1 4.8 3.4 3.9 2.1 3.9 2.8 4.1 14.2 3.9 1.92009 108.6 -5.1 -5.4 -2.9 -5.3 0.4 -2.1 1.2 -2.5 -11.8 0.1 -3.22010 111.7 2.9 3.4 1.6 3.5 0.3 0.4 0.9 0.3 6.4 1.9 1.12011 118.3 5.9 5.5 3.8 5.9 1.4 3.1 2.1 3.3 11.9 3.3 1.0
2011 Q2 118.5 6.3 5.8 4.3 6.8 1.3 3.4 1.9 3.7 11.9 3.0 1.1 Q3 118.9 5.9 5.5 3.8 5.6 1.5 3.3 2.2 3.5 11.8 3.2 1.1 Q4 119.3 5.1 4.5 2.9 3.4 1.5 3.3 2.5 3.4 11.4 2.8 -0.32012 Q1 121.0 3.7 3.0 1.7 1.2 1.2 2.9 2.3 3.0 9.5 1.8 -0.9 Q2 121.1 2.2 1.6 1.1 0.4 1.2 2.0 1.9 2.0 5.9 1.7 -1.4
2012 Mar. 121.7 3.5 2.6 1.6 0.9 1.2 2.8 2.3 2.8 9.0 - - Apr. 121.7 2.6 2.0 1.3 0.6 1.2 2.2 2.0 2.3 6.7 - - May 121.1 2.3 1.8 1.1 0.5 1.2 1.9 1.9 1.9 6.3 - - June 120.5 1.8 1.1 0.9 0.1 1.1 1.8 1.9 1.9 4.7 - - July 120.8 1.6 1.1 0.8 -0.2 1.1 1.9 1.8 2.0 4.5 - - Aug. 121.9 2.7 2.2 1.0 0.3 0.9 2.1 1.6 2.1 7.9 - -
3. Commodity prices and gross domestic product deflators
Oil prices 3) Non-energy commodity prices GDP deflators
(EUR per barrel) Import-weighted 4) Use-weighted 5) Total Total Domestic demand Exports 6) Imports 6)
(s.a.; index:Total Food Non-food Total Food Non-food 2005 = 100) Total Private Government Gross
consump- consump- fixedtion tion capital
formation
% of total 100.0 35.0 65.0 100.0 45.0 55.0
1 2 3 4 5 6 7 8 9 10 11 12 13 14 15
2008 65.9 2.0 18.4 -4.4 -1.7 9.7 -8.6 106.2 2.0 2.6 2.7 2.7 2.3 2.4 3.92009 44.6 -18.5 -8.9 -23.1 -18.0 -11.4 -22.8 107.3 1.0 -0.1 -0.4 2.0 -0.3 -3.5 -6.32010 60.7 44.6 21.4 57.9 42.1 27.1 54.5 108.2 0.8 1.5 1.7 0.7 0.9 3.1 5.02011 79.7 12.2 22.4 7.7 12.8 20.7 7.5 109.5 1.2 2.0 2.5 1.0 2.0 3.6 5.7
2011 Q3 79.3 3.8 16.7 -1.6 4.9 11.6 0.3 109.6 1.2 2.0 2.4 1.1 2.1 3.1 5.2 Q4 80.7 -2.5 3.6 -5.2 -1.7 4.3 -6.0 109.9 1.3 2.0 2.5 1.3 2.0 2.7 4.62012 Q1 90.1 -5.8 -7.6 -4.9 -4.8 -3.7 -5.6 110.3 1.2 1.7 2.3 0.9 2.0 1.9 3.1 Q2 84.6 -1.1 -3.4 0.1 1.1 4.1 -1.2 110.7 1.3 1.7 2.0 0.9 1.6 1.5 2.4 Q3 87.3 5.2 10.4 2.7 7.8 16.0 1.6 . . . . . . . .
2012 Apr. 91.4 -3.8 -5.1 -3.1 -2.5 0.3 -4.5 - - - - - - - - May 86.0 -0.3 -2.9 1.1 2.4 5.3 0.2 - - - - - - - - June 76.4 0.8 -2.1 2.3 3.4 6.7 0.9 - - - - - - - - July 83.4 4.7 11.6 1.3 7.1 17.4 -0.5 - - - - - - - - Aug. 90.5 6.5 11.6 3.9 8.6 16.3 2.6 - - - - - - - - Sep. 88.0 4.6 8.0 2.9 7.7 14.2 2.8 - - - - - - - -
Sources: Eurostat, ECB calculations based on Eurostat data (column 7 in Table 2 in Section 5.1 and columns 8-15 in Table 3 in Section 5.1), ECB calculations based onThomson Reuters data (column 1 in Table 3 in Section 5.1) and ECB calculations (column 12 in Table 2 in Section 5.1 and columns 2-7 in Table 3 in Section 5.1).1) Input prices for residential buildings.2) Experimental data based on non-harmonised national sources (see http://www.ecb.europa.eu/stats/intro/html/experiment.en.html for further details).3) Brent Blend (for one-month forward delivery).4) Refers to prices expressed in euro. Weighted according to the structure of euro area imports in the period 2004-06.5) Refers to prices expressed in euro. Weighted according to euro area domestic demand (domestic production plus imports minus exports) in the period 2004-06. Experimental data
(see http://www.ecb.europa.eu/stats/intro/html/experiment.en.html for details).6) Deflators for exports and imports refer to goods and services and include cross-border trade within the euro area.

EURO AREASTATISTICS
Prices, output,demand and
labour markets
5.1 HICP, other prices and costs (annual percentage changes)
S 49ECB
Monthly BulletinOctober 2012
4. Unit labour costs, compensation per labour input and labour productivity(quarterly data seasonally adjusted; annual data unadjusted)
Unit labour costs 1)
Total Total By economic activity
(index:2005 = 100) Agriculture, Manufactu- Construction Trade, Information Finance Real estate Professional, Public admi- Arts, enter-
forestry ring, energy transport, and commu- and business and nistration, tainmentand fishing and utilities accommoda- nication insurance support education, and other
tion and services health and servicesfood social
services work1 2 3 4 5 6 7 8 9 10 11 12
2010 109.3 -0.9 4.8 -7.6 2.8 -1.0 -0.8 0.7 3.1 0.9 0.9 1.72011 110.4 1.0 -2.5 -0.2 0.7 0.9 2.9 0.9 4.3 2.9 0.8 1.3
2011 Q3 110.4 1.1 -3.8 -0.2 0.1 1.8 3.2 -0.1 3.5 2.8 1.0 1.2 Q4 111.2 1.5 -2.8 1.9 -1.2 1.7 3.9 -0.8 4.3 3.5 0.7 1.32012 Q1 111.6 1.5 -2.8 2.7 0.7 1.8 4.0 0.3 1.9 2.3 0.7 1.5 Q2 112.1 1.5 . . . . . . . . . .
Compensation per employee
2010 111.6 1.7 2.5 3.8 1.7 1.8 2.7 2.0 3.1 0.8 0.9 1.22011 114.1 2.2 2.0 3.2 3.8 2.1 2.2 1.1 2.5 2.9 1.2 1.2
2011 Q3 114.3 2.2 1.8 3.0 3.1 2.2 2.2 1.3 3.2 3.0 1.5 1.1 Q4 115.0 2.2 1.6 2.2 4.4 2.3 2.2 -0.2 1.8 3.5 1.6 2.02012 Q1 115.7 1.9 1.4 2.1 3.0 2.1 2.6 1.0 2.5 2.7 1.3 2.0 Q2 116.0 1.6 . . . . . . . . . .
Labour productivity per person employed 2)
2010 102.1 2.5 -2.2 12.3 -1.1 2.8 3.5 1.3 0.0 -0.1 0.0 -0.52011 103.4 1.2 4.5 3.4 3.1 1.2 -0.6 0.2 -1.7 0.0 0.4 -0.1
2011 Q3 103.5 1.0 5.9 3.2 3.0 0.4 -0.9 1.4 -0.3 0.2 0.5 -0.1 Q4 103.4 0.7 4.6 0.3 5.7 0.6 -1.6 0.7 -2.4 -0.1 0.8 0.72012 Q1 103.7 0.4 4.3 -0.7 2.3 0.3 -1.4 0.7 0.6 0.4 0.6 0.5 Q2 103.5 0.2 2.7 -0.8 2.9 0.1 -1.5 2.0 -0.6 -0.6 0.6 0.0
Compensation per hour worked
2010 113.6 1.1 0.8 1.1 2.0 1.5 1.9 1.6 2.3 0.0 0.8 1.32011 116.0 2.1 -0.2 2.4 4.2 2.3 2.2 0.8 1.9 2.7 1.4 1.7
2011 Q3 116.1 2.2 0.1 2.6 3.7 2.2 2.2 0.9 1.9 2.9 1.8 1.8 Q4 117.0 2.2 -0.3 2.4 5.4 2.3 1.9 -0.7 2.4 3.1 1.3 2.02012 Q1 117.3 2.1 4.4 1.7 4.2 2.3 3.0 1.6 5.3 3.2 1.0 2.3 Q2 118.1 1.8 . . . . . . . . . .
Hourly labour productivity 2)
2010 104.1 2.0 -2.8 9.4 -1.1 2.4 2.8 0.8 -1.0 -0.8 -0.1 -0.22011 105.4 1.3 3.5 2.9 3.3 1.6 -0.6 -0.1 -2.4 -0.1 0.5 0.4
2011 Q3 105.6 1.2 5.7 3.1 3.2 0.6 -1.1 1.0 -1.5 0.2 0.8 0.3 Q4 105.7 0.8 3.6 0.5 6.3 0.9 -1.6 0.4 -2.0 -0.3 0.6 0.72012 Q1 105.7 0.7 5.5 -0.9 3.4 0.8 -1.1 1.2 2.5 0.8 0.2 0.7 Q2 105.9 0.3 3.3 -1.3 4.6 0.3 -1.6 2.9 0.4 -0.3 0.2 0.2
5. Labour cost indices 3)
Total Total By component For selected economic activities Memo item:
(index: Indicator2008 = 100) Wages and Employers’ social Mining, Construction Services of
salaries contributions manufacturing negotiatedand energy wages 4)
% of totalin 2008 100.0 100.0 75.2 24.8 32.4 9.0 58.6
1 2 3 4 5 6 7 8
2010 104.3 1.6 1.4 2.2 1.2 1.7 1.9 1.72011 106.5 2.1 2.0 2.7 3.0 2.5 2.5 2.0
2011 Q3 104.0 2.2 2.0 2.8 2.8 2.6 2.5 2.1 Q4 113.0 2.2 2.1 2.6 3.3 3.0 2.5 2.02012 Q1 100.3 1.5 1.5 1.4 1.4 1.2 1.8 2.0 Q2 112.0 1.6 1.7 1.2 2.3 2.1 1.9 2.2
Sources: Eurostat, ECB calculations based on Eurostat data (Table 4 in Section 5.1) and ECB calculations (column 8 in Table 5 in Section 5.1).1) Compensation (at current prices) per employee divided by labour productivity per person employed.2) Total GDP and value added by economic activity (volumes) per labour input (persons employed and hours worked).3) Hourly labour cost indices for the whole economy, excluding agriculture, forestry and fishing. Owing to differences in coverage, the estimates for the components may not be
consistent with the total.4) Experimental data (see http://www.ecb.europa.eu/stats/intro/html/experiment.en.html for further details).

5.2 Output and demand (quarterly data seasonally adjusted; annual data unadjusted)
S 50ECBMonthly BulletinOctober 2012
1. GDP and expenditure components
Current prices (EUR billions)
GDP
Total Domestic demand External balance 1)
Total Private Government Gross fixed Changes in Total Exports 1) Imports 1)
consumption consumption capital inventories 2)
formation
1 2 3 4 5 6 7 8 9
2008 9,244.5 9,157.3 5,209.0 1,898.2 1,988.3 61.7 87.2 3,885.8 3,798.62009 8,923.5 8,806.3 5,138.3 1,987.1 1,728.8 -47.9 117.2 3,286.4 3,169.22010 9,181.0 9,057.8 5,277.0 2,017.3 1,742.0 21.4 123.2 3,767.0 3,643.82011 9,425.3 9,286.7 5,414.7 2,033.1 1,802.9 36.1 138.6 4,142.5 4,003.9
2011 Q2 2,355.4 2,328.0 1,349.2 508.3 450.6 20.0 27.4 1,027.1 999.6 Q3 2,363.5 2,325.6 1,357.7 508.2 450.8 8.9 37.8 1,046.3 1,008.5 Q4 2,361.1 2,314.5 1,359.5 509.6 450.1 -4.8 46.7 1,047.4 1,000.72012 Q1 2,368.7 2,319.2 1,364.7 512.3 447.8 -5.6 49.5 1,062.5 1,013.0 Q2 2,374.7 2,318.6 1,365.4 513.2 443.9 -3.9 56.1 1,077.4 1,021.3
percentage of GDP
2011 100.0 98.5 57.4 21.6 19.1 0.4 1.5 - -
Chain-linked volumes (prices for the previous year)
quarter-on-quarter percentage changes
2011 Q2 0.2 0.1 -0.4 0.0 -0.2 - - 0.6 0.2 Q3 0.1 -0.4 0.2 -0.2 -0.4 - - 1.5 0.5 Q4 -0.3 -0.9 -0.5 0.0 -0.5 - - -0.2 -1.42012 Q1 0.0 -0.4 -0.2 0.2 -1.3 - - 0.7 -0.2 Q2 -0.2 -0.4 -0.2 0.1 -0.8 - - 1.3 0.9
annual percentage changes
2008 0.4 0.3 0.4 2.3 -1.1 - - 1.1 1.02009 -4.4 -3.8 -1.0 2.6 -12.8 - - -12.4 -11.02010 2.0 1.3 1.0 0.8 -0.1 - - 11.1 9.52011 1.4 0.5 0.1 -0.2 1.4 - - 6.1 4.0
2011 Q2 1.6 0.9 0.3 0.0 1.3 - - 6.1 4.5 Q3 1.3 0.4 0.2 -0.4 0.7 - - 5.7 3.5 Q4 0.6 -0.7 -0.8 -0.3 0.8 - - 3.4 0.42012 Q1 0.0 -1.6 -1.0 0.0 -2.4 - - 2.6 -0.9 Q2 -0.5 -2.1 -0.7 0.1 -3.0 - - 3.4 -0.3
contributions to quarter-on-quarter percentage changes in GDP; percentage points
2011 Q2 0.2 0.1 -0.2 0.0 0.0 0.4 0.2 - - Q3 0.1 -0.4 0.1 0.0 -0.1 -0.3 0.4 - - Q4 -0.3 -0.9 -0.3 0.0 -0.1 -0.5 0.5 - - 2012 Q1 0.0 -0.4 -0.1 0.0 -0.3 -0.1 0.4 - - Q2 -0.2 -0.4 -0.1 0.0 -0.2 -0.2 0.2 - -
contributions to annual percentage changes in GDP; percentage points
2008 0.4 0.3 0.2 0.5 -0.2 -0.2 0.1 - - 2009 -4.4 -3.7 -0.6 0.5 -2.8 -0.9 -0.7 - - 2010 2.0 1.3 0.6 0.2 0.0 0.6 0.7 - - 2011 1.4 0.5 0.1 0.0 0.3 0.2 0.9 - -
2011 Q2 1.6 0.9 0.1 0.0 0.2 0.5 0.7 - - Q3 1.3 0.3 0.1 -0.1 0.1 0.2 0.9 - - Q4 0.6 -0.7 -0.5 -0.1 0.2 -0.3 1.3 - - 2012 Q1 0.0 -1.6 -0.6 0.0 -0.5 -0.6 1.5 - - Q2 -0.5 -2.0 -0.4 0.0 -0.6 -1.1 1.6 - -
Sources: Eurostat and ECB calculations.
1) Exports and imports cover goods and services and include cross-border intra-euro area trade. They are not fully consistent with: Section 3.1; Table 1 of Section 7.1; Table 3 of Section 7.2; or Tables 1 or 3 of Section 7.5.2) Including acquisitions less disposals of valuables.

EURO AREASTATISTICS
Prices, output,demand and
labour markets
5.2 Output and demand (quarterly data seasonally adjusted; annual data unadjusted)
S 51ECB
Monthly BulletinOctober 2012
2. Value added by economic activity
Current prices (EUR billions)
Gross value added (basic prices) Taxes less
subsidiesTotal Agriculture, Manufactu- Construction Trade, Information Finance Real estate Professional, Public admi- Arts, enter- on
forestry ring, energy transport, and commu- and business and nistration, tainment productsand fishing and utilities accommoda- nication insurance support education, and other
tion and services health and servicesfood services social work
1 2 3 4 5 6 7 8 9 10 11 12
2008 8,299.3 142.2 1,651.8 561.6 1,595.9 356.8 385.4 931.0 860.1 1,521.8 292.6 945.22009 8,030.0 124.5 1,469.1 534.1 1,540.2 360.9 415.4 903.3 803.1 1,582.2 297.2 893.52010 8,239.9 136.9 1,579.6 507.5 1,581.4 362.2 426.6 917.8 814.2 1,611.6 302.2 941.12011 8,451.7 142.6 1,649.3 511.7 1,634.8 360.1 424.5 947.0 841.4 1,633.6 306.8 973.6
2011 Q2 2,110.7 35.9 412.8 127.6 406.9 89.9 105.8 236.8 210.2 408.7 76.1 244.8 Q3 2,118.6 35.2 414.1 127.4 410.2 90.1 106.6 237.9 211.0 409.1 76.8 244.9 Q4 2,118.9 35.6 410.0 128.1 411.8 89.7 106.1 238.7 211.9 409.4 77.5 242.22012 Q1 2,124.8 36.7 410.6 127.0 411.4 89.6 107.0 238.9 213.1 412.4 78.1 243.9 Q2 2,129.9 37.0 412.8 126.9 411.2 89.2 106.3 240.6 213.3 414.9 77.8 244.8
percentage of value added
2011 100.0 1.7 19.5 6.1 19.3 4.3 5.0 11.2 10.0 19.3 3.6 -
Chain-linked volumes (prices for the previous year)
quarter-on-quarter percentage changes
2011 Q2 0.2 0.7 0.3 -1.1 0.2 0.0 -0.2 0.7 0.7 0.4 -0.4 0.3 Q3 0.1 0.7 0.0 -0.7 0.1 0.3 0.5 0.1 0.1 0.2 0.6 -0.2 Q4 -0.3 -0.1 -1.6 -0.1 -0.2 0.1 -0.1 0.3 -0.1 0.2 0.3 -0.92012 Q1 0.0 1.7 0.1 -1.0 0.0 -0.1 0.1 0.2 0.0 -0.3 0.3 0.1 Q2 -0.1 -0.4 -0.3 -0.7 -0.4 -0.1 0.6 0.1 -0.4 0.4 -0.7 -0.7
annual percentage changes
2008 0.6 2.0 -2.3 -1.1 0.9 2.7 1.3 1.2 1.6 2.0 1.8 -1.32009 -4.5 0.7 -13.1 -7.5 -4.7 1.7 0.8 0.4 -7.6 1.2 -0.4 -4.22010 2.1 -3.1 9.1 -4.9 2.1 2.2 0.5 -0.4 1.5 1.0 0.4 1.02011 1.5 2.0 3.5 -1.0 1.8 1.1 -0.1 1.2 2.6 0.6 0.1 0.4
2011 Q2 1.7 1.9 4.5 -2.1 2.1 1.2 -1.1 1.3 3.1 0.6 -0.7 0.6 Q3 1.5 3.5 3.6 -1.5 1.3 1.0 1.1 1.1 2.2 0.6 0.2 -0.4 Q4 0.8 1.7 0.4 0.3 0.9 0.5 0.6 1.2 1.9 0.7 0.5 -1.32012 Q1 0.0 3.0 -1.2 -2.9 0.1 0.2 0.2 1.4 0.6 0.4 0.8 -0.7 Q2 -0.3 1.9 -1.7 -2.5 -0.5 0.2 1.1 0.8 -0.4 0.5 0.6 -1.6
contributions to quarter-on-quarter percentage changes in value added; percentage points
2011 Q2 0.2 0.0 0.1 -0.1 0.0 0.0 0.0 0.1 0.1 0.1 0.0 - Q3 0.1 0.0 0.0 0.0 0.0 0.0 0.0 0.0 0.0 0.0 0.0 - Q4 -0.3 0.0 -0.3 0.0 0.0 0.0 0.0 0.0 0.0 0.0 0.0 - 2012 Q1 0.0 0.0 0.0 -0.1 0.0 0.0 0.0 0.0 0.0 -0.1 0.0 - Q2 -0.1 0.0 0.0 0.0 -0.1 0.0 0.0 0.0 0.0 0.1 0.0 -
contributions to annual percentage changes in value added; percentage points
2008 0.6 0.0 -0.5 -0.1 0.2 0.1 0.1 0.1 0.2 0.4 0.1 - 2009 -4.5 0.0 -2.6 -0.5 -0.9 0.1 0.0 0.0 -0.8 0.2 0.0 - 2010 2.1 0.0 1.7 -0.3 0.4 0.1 0.0 0.0 0.2 0.2 0.0 - 2011 1.5 0.0 0.7 -0.1 0.4 0.0 0.0 0.1 0.3 0.1 0.0 -
2011 Q2 1.7 0.0 0.9 -0.1 0.4 0.1 -0.1 0.1 0.3 0.1 0.0 - Q3 1.5 0.1 0.7 -0.1 0.3 0.0 0.1 0.1 0.2 0.1 0.0 - Q4 0.8 0.0 0.1 0.0 0.2 0.0 0.0 0.1 0.2 0.1 0.0 - 2012 Q1 0.0 0.1 -0.2 -0.2 0.0 0.0 0.0 0.2 0.1 0.1 0.0 - Q2 -0.3 0.0 -0.3 -0.2 -0.1 0.0 0.1 0.1 0.0 0.1 0.0 -
Sources: Eurostat and ECB calculations.

5.2 Output and demand (annual percentage changes, unless otherwise indicated)
S 52ECBMonthly BulletinOctober 2012
3. Industrial production
Total Industry excluding construction Construction
Total Total Industry excluding construction and energy Energy
(s.a.; index: 2005 = 100) Manu- Total Intermediate Capital Consumer goods
facturing goods goodsTotal Durable Non-durable
% of totalin 2005 100.0 77.8 77.8 69.2 68.7 28.1 22.3 18.3 2.6 15.7 9.1 22.2
1 2 3 4 5 6 7 8 9 10 11 12
2009 -13.7 90.5 -14.9 -15.9 -16.1 -19.2 -20.9 -5.0 -17.4 -3.0 -5.4 -8.02010 4.1 97.1 7.3 7.7 7.7 10.0 9.2 3.0 2.7 3.1 3.8 -8.02011 2.4 100.5 3.4 4.6 4.6 4.0 8.8 0.5 0.7 0.5 -4.4 -0.9
2011 Q3 3.5 101.4 3.8 4.6 4.6 3.6 9.6 0.5 2.2 0.3 -2.6 1.9 Q4 0.0 99.3 -0.2 0.9 1.0 -0.4 3.8 -0.7 -2.9 -0.3 -7.7 2.12012 Q1 -2.5 98.8 -1.8 -1.5 -1.4 -3.1 1.7 -3.0 -5.1 -2.7 -3.5 -6.4 Q2 -3.2 98.3 -2.4 -2.8 -2.8 -4.1 -1.2 -3.0 -5.3 -2.7 1.2 -5.8
2012 Feb. -3.6 99.1 -1.8 -2.6 -2.6 -4.6 1.0 -4.7 -5.7 -4.5 3.8 -14.9 Mar. -2.0 99.0 -1.7 -1.1 -0.9 -2.8 2.5 -2.4 -6.1 -1.9 -6.4 -2.8 Apr. -3.4 97.9 -2.6 -3.3 -3.4 -4.6 -1.0 -4.2 -6.9 -3.8 2.6 -6.0 May -3.9 98.8 -2.6 -2.9 -3.1 -3.9 -1.8 -2.6 -6.5 -2.1 -0.5 -8.0 June -2.4 98.3 -2.0 -2.3 -2.0 -3.7 -0.8 -2.2 -2.5 -2.2 1.3 -2.7 July -3.6 98.9 -2.8 -2.7 -2.6 -4.0 -1.7 -3.5 -10.4 -2.5 0.0 -6.0
month-on-month percentage changes (s.a.)
2012 Feb. -0.9 - 0.7 -0.5 -0.5 -1.3 0.9 -1.3 -1.6 -1.3 8.0 -9.5 Mar. 0.9 - -0.1 1.1 1.1 1.0 1.2 1.4 -0.1 1.6 -8.4 10.9 Apr. -1.1 - -1.1 -1.9 -1.9 -1.3 -2.9 -1.1 -1.0 -1.7 5.3 -3.4 May 0.1 - 0.9 1.2 0.9 0.6 1.2 1.3 0.3 2.0 -1.2 0.2 June -0.4 - -0.6 -0.7 -0.8 -0.5 -1.2 -0.6 0.3 -0.9 1.3 -0.5 July 0.3 - 0.6 1.0 0.8 0.3 2.1 -0.7 -0.8 -0.4 -1.1 0.0
4. Industrial new orders and turnover, retail sales and new passenger car registrations
Industrial new orders 1) Industrial turnover Retail sales (including automotive fuel) New passenger car
registrations Manufacturing 2) Manufacturing Current prices Constant prices (current prices) (current prices)
Total Total Total Total Total Total Total Food, Non-food Fuel Total (s.a.; Total
(s.a.; index: (s.a.; index: (s.a.; index: beverages, thousands) 3)
2005 = 100) 2005 = 100) 2005 = 100) tobacco Textiles, Householdclothing, equipmentfootwear
% of totalin 2005 100.0 100.0 100.0 100.0 100.0 100.0 100.0 38.4 51.0 9.0 12.8 10.6
1 2 3 4 5 6 7 8 9 10 11 12 13 14
2009 87.4 -22.8 95.6 -18.3 -4.3 100.5 -2.4 -1.7 -2.4 -1.9 -4.2 -5.7 924 3.32010 102.8 17.7 105.2 10.2 2.1 101.5 0.9 0.5 1.8 2.2 1.1 -2.8 843 -8.52011 111.6 8.6 114.7 8.9 1.6 100.9 -0.6 -1.0 0.1 -1.3 0.0 -3.6 838 -1.1
2011 Q3 110.9 5.4 115.7 8.8 1.8 101.2 -0.5 -0.9 0.1 -2.1 -0.1 -4.4 823 2.9 Q4 108.6 -0.6 114.6 4.0 0.9 100.0 -1.4 -1.7 -0.9 -4.2 -0.4 -4.0 829 -1.82012 Q1 108.2 -3.9 115.1 1.1 1.1 100.2 -1.1 -1.0 -0.6 -0.7 -2.2 -5.6 775 -11.4 Q2 . . 113.9 -0.7 0.0 99.6 -1.7 -1.6 -1.4 -5.9 -2.0 -4.8 770 -6.8
2012 Apr. . . 114.1 -1.0 -1.7 98.9 -3.5 -3.4 -3.0 -12.1 -2.5 -6.9 764 -7.7 May . . 114.4 -0.9 1.0 99.8 -0.8 -0.2 -0.6 -1.9 -1.6 -4.8 771 -6.6 June . . 113.2 -0.3 0.8 99.9 -0.9 -1.2 -0.7 -3.2 -1.7 -2.8 776 -6.0 July . . 114.3 0.3 -0.3 99.8 -1.6 -1.7 -1.0 -3.6 -3.6 -6.3 697 -15.3 Aug. . . . . . . . . . . . . 738 -9.8
month-on-month percentage changes (s.a.)
2012 Apr. - . - -1.2 -1.4 - -1.4 -0.4 -1.8 -8.1 -0.1 -1.7 - -4.3 May - . - 0.3 1.0 - 0.9 0.5 1.3 6.0 -0.2 1.5 - 0.8 June - . - -1.0 0.1 - 0.1 0.0 -0.1 -0.5 0.6 2.0 - 0.7 July - . - 0.9 -0.1 - -0.1 -0.7 0.6 -0.8 -1.1 -1.5 - -10.2 Aug. - . - . . - . . . . . . - 5.8
Sources: Eurostat, except columns 13 and 14 in Table 4 in Section 5.2 (which comprise ECB calculations based on data from the European Automobile Manufacturers’ Association).1) Following the amendment of the Regulation concerning short-term statistics (see the General Notes), euro area industrial new order statistics have been discontinued; the last
release by Eurostat was for March 2012.2) Includes manufacturing industries working mainly on the basis of orders, which represented 61.2% of total manufacturing in 2005.3) Annual and quarterly figures are averages of monthly figures in the period concerned.

EURO AREASTATISTICS
Prices, output,demand and
labour markets
5.2 Output and demand (percentage balances, 1) unless otherwise indicated; seasonally adjusted)
S 53ECB
Monthly BulletinOctober 2012
5. Business and Consumer Surveys
Economic Manufacturing industry Consumer confidence indicatorsentiment
indicator 2) Industrial confidence indicator Capacity Total 4) Financial Economic Unemployment Savings(long-term utilisation 3) situation situation situation over next
average Total 4) Order Stocks of Production (%) over next over next over next 12 months= 100) books finished expectations 12 months 12 months 12 months
products
1 2 3 4 5 6 7 8 9 10 11
2008 93.5 -8.4 -13.4 10.8 -1.0 82.0 -18.4 -10.1 -25.4 23.9 -14.12009 80.2 -28.7 -56.7 14.8 -14.7 70.8 -24.8 -7.0 -26.1 55.3 -10.72010 100.5 -4.7 -24.6 0.8 11.1 76.8 -14.2 -5.3 -12.3 31.2 -8.12011 101.0 0.1 -6.9 2.3 9.3 80.4 -14.5 -7.5 -18.2 23.3 -9.2
2011 Q3 98.4 -2.8 -9.0 4.5 5.2 80.1 -15.9 -7.4 -21.8 24.1 -10.1 Q4 93.6 -7.0 -14.6 7.0 0.6 79.8 -20.6 -9.7 -28.4 33.8 -10.82012 Q1 94.1 -6.6 -15.8 6.2 2.1 79.8 -20.0 -10.1 -24.2 34.7 -11.2 Q2 91.1 -11.1 -22.9 6.8 -3.5 78.8 -19.7 -10.4 -24.4 32.6 -11.2 Q3 86.3 -15.5 -29.4 8.2 -8.8 . -24.0 -11.9 -30.5 40.9 -12.7
2012 Apr. 92.8 -9.0 -19.3 6.1 -1.6 79.7 -19.9 -10.5 -24.0 33.5 -11.7 May 90.5 -11.4 -23.7 7.2 -3.5 - -19.3 -10.8 -23.7 30.8 -11.8 June 89.9 -12.8 -25.8 7.1 -5.5 - -19.8 -10.0 -25.6 33.4 -10.2 July 87.9 -15.1 -28.3 9.2 -7.6 77.8 -21.5 -10.3 -27.9 36.5 -11.2 Aug. 86.1 -15.4 -29.4 8.3 -8.6 - -24.6 -11.8 -31.0 43.0 -12.7 Sep. 85.0 -16.1 -30.6 7.2 -10.3 - -25.9 -13.6 -32.7 43.1 -14.3
Construction confidence indicator Retail trade confidence indicator Services confidence indicator
Total 4) Order Employment Total 4) Present Volume of Expected Total 4) Business Demand in Demand inbooks expectations business stocks business climate recent the months
situation situation months ahead
12 13 14 15 16 17 18 19 20 21 22
2008 -14.2 -20.7 -7.7 -10.0 -11.0 15.8 -3.3 0.4 -3.8 0.5 4.72009 -33.1 -42.1 -24.1 -15.5 -21.4 9.8 -15.4 -15.8 -20.8 -18.2 -8.52010 -28.8 -39.3 -18.4 -4.1 -6.6 7.2 1.6 4.5 1.9 3.5 8.02011 -27.4 -34.9 -20.0 -5.5 -5.8 11.1 0.5 5.4 2.2 5.4 8.6
2011 Q3 -27.7 -35.0 -20.4 -7.5 -7.3 12.8 -2.3 3.5 0.3 3.7 6.5 Q4 -27.4 -32.5 -22.3 -11.1 -13.6 14.0 -5.7 -1.6 -6.4 -1.7 3.32012 Q1 -26.5 -31.7 -21.2 -13.8 -14.7 16.2 -10.6 -0.6 -6.6 -0.4 5.1 Q2 -28.6 -33.4 -23.7 -14.5 -18.5 14.7 -10.5 -5.0 -11.0 -4.8 0.9 Q3 -31.2 -38.3 -24.0 -16.9 -22.1 14.5 -14.2 -10.4 -15.8 -11.5 -4.0
2012 Apr. -27.5 -30.9 -24.0 -11.1 -11.8 12.9 -8.5 -2.4 -8.1 -2.3 3.2 May -30.2 -35.0 -25.4 -18.1 -24.4 16.9 -13.1 -5.2 -11.1 -4.5 0.2 June -28.1 -34.3 -21.8 -14.4 -19.2 14.2 -9.8 -7.4 -13.9 -7.6 -0.7 July -28.5 -35.1 -21.8 -15.0 -18.9 14.2 -11.9 -8.5 -13.7 -9.1 -2.8 Aug. -33.1 -38.7 -27.5 -17.2 -22.8 14.2 -14.7 -10.8 -16.6 -11.5 -4.4 Sep. -31.9 -41.1 -22.7 -18.6 -24.6 15.1 -16.0 -12.0 -17.1 -14.0 -4.9
Source: European Commission (Economic and Financial Affairs DG).1) Difference between the percentages of respondents giving positive and negative replies.2) The economic sentiment indicator is composed of the industrial, services, consumer, construction and retail trade confidence indicators; the industrial confidence indicator has
a weight of 40%, the services confidence indicator a weight of 30%, the consumer confidence indicator a weight of 20% and the two other indicators a weight of 5% each.Values for the economic sentiment indicator of above (below) 100 indicate above-average (below-average) economic sentiment, calculated for the period since 1990.
3) Data are collected in January, April, July and October each year. The quarterly figures shown are averages of two successive surveys. Annual data are derived from quarterly averages.
4) The confidence indicators are calculated as simple averages of the components shown; the assessments of stocks (columns 4 and 17) and unemployment (column 10) are used with inverted signs for the calculation of confidence indicators.

5.3 Labour markets 1)
(quarterly data seasonally adjusted; annual data unadjusted)
S 54ECBMonthly BulletinOctober 2012
1. Employment
Persons employed
By employment status By economic activity
Total Employees Self- Agriculture, Manufactu- Construc- Trade, Information Finance Real estate Professional, Public admi- Arts,employed forestry ring, energy tion transport, and commu- and business and nistration, enter-
and fishing and utilities accommoda- nication insurance support education, tainmenttion and services health and and other
food services social work services
1 2 3 4 5 6 7 8 9 10 11 12 13
levels (thousands)
2011 147,026 125,966 21,060 5,055 23,202 9,952 36,100 4,030 4,061 1,314 18,096 34,436 10,780
percentage of total persons employed
2011 100.0 85.7 14.3 3.4 15.8 6.8 24.6 2.7 2.8 0.9 12.3 23.4 7.3annual percentage changes
2009 -1.8 -1.8 -1.8 -2.2 -5.0 -6.4 -1.6 -0.7 0.4 -3.6 -2.6 1.2 1.02010 -0.5 -0.5 -0.7 -0.9 -2.9 -3.8 -0.7 -1.2 -0.8 -0.4 1.7 1.0 0.92011 0.2 0.4 -0.9 -2.5 0.1 -4.0 0.6 1.7 -0.3 3.0 2.6 0.1 0.2
2011 Q3 0.3 0.5 -1.1 -2.2 0.4 -4.4 0.9 2.0 -0.2 1.4 2.0 0.1 0.3 Q4 -0.1 0.1 -1.3 -2.7 0.0 -5.1 0.2 2.2 0.0 3.7 1.9 -0.1 -0.22012 Q1 -0.5 -0.3 -1.1 -1.3 -0.5 -5.1 -0.2 1.6 -0.4 0.8 0.3 -0.1 0.4 Q2 -0.6 -0.6 -0.9 -0.8 -0.9 -5.2 -0.6 1.7 -0.9 1.4 0.2 -0.2 0.5
quarter-on-quarter percentage changes
2011 Q3 -0.1 -0.1 -0.5 -0.5 0.1 -1.5 -0.1 -0.1 -0.1 -0.5 -0.1 0.0 0.2 Q4 -0.2 -0.2 -0.3 -0.9 -0.3 -1.8 -0.4 0.6 0.1 2.4 0.3 -0.2 0.22012 Q1 -0.3 -0.4 0.4 0.0 -0.3 -1.5 -0.3 0.7 0.0 -1.2 -0.6 -0.1 0.6 Q2 0.0 0.1 -0.5 0.5 -0.4 -0.6 0.2 0.6 -0.8 0.7 0.7 0.1 -0.5
Hours worked
levels (millions)
2011 232,753 187,515 45,238 10,590 36,890 17,643 60,646 6,482 6,441 2,044 27,738 49,104 15,175percentage of total hours worked
2011 100.0 80.6 19.4 4.5 15.8 7.6 26.1 2.8 2.8 0.9 11.9 21.1 6.5annual percentage changes
2009 -3.4 -3.6 -2.7 -3.0 -9.0 -7.4 -2.9 -1.2 -1.0 -3.8 -3.7 0.9 -0.52010 0.1 0.2 -0.3 -0.2 -0.3 -3.8 -0.3 -0.6 -0.3 0.6 2.3 1.1 0.62011 0.1 0.5 -1.2 -1.5 0.6 -4.1 0.2 1.7 0.0 3.6 2.7 0.1 -0.3
2011 Q3 0.1 0.4 -1.3 -2.1 0.5 -4.5 0.7 2.1 0.1 2.6 2.1 -0.2 -0.1 Q4 -0.2 0.1 -1.5 -1.8 -0.2 -5.6 0.0 2.2 0.3 3.3 2.2 0.1 -0.22012 Q1 -0.8 -0.6 -1.6 -2.4 -0.2 -6.1 -0.7 1.3 -1.0 -1.0 -0.1 0.2 0.1 Q2 -0.8 -0.7 -1.0 -1.4 -0.4 -6.7 -0.8 1.8 -1.8 0.4 -0.1 0.2 0.4
quarter-on-quarter percentage changes
2011 Q3 0.0 0.0 -0.3 -0.5 0.3 -1.5 0.1 0.2 0.2 0.2 -0.1 0.0 0.7 Q4 -0.4 -0.4 -0.4 -0.3 -0.4 -2.7 -0.7 0.6 -0.3 0.9 0.4 0.1 0.02012 Q1 -0.1 -0.1 -0.1 -0.4 0.2 -0.5 -0.3 0.8 -0.2 -1.5 -0.6 0.3 0.8 Q2 -0.3 -0.3 -0.2 -0.3 -0.6 -2.2 0.1 0.3 -1.4 0.9 0.3 -0.2 -1.1
Hours worked per person employed
levels (thousands)
2011 1,583 1,489 2,148 2,095 1,590 1,773 1,680 1,608 1,586 1,556 1,533 1,426 1,408annual percentage changes
2009 -1.6 -1.8 -0.9 -0.9 -4.2 -1.1 -1.3 -0.5 -1.4 -0.2 -1.2 -0.3 -1.52010 0.6 0.6 0.4 0.6 2.6 0.0 0.4 0.6 0.5 1.0 0.7 0.2 -0.32011 -0.1 0.0 -0.3 1.0 0.5 -0.2 -0.4 -0.1 0.3 0.6 0.1 -0.1 -0.5
2011 Q3 -0.2 -0.1 -0.1 0.2 0.1 -0.2 -0.2 0.1 0.4 1.3 0.1 -0.3 -0.4 Q4 -0.1 0.0 -0.2 0.9 -0.2 -0.6 -0.2 0.0 0.3 -0.4 0.3 0.2 0.02012 Q1 -0.3 -0.2 -0.5 -1.1 0.3 -1.1 -0.5 -0.3 -0.5 -1.8 -0.4 0.3 -0.2 Q2 -0.2 -0.2 -0.1 -0.6 0.5 -1.6 -0.2 0.1 -0.9 -1.0 -0.3 0.4 -0.2
quarter-on-quarter percentage changes
2011 Q3 -1.2 -1.0 -1.8 -0.2 -1.7 -1.1 -1.6 0.1 -0.8 0.7 -1.9 -1.0 -0.4 Q4 2.8 3.2 1.3 -1.9 3.9 0.2 2.7 3.2 3.4 1.0 5.7 3.3 1.92012 Q1 1.0 1.2 -1.0 -2.3 1.3 0.1 0.7 1.8 2.0 1.1 -0.1 2.6 0.8 Q2 -2.8 -3.7 1.2 3.9 -3.3 -1.0 -2.1 -5.0 -5.3 -3.1 -4.1 -4.6 -2.0
Source: ECB calculations based on Eurostat data.1) Data for employment are based on the ESA 95.
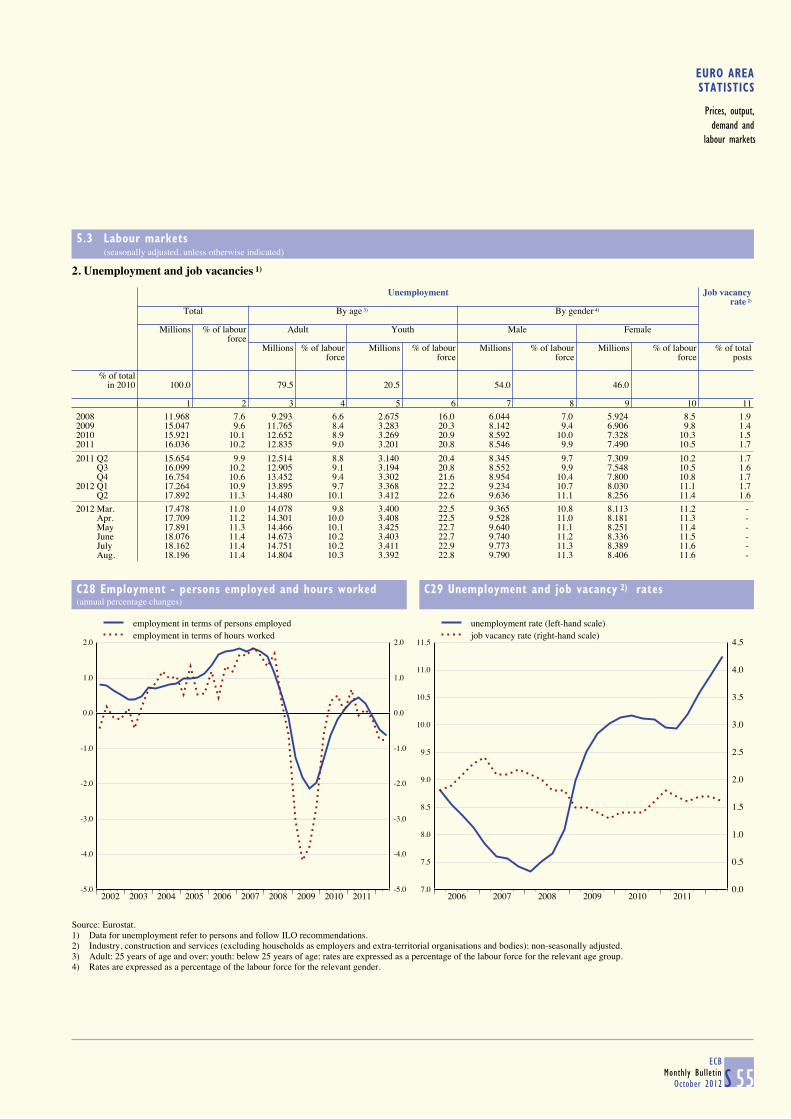
EURO AREASTATISTICS
Prices, output,demand and
labour markets
5.3 Labour markets (seasonally adjusted, unless otherwise indicated)
S 55ECB
Monthly BulletinOctober 2012
2. Unemployment and job vacancies 1)
Unemployment Job vacancy
rate 2)
Total By age 3) By gender 4)
Millions % of labour Adult Youth Male Femaleforce
Millions % of labour Millions % of labour Millions % of labour Millions % of labour % of totalforce force force force posts
% of totalin 2010 100.0 79.5 20.5 54.0 46.0
1 2 3 4 5 6 7 8 9 10 11
2008 11.968 7.6 9.293 6.6 2.675 16.0 6.044 7.0 5.924 8.5 1.92009 15.047 9.6 11.765 8.4 3.283 20.3 8.142 9.4 6.906 9.8 1.42010 15.921 10.1 12.652 8.9 3.269 20.9 8.592 10.0 7.328 10.3 1.52011 16.036 10.2 12.835 9.0 3.201 20.8 8.546 9.9 7.490 10.5 1.7
2011 Q2 15.654 9.9 12.514 8.8 3.140 20.4 8.345 9.7 7.309 10.2 1.7 Q3 16.099 10.2 12.905 9.1 3.194 20.8 8.552 9.9 7.548 10.5 1.6 Q4 16.754 10.6 13.452 9.4 3.302 21.6 8.954 10.4 7.800 10.8 1.72012 Q1 17.264 10.9 13.895 9.7 3.368 22.2 9.234 10.7 8.030 11.1 1.7 Q2 17.892 11.3 14.480 10.1 3.412 22.6 9.636 11.1 8.256 11.4 1.6
2012 Mar. 17.478 11.0 14.078 9.8 3.400 22.5 9.365 10.8 8.113 11.2 - Apr. 17.709 11.2 14.301 10.0 3.408 22.5 9.528 11.0 8.181 11.3 - May 17.891 11.3 14.466 10.1 3.425 22.7 9.640 11.1 8.251 11.4 - June 18.076 11.4 14.673 10.2 3.403 22.7 9.740 11.2 8.336 11.5 - July 18.162 11.4 14.751 10.2 3.411 22.9 9.773 11.3 8.389 11.6 - Aug. 18.196 11.4 14.804 10.3 3.392 22.8 9.790 11.3 8.406 11.6 -
C28 Employment - persons employed and hours worked
(annual percentage changes)
C29 Unemployment and job vacancy 2) rates
-5.0
-4.0
-3.0
-2.0
-1.0
0.0
1.0
2.0
2002 2003 2004 2005 2006 2007 2008 2009 2010 2011-5.0
-4.0
-3.0
-2.0
-1.0
0.0
1.0
2.0
employment in terms of persons employedemployment in terms of hours worked
7.0
7.5
8.0
8.5
9.0
9.5
10.0
10.5
11.0
11.5
2006 2007 2008 2009 2010 20110.0
0.5
1.0
1.5
2.0
2.5
3.0
3.5
4.0
4.5
unemployment rate (left-hand scale)job vacancy rate (right-hand scale)
Source: Eurostat.1) Data for unemployment refer to persons and follow ILO recommendations.2) Industry, construction and services (excluding households as employers and extra-territorial organisations and bodies); non-seasonally adjusted.3) Adult: 25 years of age and over; youth: below 25 years of age; rates are expressed as a percentage of the labour force for the relevant age group.4) Rates are expressed as a percentage of the labour force for the relevant gender.

6 GOVERNMENT FINANCE
6.1 Revenue, expenditure and deficit/surplus 1) (as a percentage of GDP)
S 56ECBMonthly BulletinOctober 2012
1. Euro area _ revenue
Total Current revenue Capital revenue Memo
item:Direct Indirect Social Sales Capital Fiscaltaxes Households Corporations taxes Received by EU contributions Employers Employees taxes burden 2)
institutions1 2 3 4 5 6 7 8 9 10 11 12 13 14
2003 44.9 44.2 11.5 8.8 2.7 13.2 0.4 15.7 8.2 4.6 2.3 0.6 0.5 40.92004 44.5 44.0 11.5 8.5 2.9 13.2 0.3 15.5 8.1 4.5 2.2 0.5 0.4 40.62005 44.8 44.3 11.7 8.6 3.0 13.3 0.3 15.4 8.1 4.5 2.3 0.5 0.3 40.72006 45.3 45.0 12.3 8.7 3.4 13.4 0.3 15.3 8.0 4.5 2.3 0.3 0.3 41.32007 45.3 45.1 12.7 8.9 3.6 13.3 0.3 15.1 8.0 4.4 2.3 0.3 0.3 41.32008 45.1 44.8 12.5 9.1 3.2 12.9 0.3 15.3 8.1 4.5 2.3 0.2 0.3 40.92009 44.9 44.5 11.6 9.2 2.3 12.8 0.3 15.8 8.3 4.5 2.5 0.3 0.4 40.62010 44.7 44.5 11.6 8.9 2.5 12.9 0.3 15.6 8.2 4.5 2.6 0.3 0.3 40.42011 45.3 45.0 11.9 9.1 2.7 13.0 0.3 15.7 8.2 4.6 2.6 0.3 0.3 40.9
2. Euro area _ expenditure
Total Current expenditure Capital expenditure Memo
item:Total Compensation Intermediate Interest Current Investment Capital Primary
of consumption transfers Social Subsidies transfers Paid by EU expenditure 3)
employees payments Paid by EU institutionsinstitutions
1 2 3 4 5 6 7 8 9 10 11 12 13 14
2003 48.0 44.1 10.6 5.0 3.3 25.2 22.3 1.8 0.5 4.0 2.6 1.4 0.1 44.72004 47.4 43.5 10.5 5.0 3.1 24.9 22.1 1.7 0.5 3.9 2.5 1.5 0.1 44.32005 47.3 43.4 10.5 5.0 3.0 24.9 22.1 1.7 0.5 3.9 2.5 1.4 0.0 44.32006 46.7 42.8 10.3 5.0 2.9 24.6 21.8 1.6 0.5 3.9 2.5 1.4 0.0 43.82007 46.0 42.2 10.1 5.0 3.0 24.2 21.4 1.6 0.4 3.8 2.6 1.2 0.0 43.12008 47.2 43.3 10.3 5.2 3.0 24.8 21.9 1.6 0.4 3.9 2.6 1.3 0.0 44.22009 51.3 47.0 11.0 5.7 2.9 27.4 24.3 1.8 0.4 4.3 2.8 1.4 0.0 48.42010 51.0 46.6 10.8 5.7 2.8 27.3 24.2 1.8 0.4 4.4 2.5 1.9 0.0 48.22011 49.4 46.0 10.6 5.5 3.0 26.9 23.9 1.7 0.4 3.4 2.3 1.2 0.0 46.4
3. Euro area _ deficit/surplus, primary deficit/surplus and government consumption
Deficit (-)/surplus (+) Primary Government consumption 4)
deficit (-)/ Total Central State Local Social surplus (+) Total Collective Individual
gov. gov. gov. security Compensation Intermediate Transfers Consumption Sales consumption consumptionfunds of employees consumption in kind of fixed (minus)
via market capitalproducers
1 2 3 4 5 6 7 8 9 10 11 12 13 14
2003 -3.2 -2.5 -0.5 -0.2 0.1 0.2 20.5 10.6 5.0 5.2 1.9 2.3 8.1 12.32004 -2.9 -2.5 -0.4 -0.3 0.2 0.2 20.4 10.5 5.0 5.1 1.9 2.2 8.1 12.32005 -2.6 -2.3 -0.3 -0.2 0.2 0.5 20.4 10.5 5.0 5.1 1.9 2.3 8.0 12.42006 -1.4 -1.5 -0.1 -0.2 0.4 1.5 20.3 10.3 5.0 5.2 1.9 2.3 7.9 12.42007 -0.7 -1.2 0.0 0.0 0.6 2.3 20.0 10.1 5.0 5.1 1.9 2.3 7.7 12.32008 -2.1 -2.3 -0.2 -0.2 0.5 0.9 20.5 10.3 5.2 5.3 2.0 2.3 8.0 12.62009 -6.4 -5.2 -0.5 -0.3 -0.4 -3.5 22.3 11.0 5.7 5.8 2.1 2.5 8.6 13.62010 -6.2 -5.1 -0.7 -0.3 -0.1 -3.4 22.0 10.8 5.7 5.8 2.1 2.6 8.4 13.62011 -4.1 -3.2 -0.7 -0.2 0.0 -1.1 21.5 10.6 5.5 5.8 2.1 2.6 8.2 13.3
4. Euro area countries _ deficit (-)/surplus (+) 5)
BE DE EE IE GR ES FR IT CY LU MT NL AT PT SI SK FI1 2 3 4 5 6 7 8 9 10 11 12 13 14 15 16 17
2008 -1.0 -0.1 -2.9 -7.3 -9.8 -4.5 -3.3 -2.7 0.9 3.0 -4.6 0.5 -0.9 -3.6 -1.9 -2.1 4.32009 -5.6 -3.2 -2.0 -14.0 -15.6 -11.2 -7.5 -5.4 -6.1 -0.8 -3.8 -5.6 -4.1 -10.2 -6.1 -8.0 -2.52010 -3.8 -4.3 0.2 -31.2 -10.3 -9.3 -7.1 -4.6 -5.3 -0.9 -3.7 -5.1 -4.5 -9.8 -6.0 -7.7 -2.52011 -3.7 -1.0 1.0 -13.1 -9.1 -8.5 -5.2 -3.9 -6.3 -0.6 -2.7 -4.7 -2.6 -4.2 -6.4 -4.8 -0.5
Sources: ECB for euro area aggregated data; European Commission for data relating to countries’ deficit/surplus.1) The concepts "revenue", "expenditure" and "deficit/surplus" are based on the ESA 95. Transactions involving the EU budget are included and
consolidated. Transactions among Member States’ governments are not consolidated.2) The fiscal burden comprises taxes and social contributions.3) Comprises total expenditure minus interest expenditure.4) Corresponds to final consumption expenditure (P.3) of general government in the ESA 95.5) Includes proceeds from the sale of UMTS licences and settlements under swaps and forward rate agreements.
6
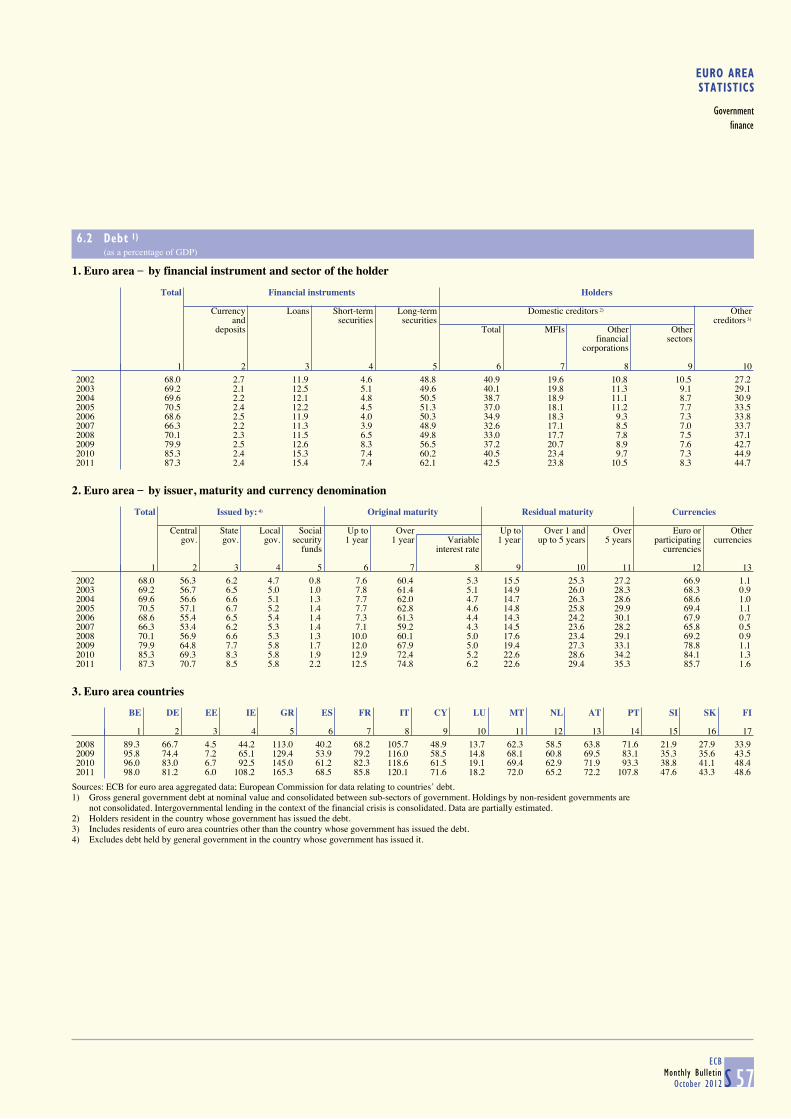
EURO AREASTATISTICS
Governmentfinance
6.2 Debt 1) (as a percentage of GDP)
S 57ECB
Monthly BulletinOctober 2012
1. Euro area _ by financial instrument and sector of the holder
Total Financial instruments Holders
Currency Loans Short-term Long-term Domestic creditors 2) Other
and securities securities creditors 3)
deposits Total MFIs Other Otherfinancial sectors
corporations
1 2 3 4 5 6 7 8 9 10
2002 68.0 2.7 11.9 4.6 48.8 40.9 19.6 10.8 10.5 27.22003 69.2 2.1 12.5 5.1 49.6 40.1 19.8 11.3 9.1 29.12004 69.6 2.2 12.1 4.8 50.5 38.7 18.9 11.1 8.7 30.92005 70.5 2.4 12.2 4.5 51.3 37.0 18.1 11.2 7.7 33.52006 68.6 2.5 11.9 4.0 50.3 34.9 18.3 9.3 7.3 33.82007 66.3 2.2 11.3 3.9 48.9 32.6 17.1 8.5 7.0 33.72008 70.1 2.3 11.5 6.5 49.8 33.0 17.7 7.8 7.5 37.12009 79.9 2.5 12.6 8.3 56.5 37.2 20.7 8.9 7.6 42.72010 85.3 2.4 15.3 7.4 60.2 40.5 23.4 9.7 7.3 44.92011 87.3 2.4 15.4 7.4 62.1 42.5 23.8 10.5 8.3 44.7
2. Euro area _ by issuer, maturity and currency denomination
Total Issued by: 4) Original maturity Residual maturity Currencies
Central State Local Social Up to Over Up to Over 1 and Over Euro or Other
gov. gov. gov. security 1 year 1 year Variable 1 year up to 5 years 5 years participating currenciesfunds interest rate currencies
1 2 3 4 5 6 7 8 9 10 11 12 13
2002 68.0 56.3 6.2 4.7 0.8 7.6 60.4 5.3 15.5 25.3 27.2 66.9 1.12003 69.2 56.7 6.5 5.0 1.0 7.8 61.4 5.1 14.9 26.0 28.3 68.3 0.92004 69.6 56.6 6.6 5.1 1.3 7.7 62.0 4.7 14.7 26.3 28.6 68.6 1.02005 70.5 57.1 6.7 5.2 1.4 7.7 62.8 4.6 14.8 25.8 29.9 69.4 1.12006 68.6 55.4 6.5 5.4 1.4 7.3 61.3 4.4 14.3 24.2 30.1 67.9 0.72007 66.3 53.4 6.2 5.3 1.4 7.1 59.2 4.3 14.5 23.6 28.2 65.8 0.52008 70.1 56.9 6.6 5.3 1.3 10.0 60.1 5.0 17.6 23.4 29.1 69.2 0.92009 79.9 64.8 7.7 5.8 1.7 12.0 67.9 5.0 19.4 27.3 33.1 78.8 1.12010 85.3 69.3 8.3 5.8 1.9 12.9 72.4 5.2 22.6 28.6 34.2 84.1 1.32011 87.3 70.7 8.5 5.8 2.2 12.5 74.8 6.2 22.6 29.4 35.3 85.7 1.6
3. Euro area countries
BE DE EE IE GR ES FR IT CY LU MT NL AT PT SI SK FI
1 2 3 4 5 6 7 8 9 10 11 12 13 14 15 16 17
2008 89.3 66.7 4.5 44.2 113.0 40.2 68.2 105.7 48.9 13.7 62.3 58.5 63.8 71.6 21.9 27.9 33.92009 95.8 74.4 7.2 65.1 129.4 53.9 79.2 116.0 58.5 14.8 68.1 60.8 69.5 83.1 35.3 35.6 43.52010 96.0 83.0 6.7 92.5 145.0 61.2 82.3 118.6 61.5 19.1 69.4 62.9 71.9 93.3 38.8 41.1 48.42011 98.0 81.2 6.0 108.2 165.3 68.5 85.8 120.1 71.6 18.2 72.0 65.2 72.2 107.8 47.6 43.3 48.6
Sources: ECB for euro area aggregated data; European Commission for data relating to countries’ debt.1) Gross general government debt at nominal value and consolidated between sub-sectors of government. Holdings by non-resident governments are
not consolidated. Intergovernmental lending in the context of the financial crisis is consolidated. Data are partially estimated.2) Holders resident in the country whose government has issued the debt. 3) Includes residents of euro area countries other than the country whose government has issued the debt. 4) Excludes debt held by general government in the country whose government has issued it.

6.3 Change in debt 1) (as a percentage of GDP)
S 58ECBMonthly BulletinOctober 2012
1. Euro area _ by source, financial instrument and sector of the holder
Total Source of change Financial instruments Holders
Borrowing Valuation Other Currency Loans Short-term Long-term Domestic Other
requirement 2) effects 3) changes and securities securities creditors 5) MFIs Other creditors 6)
in deposits financialvolume 4) corporations
1 2 3 4 5 6 7 8 9 10 11 12
2003 3.1 3.3 -0.2 0.0 -0.6 1.0 0.6 2.1 0.5 0.8 0.8 2.72004 3.2 3.3 -0.1 0.0 0.2 0.1 -0.1 2.9 0.2 -0.1 0.3 3.02005 3.3 3.1 0.2 0.0 0.3 0.5 -0.1 2.6 -0.4 -0.1 0.5 3.72006 1.6 1.5 0.1 0.0 0.2 0.2 -0.3 1.5 -0.3 1.1 -1.4 1.92007 1.2 1.2 0.0 0.0 -0.1 0.0 0.1 1.2 -0.5 -0.3 -0.3 1.62008 5.3 5.2 0.1 0.0 0.1 0.5 2.7 2.0 1.1 1.1 -0.6 4.22009 7.2 7.4 -0.2 0.0 0.1 0.7 1.6 4.9 3.0 2.3 0.9 4.32010 7.5 7.7 -0.1 0.0 0.0 3.0 -0.7 5.2 4.2 3.3 1.0 3.32011 4.2 4.0 0.2 0.0 0.0 0.5 0.2 3.5 3.2 1.0 1.0 1.1
2. Euro area _ deficit-debt adjustment
Change in Deficit (-) / Deficit-debt adjustment 8)
debt surplus (+) 7) Total Transactions in main financial assets held by general government Valuation Other Other 9)
effects Exchange changes inTotal Currency Loans Securities 10) Shares and rate volume
and other Privatisations Equity effectsdeposits equity injections
1 2 3 4 5 6 7 8 9 10 11 12 13 14
2003 3.1 -3.2 0.0 0.1 0.1 0.0 0.0 0.1 -0.2 0.1 -0.2 -0.1 0.0 0.12004 3.2 -2.9 0.3 0.2 0.2 0.0 0.1 0.0 -0.5 0.2 -0.1 0.0 0.0 0.12005 3.3 -2.6 0.8 0.6 0.3 0.0 0.1 0.1 -0.3 0.2 0.2 0.0 0.0 0.02006 1.6 -1.4 0.2 0.2 0.3 -0.1 0.2 -0.2 -0.4 0.1 0.1 0.0 0.0 -0.12007 1.2 -0.7 0.5 0.6 0.2 0.0 0.2 0.1 -0.3 0.2 0.0 0.0 0.0 -0.12008 5.3 -2.1 3.2 3.0 0.8 0.7 0.7 0.9 -0.1 0.7 0.1 0.0 0.0 0.02009 7.2 -6.4 0.9 1.0 0.3 0.0 0.3 0.4 -0.3 0.5 -0.2 0.0 0.0 0.12010 7.5 -6.2 1.3 1.8 0.0 0.5 1.1 0.1 0.0 0.1 -0.1 0.0 0.0 -0.32011 4.2 -4.1 0.1 -0.3 0.2 -0.2 -0.2 0.0 -0.1 0.2 0.2 0.0 0.0 0.2
Source: ECB.1) Data are partially estimated. Annual change in gross nominal consolidated debt is expressed as a percentage of GDP, i.e. [debt(t) - debt(t-1)] ÷ GDP(t). Intergovernmental lending in the context of the financial crisis is consolidated.2) The borrowing requirement is by definition equal to transactions in debt.3) Includes, in addition to the impact of foreign exchange movements, effects arising from measurement at nominal value (e.g. premia or discounts on securities issued).4) Includes, in particular, the impact of the reclassification of units and certain types of debt assumption.5) Holders resident in the country whose government has issued the debt. 6) Includes residents of euro area countries other than the country whose government has issued the debt. 7) Including proceeds from sales of UMTS licences.8) The difference between the annual change in gross nominal consolidated debt and the deficit as a percentage of GDP. 9) Mainly composed of transactions in other assets and liabilities (trade credits, other receivables/payables and financial derivatives).10) Excluding financial derivatives.

EURO AREASTATISTICS
Governmentfinance
6.4 Quarterly revenue, expenditure and deficit/surplus 1) (as a percentage of GDP)
S 59ECB
Monthly BulletinOctober 2012
1. Euro area _ quarterly revenue
Total Current revenue Capital revenue Memo
item:Direct taxes Indirect taxes Social Sales Property Capital Fiscal
contributions income taxes burden 2)
1 2 3 4 5 6 7 8 9 10
2006 Q1 42.5 42.0 10.4 12.8 15.1 2.1 0.8 0.4 0.3 38.6 Q2 45.6 45.1 12.5 13.1 15.1 2.2 1.4 0.5 0.3 41.0 Q3 43.6 43.1 11.8 12.4 15.1 2.3 0.8 0.5 0.3 39.5 Q4 49.1 48.5 14.4 14.1 15.8 2.5 0.9 0.6 0.3 44.5
2007 Q1 42.1 41.8 10.4 12.8 14.8 2.1 0.9 0.4 0.3 38.3 Q2 45.9 45.4 13.0 13.1 15.0 2.2 1.4 0.4 0.3 41.3 Q3 43.6 43.1 12.3 12.3 14.7 2.3 0.7 0.5 0.3 39.6 Q4 49.3 48.7 14.8 13.8 15.7 2.6 1.0 0.6 0.3 44.6
2008 Q1 42.3 42.0 10.8 12.3 14.8 2.1 1.1 0.3 0.2 38.2 Q2 45.2 44.9 12.9 12.4 15.1 2.2 1.5 0.4 0.3 40.6 Q3 43.4 43.0 12.2 12.0 15.0 2.3 0.8 0.4 0.3 39.5 Q4 48.9 48.4 13.9 13.4 16.4 2.7 1.1 0.5 0.3 44.0
2009 Q1 42.3 42.2 10.4 12.0 15.6 2.3 1.1 0.1 0.2 38.2 Q2 45.3 44.7 11.8 12.5 15.7 2.4 1.4 0.6 0.5 40.5 Q3 42.8 42.5 11.0 11.9 15.5 2.5 0.7 0.3 0.3 38.7 Q4 48.7 47.9 13.0 13.6 16.4 2.8 1.0 0.8 0.5 43.5
2010 Q1 42.1 41.9 10.1 12.2 15.5 2.3 0.9 0.2 0.3 38.1 Q2 45.1 44.7 11.9 12.8 15.4 2.5 1.3 0.4 0.3 40.4 Q3 42.9 42.6 10.9 12.4 15.2 2.5 0.7 0.3 0.3 38.8 Q4 48.5 47.8 13.2 13.4 16.4 2.9 1.0 0.7 0.3 43.3
2011 Q1 42.8 42.6 10.6 12.4 15.3 2.4 1.0 0.3 0.3 38.7 Q2 45.1 44.8 12.0 12.6 15.4 2.5 1.4 0.3 0.3 40.3 Q3 43.7 43.4 11.4 12.5 15.3 2.6 0.8 0.3 0.3 39.6 Q4 49.3 48.3 13.3 13.4 16.7 2.9 1.0 1.0 0.4 43.8
2012 Q1 43.0 42.8 10.9 12.4 15.3 2.4 0.9 0.2 0.2 38.9
2. Euro area _ quarterly expenditure and deficit/surplus
Total Current expenditure Capital expenditure Deficit (-)/ Primary
surplus (+) deficit (-)/Total Compensation Intermediate Interest Current Investment Capital surplus (+)
of consumption transfers Social Subsidies transfersemployees benefits
1 2 3 4 5 6 7 8 9 10 11 12 13
2006 Q1 45.8 42.3 10.1 4.3 3.0 25.0 21.4 1.1 3.4 2.2 1.3 -3.3 -0.3 Q2 45.7 42.3 10.4 4.7 3.1 24.1 21.1 1.1 3.4 2.5 1.0 -0.1 3.0 Q3 45.4 41.8 9.8 4.8 2.9 24.2 20.9 1.2 3.6 2.6 1.0 -1.8 1.2 Q4 49.6 44.7 10.8 6.1 2.7 25.0 21.3 1.3 4.9 2.7 2.2 -0.4 2.3
2007 Q1 44.8 41.3 9.9 4.3 2.9 24.1 20.7 1.1 3.5 2.3 1.2 -2.7 0.3 Q2 44.9 41.5 10.1 4.6 3.2 23.6 20.6 1.1 3.4 2.5 0.9 0.9 4.1 Q3 44.7 41.1 9.6 4.8 2.9 23.8 20.5 1.1 3.6 2.6 0.9 -1.1 1.8 Q4 49.3 44.8 10.8 6.1 2.8 25.0 21.2 1.5 4.5 2.8 1.7 0.0 2.8
2008 Q1 45.3 41.8 9.9 4.4 3.1 24.5 20.8 1.2 3.6 2.3 1.2 -3.1 0.0 Q2 45.9 42.3 10.3 4.8 3.3 23.9 20.8 1.1 3.6 2.6 1.0 -0.6 2.7 Q3 45.8 42.1 9.7 5.0 3.0 24.3 21.1 1.1 3.7 2.7 1.0 -2.4 0.6 Q4 51.4 46.8 11.2 6.5 2.8 26.3 22.2 1.4 4.6 2.9 1.7 -2.5 0.3
2009 Q1 49.4 45.5 10.7 4.9 2.9 27.0 22.9 1.3 3.8 2.6 1.2 -7.0 -4.1 Q2 50.6 46.4 11.1 5.4 3.0 26.9 23.4 1.3 4.2 2.8 1.3 -5.4 -2.3 Q3 50.1 46.1 10.5 5.6 2.9 27.1 23.5 1.3 4.0 2.8 1.1 -7.3 -4.4 Q4 54.6 49.7 11.8 6.9 2.6 28.4 24.0 1.5 4.9 3.0 1.9 -5.9 -3.3
2010 Q1 50.4 46.5 10.8 4.9 2.8 28.0 23.7 1.4 3.9 2.3 1.5 -8.2 -5.5 Q2 49.5 46.0 11.0 5.3 3.0 26.7 23.2 1.3 3.5 2.5 1.2 -4.4 -1.4 Q3 50.5 45.3 10.2 5.5 2.8 26.8 23.1 1.3 5.2 2.5 2.6 -7.6 -4.9 Q4 53.3 48.6 11.4 6.8 2.7 27.6 23.6 1.5 4.7 2.7 2.1 -4.8 -2.1
2011 Q1 48.4 45.4 10.5 4.7 3.0 27.2 23.2 1.3 3.1 2.1 0.9 -5.6 -2.7 Q2 48.4 45.2 10.6 5.1 3.2 26.3 22.9 1.2 3.2 2.3 0.9 -3.3 -0.1 Q3 48.2 44.8 10.0 5.3 3.0 26.4 22.9 1.2 3.4 2.3 1.1 -4.5 -1.5 Q4 52.4 48.6 11.3 6.7 3.0 27.6 23.6 1.4 3.8 2.5 1.5 -3.1 -0.1
2012 Q1 48.3 45.6 10.3 4.7 3.1 27.4 23.3 1.2 2.6 1.9 0.8 -5.3 -2.1
Sources: ECB calculations based on Eurostat and national data.1) The concepts "revenue", "expenditure" and "deficit/surplus" are based on the ESA 95. Transactions between the EU budget and entities outside
the government sector are not included. Otherwise, except for different data transmission deadlines, the quarterly data are consistent with the annual data.2) The fiscal burden comprises taxes and social contributions.

6.5 Quarterly debt and change in debt 1) (as a percentage of GDP)
S 60ECBMonthly BulletinOctober 2012
1. Euro area _ Maastricht debt by financial instrument
Total Financial instruments
Currency and deposits Loans Short-term securities Long-term securities1 2 3 4 5
2009 Q2 77.1 2.4 12.2 8.2 54.3 Q3 79.0 2.4 12.4 9.0 55.3 Q4 79.9 2.5 12.6 8.3 56.5
2010 Q1 81.6 2.4 12.8 8.2 58.2 Q2 82.9 2.4 13.4 7.8 59.3 Q3 83.0 2.4 13.3 7.9 59.3 Q4 85.3 2.4 15.3 7.4 60.2
2011 Q1 86.2 2.4 15.1 7.4 61.3 Q2 87.1 2.4 14.9 7.5 62.3 Q3 86.7 2.4 15.0 7.8 61.5 Q4 87.3 2.4 15.4 7.4 62.1
2012 Q1 89.3 2.5 16.9 7.6 62.3
2. Euro area _ deficit-debt adjustment
Change in Deficit (-)/ Deficit-debt adjustment Memo
debt surplus (+) item:Total Transactions in main financial assets held by general government Valuation effects Other Borrowing
and other changes requirementTotal Currency Loans Securities Shares and in volume
and deposits other equity1 2 3 4 5 6 7 8 9 10 11
2009 Q2 9.2 -5.4 3.9 3.2 2.3 -0.4 0.2 1.1 -0.4 1.0 9.6 Q3 5.1 -7.3 -2.2 -2.8 -3.1 0.6 -0.1 -0.2 0.2 0.4 4.8 Q4 2.1 -5.9 -3.8 -2.7 -2.9 -0.1 0.1 0.2 -0.2 -0.8 2.4
2010 Q1 8.2 -8.2 0.0 0.8 0.9 -0.1 -0.3 0.3 -0.3 -0.5 8.5 Q2 7.7 -4.4 3.3 3.3 2.0 1.1 -0.2 0.4 -0.1 0.1 7.8 Q3 2.8 -7.6 -4.8 -2.9 -2.3 -0.6 0.0 0.0 0.0 -1.9 2.8 Q4 11.3 -4.8 6.5 5.7 -0.4 1.7 4.7 -0.3 -0.1 0.9 11.4
2011 Q1 6.8 -5.6 1.2 0.8 2.0 -0.7 -0.4 -0.2 -0.1 0.5 6.9 Q2 6.0 -3.3 2.7 2.4 2.8 0.5 -0.4 -0.5 0.2 0.0 5.8 Q3 0.8 -4.5 -3.7 -3.5 -3.7 -0.3 0.1 0.3 0.7 -0.8 0.1 Q4 3.4 -3.1 0.4 -0.7 -0.5 -0.3 -0.2 0.3 0.0 1.0 3.4
2012 Q1 9.6 -5.3 4.4 4.9 4.1 1.2 -0.4 0.1 -0.2 -0.3 9.8
C30 Deficit, borrowing requirement and change in debt
(four-quarter moving sum as a percentage of GDP)
C31 Maastricht debt
(annual change in the debt-to-GDP ratio and underlying factors)
0.0
1.0
2.0
3.0
4.0
5.0
6.0
7.0
8.0
9.0
10.0
2002 2004 2006 2008 20100.0
1.0
2.0
3.0
4.0
5.0
6.0
7.0
8.0
9.0
10.0
deficitchange in debtborrowing requirement
-4.0
-2.0
0.0
2.0
4.0
6.0
8.0
10.0
12.0
2002 2004 2006 2008 2010-4.0
-2.0
0.0
2.0
4.0
6.0
8.0
10.0
12.0
deficit-debt adjustmentprimary deficit/surplusgrowth/interest rate differentialchange in debt-to-GDP ratio
Sources: ECB calculations based on Eurostat and national data.1) Intergovernmental lending in the context of the financial crisis is consolidated.

7EXTERNAL TRANSACTIONS AND POSITIONS
7.1 Summary balance of payments 1) (EUR billions; net transactions)
S 61ECB
Monthly BulletinOctober 2012
Current account Net Financial account
Capital lending/ Errors andTotal Goods Services Income Current account borrowing Total Direct Portfolio Financial Other Reserve omissions
transfers to/from investment investment derivatives investment assetsrest of
the world(columns
1+6)
1 2 3 4 5 6 7 8 9 10 11 12 13 14
2009 -21.9 31.3 36.4 3.5 -93.1 6.7 -15.2 9.4 -105.1 265.7 20.0 -175.7 4.6 5.82010 -6.8 15.1 49.6 31.8 -103.3 6.4 -0.4 -2.5 -113.9 165.1 18.5 -61.7 -10.5 3.02011 -2.3 4.9 63.6 32.5 -103.3 10.7 8.4 -20.8 -148.7 305.6 -21.5 -145.9 -10.2 12.3
2011 Q2 -18.6 -2.4 16.4 -11.7 -20.9 0.8 -17.9 21.2 -31.8 139.1 3.6 -94.1 4.5 -3.3 Q3 2.7 2.8 19.6 8.8 -28.5 1.7 4.4 3.5 -19.2 35.0 -14.8 -1.2 3.7 -7.9 Q4 34.9 14.6 19.7 20.6 -20.0 5.9 40.8 -40.2 -54.9 -4.5 -9.9 35.8 -6.8 -0.62012 Q1 -6.0 5.3 15.1 12.0 -38.5 1.9 -4.1 3.3 -5.3 -77.1 -5.4 92.7 -1.6 0.8 Q2 15.4 25.1 20.6 -6.1 -24.2 2.3 17.7 -14.2 -19.3 77.1 -5.9 -57.2 -8.9 -3.5
2011 July 3.4 4.2 7.2 2.7 -10.7 -0.1 3.2 -6.2 -17.3 -24.0 0.3 36.0 -1.2 3.0 Aug. -1.4 -4.3 5.2 5.6 -7.9 2.1 0.6 -0.6 7.2 26.2 -8.0 -29.4 3.4 -0.1 Sep. 0.8 3.0 7.2 0.5 -9.9 -0.2 0.6 10.3 -9.0 32.7 -7.1 -7.9 1.6 -10.9 Oct. 3.7 0.6 6.7 6.3 -9.9 1.8 5.5 1.4 -5.6 -2.7 -1.6 12.3 -1.1 -6.9 Nov. 9.1 5.5 5.3 5.8 -7.5 2.6 11.6 -19.6 -45.0 37.6 -3.8 -8.2 -0.2 7.9 Dec. 22.1 8.4 7.8 8.5 -2.6 1.6 23.6 -22.0 -4.3 -39.4 -4.5 31.7 -5.4 -1.6
2012 Jan. -12.4 -8.1 3.1 2.0 -9.4 0.2 -12.1 22.2 3.6 -43.5 -5.5 68.1 -0.5 -10.0 Feb. -3.4 3.3 5.3 5.2 -17.1 1.8 -1.6 4.4 -0.2 8.7 4.2 -6.6 -1.8 -2.7 Mar. 9.8 10.2 6.7 4.9 -11.9 -0.1 9.6 -23.2 -8.8 -42.2 -4.1 31.2 0.6 13.6 Apr. 1.3 5.4 5.4 -0.8 -8.7 0.4 1.7 -1.8 -9.6 1.3 2.2 7.2 -2.9 0.1 May -3.2 5.5 7.2 -8.0 -8.0 1.5 -1.8 -0.2 9.9 26.7 -6.2 -29.1 -1.5 1.9 June 17.4 14.2 8.0 2.7 -7.5 0.4 17.8 -12.2 -19.7 49.2 -1.9 -35.3 -4.5 -5.6 July 15.9 12.5 8.5 2.4 -7.4 0.2 16.2 -6.0 -6.7 24.3 -2.4 -21.7 0.5 -10.2
12-month cumulated transactions
2012 July 59.6 56.2 76.4 35.0 -108.0 12.2 71.8 -47.4 -88.0 78.8 -38.7 12.5 -11.9 -24.4
12-month cumulated transactions as a percentage of GDP
2012 July 0.6 0.6 0.8 0.4 -1.1 0.1 0.8 -0.5 -0.9 0.8 -0.4 0.1 -0.1 -0.3
C32 Euro area b.o.p.: current account
(seasonally adjusted; 12-month cumulated transactions as a percentage of GDP)
C33 Euro area b.o.p.: direct and portfolio investment
(12-month cumulated transactions as a percentage of GDP)
-2.0
-1.5
-1.0
-0.5
0.0
0.5
1.0
2002 2004 2006 2008 2010 2012-2.0
-1.5
-1.0
-0.5
0.0
0.5
1.0
current account balance
-4.0
-3.0
-2.0
-1.0
0.0
1.0
2.0
3.0
4.0
5.0
2002 2004 2006 2008 2010 2012-4.0
-3.0
-2.0
-1.0
0.0
1.0
2.0
3.0
4.0
5.0
net direct investmentnet portfolio investment
Source: ECB.1) The sign convention is explained in the General Notes.
7
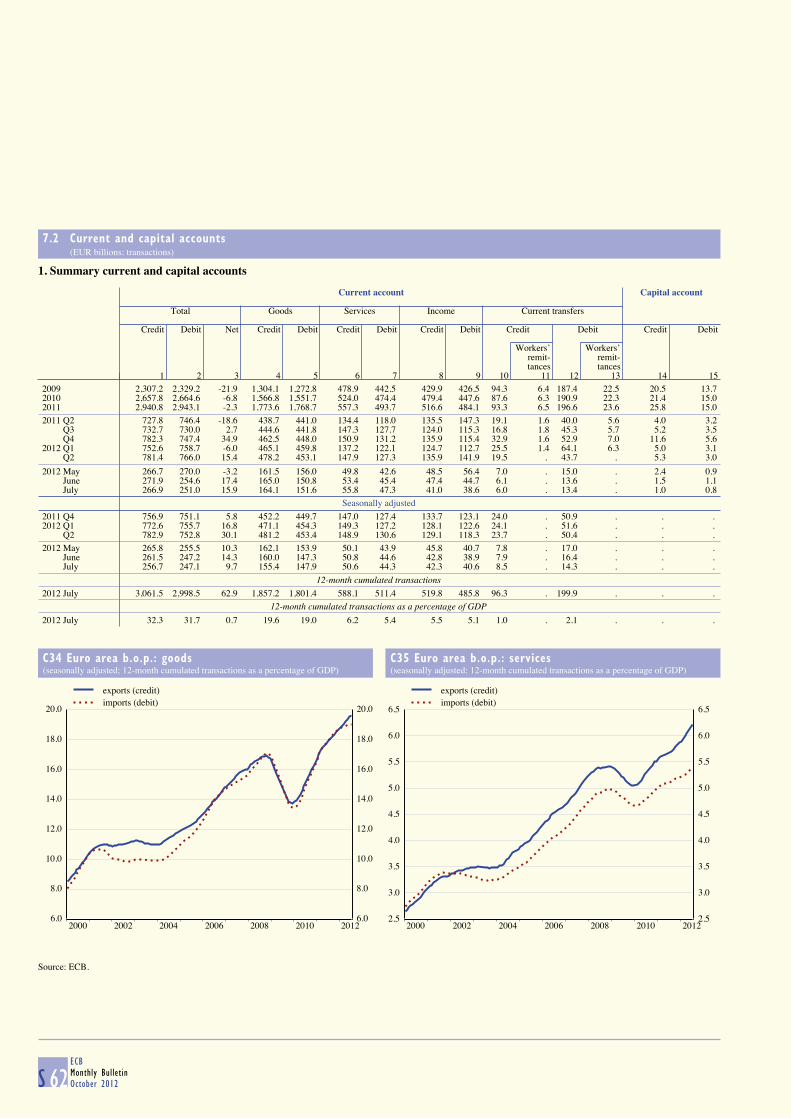
7.2 Current and capital accounts (EUR billions; transactions)
S 62ECBMonthly BulletinOctober 2012
1. Summary current and capital accounts
Current account Capital account
Total Goods Services Income Current transfers
Credit Debit Net Credit Debit Credit Debit Credit Debit Credit Debit Credit Debit
Workers’ Workers’remit- remit-tances tances
1 2 3 4 5 6 7 8 9 10 11 12 13 14 15
2009 2,307.2 2,329.2 -21.9 1,304.1 1,272.8 478.9 442.5 429.9 426.5 94.3 6.4 187.4 22.5 20.5 13.72010 2,657.8 2,664.6 -6.8 1,566.8 1,551.7 524.0 474.4 479.4 447.6 87.6 6.3 190.9 22.3 21.4 15.02011 2,940.8 2,943.1 -2.3 1,773.6 1,768.7 557.3 493.7 516.6 484.1 93.3 6.5 196.6 23.6 25.8 15.0
2011 Q2 727.8 746.4 -18.6 438.7 441.0 134.4 118.0 135.5 147.3 19.1 1.6 40.0 5.6 4.0 3.2 Q3 732.7 730.0 2.7 444.6 441.8 147.3 127.7 124.0 115.3 16.8 1.8 45.3 5.7 5.2 3.5 Q4 782.3 747.4 34.9 462.5 448.0 150.9 131.2 135.9 115.4 32.9 1.6 52.9 7.0 11.6 5.62012 Q1 752.6 758.7 -6.0 465.1 459.8 137.2 122.1 124.7 112.7 25.5 1.4 64.1 6.3 5.0 3.1 Q2 781.4 766.0 15.4 478.2 453.1 147.9 127.3 135.9 141.9 19.5 . 43.7 . 5.3 3.0
2012 May 266.7 270.0 -3.2 161.5 156.0 49.8 42.6 48.5 56.4 7.0 . 15.0 . 2.4 0.9 June 271.9 254.6 17.4 165.0 150.8 53.4 45.4 47.4 44.7 6.1 . 13.6 . 1.5 1.1 July 266.9 251.0 15.9 164.1 151.6 55.8 47.3 41.0 38.6 6.0 . 13.4 . 1.0 0.8
Seasonally adjusted
2011 Q4 756.9 751.1 5.8 452.2 449.7 147.0 127.4 133.7 123.1 24.0 . 50.9 . . . 2012 Q1 772.6 755.7 16.8 471.1 454.3 149.3 127.2 128.1 122.6 24.1 . 51.6 . . . Q2 782.9 752.8 30.1 481.2 453.4 148.9 130.6 129.1 118.3 23.7 . 50.4 . . .
2012 May 265.8 255.5 10.3 162.1 153.9 50.1 43.9 45.8 40.7 7.8 . 17.0 . . . June 261.5 247.2 14.3 160.0 147.3 50.8 44.6 42.8 38.9 7.9 . 16.4 . . . July 256.7 247.1 9.7 155.4 147.9 50.6 44.3 42.3 40.6 8.5 . 14.3 . . .
12-month cumulated transactions
2012 July 3,061.5 2,998.5 62.9 1,857.2 1,801.4 588.1 511.4 519.8 485.8 96.3 . 199.9 . . .
12-month cumulated transactions as a percentage of GDP
2012 July 32.3 31.7 0.7 19.6 19.0 6.2 5.4 5.5 5.1 1.0 . 2.1 . . .
C34 Euro area b.o.p.: goods
(seasonally adjusted; 12-month cumulated transactions as a percentage of GDP)
C35 Euro area b.o.p.: services
(seasonally adjusted; 12-month cumulated transactions as a percentage of GDP)
6.0
8.0
10.0
12.0
14.0
16.0
18.0
20.0
2000 2002 2004 2006 2008 2010 20126.0
8.0
10.0
12.0
14.0
16.0
18.0
20.0
exports (credit)imports (debit)
2.5
3.0
3.5
4.0
4.5
5.0
5.5
6.0
6.5
2000 2002 2004 2006 2008 2010 20122.5
3.0
3.5
4.0
4.5
5.0
5.5
6.0
6.5
exports (credit)imports (debit)
Source: ECB.
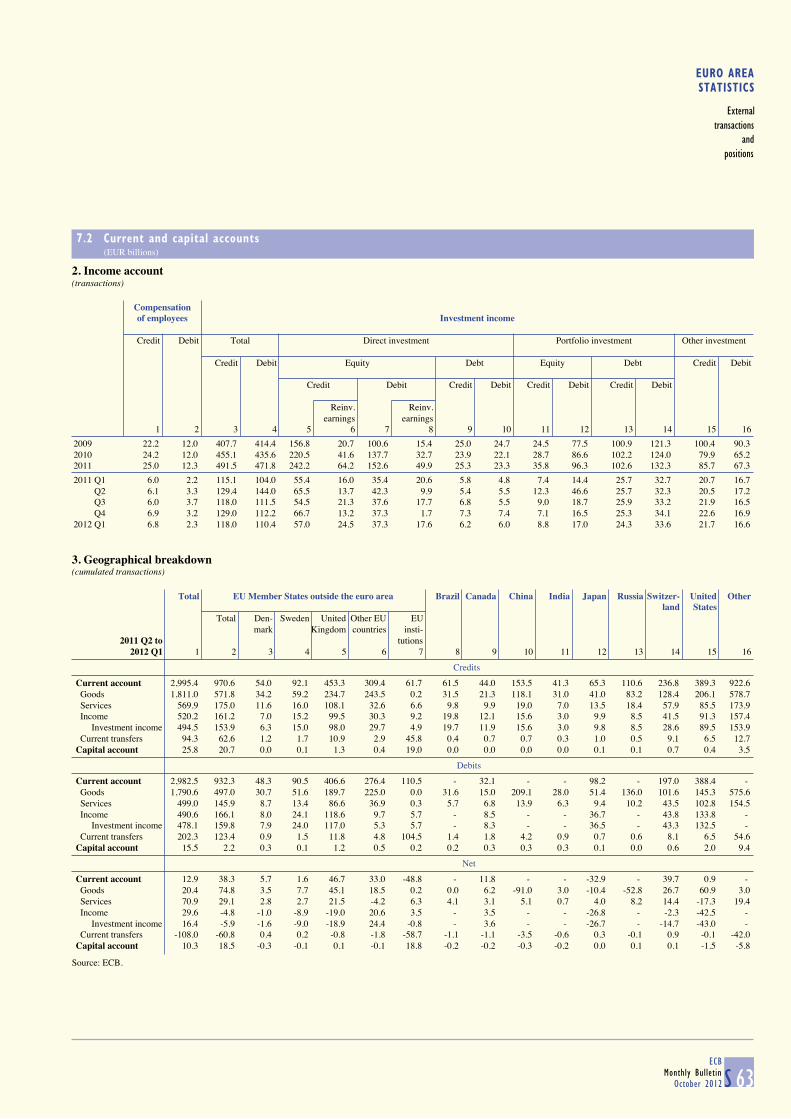
EURO AREASTATISTICS
Externaltransactions
andpositions
7.2 Current and capital accounts (EUR billions)
S 63ECB
Monthly BulletinOctober 2012
2. Income account(transactions)
Compensation of employees Investment income
Credit Debit Total Direct investment Portfolio investment Other investment
Credit Debit Equity Debt Equity Debt Credit Debit
Credit Debit Credit Debit Credit Debit Credit Debit
Reinv. Reinv.earnings earnings
1 2 3 4 5 6 7 8 9 10 11 12 13 14 15 16
2009 22.2 12.0 407.7 414.4 156.8 20.7 100.6 15.4 25.0 24.7 24.5 77.5 100.9 121.3 100.4 90.3 2010 24.2 12.0 455.1 435.6 220.5 41.6 137.7 32.7 23.9 22.1 28.7 86.6 102.2 124.0 79.9 65.2 2011 25.0 12.3 491.5 471.8 242.2 64.2 152.6 49.9 25.3 23.3 35.8 96.3 102.6 132.3 85.7 67.3
2011 Q1 6.0 2.2 115.1 104.0 55.4 16.0 35.4 20.6 5.8 4.8 7.4 14.4 25.7 32.7 20.7 16.7 Q2 6.1 3.3 129.4 144.0 65.5 13.7 42.3 9.9 5.4 5.5 12.3 46.6 25.7 32.3 20.5 17.2 Q3 6.0 3.7 118.0 111.5 54.5 21.3 37.6 17.7 6.8 5.5 9.0 18.7 25.9 33.2 21.9 16.5 Q4 6.9 3.2 129.0 112.2 66.7 13.2 37.3 1.7 7.3 7.4 7.1 16.5 25.3 34.1 22.6 16.9 2012 Q1 6.8 2.3 118.0 110.4 57.0 24.5 37.3 17.6 6.2 6.0 8.8 17.0 24.3 33.6 21.7 16.6
3. Geographical breakdown(cumulated transactions)
Total EU Member States outside the euro area Brazil Canada China India Japan Russia Switzer- United Other
land StatesTotal Den- Sweden United Other EU EU
mark Kingdom countries insti-2011 Q2 to tutions
2012 Q1 1 2 3 4 5 6 7 8 9 10 11 12 13 14 15 16
Credits
Current account 2,995.4 970.6 54.0 92.1 453.3 309.4 61.7 61.5 44.0 153.5 41.3 65.3 110.6 236.8 389.3 922.6 Goods 1,811.0 571.8 34.2 59.2 234.7 243.5 0.2 31.5 21.3 118.1 31.0 41.0 83.2 128.4 206.1 578.7 Services 569.9 175.0 11.6 16.0 108.1 32.6 6.6 9.8 9.9 19.0 7.0 13.5 18.4 57.9 85.5 173.9 Income 520.2 161.2 7.0 15.2 99.5 30.3 9.2 19.8 12.1 15.6 3.0 9.9 8.5 41.5 91.3 157.4 Investment income 494.5 153.9 6.3 15.0 98.0 29.7 4.9 19.7 11.9 15.6 3.0 9.8 8.5 28.6 89.5 153.9 Current transfers 94.3 62.6 1.2 1.7 10.9 2.9 45.8 0.4 0.7 0.7 0.3 1.0 0.5 9.1 6.5 12.7 Capital account 25.8 20.7 0.0 0.1 1.3 0.4 19.0 0.0 0.0 0.0 0.0 0.1 0.1 0.7 0.4 3.5
Debits
Current account 2,982.5 932.3 48.3 90.5 406.6 276.4 110.5 - 32.1 - - 98.2 - 197.0 388.4 - Goods 1,790.6 497.0 30.7 51.6 189.7 225.0 0.0 31.6 15.0 209.1 28.0 51.4 136.0 101.6 145.3 575.6 Services 499.0 145.9 8.7 13.4 86.6 36.9 0.3 5.7 6.8 13.9 6.3 9.4 10.2 43.5 102.8 154.5 Income 490.6 166.1 8.0 24.1 118.6 9.7 5.7 - 8.5 - - 36.7 - 43.8 133.8 - Investment income 478.1 159.8 7.9 24.0 117.0 5.3 5.7 - 8.3 - - 36.5 - 43.3 132.5 - Current transfers 202.3 123.4 0.9 1.5 11.8 4.8 104.5 1.4 1.8 4.2 0.9 0.7 0.6 8.1 6.5 54.6 Capital account 15.5 2.2 0.3 0.1 1.2 0.5 0.2 0.2 0.3 0.3 0.3 0.1 0.0 0.6 2.0 9.4
Net
Current account 12.9 38.3 5.7 1.6 46.7 33.0 -48.8 - 11.8 - - -32.9 - 39.7 0.9 - Goods 20.4 74.8 3.5 7.7 45.1 18.5 0.2 0.0 6.2 -91.0 3.0 -10.4 -52.8 26.7 60.9 3.0 Services 70.9 29.1 2.8 2.7 21.5 -4.2 6.3 4.1 3.1 5.1 0.7 4.0 8.2 14.4 -17.3 19.4 Income 29.6 -4.8 -1.0 -8.9 -19.0 20.6 3.5 - 3.5 - - -26.8 - -2.3 -42.5 - Investment income 16.4 -5.9 -1.6 -9.0 -18.9 24.4 -0.8 - 3.6 - - -26.7 - -14.7 -43.0 - Current transfers -108.0 -60.8 0.4 0.2 -0.8 -1.8 -58.7 -1.1 -1.1 -3.5 -0.6 0.3 -0.1 0.9 -0.1 -42.0 Capital account 10.3 18.5 -0.3 -0.1 0.1 -0.1 18.8 -0.2 -0.2 -0.3 -0.2 0.0 0.1 0.1 -1.5 -5.8
Source: ECB.

7.3 Financial account (EUR billions and annual growth rates; outstanding amounts and growth rates at end of period; transactions and other changes during period)
S 64ECBMonthly BulletinOctober 2012
1. Summary financial account
Outstanding amounts (international investment position)
Total 1) Total Direct Portfolio Net Other Reserve
as a % of GDP investment investment financial investment assetsderivatives
Assets Liabilities Net Assets Liabilities Net Assets Liabilities Assets Liabilities Assets Liabilities
1 2 3 4 5 6 7 8 9 10 11 12 13 14
2008 13,377.1 14,961.4 -1,584.3 144.7 161.8 -17.1 3,878.4 3,247.8 3,834.9 5,976.8 -0.5 5,290.0 5,736.7 374.22009 13,764.1 15,170.3 -1,406.2 154.2 170.0 -15.8 4,287.2 3,403.0 4,341.3 6,781.9 0.2 4,675.9 4,985.4 459.62010 15,234.8 16,461.7 -1,226.9 165.9 179.3 -13.4 4,798.2 3,714.8 4,907.5 7,442.9 -61.6 5,002.9 5,304.0 587.8
2011 Q3 15,558.2 16,782.4 -1,224.2 165.7 178.7 -13.0 5,089.1 3,896.4 4,573.8 7,523.4 -45.9 5,294.5 5,362.6 646.6 Q4 15,938.3 17,023.5 -1,085.2 169.1 180.6 -11.5 5,321.0 4,025.7 4,751.0 7,669.2 -19.1 5,218.4 5,328.5 667.12012 Q1 16,303.9 17,344.1 -1,040.2 172.3 183.3 -11.0 5,405.9 4,055.3 5,034.7 7,833.9 -20.3 5,212.4 5,454.9 671.3
Changes to outstanding amounts
2008 -615.7 -305.5 -310.3 -6.7 -3.3 -3.4 151.7 25.9 -796.2 -561.3 28.4 -26.7 229.9 27.02009 387.1 208.9 178.1 4.3 2.3 2.0 408.8 155.2 506.4 805.1 0.7 -614.1 -751.4 85.42010 1,470.7 1,291.5 179.3 16.0 14.1 2.0 511.0 311.8 566.2 661.0 -61.7 327.1 318.7 128.22011 703.5 561.7 141.7 7.5 6.0 1.5 522.8 310.9 -156.5 226.3 42.4 215.5 24.5 79.3
2011 Q4 380.1 241.1 139.1 15.7 9.9 5.7 231.8 129.4 177.2 145.8 26.7 -76.1 -34.1 20.52012 Q1 365.6 320.6 44.9 15.7 13.8 1.9 84.9 29.5 283.7 164.7 -1.2 -6.1 126.4 4.2
Transactions
2008 429.9 551.3 -121.3 4.7 6.0 -1.3 336.6 105.5 5.0 266.4 84.5 0.5 179.4 3.42009 -131.4 -121.9 -9.4 -1.5 -1.4 -0.1 337.0 231.9 90.4 356.1 -20.0 -534.2 -709.9 -4.62010 589.9 587.4 2.5 6.4 6.4 0.0 275.8 161.8 143.0 308.1 -18.5 179.1 117.4 10.52011 489.2 468.5 20.8 5.2 5.0 0.2 347.3 198.6 -49.3 256.3 21.5 159.5 13.6 10.2
2011 Q4 -80.3 -120.5 40.2 -3.3 -5.0 1.7 105.8 51.0 -48.9 -53.4 9.9 -153.9 -118.1 6.82012 Q1 295.2 298.5 -3.3 12.7 12.8 -0.1 82.1 76.8 138.2 61.1 5.4 67.8 160.6 1.6 Q2 67.6 53.3 14.2 2.9 2.3 0.6 57.6 38.2 -34.7 42.4 5.9 29.8 -27.3 8.9
2012 Mar. 116.4 93.2 23.2 . . . 32.8 24.0 55.3 13.1 4.1 24.8 56.0 -0.6 Apr. 8.8 6.9 1.8 . . . 21.6 12.1 -11.4 -10.2 -2.2 -2.2 5.0 2.9 May 105.2 105.1 0.2 . . . 6.7 16.7 5.6 32.3 6.2 85.2 56.1 1.5 June -46.4 -58.6 12.2 . . . 29.2 9.5 -28.9 20.3 1.9 -53.1 -88.4 4.5 July 32.7 26.8 6.0 . . . 6.0 -0.6 -13.9 10.4 2.4 38.6 17.0 -0.5
Other changes
2007 -332.3 -84.4 -247.9 -3.7 -0.9 -2.7 59.9 64.3 -180.8 25.1 -75.1 -152.6 -173.8 16.32008 -1,045.7 -856.7 -188.9 -11.3 -9.3 -2.0 -184.9 -79.5 -801.2 -827.7 -56.0 -27.2 50.5 23.72009 518.4 330.8 187.6 5.8 3.7 2.1 71.8 -76.7 416.0 449.0 20.7 -80.0 -41.5 89.92010 880.8 704.1 176.7 9.6 7.7 1.9 235.2 150.0 423.2 352.9 -43.2 147.9 201.2 117.7
Other changes due to exchange rate changes
2007 -522.0 -339.7 -182.3 -5.8 -3.8 -2.0 -104.2 -17.1 -217.4 -146.8 . -186.6 -175.8 -13.72008 -49.8 27.9 -77.7 -0.5 0.3 -0.8 -25.0 -34.0 6.6 41.9 . -40.7 20.1 9.32009 -49.6 -55.1 5.5 -0.6 -0.6 0.1 -4.6 5.7 -30.5 -32.9 . -11.9 -27.9 -2.72010 535.4 323.9 211.5 5.8 3.5 2.3 160.8 57.6 179.4 101.7 . 182.2 164.6 13.0
Other changes due to price changes
2007 78.7 113.4 -34.6 0.9 1.3 -0.4 45.2 5.8 77.3 107.6 -75.1 . . 31.32008 -1,002.7 -975.7 -27.1 -10.8 -10.6 -0.3 -159.2 -60.7 -809.5 -915.0 -56.0 . . 22.02009 634.2 483.5 150.7 7.1 5.4 1.7 142.5 28.4 425.2 455.2 20.7 . . 45.82010 296.3 153.8 142.5 3.2 1.7 1.6 50.2 2.2 187.3 151.7 -43.2 . . 102.0
Other changes due to other adjustments
2007 110.9 142.0 -31.0 1.2 1.6 -0.3 118.8 75.6 -40.7 64.3 . 34.1 2.0 -1.32008 6.8 91.0 -84.1 0.1 1.0 -0.9 -0.7 15.2 1.8 45.4 . 13.4 30.4 -7.72009 -66.2 -97.6 31.4 -0.7 -1.1 0.4 -66.2 -110.8 21.2 26.8 . -68.1 -13.6 46.82010 49.1 226.4 -177.3 0.5 2.5 -1.9 24.2 90.1 56.5 99.6 . -34.3 36.7 2.7
Growth rates of outstanding amounts
2007 15.6 14.3 - . . . 15.8 15.1 10.0 9.4 . 20.2 20.2 1.62008 3.0 3.6 - . . . 9.2 3.3 -0.2 4.2 . 0.0 3.3 1.02009 -1.0 -0.8 - . . . 8.7 7.3 2.3 5.9 . -10.1 -12.3 -1.22010 4.1 3.8 - . . . 6.2 4.6 3.2 4.4 . 3.8 2.3 2.0
2011 Q4 3.2 2.9 - . . . 7.2 5.3 -1.1 3.5 . 3.3 0.3 1.62012 Q1 3.5 3.2 - . . . 6.1 5.0 1.3 2.1 . 2.9 3.4 -0.1 Q2 2.6 2.2 . . . . 5.9 5.2 -0.2 0.3 . 1.4 2.7 2.0
Source: ECB.1) Net financial derivatives are included in assets.

EURO AREASTATISTICS
Externaltransactions
andpositions
7.3 Financial account (EUR billions and annual growth rates; outstanding amounts and growth rates at end of period, transactions during period)
S 65ECB
Monthly BulletinOctober 2012
2. Direct investment
Oustanding amounts (international investment position)
By resident units abroad By non-resident units in the euro area
Total Equity capital Other capital Total Equity capital Other capital and reinvested earnings (mostly inter-company loans) and reinvested earnings (mostly inter-company loans)
Total MFIs Non- Total MFIs Non- Total Into MFIs Into Total To MFIs ToMFIs MFIs non-MFIs non-MFIs
1 2 3 4 5 6 7 8 9 10 11 12 13 14
2009 4,287.2 3,305.5 236.2 3,069.3 981.7 14.8 966.9 3,403.0 2,501.9 74.2 2,427.7 901.1 18.1 883.02010 4,798.2 3,667.1 277.9 3,389.2 1,131.1 17.8 1,113.3 3,714.8 2,820.2 83.2 2,737.0 894.6 12.7 881.9
2011 Q4 5,321.0 4,149.9 293.2 3,856.7 1,171.0 14.7 1,156.4 4,025.7 3,150.7 85.2 3,065.4 875.1 10.1 865.02012 Q1 5,405.9 4,227.1 289.1 3,937.9 1,178.9 15.0 1,163.9 4,055.3 3,208.5 84.5 3,124.0 846.8 8.8 838.0
Transactions
2009 337.0 258.1 21.6 236.5 78.9 2.6 76.3 231.9 236.3 5.6 230.7 -4.4 -0.6 -3.82010 275.8 157.0 14.9 142.2 118.7 1.2 117.5 161.8 203.2 6.1 197.1 -41.3 -7.5 -33.82011 347.3 305.0 16.3 288.7 42.3 -3.3 45.6 198.6 211.7 3.5 208.3 -13.2 -3.1 -10.0
2011 Q4 105.8 107.7 0.8 106.9 -1.8 1.0 -2.8 51.0 45.4 0.7 44.8 5.5 0.4 5.12012 Q1 82.1 60.3 -2.3 62.6 21.8 1.2 20.7 76.8 78.8 1.2 77.6 -2.0 -0.6 -1.3 Q2 57.6 32.1 -2.0 34.1 25.5 -0.5 26.0 38.2 33.5 0.6 33.0 4.7 0.1 4.6
2012 Mar. 32.8 14.6 -1.3 15.9 18.2 0.5 17.7 24.0 22.1 -0.6 22.7 2.0 -1.0 3.0 Apr. 21.6 10.0 -1.0 11.0 11.6 0.1 11.5 12.1 4.0 -0.1 4.0 8.1 0.6 7.6 May 6.7 7.8 -0.3 8.1 -1.1 -0.2 -0.9 16.7 16.1 0.2 15.9 0.6 0.0 0.5 June 29.2 14.2 -0.7 15.0 15.0 -0.4 15.4 9.5 13.5 0.4 13.1 -4.0 -0.5 -3.5 July 6.0 14.7 2.1 12.6 -8.7 -0.1 -8.6 -0.6 11.8 0.7 11.1 -12.4 0.9 -13.3
Growth rates
2009 8.7 8.6 9.9 8.5 9.0 20.5 8.8 7.3 10.4 8.6 10.4 -0.5 -3.2 -0.42010 6.2 4.5 6.2 4.4 12.0 7.8 12.0 4.6 7.9 8.0 7.9 -4.6 -41.3 -3.8
2011 Q4 7.2 8.2 5.9 8.4 3.8 -19.6 4.1 5.3 7.5 4.2 7.6 -1.5 -25.3 -1.22012 Q1 6.1 6.7 3.5 6.9 4.1 -13.5 4.4 5.0 7.3 5.0 7.4 -2.5 -22.9 -2.3 Q2 5.9 6.0 -0.4 6.5 5.8 -1.5 5.9 5.2 7.2 4.1 7.3 -1.4 -8.6 -1.4
C36 Euro area international investment position
(outstanding amounts at end of period; as a percentage of GDP)
C37 Euro area direct and portfolio investment position
(outstanding amounts at end of period; as a percentage of GDP)
-18.0
-16.0
-14.0
-12.0
-10.0
-8.0
-6.0
-4.0
2002 2004 2006 2008 2010-18.0
-16.0
-14.0
-12.0
-10.0
-8.0
-6.0
-4.0
net international investment position
-40.0
-30.0
-20.0
-10.0
0.0
10.0
20.0
2002 2004 2006 2008 2010-40.0
-30.0
-20.0
-10.0
0.0
10.0
20.0
net direct investmentnet portfolio investment
Source: ECB.

7.3 Financial account (EUR billions and annual growth rates; outstanding amounts and growth rates at end of period; transactions during period)
S 66ECBMonthly BulletinOctober 2012
3. Portfolio investment assets
Outstanding amounts (international investment position)
Total Equity Debt instruments
Bonds and notes Money market instruments
Total MFIs Non-MFIs Total MFIs Non-MFIs Total MFIs Non-MFIs
Euro- General Euro- General Euro- Generalsystem government system government system government
1 2 3 4 5 6 7 8 9 10 11 12 13 14 15 16
2009 4,341.3 1,514.5 80.8 3.4 1,433.6 36.6 2,426.6 924.6 17.1 1,502.0 36.6 400.2 330.2 44.9 69.9 2.02010 4,907.5 1,914.2 93.8 3.6 1,820.5 47.6 2,588.8 810.7 15.6 1,778.1 75.7 404.5 314.9 41.7 89.6 0.2
2011 Q4 4,751.0 1,704.8 70.4 3.1 1,634.4 39.4 2,584.3 728.2 16.0 1,856.1 94.2 461.9 300.4 57.5 161.5 0.52012 Q1 5,034.7 1,847.0 77.5 3.3 1,769.5 39.2 2,680.3 708.7 15.3 1,971.7 97.7 507.4 331.2 48.5 176.1 0.3
Transactions
2009 90.4 53.1 -1.3 0.0 54.4 2.5 42.9 -93.0 -3.8 135.9 17.5 -5.6 0.5 -12.9 -6.1 0.92010 143.0 76.7 5.6 -0.2 71.1 1.7 106.7 -125.3 -0.9 232.0 51.5 -40.4 -55.7 -11.7 15.3 -1.92011 -49.3 -71.4 -19.0 -0.6 -52.4 -7.3 -16.6 -59.4 0.3 42.8 -3.0 38.8 33.0 10.5 5.8 0.2
2011 Q4 -48.9 -39.2 -9.3 -0.3 -29.8 -0.9 -29.2 -22.7 -1.7 -6.5 -1.7 19.5 19.2 0.6 0.3 0.02012 Q1 138.2 22.5 4.4 0.0 18.1 -1.8 69.5 -8.1 -0.6 77.6 -0.6 46.1 26.5 -4.2 19.6 -0.1 Q2 -34.7 -11.8 -8.1 0.0 -3.8 . 5.7 -12.5 0.4 18.1 . -28.5 -40.0 -3.8 11.5 .
2012 Mar. 55.3 14.8 5.6 0.0 9.1 . 18.6 -0.3 0.0 18.9 . 21.9 15.0 -0.4 6.9 . Apr. -11.4 5.8 -0.9 0.0 6.7 . -7.6 -13.4 0.6 5.8 . -9.6 -16.3 1.9 6.7 . May 5.6 -6.1 -2.8 0.0 -3.3 . 13.1 4.5 0.6 8.5 . -1.3 -5.6 0.9 4.3 . June -28.9 -11.5 -4.4 0.0 -7.1 . 0.3 -3.6 -0.8 3.8 . -17.6 -18.1 -6.7 0.5 . July -13.9 -3.6 -0.3 0.0 -3.3 . -1.6 -13.4 1.2 11.8 . -8.7 -8.1 -5.1 -0.7 .
Growth rates
2009 2.3 3.8 -2.4 -0.6 4.2 8.5 1.8 -9.4 -19.0 10.5 93.4 -2.0 -0.9 -22.3 -7.9 67.22010 3.2 4.8 7.0 -5.2 4.7 4.8 4.2 -13.5 -4.9 14.8 122.5 -9.5 -16.0 -25.4 21.1 -91.9
2011 Q4 -1.1 -4.2 -21.5 -16.7 -3.2 -15.8 -0.7 -7.5 2.0 2.4 -3.2 10.0 11.3 26.5 6.4 125.82012 Q1 1.3 -2.6 -16.7 -4.9 -1.9 -16.1 1.8 -7.1 -11.3 5.7 -3.6 14.4 15.0 13.0 11.3 -63.9 Q2 -0.2 -4.6 -27.9 -6.3 -3.4 . 1.0 -8.2 -11.0 4.9 . 11.3 4.7 -7.1 20.3 .
4. Portfolio investment liabilities
Outstanding amounts (international investment position)
Total Equity Debt instruments
Bonds and notes Money market instruments
Total MFIs Non-MFIs Total MFIs Non-MFIs Total MFIs Non-MFIs
General Generalgovernment government
1 2 3 4 5 6 7 8 9 10 11 12
2009 6,781.9 2,781.9 686.2 2,095.7 3,493.1 1,093.2 2,399.9 1,481.2 506.9 66.2 440.7 409.32010 7,442.9 3,150.7 658.0 2,492.7 3,823.0 1,165.4 2,657.5 1,680.3 469.2 77.2 392.0 352.6
2011 Q4 7,669.2 3,067.7 559.5 2,508.1 4,142.0 1,260.7 2,881.4 1,796.9 459.5 100.6 358.9 316.82012 Q1 7,833.9 3,251.8 556.4 2,695.4 4,106.9 1,216.8 2,890.1 1,810.2 475.3 100.5 374.8 332.6
Transactions
2009 356.1 124.6 10.7 113.9 140.5 -14.4 154.9 101.3 90.9 -18.5 109.4 144.32010 308.1 144.2 -16.3 160.4 184.2 59.1 125.1 194.5 -20.3 19.2 -39.5 -34.92011 256.3 121.7 20.9 100.8 161.7 59.2 102.5 100.6 -27.1 19.1 -46.2 -35.0
2011 Q4 -53.4 43.5 30.0 13.5 -36.8 -29.8 -7.0 -4.0 -60.1 1.3 -61.4 -70.92012 Q1 61.1 41.0 8.1 32.8 9.2 -16.6 25.9 10.3 10.9 0.9 10.0 9.2 Q2 42.4 0.5 -8.0 8.5 53.7 -20.5 74.2 . -11.8 -0.7 -11.1 .
2012 Mar. 13.1 36.8 -0.4 37.2 -11.9 -4.6 -7.3 . -11.7 7.4 -19.2 . Apr. -10.2 -10.1 -3.2 -6.8 -4.5 3.4 -8.0 . 4.4 -7.4 11.8 . May 32.3 -0.2 6.2 -6.4 26.7 -17.6 44.4 . 5.7 2.2 3.5 . June 20.3 10.7 -11.0 21.7 31.5 -6.3 37.8 . -22.0 4.5 -26.5 . July 10.4 -8.7 -6.1 -2.7 1.4 -0.1 1.5 . 17.7 2.0 15.8 .
Growth rates
2009 5.9 5.4 1.7 6.8 4.1 -1.2 7.0 7.2 23.1 -29.1 33.1 53.52010 4.4 5.1 -2.4 7.5 5.1 5.2 5.1 12.9 -4.2 26.3 -9.1 -8.7
2011 Q4 3.5 4.0 3.3 4.1 4.4 5.4 3.9 6.1 -5.0 25.6 -11.3 -10.42012 Q1 2.1 2.0 3.9 1.5 3.9 1.3 5.1 4.7 -8.3 -2.5 -10.0 -12.2 Q2 0.3 2.2 3.1 1.8 0.7 -4.2 2.8 . -12.8 -10.0 -13.8 .
Source: ECB.

EURO AREASTATISTICS
Externaltransactions
andpositions
7.3 Financial account (EUR billions and annual growth rates; outstanding amounts and growth rates at end of period; transactions during period)
S 67ECB
Monthly BulletinOctober 2012
5. Other investment assets
Outstanding amounts (international investment position)
Total Eurosystem MFIs General Other sectors
(excluding Eurosystem) government
Total Loans/ Other Total Loans/ Other Trade Loans/currency Trade Loans/currencycurrency assets currency assets credits and deposits credits and deposits
and anddeposits deposits Currency Currency
and anddeposits deposits
1 2 3 4 5 6 7 8 9 10 11 12 13 14 15
2009 4,675.9 30.2 29.8 0.4 2,834.7 2,804.2 30.5 122.1 8.4 74.9 15.9 1,688.9 201.4 1,344.7 402.62010 5,002.9 32.6 32.0 0.7 2,972.3 2,939.9 32.4 166.3 7.6 117.6 21.0 1,831.8 214.4 1,468.5 428.6
2011 Q4 5,218.4 35.5 35.2 0.3 3,067.1 3,008.8 58.4 162.8 6.7 116.5 30.2 1,953.0 227.8 1,573.1 489.72012 Q1 5,212.4 36.7 36.4 0.3 3,046.9 2,994.4 52.5 150.0 7.3 103.6 24.5 1,978.8 236.3 1,572.9 503.4
Transactions
2009 -534.2 0.1 0.0 0.1 -420.4 -399.9 -20.5 11.8 -0.4 10.4 0.2 -125.6 7.5 -129.0 -34.82010 179.1 -2.9 -2.9 0.0 8.6 -0.2 8.8 41.7 -0.3 41.3 4.9 131.7 7.6 101.7 46.72011 159.5 -2.6 -2.7 0.1 52.2 22.8 29.4 1.1 -0.2 0.8 9.8 108.8 8.0 78.8 45.6
2011 Q4 -153.9 -8.2 -8.2 0.0 -155.0 -155.3 0.3 16.6 0.0 16.9 13.2 -7.3 0.0 3.1 -11.52012 Q1 67.8 1.2 1.2 0.0 31.2 36.0 -4.9 -10.4 -0.2 -10.1 -5.7 45.9 9.1 22.3 17.3 Q2 29.8 -8.4 . . -6.6 . . 6.5 . . 5.5 38.3 . . 33.9
2012 Mar. 24.8 -0.7 . . 15.2 . . -0.6 . . 0.1 11.0 . . 5.9 Apr. -2.2 -0.1 . . 5.2 . . 0.8 . . 0.7 -8.0 . . -3.4 May 85.2 -1.7 . . 49.8 . . 5.0 . . 3.8 32.0 . . 26.7 June -53.1 -6.6 . . -61.5 . . 0.7 . . 1.0 14.3 . . 10.5 July 38.6 5.1 . . 20.0 . . -0.1 . . 1.6 13.6 . . 13.7
Growth rates
2009 -10.1 -0.4 -1.4 23.4 -12.8 -12.4 -37.0 10.8 -3.5 17.1 3.5 -6.9 3.8 -8.6 -8.22010 3.8 -13.1 -13.0 -9.9 0.4 0.1 27.7 33.2 -3.1 53.2 30.6 7.7 3.7 7.4 11.3
2011 Q4 3.3 -5.3 -5.4 40.4 1.9 0.9 88.4 1.0 -3.2 1.3 51.5 6.1 3.7 5.5 10.92012 Q1 2.9 -11.9 -12.2 43.2 0.8 0.2 38.2 -0.1 -3.9 0.4 54.5 7.1 4.8 6.9 13.1 Q2 1.4 -39.8 . . -1.5 . . 4.7 . . 63.8 7.0 . . 12.5
6. Other investment liabilities
Outstanding amounts (international investment position)
Total Eurosystem MFIs General Other sectors
(excluding Eurosystem) government
Total Loans/ Other Total Loans/ Other Total Trade Loans Other Total Trade Loans Othercurrency liabilities currency liabilities credits liabilities credits liabilities
and anddeposits deposits
1 2 3 4 5 6 7 8 9 10 11 12 13 14 15
2009 4,985.4 251.7 251.3 0.4 3,399.7 3,360.7 39.0 85.2 0.0 80.8 4.4 1,248.8 177.8 929.3 141.72010 5,304.0 268.8 265.7 3.1 3,508.6 3,462.6 46.0 153.9 0.0 147.2 6.6 1,372.8 200.8 1,016.2 155.8
2011 Q4 5,328.5 408.8 406.0 2.8 3,208.0 3,140.4 67.6 223.5 0.1 216.0 7.4 1,488.3 217.2 1,112.8 158.32012 Q1 5,454.9 334.2 331.3 2.9 3,364.6 3,301.1 63.5 231.0 0.1 223.0 7.9 1,525.1 221.1 1,132.7 171.3
Transactions
2009 -709.9 -233.2 -233.4 0.2 -352.8 -341.6 -11.2 17.2 0.0 17.2 0.0 -141.1 0.8 -127.6 -14.32010 117.4 8.9 6.3 2.6 -10.8 -16.7 5.9 65.6 0.0 64.8 0.8 53.7 15.4 14.9 23.42011 13.6 134.6 134.8 -0.2 -285.8 -324.5 38.7 73.0 0.0 73.2 -0.2 91.8 9.8 49.7 32.3
2011 Q4 -118.1 87.9 88.0 0.0 -229.1 -237.1 8.0 9.3 0.0 8.8 0.5 13.7 -0.1 21.7 -7.82012 Q1 160.6 -71.5 -71.7 0.1 187.1 190.6 -3.5 8.4 0.0 7.4 1.0 36.7 5.6 18.0 13.1 Q2 -27.3 74.2 . . -123.4 . . 6.4 . . . 15.6 . . .
2012 Mar. 56.0 -35.6 . . 85.1 . . 3.2 . . . 3.3 . . . Apr. 5.0 1.0 . . 2.9 . . 5.5 . . . -4.4 . . . May 56.1 40.5 . . 1.4 . . 2.9 . . . 11.4 . . . June -88.4 32.7 . . -127.7 . . -2.0 . . . 8.6 . . . July 17.0 27.7 . . -27.1 . . 1.4 . . . 14.9 . . .
Growth rates
2009 -12.3 -48.1 -48.1 . -9.4 -9.2 -19.8 24.9 . 26.5 -0.7 -9.9 0.3 -11.6 -9.22010 2.3 3.4 2.4 . -0.2 -0.4 15.5 75.5 . 79.7 11.8 4.1 8.5 1.4 15.4
2011 Q4 0.3 50.6 51.2 . -8.2 -9.4 89.7 48.7 . 51.1 -2.7 6.8 4.8 5.0 22.52012 Q1 3.4 19.9 19.1 . -1.1 -1.9 45.9 30.8 . 30.7 32.1 7.7 5.9 6.6 18.1 Q2 2.7 42.8 . . -4.2 . . 25.2 . . . 8.3 . . .
Source: ECB.

7.3 Financial account (EUR billions and annual growth rates; outstanding amounts and growth rates at end of period; transactions during period)
S 68ECBMonthly BulletinOctober 2012
7. Reserve assets 1)
Outstanding amounts (international investment position)
Reserve assets Memo
items
Total Monetary gold SDR Reserve Foreign exchange Other Other Pre- SDR
holdings position claims foreign determined allo-In In fine in the Total Currency and Securities Financial currency short-term cations
EUR troy IMF deposits derivatives assets netbillions ounces drains
(millions) With With Total Equity Bonds Money onmonetary banks and market foreign
authorities notes instruments currencyand the BIS
1 2 3 4 5 6 7 8 9 10 11 12 13 14 15 16 17
2008 374.2 217.0 349.207 4.7 7.3 145.1 7.6 8.1 129.5 0.6 111.3 17.6 0.0 0.0 262.8 -245.7 5.52009 462.4 266.1 347.180 50.8 10.5 134.9 11.7 8.1 115.2 0.5 92.0 22.7 -0.1 0.0 32.1 -24.2 51.22010 591.2 366.2 346.962 54.2 15.8 155.0 7.7 16.1 131.3 0.5 111.2 19.5 0.0 0.0 26.3 -24.4 54.5
2011 Q3 646.7 416.3 346.989 52.9 26.1 151.4 5.5 11.1 135.1 0.6 120.5 14.0 -0.4 0.0 31.4 -24.5 54.5 Q4 667.1 422.1 346.846 54.0 30.2 160.9 5.3 7.8 148.1 0.6 134.3 13.3 -0.4 0.0 97.4 -86.0 55.92012 Q1 671.1 431.7 346.847 52.5 30.9 155.7 4.5 7.6 143.5 0.5 129.8 13.2 0.1 0.3 55.2 -42.7 54.7
2012 July 724.8 458.0 346.825 55.5 34.1 176.7 5.2 10.6 161.5 - - - -0.6 0.6 58.2 -47.5 57.9 Aug. 716.1 453.4 346.826 54.3 34.6 173.2 5.2 8.6 159.5 - - - -0.1 0.6 49.8 -40.1 56.9
Transactions
2009 -4.6 -2.0 - 0.5 3.4 -6.4 3.1 -1.2 -9.5 0.0 -14.1 4.6 1.2 0.0 - - - 2010 10.5 0.0 - -0.1 4.9 5.7 -5.4 6.7 4.3 0.0 10.6 -6.3 0.0 0.0 - - - 2011 10.2 0.1 - -1.6 12.9 -1.1 -2.3 -8.2 9.3 -0.2 16.2 -6.8 0.0 0.0 - - -
2011 Q4 6.8 0.0 - -0.4 3.1 4.1 -0.5 -3.0 7.4 -0.2 8.8 -1.2 0.1 0.0 - - - 2012 Q1 1.6 0.0 - -0.3 1.3 0.3 -0.2 -0.6 0.9 -0.1 -1.1 2.1 0.2 0.3 - - - Q2 8.9 - - - - - - - - - - - - - - - -
Growth rates
2007 1.6 -1.7 - 7.3 -18.3 6.3 15.0 6.4 5.7 1.1 18.6 -27.6 - - - - - 2008 1.0 -1.3 - -2.5 105.5 1.7 67.8 -68.9 10.8 28.0 17.9 -20.6 - - - - - 2009 -1.2 -0.9 - -2.6 45.5 -4.4 41.1 -21.3 -7.3 1.0 -12.8 25.3 - - - - - 2010 2.0 0.0 - -0.1 46.4 3.7 -43.3 76.2 3.6 -5.2 10.3 -24.5 - - - - -
2011 Q4 1.6 0.0 - -3.0 82.2 -1.1 -30.0 -52.4 6.9 -21.6 14.6 -45.3 - - - - - 2012 Q1 -0.1 0.0 - -1.2 34.4 -4.9 -15.6 -63.3 3.7 -27.8 9.6 -38.3 - - - - - Q2 2.0 - - - - - - - - - - - - - - - -
8. Gross external debt
Outstanding amounts (international investment position)
Total By instrument By sector (excluding direct investment)
Loans, Money Bonds Trade Other debt Direct investment: General Eurosystem MFIs Othercurrency market and notes credits liabilities inter-company government (excluding sectors
and instruments lending Eurosystem)deposits
1 2 3 4 5 6 7 8 9 10 11
2008 10,914.5 5,340.8 398.1 3,377.9 184.1 211.8 1,401.7 1,747.0 482.7 5,006.5 2,276.52009 10,391.3 4,622.0 506.9 3,493.1 177.8 185.6 1,405.9 1,975.7 251.7 4,559.1 2,198.92010 11,016.4 4,891.7 469.2 3,823.0 200.8 211.5 1,420.2 2,186.8 268.8 4,751.3 2,389.4
2011 Q3 11,464.2 4,896.6 532.0 4,148.9 219.7 246.4 1,420.7 2,431.3 315.2 4,736.6 2,560.4 Q4 11,345.0 4,875.2 459.5 4,142.0 217.3 236.1 1,415.0 2,337.2 408.8 4,569.2 2,614.92012 Q1 11,417.2 4,988.1 475.3 4,106.9 221.2 245.6 1,380.1 2,373.8 334.2 4,681.9 2,647.1
Outstanding amounts as a percentage of GDP
2008 118.1 57.8 4.3 36.6 2.0 2.3 15.2 18.9 5.2 54.2 24.62009 116.5 51.8 5.7 39.2 2.0 2.1 15.8 22.1 2.8 51.1 24.62010 120.1 53.3 5.1 41.7 2.2 2.3 15.5 23.8 2.9 51.8 26.0
2011 Q3 122.3 52.2 5.7 44.2 2.3 2.6 15.1 25.9 3.4 50.5 27.3 Q4 120.4 51.7 4.9 44.0 2.3 2.5 15.0 24.8 4.3 48.5 27.82012 Q1 120.8 52.8 5.0 43.5 2.3 2.6 14.6 25.1 3.5 49.6 28.0
Source: ECB.1) Data refer to the changing composition of the euro area, in line with the approach adopted for the reserve assets of the Eurosystem. For further information, see the General Notes.

EURO AREASTATISTICS
Externaltransactions
andpositions
7.3 Financial account (EUR billions; outstanding amounts at end of period; transactions during period)
S 69ECB
Monthly BulletinOctober 2012
9. Geographical breakdown
Total EU Member States outside the euro area Canada China Japan Switzer- United Offshore Interna- Otherland States financial tional countries
Total Denmark Sweden United Other EU EU centres organisa-Kingdom countries institutions tions
1 2 3 4 5 6 7 8 9 10 11 12 13 14 15
2010 Outstanding amounts (international investment position)
Direct investment 1,083.3 116.9 3.8 -6.6 -170.8 291.8 -1.3 50.4 57.1 -3.9 178.9 -23.2 42.7 -0.3 664.8 Abroad 4,798.2 1,490.8 36.2 141.7 994.2 318.7 0.0 154.7 61.5 87.2 479.5 899.7 586.7 0.0 1,037.9 Equity/reinvested earnings 3,667.1 1,114.0 32.2 88.8 733.5 259.4 0.0 121.4 49.5 65.8 374.0 637.1 501.8 0.0 803.6 Other capital 1,131.1 376.8 4.0 52.9 260.7 59.2 0.0 33.3 12.0 21.4 105.6 262.7 85.0 0.0 234.3 In the euro area 3,714.8 1,374.0 32.5 148.4 1,165.0 26.9 1.3 104.3 4.4 91.1 300.6 922.9 544.1 0.4 373.1 Equity/reinvested earnings 2,820.2 1,121.1 22.5 133.9 958.4 4.9 1.3 91.7 3.4 73.5 201.8 702.5 387.3 0.1 238.8 Other capital 894.6 252.9 10.0 14.4 206.6 21.9 0.0 12.6 1.0 17.6 98.8 220.4 156.7 0.2 134.3 Portfolio investment assets 4,907.5 1,550.5 84.0 189.3 1,054.9 103.5 118.9 110.8 59.5 203.6 134.6 1,557.4 460.8 30.8 799.6 Equity 1,914.2 379.4 13.7 46.0 300.5 18.1 1.1 44.6 57.2 106.3 117.5 574.9 243.0 1.4 390.1 Debt instruments 2,993.3 1,171.1 70.3 143.3 754.4 85.3 117.8 66.3 2.2 97.3 17.1 982.5 217.8 29.4 409.6 Bonds and notes 2,588.8 1,031.4 63.0 121.3 646.1 83.8 117.2 61.8 1.4 44.3 11.7 836.1 208.6 29.0 364.5 Money market instruments 404.5 139.7 7.3 21.9 108.3 1.6 0.6 4.5 0.8 53.0 5.5 146.4 9.2 0.4 45.1 Other investment -301.1 -241.1 54.8 1.5 -202.0 85.9 -181.2 -7.3 -8.0 19.9 -34.4 -94.6 -5.0 -25.2 94.7 Assets 5,002.9 2,295.1 112.6 96.9 1,869.7 198.5 17.4 28.5 38.7 103.7 275.2 713.1 588.7 48.8 911.2 General government 166.3 55.0 0.8 6.5 34.6 2.1 11.0 1.9 3.2 2.6 1.2 13.7 3.6 31.8 53.2 MFIs 3,004.9 1,576.0 90.7 52.9 1,268.2 160.9 3.3 15.6 12.1 72.6 136.3 375.8 367.6 16.5 432.4 Other sectors 1,831.8 664.0 21.1 37.5 566.9 35.5 3.1 11.0 23.4 28.5 137.7 323.6 217.4 0.6 425.5 Liabilities 5,304.0 2,536.1 57.9 95.4 2,071.7 112.6 198.6 35.8 46.7 83.8 309.6 807.8 593.6 74.0 816.5 General government 153.9 92.1 0.2 0.5 57.1 0.2 34.1 0.1 0.1 0.1 0.8 27.3 1.7 27.6 4.1 MFIs 3,777.4 1,855.6 45.5 63.8 1,555.6 84.5 106.1 27.6 22.1 50.4 233.4 491.5 475.5 43.4 577.9 Other sectors 1,372.8 588.4 12.2 31.1 458.9 27.9 58.3 8.2 24.6 33.2 75.4 289.0 116.5 3.0 234.5
2011 Q2 to 2012 Q1 Cumulated transactions
Direct investment 111.2 51.7 -0.7 -9.4 45.8 16.0 0.0 7.1 12.6 0.3 -29.3 -17.0 33.0 0.0 52.9 Abroad 304.6 79.9 1.9 -6.3 63.9 20.4 0.0 14.6 16.9 -0.2 11.2 82.7 27.8 0.0 71.8 Equity/reinvested earnings 257.6 58.0 1.6 -6.1 46.1 16.3 0.0 16.2 10.9 -0.6 19.6 58.5 31.8 0.0 63.2 Other capital 47.0 21.8 0.3 -0.2 17.7 4.0 0.0 -1.6 6.0 0.3 -8.4 24.2 -4.0 0.0 8.6 In the euro area 193.4 28.1 2.6 3.1 18.0 4.4 0.0 7.5 4.3 -0.5 40.6 99.6 -5.2 0.0 19.0 Equity/reinvested earnings 216.1 41.2 0.8 8.4 27.2 4.8 0.0 12.7 1.1 -0.8 10.4 101.4 19.6 0.0 30.5 Other capital -22.7 -13.1 1.8 -5.3 -9.1 -0.4 0.0 -5.2 3.2 0.3 30.2 -1.8 -24.8 0.0 -11.5 Portfolio investment assets 66.1 55.2 1.7 25.1 -4.5 4.0 29.1 -4.9 5.5 -1.4 0.4 -4.2 -22.8 0.7 37.7 Equity -43.5 -9.5 0.1 0.4 -9.6 -0.9 0.5 2.3 4.4 -0.1 -4.2 -34.4 -3.3 0.1 1.2 Debt instruments 109.6 64.7 1.6 24.7 5.1 4.8 28.6 -7.2 1.1 -1.3 4.6 30.2 -19.5 0.6 36.5 Bonds and notes 48.1 42.8 3.9 17.5 -9.4 5.6 25.2 -6.2 0.4 -7.6 1.1 2.7 -20.9 -0.3 36.1 Money market instruments 61.6 21.9 -2.3 7.2 14.4 -0.8 3.4 -0.9 0.7 6.3 3.5 27.5 1.4 0.8 0.3 Other investment -33.2 -109.2 -12.3 -29.6 -14.0 -19.2 -34.1 3.6 -26.7 11.7 -30.2 90.1 118.5 -34.0 -57.0 Assets 144.1 -4.7 -13.2 -6.7 31.1 -18.0 2.1 3.1 12.2 16.4 -7.5 21.9 89.2 -6.2 19.7 General government -0.3 8.6 -0.5 -1.8 10.4 0.3 0.2 0.0 0.0 -0.6 0.0 -5.1 -0.8 0.2 -2.6 MFIs 15.1 -74.6 -12.7 -6.4 -36.6 -20.5 1.6 1.2 10.6 16.0 -11.8 11.6 75.6 -6.5 -7.2 Other sectors 129.4 61.3 0.0 1.5 57.2 2.3 0.3 1.9 1.6 0.9 4.3 15.4 14.4 0.1 29.5 Liabilities 177.3 104.5 -0.9 22.9 45.0 1.3 36.2 -0.5 39.0 4.7 22.7 -68.2 -29.3 27.8 76.7 General government 53.7 25.9 0.1 -0.1 -2.4 0.0 28.3 0.0 0.0 0.0 0.1 -7.4 -0.2 32.6 2.7 MFIs 17.7 19.3 2.0 23.1 -10.9 2.9 2.2 -2.7 35.7 4.9 22.2 -85.2 -35.9 -5.0 64.4 Other sectors 105.9 59.3 -3.0 -0.1 58.4 -1.7 5.7 2.2 3.3 -0.2 0.4 24.4 6.8 0.2 9.6
Source: ECB.
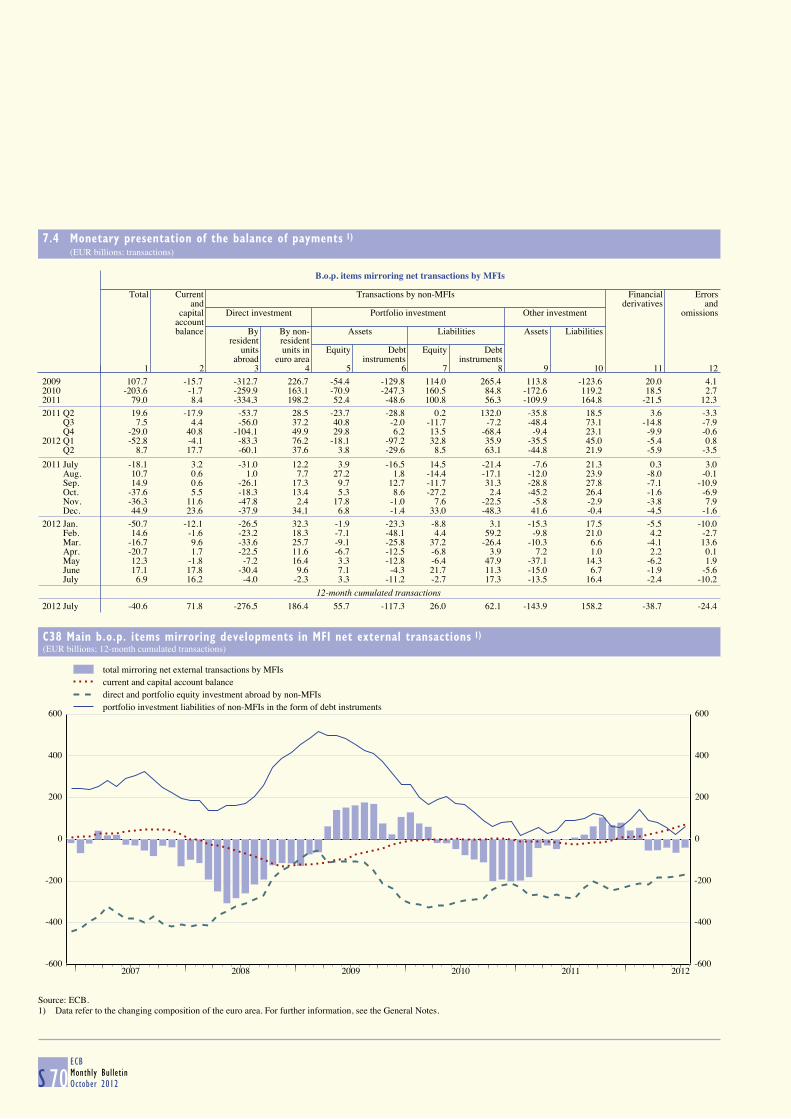
7.4 Monetary presentation of the balance of payments 1) (EUR billions; transactions)
S 70ECBMonthly BulletinOctober 2012
B.o.p. items mirroring net transactions by MFIs
Total Current Transactions by non-MFIs Financial Errors
and derivatives andcapital Direct investment Portfolio investment Other investment omissions
account balance By By non- Assets Liabilities Assets Liabilities
resident residentunits units in Equity Debt Equity Debt
abroad euro area instruments instruments1 2 3 4 5 6 7 8 9 10 11 12
2009 107.7 -15.7 -312.7 226.7 -54.4 -129.8 114.0 265.4 113.8 -123.6 20.0 4.12010 -203.6 -1.7 -259.9 163.1 -70.9 -247.3 160.5 84.8 -172.6 119.2 18.5 2.72011 79.0 8.4 -334.3 198.2 52.4 -48.6 100.8 56.3 -109.9 164.8 -21.5 12.3
2011 Q2 19.6 -17.9 -53.7 28.5 -23.7 -28.8 0.2 132.0 -35.8 18.5 3.6 -3.3 Q3 7.5 4.4 -56.0 37.2 40.8 -2.0 -11.7 -7.2 -48.4 73.1 -14.8 -7.9 Q4 -29.0 40.8 -104.1 49.9 29.8 6.2 13.5 -68.4 -9.4 23.1 -9.9 -0.62012 Q1 -52.8 -4.1 -83.3 76.2 -18.1 -97.2 32.8 35.9 -35.5 45.0 -5.4 0.8 Q2 8.7 17.7 -60.1 37.6 3.8 -29.6 8.5 63.1 -44.8 21.9 -5.9 -3.5
2011 July -18.1 3.2 -31.0 12.2 3.9 -16.5 14.5 -21.4 -7.6 21.3 0.3 3.0 Aug. 10.7 0.6 1.0 7.7 27.2 1.8 -14.4 -17.1 -12.0 23.9 -8.0 -0.1 Sep. 14.9 0.6 -26.1 17.3 9.7 12.7 -11.7 31.3 -28.8 27.8 -7.1 -10.9 Oct. -37.6 5.5 -18.3 13.4 5.3 8.6 -27.2 2.4 -45.2 26.4 -1.6 -6.9 Nov. -36.3 11.6 -47.8 2.4 17.8 -1.0 7.6 -22.5 -5.8 -2.9 -3.8 7.9 Dec. 44.9 23.6 -37.9 34.1 6.8 -1.4 33.0 -48.3 41.6 -0.4 -4.5 -1.6
2012 Jan. -50.7 -12.1 -26.5 32.3 -1.9 -23.3 -8.8 3.1 -15.3 17.5 -5.5 -10.0 Feb. 14.6 -1.6 -23.2 18.3 -7.1 -48.1 4.4 59.2 -9.8 21.0 4.2 -2.7 Mar. -16.7 9.6 -33.6 25.7 -9.1 -25.8 37.2 -26.4 -10.3 6.6 -4.1 13.6 Apr. -20.7 1.7 -22.5 11.6 -6.7 -12.5 -6.8 3.9 7.2 1.0 2.2 0.1 May 12.3 -1.8 -7.2 16.4 3.3 -12.8 -6.4 47.9 -37.1 14.3 -6.2 1.9 June 17.1 17.8 -30.4 9.6 7.1 -4.3 21.7 11.3 -15.0 6.7 -1.9 -5.6 July 6.9 16.2 -4.0 -2.3 3.3 -11.2 -2.7 17.3 -13.5 16.4 -2.4 -10.2
12-month cumulated transactions
2012 July -40.6 71.8 -276.5 186.4 55.7 -117.3 26.0 62.1 -143.9 158.2 -38.7 -24.4
C38 Main b.o.p. items mirroring developments in MFI net external transactions 1)
(EUR billions; 12-month cumulated transactions)
-600
-400
-200
0
200
400
600
2007 2008 2009 2010 2011 2012-600
-400
-200
0
200
400
600
total mirroring net external transactions by MFIscurrent and capital account balancedirect and portfolio equity investment abroad by non-MFIsportfolio investment liabilities of non-MFIs in the form of debt instruments
Source: ECB.1) Data refer to the changing composition of the euro area. For further information, see the General Notes.
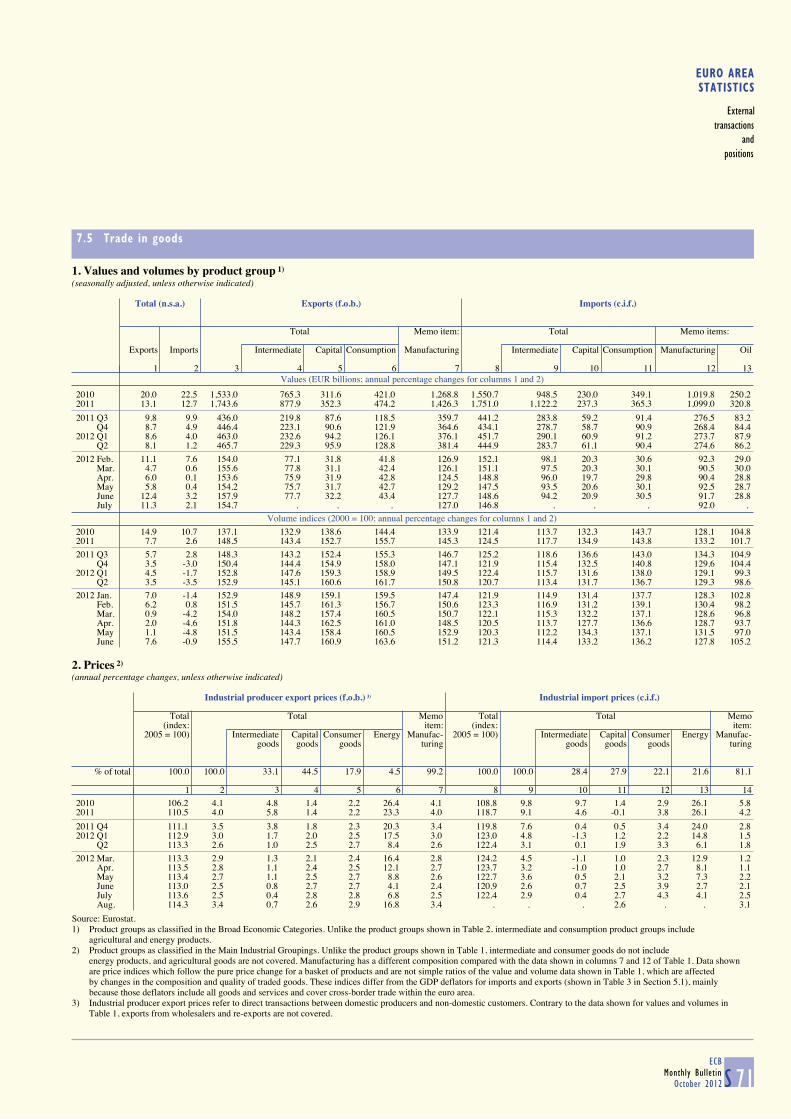
EURO AREASTATISTICS
Externaltransactions
andpositions
7.5 Trade in goods
S 71ECB
Monthly BulletinOctober 2012
1. Values and volumes by product group 1) (seasonally adjusted, unless otherwise indicated)
Values (EUR billions; annual percentage changes for columns 1 and 2)
Total (n.s.a.) Exports (f.o.b.) Imports (c.i.f.)
Total Memo item: Total Memo items:
Exports Imports Intermediate Capital Consumption Manufacturing Intermediate Capital Consumption Manufacturing Oil
1 2 3 4 5 6 7 8 9 10 11 12 13
2010 20.0 22.5 1,533.0 765.3 311.6 421.0 1,268.8 1,550.7 948.5 230.0 349.1 1,019.8 250.22011 13.1 12.7 1,743.6 877.9 352.3 474.2 1,426.3 1,751.0 1,122.2 237.3 365.3 1,099.0 320.8
2011 Q3 9.8 9.9 436.0 219.8 87.6 118.5 359.7 441.2 283.8 59.2 91.4 276.5 83.2 Q4 8.7 4.9 446.4 223.1 90.6 121.9 364.6 434.1 278.7 58.7 90.9 268.4 84.42012 Q1 8.6 4.0 463.0 232.6 94.2 126.1 376.1 451.7 290.1 60.9 91.2 273.7 87.9 Q2 8.1 1.2 465.7 229.3 95.9 128.8 381.4 444.9 283.7 61.1 90.4 274.6 86.2
2012 Feb. 11.1 7.6 154.0 77.1 31.8 41.8 126.9 152.1 98.1 20.3 30.6 92.3 29.0 Mar. 4.7 0.6 155.6 77.8 31.1 42.4 126.1 151.1 97.5 20.3 30.1 90.5 30.0 Apr. 6.0 0.1 153.6 75.9 31.9 42.8 124.5 148.8 96.0 19.7 29.8 90.4 28.8 May 5.8 0.4 154.2 75.7 31.7 42.7 129.2 147.5 93.5 20.6 30.1 92.5 28.7 June 12.4 3.2 157.9 77.7 32.2 43.4 127.7 148.6 94.2 20.9 30.5 91.7 28.8 July 11.3 2.1 154.7 . . . 127.0 146.8 . . . 92.0 .
Volume indices (2000 = 100; annual percentage changes for columns 1 and 2)
2010 14.9 10.7 137.1 132.9 138.6 144.4 133.9 121.4 113.7 132.3 143.7 128.1 104.82011 7.7 2.6 148.5 143.4 152.7 155.7 145.3 124.5 117.7 134.9 143.8 133.2 101.7
2011 Q3 5.7 2.8 148.3 143.2 152.4 155.3 146.7 125.2 118.6 136.6 143.0 134.3 104.9 Q4 3.5 -3.0 150.4 144.4 154.9 158.0 147.1 121.9 115.4 132.5 140.8 129.6 104.42012 Q1 4.5 -1.7 152.8 147.6 159.3 158.9 149.5 122.4 115.7 131.6 138.0 129.1 99.3 Q2 3.5 -3.5 152.9 145.1 160.6 161.7 150.8 120.7 113.4 131.7 136.7 129.3 98.6
2012 Jan. 7.0 -1.4 152.9 148.9 159.1 159.5 147.4 121.9 114.9 131.4 137.7 128.3 102.8 Feb. 6.2 0.8 151.5 145.7 161.3 156.7 150.6 123.3 116.9 131.2 139.1 130.4 98.2 Mar. 0.9 -4.2 154.0 148.2 157.4 160.5 150.7 122.1 115.3 132.2 137.1 128.6 96.8 Apr. 2.0 -4.6 151.8 144.3 162.5 161.0 148.5 120.5 113.7 127.7 136.6 128.7 93.7 May 1.1 -4.8 151.5 143.4 158.4 160.5 152.9 120.3 112.2 134.3 137.1 131.5 97.0 June 7.6 -0.9 155.5 147.7 160.9 163.6 151.2 121.3 114.4 133.2 136.2 127.8 105.2
2. Prices 2) (annual percentage changes, unless otherwise indicated)
Industrial producer export prices (f.o.b.) 3) Industrial import prices (c.i.f.)
Total Total Memo Total Total Memo
(index: item: (index: item:2005 = 100) Intermediate Capital Consumer Energy Manufac- 2005 = 100) Intermediate Capital Consumer Energy Manufac-
goods goods goods turing goods goods goods turing
% of total 100.0 100.0 33.1 44.5 17.9 4.5 99.2 100.0 100.0 28.4 27.9 22.1 21.6 81.1
1 2 3 4 5 6 7 8 9 10 11 12 13 14
2010 106.2 4.1 4.8 1.4 2.2 26.4 4.1 108.8 9.8 9.7 1.4 2.9 26.1 5.82011 110.5 4.0 5.8 1.4 2.2 23.3 4.0 118.7 9.1 4.6 -0.1 3.8 26.1 4.2
2011 Q4 111.1 3.5 3.8 1.8 2.3 20.3 3.4 119.8 7.6 0.4 0.5 3.4 24.0 2.82012 Q1 112.9 3.0 1.7 2.0 2.5 17.5 3.0 123.0 4.8 -1.3 1.2 2.2 14.8 1.5 Q2 113.3 2.6 1.0 2.5 2.7 8.4 2.6 122.4 3.1 0.1 1.9 3.3 6.1 1.8
2012 Mar. 113.3 2.9 1.3 2.1 2.4 16.4 2.8 124.2 4.5 -1.1 1.0 2.3 12.9 1.2 Apr. 113.5 2.8 1.1 2.4 2.5 12.1 2.7 123.7 3.2 -1.0 1.0 2.7 8.1 1.1 May 113.4 2.7 1.1 2.5 2.7 8.8 2.6 122.7 3.6 0.5 2.1 3.2 7.3 2.2 June 113.0 2.5 0.8 2.7 2.7 4.1 2.4 120.9 2.6 0.7 2.5 3.9 2.7 2.1 July 113.6 2.5 0.4 2.8 2.8 6.8 2.5 122.4 2.9 0.4 2.7 4.3 4.1 2.5 Aug. 114.3 3.4 0.7 2.6 2.9 16.8 3.4 . . . 2.6 . . 3.1
Source: Eurostat.1) Product groups as classified in the Broad Economic Categories. Unlike the product groups shown in Table 2, intermediate and consumption product groups include
agricultural and energy products.2) Product groups as classified in the Main Industrial Groupings. Unlike the product groups shown in Table 1, intermediate and consumer goods do not include
energy products, and agricultural goods are not covered. Manufacturing has a different composition compared with the data shown in columns 7 and 12 of Table 1. Data shownare price indices which follow the pure price change for a basket of products and are not simple ratios of the value and volume data shown in Table 1, which are affectedby changes in the composition and quality of traded goods. These indices differ from the GDP deflators for imports and exports (shown in Table 3 in Section 5.1), mainlybecause those deflators include all goods and services and cover cross-border trade within the euro area.
3) Industrial producer export prices refer to direct transactions between domestic producers and non-domestic customers. Contrary to the data shown for values and volumes in Table 1, exports from wholesalers and re-exports are not covered.

7.5 Trade in goods (EUR billions, unless otherwise indicated; seasonally adjusted)
S 72ECBMonthly BulletinOctober 2012
3. Geographical breakdown
Exports (f.o.b.)
Total EU Member States outside the euro area Russia Switzer- Turkey United Asia Africa Latin Other
land States America countriesDenmark Sweden United Other EU China Japan
Kingdom countries
1 2 3 4 5 6 7 8 9 10 11 12 13 14 15
2010 1,533.0 30.2 52.6 194.8 208.3 63.0 92.8 47.5 180.6 356.5 94.8 34.6 104.0 73.4 129.32011 1,743.6 32.9 60.5 213.5 241.0 79.8 108.9 56.7 200.4 406.3 115.4 39.4 111.9 84.6 147.2
2011 Q1 429.7 8.1 14.9 53.0 59.0 18.6 25.8 15.2 50.2 99.8 28.6 9.3 28.0 20.0 37.2 Q2 431.5 8.2 15.5 52.4 60.6 19.7 26.1 14.3 48.9 98.5 27.5 9.5 27.2 20.7 39.4 Q3 436.0 8.3 15.7 53.8 61.2 20.6 28.8 13.6 49.3 101.8 28.8 10.1 28.1 21.6 33.2 Q4 446.4 8.3 14.4 54.3 60.2 20.8 28.2 13.6 52.0 106.2 30.5 10.5 28.7 22.3 37.5
2012 Q1 463.0 8.4 15.0 56.6 61.2 22.1 29.4 14.6 55.7 109.5 31.3 10.6 30.9 23.7 35.7 Q2 465.7 8.5 14.9 57.1 60.9 22.8 29.1 14.5 55.8 109.0 30.4 11.3 31.2 24.3 37.7
2012 Feb. 154.0 2.8 5.1 19.3 20.8 7.5 9.8 4.8 18.7 37.4 10.8 3.6 10.2 7.8 9.6 Mar. 155.6 2.8 5.0 18.6 20.1 7.5 9.7 5.1 18.7 36.3 10.1 3.5 11.0 8.2 12.9 Apr. 153.6 2.8 4.9 18.9 19.8 7.5 9.6 4.8 17.4 35.1 9.8 3.6 10.5 7.9 14.5 May 154.2 2.8 5.0 19.5 20.9 7.6 10.0 4.9 19.5 36.4 10.1 3.8 10.5 8.4 8.7 June 157.9 2.9 5.0 18.7 20.3 7.8 9.5 4.8 18.8 37.4 10.5 4.0 10.2 8.0 14.5 July 154.7 . . . . 7.7 9.5 4.7 19.1 35.9 9.9 3.9 10.3 7.9 .
Percentage share of total exports
2011 100.0 1.9 3.5 12.2 13.8 4.6 6.2 3.3 11.5 23.3 6.6 2.3 6.4 4.8 8.4
Imports (c.i.f.)
2010 1,550.7 27.4 47.3 147.8 195.4 112.2 72.8 30.7 129.8 494.9 208.6 51.4 118.8 75.3 98.22011 1,751.0 29.8 53.3 166.6 226.4 138.7 80.2 34.8 139.4 549.3 217.2 52.5 128.4 90.7 113.3
2011 Q1 436.7 7.3 13.3 40.8 55.4 35.8 19.1 9.0 35.4 136.1 55.1 13.8 34.9 21.7 27.9 Q2 439.0 7.5 13.4 41.2 56.5 34.3 19.4 8.8 34.2 139.5 55.6 12.7 30.7 22.1 31.3 Q3 441.2 7.4 13.9 42.6 57.2 33.2 22.0 8.5 34.4 139.7 54.7 13.3 31.3 23.4 27.5 Q4 434.1 7.6 12.7 42.1 57.3 35.4 19.8 8.5 35.4 133.9 51.8 12.8 31.5 23.5 26.6
2012 Q1 451.7 7.2 13.0 42.6 57.5 37.7 20.0 8.4 37.6 135.8 53.2 12.5 38.8 23.7 29.4 Q2 444.9 7.3 12.9 41.4 57.1 34.3 19.7 8.3 37.4 136.2 55.9 12.4 37.8 22.7 29.7
2012 Feb. 152.1 2.5 4.4 14.7 19.4 12.8 6.8 2.9 12.5 46.5 18.5 4.3 13.4 8.2 8.0 Mar. 151.1 2.3 4.3 14.1 19.2 13.1 6.4 2.8 12.7 44.5 17.0 4.1 13.2 7.7 10.7 Apr. 148.8 2.4 4.3 13.8 18.8 12.1 6.1 2.8 12.2 44.4 18.2 3.9 12.9 7.6 11.5 May 147.5 2.5 4.5 14.3 19.1 11.8 6.8 2.8 12.6 45.2 19.1 4.4 13.1 7.9 7.0 June 148.6 2.5 4.1 13.3 19.1 10.5 6.8 2.7 12.6 46.7 18.6 4.0 11.9 7.3 11.2 July 146.8 . . . . 10.0 7.1 2.8 12.9 43.7 18.7 4.1 12.4 7.7 .
Percentage share of total imports
2011 100.0 1.7 3.0 9.5 12.9 7.9 4.6 2.0 8.0 31.4 12.4 3.0 7.3 5.2 6.5
Balance
2010 -17.7 2.7 5.3 46.9 12.9 -49.1 20.0 16.8 50.7 -138.4 -113.8 -16.8 -14.8 -1.8 31.12011 -7.4 3.1 7.1 46.9 14.6 -59.0 28.7 21.9 61.0 -143.0 -101.9 -13.1 -16.4 -6.1 33.9
2011 Q1 -7.0 0.7 1.7 12.2 3.7 -17.2 6.7 6.2 14.8 -36.4 -26.5 -4.4 -6.9 -1.8 9.3 Q2 -7.5 0.7 2.0 11.2 4.1 -14.6 6.7 5.5 14.7 -41.1 -28.1 -3.1 -3.5 -1.4 8.2 Q3 -5.2 1.0 1.8 11.2 4.0 -12.6 6.8 5.1 14.9 -37.9 -25.9 -3.2 -3.2 -1.8 5.6 Q4 12.3 0.7 1.7 12.2 2.9 -14.5 8.4 5.1 16.6 -27.7 -21.4 -2.3 -2.8 -1.1 10.9
2012 Q1 11.3 1.2 2.0 14.0 3.7 -15.6 9.4 6.2 18.2 -26.2 -21.9 -1.9 -7.9 0.1 6.3 Q2 20.9 1.2 2.0 15.8 3.8 -11.5 9.4 6.2 18.4 -27.2 -25.5 -1.0 -6.6 1.6 8.0
2012 Feb. 1.9 0.3 0.7 4.6 1.4 -5.2 3.0 2.0 6.2 -9.1 -7.7 -0.7 -3.2 -0.3 1.6 Mar. 4.6 0.5 0.6 4.5 0.9 -5.7 3.3 2.3 5.9 -8.2 -6.9 -0.6 -2.3 0.4 2.3 Apr. 4.9 0.4 0.6 5.2 1.0 -4.6 3.4 2.0 5.2 -9.3 -8.4 -0.3 -2.4 0.3 3.0 May 6.7 0.4 0.4 5.2 1.7 -4.2 3.2 2.1 6.9 -8.7 -9.1 -0.6 -2.6 0.5 1.8 June 9.3 0.4 0.9 5.4 1.1 -2.7 2.7 2.1 6.3 -9.2 -8.1 -0.1 -1.7 0.8 3.2 July 7.9 . . . . -2.3 2.4 1.9 6.1 -7.8 -8.7 -0.1 -2.1 0.1 .
Source: Eurostat.

8EXCHANGE RATES
8.1 Effective exchange rates 1) (period averages; index: 1999 Q1=100)
S 73ECB
Monthly BulletinOctober 2012
EER-20 EER-40
Nominal Real Real Real Real Real Nominal RealCPI PPI GDP ULCM ULCT CPI
deflator
1 2 3 4 5 6 7 8
2009 110.6 109.2 104.3 105.0 118.5 105.0 119.7 106.82010 103.6 101.6 98.1 96.9 107.4 97.3 111.4 98.12011 103.4 100.7 97.6 95.1 106.7 95.9 112.1 97.6
2011 Q3 103.5 100.6 97.6 95.1 107.3 95.8 112.5 97.7 Q4 102.1 99.4 96.4 93.3 106.0 94.7 111.6 97.02012 Q1 99.5 96.9 94.4 90.5 103.4 91.7 108.3 94.0 Q2 98.2 95.9 93.4 89.0 102.3 90.5 107.4 93.2 Q3 95.9 93.7 91.7 . . . 105.1 91.2
2011 Sep. 102.8 100.0 96.8 - - - 112.0 97.5 Oct. 103.0 100.3 97.1 - - - 112.6 97.9 Nov. 102.6 99.9 96.8 - - - 112.1 97.4 Dec. 100.8 98.1 95.2 - - - 110.3 95.8
2012 Jan. 98.9 96.3 93.7 - - - 108.0 93.7 Feb. 99.6 97.2 94.7 - - - 108.4 94.1 Mar. 99.8 97.3 94.9 - - - 108.6 94.3 Apr. 99.5 97.2 94.5 - - - 108.4 94.2 May 98.0 95.7 93.2 - - - 107.2 93.1 June 97.2 94.9 92.4 - - - 106.6 92.4 July 95.3 93.2 91.2 - - - 104.4 90.6 Aug. 95.2 93.0 91.0 - - - 104.3 90.5 Sep. 97.2 95.0 93.0 - - - 106.6 92.4
Percentage change versus previous month
2012 Sep. 2.1 2.1 2.2 - - - 2.2 2.1Percentage change versus previous year
2012 Sep. -5.4 -5.0 -3.9 - - - -4.8 -5.2
C39 Effective exchange rates
(monthly averages; index: 1999 Q1=100)
C40 Bilateral exchange rates
(monthly averages; index: 1999 Q1=100)
70
80
90
100
110
120
130
140
150
2000 2002 2004 2006 2008 2010 201270
80
90
100
110
120
130
140
150
nominal EER-20real CPI-deflated EER-20
70
80
90
100
110
120
130
140
150
2000 2002 2004 2006 2008 2010 201270
80
90
100
110
120
130
140
150
USD/EURJPY/EURGBP/EUR
Source: ECB.1) For a definition of the trading partner groups and other information, please refer to the General Notes.
8

8.2 Bilateral exchange rates (period averages; units of national currency per euro)
S 74ECBMonthly BulletinOctober 2012
Bulgarian Czech Danish Latvian Lithuanian Hungarian Polish New Roma- Swedish Pound Croatian New Turkishlev koruna krone lats litas forint zloty nian leu krona sterling kuna lira
1 2 3 4 5 6 7 8 9 10 11 12
2009 1.9558 26.435 7.4462 0.7057 3.4528 280.33 4.3276 4.2399 10.6191 0.89094 7.3400 2.16312010 1.9558 25.284 7.4473 0.7087 3.4528 275.48 3.9947 4.2122 9.5373 0.85784 7.2891 1.99652011 1.9558 24.590 7.4506 0.7063 3.4528 279.37 4.1206 4.2391 9.0298 0.86788 7.4390 2.3378
2012 Q1 1.9558 25.084 7.4350 0.6985 3.4528 296.85 4.2329 4.3533 8.8529 0.83448 7.5568 2.3556 Q2 1.9558 25.269 7.4349 0.6981 3.4528 293.98 4.2595 4.4293 8.9133 0.80998 7.5280 2.3157 Q3 1.9558 25.082 7.4457 0.6963 3.4528 283.05 4.1366 4.5255 8.4354 0.79153 7.4732 2.2560
2012 Mar. 1.9558 24.676 7.4354 0.6977 3.4528 292.26 4.1370 4.3668 8.8873 0.83448 7.5358 2.3631 Apr. 1.9558 24.809 7.4393 0.6993 3.4528 294.81 4.1782 4.3789 8.8650 0.82188 7.4991 2.3520 May 1.9558 25.313 7.4335 0.6981 3.4528 293.67 4.2937 4.4412 8.9924 0.80371 7.5383 2.3149 June 1.9558 25.640 7.4325 0.6969 3.4528 293.57 4.2973 4.4626 8.8743 0.80579 7.5434 2.2837 July 1.9558 25.447 7.4384 0.6963 3.4528 286.28 4.1837 4.5549 8.5451 0.78827 7.5006 2.2281 Aug. 1.9558 25.021 7.4454 0.6963 3.4528 278.93 4.0934 4.5176 8.2805 0.78884 7.4853 2.2291 Sep. 1.9558 24.752 7.4539 0.6962 3.4528 284.22 4.1345 4.5022 8.4929 0.79821 7.4291 2.3177
Percentage change versus previous month
2012 Sep. 0.0 -1.1 0.1 0.0 0.0 1.9 1.0 -0.3 2.6 1.2 -0.8 4.0
Percentage change versus previous year
2012 Sep. 0.0 0.8 0.1 -1.8 0.0 -0.3 -4.7 5.1 -7.0 -8.4 -0.9 -6.3
Australian Brazilian Canadian Chinese Hong Kong Indian Indonesian Israeli Japanese Malaysiandollar real dollar yuan renminbi dollar rupee 1) rupiah shekel yen ringgit
13 14 15 16 17 18 19 20 21 22
2009 1.7727 2.7674 1.5850 9.5277 10.8114 67.3611 14,443.74 5.4668 130.34 4.90792010 1.4423 2.3314 1.3651 8.9712 10.2994 60.5878 12,041.70 4.9457 116.24 4.26682011 1.3484 2.3265 1.3761 8.9960 10.8362 64.8859 12,206.51 4.9775 110.96 4.2558
2012 Q1 1.2425 2.3169 1.3128 8.2692 10.1725 65.8991 11,901.67 4.9431 103.99 4.0121 Q2 1.2699 2.5167 1.2949 8.1072 9.9460 69.3757 11,932.86 4.9021 102.59 3.9918 Q3 1.2035 2.5359 1.2447 7.9410 9.6962 68.9706 11,876.24 4.9818 98.30 3.9029
2012 Mar. 1.2538 2.3674 1.3121 8.3326 10.2474 66.5399 12,082.50 4.9679 108.88 4.0229 Apr. 1.2718 2.4405 1.3068 8.2921 10.2163 68.1939 12,068.69 4.9362 107.00 4.0277 May 1.2825 2.5357 1.2916 8.0806 9.9291 69.6407 11,913.51 4.8974 101.97 3.9688 June 1.2550 2.5658 1.2874 7.9676 9.7192 70.1673 11,830.22 4.8763 99.26 3.9836 July 1.1931 2.4914 1.2461 7.8288 9.5308 68.1061 11,605.16 4.9042 97.07 3.8914 Aug. 1.1841 2.5170 1.2315 7.8864 9.6177 68.8632 11,777.55 4.9779 97.58 3.8643 Sep. 1.2372 2.6066 1.2583 8.1273 9.9686 70.0452 12,287.93 5.0717 100.49 3.9599
Percentage change versus previous month
2012 Sep. 4.5 3.6 2.2 3.1 3.6 1.7 4.3 1.9 3.0 2.5
Percentage change versus previous year
2012 Sep. -8.1 8.8 -8.8 -7.6 -7.1 6.8 1.4 -0.1 -5.0 -6.7
Mexican New Zealand Norwegian Philippine Russian Singapore South African South Korean Swiss Thai USpeso dollar krone peso rouble dollar rand won franc baht dollar
23 24 25 26 27 28 29 30 31 32 33
2009 18.7989 2.2121 8.7278 66.338 44.1376 2.0241 11.6737 1,772.90 1.5100 47.804 1.39482010 16.7373 1.8377 8.0043 59.739 40.2629 1.8055 9.6984 1,531.82 1.3803 42.014 1.32572011 17.2877 1.7600 7.7934 60.260 40.8846 1.7489 10.0970 1,541.23 1.2326 42.429 1.3920
2012 Q1 17.0195 1.6030 7.5868 56.421 39.5496 1.6573 10.1730 1,482.75 1.2080 40.630 1.3108 Q2 17.3620 1.6241 7.5582 54.813 39.8768 1.6200 10.4214 1,477.96 1.2015 40.101 1.2814 Q3 16.4690 1.5462 7.3910 52.377 39.9755 1.5594 10.3385 1,416.52 1.2035 39.207 1.2502
2012 Mar. 16.8239 1.6104 7.5315 56.634 38.7804 1.6624 10.0475 1,487.83 1.2061 40.557 1.3201 Apr. 17.1900 1.6095 7.5698 56.145 38.8087 1.6459 10.3060 1,495.40 1.2023 40.639 1.3162 May 17.4237 1.6538 7.5655 54.908 39.5585 1.6152 10.4412 1,481.36 1.2012 40.077 1.2789 June 17.4529 1.6062 7.5401 53.510 41.1766 1.6016 10.5050 1,458.61 1.2011 39.640 1.2526 July 16.4263 1.5390 7.4579 51.452 39.9467 1.5494 10.1379 1,404.11 1.2011 38.873 1.2288 Aug. 16.3600 1.5306 7.3239 52.173 39.6334 1.5480 10.2585 1,403.93 1.2011 38.974 1.2400 Sep. 16.6413 1.5721 7.3945 53.629 40.4006 1.5837 10.6512 1,444.65 1.2089 39.842 1.2856
Percentage change versus previous month
2012 Sep. 1.7 2.7 1.0 2.8 1.9 2.3 3.8 2.9 0.6 2.2 3.7
Percentage change versus previous year
2012 Sep. -7.2 -7.2 -4.3 -9.6 -4.5 -8.1 2.5 -6.4 0.7 -4.9 -6.6
Source: ECB.1) For this currency the ECB computes and publishes euro reference exchange rates as from 1 January 2009. Previous data are indicative.

9DEVELOPMENTS OUTSIDE THE EURO AREA
9.1 Economic and financial developments in other EU Member States (annual percentage changes, unless otherwise indicated)
S 75ECB
Monthly BulletinOctober 2012
HICP
Bulgaria Czech Denmark Latvia Lithuania Hungary Poland Romania Sweden UnitedRepublic Kingdom
1 2 3 4 5 6 7 8 9 10
2010 3.0 1.2 2.2 -1.2 1.2 4.7 2.7 6.1 1.9 3.32011 3.4 2.1 2.7 4.2 4.1 3.9 3.9 5.8 1.4 4.5
2012 Q1 1.9 4.0 2.8 3.3 3.6 5.6 4.2 2.7 0.9 3.5 Q2 1.8 3.8 2.2 2.4 2.8 5.5 4.0 2.1 0.9 2.7
2012 June 1.6 3.8 2.2 2.1 2.6 5.6 4.2 2.2 0.9 2.4 July 2.4 3.3 2.1 1.9 2.9 5.7 4.0 3.1 0.7 2.6 Aug. 3.1 3.4 2.6 1.9 3.4 6.0 3.8 4.0 0.9 2.5
General government deficit (-)/surplus (+) as a percentage of GDP
2009 -4.3 -5.8 -2.7 -9.8 -9.4 -4.6 -7.4 -9.0 -0.7 -11.52010 -3.1 -4.8 -2.5 -8.2 -7.2 -4.2 -7.8 -6.8 0.3 -10.22011 -2.1 -3.1 -1.8 -3.5 -5.5 4.3 -5.1 -5.2 0.3 -8.3
General government gross debt as a percentage of GDP
2009 14.6 34.4 40.6 36.7 29.4 79.8 50.9 23.6 42.6 69.62010 16.3 38.1 42.9 44.7 38.0 81.4 54.8 30.5 39.4 79.62011 16.3 41.2 46.5 42.6 38.5 80.6 56.3 33.3 38.4 85.7
Long-term government bond yield as a percentage per annum; period average
2012 Mar. 5.07 3.51 1.89 5.15 5.29 8.73 5.37 6.48 1.95 2.17 Apr. 5.11 3.51 1.71 5.10 5.30 8.77 5.49 6.24 1.82 2.03 May 5.11 3.31 1.37 5.15 5.30 8.33 5.41 6.50 1.51 1.78 June 5.07 3.11 1.26 5.07 4.96 8.30 5.24 6.68 1.45 1.60 July 4.87 2.60 1.10 4.67 4.82 7.56 4.99 6.52 1.33 1.47 Aug. 4.28 2.38 1.15 4.45 4.84 7.36 4.88 6.84 1.44 1.49
3-month interest rate as a percentage per annum; period average
2012 Mar. 2.91 1.23 0.99 1.19 1.31 - 4.95 4.25 2.30 1.04 Apr. 2.71 1.24 0.97 1.00 1.28 8.19 4.94 4.12 2.19 1.02 May 2.59 1.24 0.90 0.94 1.24 8.22 5.05 4.69 2.14 1.00 June 2.45 1.21 0.62 0.90 1.20 - 5.12 5.10 2.14 0.95 July 2.14 1.06 0.41 0.75 1.11 8.00 5.13 5.11 2.10 0.82 Aug. 1.69 1.00 0.31 0.61 0.93 7.77 5.11 5.51 2.02 0.71
Real GDP
2010 0.4 2.7 1.3 -0.9 1.4 1.3 3.9 -1.7 6.6 1.82011 1.7 1.7 0.8 5.5 5.9 1.6 4.3 2.5 3.9 0.8
2011 Q4 0.9 0.6 0.1 5.9 5.2 1.2 4.0 2.2 1.2 0.62012 Q1 0.5 -0.5 0.3 5.5 3.9 -1.2 3.5 1.2 1.4 -0.2 Q2 0.5 -1.0 -0.6 4.6 2.8 -1.1 2.5 1.7 1.3 -0.5
Current and capital account balance as a percentage of GDP
2010 -0.7 -3.0 5.6 4.9 2.8 2.8 -3.3 -4.2 6.5 -3.12011 1.6 -2.5 6.7 -0.2 -1.3 3.2 -2.9 -3.9 6.3 -1.7
2011 Q4 -4.9 -0.6 5.8 -0.4 -3.4 3.0 -1.7 -2.2 4.6 -1.52012 Q1 -6.6 2.6 2.9 -3.0 -9.7 1.5 -3.6 -0.2 7.7 -2.9 Q2 -2.6 -0.7 8.3 -1.1 7.4 4.1 0.1 -4.6 5.9 .
Gross external debt as a percentage of GDP
2010 102.7 56.5 191.3 164.8 83.4 144.1 66.4 75.8 190.9 413.12011 93.1 58.4 183.2 145.0 78.1 146.2 71.9 73.7 193.9 421.3
2011 Q4 93.1 58.4 183.2 145.0 78.1 146.2 71.9 73.7 193.9 421.32012 Q1 93.8 59.4 185.2 144.5 80.8 136.0 70.3 74.9 192.3 417.5 Q2 93.8 60.7 . 144.1 77.5 132.1 71.9 75.1 198.1 .
Unit labour costs
2010 5.6 -0.7 -1.0 -10.4 -7.3 -3.2 1.3 7.9 -2.4 1.22011 1.1 1.0 0.5 3.0 -0.2 3.8 0.5 1.7 -0.8 1.6
2011 Q4 4.8 1.6 1.8 0.7 3.1 2.8 -0.1 0.3 0.3 2.92012 Q1 1.9 4.2 1.0 -0.6 5.2 4.7 1.3 4.6 1.7 4.6 Q2 0.7 3.6 1.6 0.3 4.6 4.3 . 4.1 2.8 6.3
Standardised unemployment rate as a percentage of labour force (s.a.)
2010 10.3 7.3 7.5 19.8 17.8 11.2 9.6 7.3 8.4 7.82011 11.3 6.7 7.6 16.3 15.4 11.0 9.7 7.4 7.5 8.0
2012 Q1 12.0 6.8 7.5 15.4 13.6 11.1 10.0 7.2 7.5 8.2 Q2 12.3 6.8 8.0 15.9 13.3 10.9 10.0 7.2 7.6 7.9
2012 June 12.4 6.8 8.0 15.9 13.2 10.8 10.0 7.3 7.6 8.0 July 12.5 6.8 8.0 . 13.0 10.7 10.0 7.0 7.5 . Aug. 12.5 6.7 8.0 . 12.9 . 10.1 7.1 7.8 .
Sources: ECB, European Commission (Economic and Financial Affairs DG and Eurostat), national data, Thomson Reuters and ECB calculations.
9

9.2 Economic and financial developments in the United States and Japan (annual percentage changes, unless otherwise indicated)
S 76ECBMonthly BulletinOctober 2012
United States
Consumer Unit labour Real GDP Industrial Unemployment Broad 3-month 10-year Exchange Fiscal Grossprice index costs 1) production rate money 3) interbank zero coupon rate 5) deficit (-)/ public
index as a % of deposit government as national surplus (+) debt 6)
(manufacturing) labour force 2) rate 4) bond yield; 4) currency as a % of as a % of(s.a.) end of per euro GDP GDP
period
1 2 3 4 5 6 7 8 9 10 11
2008 3.8 2.8 -0.3 -4.8 5.8 6.8 2.93 2.70 1.4708 -6.6 61.52009 -0.4 -1.4 -3.1 -13.8 9.3 8.0 0.69 4.17 1.3948 -11.6 74.12010 1.6 -1.1 2.4 6.3 9.6 2.5 0.34 3.57 1.3257 -11.4 82.52011 3.2 1.9 1.8 4.8 9.0 7.3 0.34 2.10 1.3920 -10.2 86.5
2011 Q3 3.8 1.9 1.6 3.9 9.1 9.2 0.30 2.18 1.4127 -10.2 85.0 Q4 3.3 1.4 2.0 4.5 8.7 9.7 0.48 2.10 1.3482 -9.9 86.52012 Q1 2.8 0.2 2.4 5.3 8.3 10.2 0.51 2.38 1.3108 -8.7 88.1 Q2 1.9 0.9 2.1 5.5 8.2 9.7 0.47 1.83 1.2814 -8.6 . Q3 . . . . . . 0.43 1.77 1.2502 . .
2012 May 1.7 - - 5.1 8.2 9.7 0.47 1.79 1.2789 - - June 1.7 - - 5.5 8.2 9.3 0.47 1.83 1.2526 - - July 1.4 - - 5.0 8.3 8.1 0.45 1.63 1.2288 - - Aug. 1.7 - - 4.0 8.1 6.3 0.43 1.72 1.2400 - - Sep. . - - . . . 0.39 1.77 1.2856 - -
Japan
2008 1.4 1.3 -1.1 -3.4 4.0 2.1 0.93 1.21 152.45 -1.9 162.92009 -1.3 2.9 -5.5 -21.9 5.1 2.7 0.47 1.42 130.34 -8.8 180.02010 -0.7 -2.8 4.6 16.6 5.1 2.8 0.23 1.18 116.24 -8.4 188.42011 -0.3 . -0.7 -2.5 4.6 2.8 0.19 1.00 110.96 . .
2011 Q3 0.1 0.6 -0.7 -1.0 4.4 2.8 0.19 1.04 109.77 . . Q4 -0.3 . -0.6 -1.7 4.5 3.0 0.20 1.00 104.22 . . 2012 Q1 0.3 . 2.8 4.7 4.6 3.0 0.20 1.05 103.99 . . Q2 0.1 . 3.3 5.3 4.4 2.3 0.20 0.84 102.59 . . Q3 . . . . . . 0.19 0.78 98.30 . .
2012 May 0.2 - - 6.0 4.4 2.1 0.20 0.85 101.97 - - June -0.2 - - -1.5 4.3 2.2 0.20 0.84 99.26 - - July -0.4 - - -0.8 . . 0.20 0.78 97.07 - - Aug. -0.4 - - -4.3 . . 0.19 0.81 97.58 - - Sep. . - - . . . 0.19 0.78 100.49 - -
C41 Real gross domestic product
(annual percentage changes; quarterly data)
C42 Consumer price indices
(annual percentage changes; monthly data)
-10
-8
-6
-4
-2
0
2
4
6
2000 2002 2004 2006 2008 2010-10
-8
-6
-4
-2
0
2
4
6
euro areaUnited StatesJapan
-4
-2
0
2
4
6
2000 2002 2004 2006 2008 2010 2012-4
-2
0
2
4
6
euro areaUnited StatesJapan
Sources: National data (columns 1, 2 (United States), 3, 4, 5 (United States), 6, 9 and 10); OECD (column 2 (Japan)); Eurostat (column 5 (Japan), euro area chart data);Thomson Reuters (columns 7 and 8); ECB calculations (column 11).1) Seasonally adjusted. The data for the United States refer to the private non-agricultural business sector.2) Japanese data from March to August 2011 exclude the three prefectures most affected by the earthquake in that country. These are reinstated as of September 2011.3) Period averages; M2 for the United States, M2+CDs for Japan.4) Percentages per annum. For further information on the three-month interbank deposit rate, see Section 4.6.5) For more information, see Section 8.2.6) Gross consolidated general government debt (end of period).7) Data refer to the changing composition of the euro area. For further information, see the General Notes.
7)

S 77ECB
Monthly Bulletin
October 2012
LIST OF CHARTS
C1 Monetary aggregates S12
C2 Counterparts S12
C3 Components of monetary aggregates S13
C4 Components of longer-term fi nancial liabilities S13
C5 Loans to other fi nancial intermediaries and non-fi nancial corporations S14
C6 Loans to households S14
C7 Loans to government S16
C8 Loans to non-euro area residents S16
C9 Total deposits by sector (fi nancial intermediaries) S17
C10 Total deposits and deposits included in M3 by sector (fi nancial intermediaries) S17
C11 Total deposits by sector (non-fi nancial corporations and households) S18
C12 Total deposits and deposits included in M3 by sector (non-fi nancial corporations and households) S18
C13 Deposits by government and non-euro area residents S19
C14 MFI holdings of securities S20
C15 Total outstanding amounts and gross issues of securities other than shares issued by euro area residents S35
C16 Net issues of securities other than shares: seasonally adjusted and non-seasonally adjusted S37
C17 Annual growth rates of long-term debt securities, by sector of the issuer, in all currencies combined S38
C18 Annual growth rates of short-term debt securities, by sector of the issuer, in all currencies combined S39
C19 Annual growth rates for quoted shares issued by euro area residents S40
C20 Gross issues of quoted shares by sector of the issuer S41
C21 New deposits with an agreed maturity S43
C22 New loans with a fl oating rate and up to 1 year’s initial rate fi xation S43
C23 Euro area money market rates S44
C24 3-month money market rates S44
C25 Euro area spot yield curves S45
C26 Euro area spot rates and spreads S45
C27 Dow Jones EURO STOXX broad index, Standard & Poor’s 500 and Nikkei 225 S46
C28 Employment – persons employed and hours worked S55
C29 Unemployment and job vacancy rates S55
C30 Defi cit, borrowing requirement and change in debt S60
C31 Maastricht debt S60
C32 Euro area b.o.p: current account S61
C33 Euro area b.o.p: direct and portfolio investment S61
C34 Euro area b.o.p: goods S62
C35 Euro area b.o.p: services S62
C36 Euro area international investment position S65
C37 Euro area direct and portfolio investment position S65
C38 Main b.o.p. items mirroring developments in MFI net external transactions S70
C39 Effective exchange rates S73
C40 Bilateral exchange rates S73
C41 Real gross domestic product S76
C42 Consumer price indices S76


ECB
Monthly Bulletin
October 2012 S 79
TECHNICAL NOTES
EURO AREA OVERVIEW
CALCULATION OF GROWTH RATES FOR MONETARY
DEVELOPMENTS
The average growth rate for the quarter ending
in month t is calculated as:
where It is the index of adjusted outstanding
amounts as at month t (see also below).
Likewise, for the year ending in month t, the
average growth rate is calculated as:
SECTION 1.3
CALCULATION OF INTEREST RATES ON INDEXED
LONGER-TERM REFINANCING OPERATIONS
The interest rate on an indexed longer-term
refi nancing operation (LTRO) is equal to the
average of the minimum bid rates on the main
refi nancing operations (MROs) over the life of
that LTRO. According to this defi nition, if an
LTRO is outstanding for D number of days and
the minimum bid rates prevailing in MROs are
R1, MRO
(over D1 days), R
2, MRO (over D
2 days),
etc., until Ri, MRO
(over Di days), where
D1+D
2+…+D
i=D, the applicable annualised
rate (RLTRO
) is calculated as:
SECTIONS 2.1 TO 2.6
CALCULATION OF TRANSACTIONS
Monthly transactions are calculated from
monthly differences in outstanding amounts
adjusted for reclassifi cations, other revaluations,
exchange rate variations and any other changes
which do not arise from transactions.
If Lt represents the outstanding amount at the end
of month t, C t
M the reclassifi cation adjustment
in month t, E t
M the exchange rate adjustment
and V t
M the other revaluation adjustments, the
transactions F t
M in month t are defi ned as:
Similarly, the quarterly transactions F t
Q for the
quarter ending in month t are defi ned as:
where Lt-3
is the amount outstanding at the end
of month t-3 (the end of the previous quarter)
and, for example, C t
Q is the reclassifi cation
adjustment in the quarter ending in month t.
For those quarterly series for which monthly
observations are now available (see below), the
quarterly transactions can be derived as the sum
of the three monthly transactions in the quarter.
CALCULATION OF GROWTH RATES FOR MONTHLY
SERIES
Growth rates can be calculated from transactions
or from the index of adjusted outstanding
amounts. If F t
M and Lt are defi ned as above,
the index It of adjusted outstanding amounts in
month t is defi ned as:
−1
⎞
⎠
⎟⎟⎟⎟
⎞
⎠
⎟⎟⎟⎟
×100
0.5It−12 + ∑ It−i−12 + 0.5It−15
2
i=1
0.5It + ∑ It−i + 0.5It−3
2
i=1a)
⎞
⎠
⎟⎟⎟⎟
⎞
⎠
⎟⎟⎟⎟
−1 ×1000.5It + ∑ It−i + 0.5It−12
11
i=1
0.5It−12 + ∑ It−i−12 + 0.5It−24
11
i=1
b)
Ft = (Lt – Lt–1) – Ct – Et – VtM M M Md)
I t = It−1 ×Ft
Lt−1
M⎛
⎝⎜
⎞
⎠⎟1+f )
RLTRO =D
1R
1,MRO + D2R
2,MRO + + Di Ri,MRO
D. . .c)
Ft = (Lt – Lt–3) – Ct – Et – VtQ Q Q Qe)

ECB
Monthly Bulletin
October 2012S 80
The base of the index (for the non-seasonally
adjusted series) is currently set as December
2008 = 100. Time series for the index of adjusted
outstanding amounts are available on the ECB’s
website (www.ecb.europa.eu) in the “Monetary
and fi nancial statistics” sub-section of the
“Statistics” section.
The annual growth rate at for month t – i.e. the
change in the 12 months ending in month t – can
be calculated using either of the following
two formulae:
Unless otherwise indicated, the annual growth
rates refer to the end of the indicated period.
For example, the annual percentage change for
the year 2002 is calculated in h) by dividing
the index for December 2002 by the index for
December 2001.
Growth rates for intra-annual periods can be
derived by adapting formula h). For example,
the month-on-month growth rate aM
t can be
calculated as:
Finally, the three-month moving average
(centred) for the annual growth rate of M3 is
obtained as (at+1
+ at + a
t-1)/3, where a
t is defi ned
as in g) or h) above.
CALCULATION OF GROWTH RATES FOR
QUARTERLY SERIES
If F t
Q and Lt-3
are defi ned as above, the index It
of adjusted outstanding amounts for the quarter
ending in month t is defi ned as:
The annual growth rate in the four quarters
ending in month t (i.e. at) can be calculated
using formula h).
SEASONAL ADJUSTMENT OF THE EURO AREA
MONETARY STATISTICS 1
The approach used is based on multiplicative
decomposition using X-12-ARIMA.2 The
seasonal adjustment may include a day-of-the-
week adjustment, and for some series it is carried
out indirectly by means of a linear combination
of components. This is the case for M3, which is
derived by aggregating the seasonally adjusted
series for M1, M2 less M1, and M3 less M2.
The seasonal adjustment procedures are fi rst
applied to the index of adjusted outstanding
amounts.3 The resulting estimates of seasonal
factors are then applied to the levels and to the
adjustments arising from reclassifi cations and
revaluations, in turn yielding seasonally adjusted
transactions. Seasonal (and trading day) factors
are revised at annual intervals or as required.
at =Ft−i
Lt−1−i
M
i=0
⎛
⎝⎜
⎞
⎠⎟
⎡
⎣⎢
⎤
⎦⎥×100∏ 1 + −1
11
g)
at =It
It−12
⎛⎝⎜
⎞⎠⎟× 100−1h)
ItIt−1
at =M −1
⎛
⎝⎜
⎞
⎠⎟ ×100i)
It = It−3 ×⎛
⎝⎜
⎞
⎠⎟Lt−3
FtQ
1+j)
For details, see “Seasonal adjustment of monetary aggregates and 1
HICP for the euro area”, ECB (August 2000) and the “Monetary
and fi nancial statistics” sub-section of the “Statistics” section of
the ECB’s website (www.ecb.europa. eu).
For details, see Findley, D., Monsell, B., Bell, W., Otto, M. 2
and Chen, B. C. (1998), “New Capabilities and Methods of
the X-12-ARIMA Seasonal Adjustment Program”, Journal
of Business and Economic Statistics, 16, 2, pp.127-152, or
“X-12-ARIMA Reference Manual”, Time Series Staff, Bureau
of the Census, Washington, D.C.
For internal purposes, the model-based approach of
TRAMO-SEATS is also used. For details of TRAMO-SEATS,
see Gomez, V. and Maravall, A. (1996), “Programs TRAMO and
SEATS: Instructions for the User”, Banco de España, Working
Paper No 9628, Madrid.
It follows that for the seasonally adjusted series, the level of the 3
index for the base period (i.e. December 2008) generally differs
from 100, refl ecting the seasonality of that month.
ECB
Monthly Bulletin
October 2012 S 81
EURO AREASTATISTICS
Technical Notes
SECTIONS 3.1 TO 3.5
EQUALITY OF USES AND RESOURCES
In Section 3.1 the data conform to a basic
accounting identity. For non-fi nancial
transactions, total uses equal total resources
for each transaction category. This accounting
identity is also refl ected in the fi nancial
account – i.e. for each fi nancial instrument
category, total transactions in fi nancial assets
equal total transactions in liabilities. In the
other changes in assets account and the fi nancial
balance sheets, total fi nancial assets equal total
liabilities for each fi nancial instrument category,
with the exception of monetary gold and special
drawing rights, which are by defi nition not a
liability of any sector.
CALCULATION OF BALANCING ITEMS
The balancing items at the end of each account
in Sections 3.1, 3.2 and 3.3 are computed as
follows.
The trade balance equals euro area imports
minus exports vis-à-vis the rest of the world for
goods and services.
Net operating surplus and mixed income
is defi ned for resident sectors only and is
calculated as gross value added (gross domestic
product at market prices for the euro area) minus
compensation of employees (uses) minus other
taxes less subsidies on production (uses) minus
consumption of fi xed capital (uses).
Net national income is defi ned for resident
sectors only and is computed as net operating
surplus and mixed income plus compensation of
employees (resources) plus taxes less subsidies
on production (resources) plus net property
income (resources minus uses).
Net disposable income is also defi ned only
for resident sectors and equals net national
income plus net current taxes on income and
wealth (resources minus uses) plus net social
contributions (resources minus uses) plus net
social benefi ts other than social transfers in kind
(resources minus uses) plus net other current
transfers (resources minus uses).
Net saving is defi ned for resident sectors and
is calculated as net disposable income plus
the net adjustment for the change in the net
equity of households in pension fund reserves
(resources minus uses) minus fi nal consumption
expenditure (uses). For the rest of the world, the
current external account is compiled as the trade
balance plus all net income (resources minus
uses).
Net lending/net borrowing is computed
from the capital account as net saving plus
net capital transfers (resources minus uses)
minus gross capital formation (uses) minus
acquisitions less disposals of non-produced
non-fi nancial assets (uses) plus consumption
of fi xed capital (resources). It can also be
calculated in the fi nancial account as total
transactions in fi nancial assets minus total
transactions in liabilities (also known as
changes in net fi nancial worth (wealth)
due to transactions). For the household and
non-fi nancial corporation sectors, there is a
statistical discrepancy between the balancing
items computed from the capital account and
the fi nancial account.
Changes in net fi nancial worth (wealth) due to
transactions are computed as total transactions
in fi nancial assets minus total transactions in
liabilities, whereas other changes in net fi nancial
worth (wealth) are calculated as (total) other
changes in fi nancial assets minus (total) other
changes in liabilities.
Net fi nancial worth (wealth) is calculated as
total fi nancial assets minus total liabilities,
whereas changes in net fi nancial worth (wealth)
are equal to the sum of changes in net fi nancial
worth (wealth) due to transactions (lending/net
borrowing from the fi nancial account) and other
changes in net fi nancial worth (wealth).

ECB
Monthly Bulletin
October 2012S 82
Changes in net worth (wealth) are calculated
as changes in net worth (wealth) due to savings
and capital transfers plus other changes in net
fi nancial worth (wealth) and other changes in
non-fi nancial assets.
The net worth (wealth) of households is
calculated as the sum of the non-fi nancial assets
and net fi nancial worth (wealth) of households.
SECTIONS 4.3 AND 4.4
CALCULATION OF GROWTH RATES FOR DEBT
SECURITIES AND QUOTED SHARES
Growth rates are calculated on the basis of
fi nancial transactions and therefore exclude
reclassifi cations, revaluations, exchange rate
variations and any other changes which do not
arise from transactions. They can be calculated
from transactions or from the index of notional
stocks. If Nt
M represents the transactions
(net issues) in month t and Lt the level outstanding
at the end of month t, the index It of notional
stocks in month t is defi ned as:
As a base, the index is set equal to 100 in
December 2008. The growth rate at for month t,
corresponding to the change in the 12 months
ending in month t, can be calculated using either
of the following two formulae:
The method used to calculate the growth rates
for securities other than shares is the same as
that used for the monetary aggregates, the only
difference being that an “N” is used instead of
an “F”. This is to show that the method used to
obtain “net issues” for securities issues statistics
differs from that used to calculate equivalent
“transactions” for the monetary aggregates.
The average growth rate for the quarter ending
in month t is calculated as:
where It is the index of notional stocks as at
month t. Likewise, for the year ending in month t,
the average growth rate is calculated as:
The calculation formula used for Section 4.3 is
also used for Section 4.4 and is likewise based on
that used for the monetary aggregates. Section 4.4
is based on market values, and the calculations
are based on fi nancial transactions, which
exclude reclassifi cations, revaluations and any
other changes that do not arise from transactions.
Exchange rate variations are not included, as all
quoted shares covered are denominated in euro.
SEASONAL ADJUSTMENT OF SECURITIES ISSUES
STATISTICS 4
The approach used is based on multiplicative
decomposition using X-12-ARIMA. The seasonal
adjustment of total securities issues is carried out
indirectly by means of a linear combination of
sector and maturity component breakdowns.
The seasonal adjustment procedures are applied
to the index of notional stocks. The resulting
estimates of seasonal factors are then applied to
the outstanding amounts, from which seasonally
I t = It−1 ×Nt
Lt−1
⎛
⎝⎜
⎞
⎠⎟1+k)
at =Nt−i
Lt−1−i
M
i=0
⎛
⎝⎜
⎞
⎠⎟
⎡
⎣⎢
⎤
⎦⎥×100∏ 1 + −1
11
l)
at =It
It−12
⎛⎝⎜
⎞⎠⎟×100−1m)
−1
⎞
⎠
⎟⎟⎟⎟
⎞
⎠
⎟⎟⎟⎟
×1002
0.5It−12 + ∑ It−i−12 + 0.5It−15i=1
0.5It + ∑ It−i + 0.5It−3
2
i=1n)
⎞
⎠
⎟⎟⎟⎟
⎞
⎠
⎟⎟⎟⎟
−1 ×1000.5It + ∑ It−i + 0.5It−12
11
i=1
0.5It−12 + ∑ It−i−12 + 0.5It−24
11
i=1
o)
For details, see “Seasonal adjustment of monetary aggregates and 4
HICP for the euro area”, ECB (August 2000) and the “Monetary
and fi nancial statistics” sub-section of the “Statistics” section of
the ECB’s website (www.ecb.europa.eu).

ECB
Monthly Bulletin
October 2012 S 83
EURO AREASTATISTICS
Technical Notes
adjusted net issues are derived. Seasonal factors
are revised at annual intervals or as required.
As in formulae l) and m), the growth rate at for
month t, corresponding to the change in the six
months ending in month t, can be calculated
using either of the following two formulae:
TABLE 1 IN SECTION 5.1
SEASONAL ADJUSTMENT OF THE HICP 4
The approach used is based on multiplicative
decomposition using X-12-ARIMA (see
footnote 2 on page S80). The seasonal
adjustment of the overall HICP for the euro
area is carried out indirectly by aggregating
the seasonally adjusted euro area series for
processed food, unprocessed food, industrial
goods excluding energy, and services. Energy
is added without adjustment, since there is no
statistical evidence of seasonality. Seasonal
factors are revised at annual intervals or as
required.
TABLE 2 IN SECTION 7.1
SEASONAL ADJUSTMENT OF THE BALANCE
OF PAYMENTS CURRENT ACCOUNT
The approach used is based on multiplicative
decomposition, using X-12-ARIMA or
TRAMO-SEATS depending on the item.
The raw data for goods, services, income and
current transfers are pre-adjusted in order to take
into account signifi cant working day effects.
The working day adjustment for goods and
services takes account of national public holidays.
The seasonal adjustment of these items is carried
out using these pre-adjusted series. The seasonal
adjustment of the total current account is carried
out by aggregating the seasonally adjusted euro
area series for goods, services, income and current
transfers. Seasonal (and trading day) factors are
revised at biannual intervals or as required.
SECTION 7.3
CALCULATION OF GROWTH RATES FOR THE
QUARTERLY AND ANNUAL SERIES
The annual growth rate for quarter t is calculated
on the basis of quarterly transactions (Ft) and
positions (Lt) as follows:
The growth rate for the annual series is equal to
the growth rate in the last quarter of the year.
at =Nt−i
Lt−1−i
M
i=0
⎛
⎝⎜
⎞
⎠⎟
⎡
⎣⎢
⎤
⎦⎥×100∏ 1 + −1
5
p)
at =ItIt−6
⎛⎝⎜
⎞⎠⎟×100−1q)
at
t
= ×100⎛⎝⎜
⎛⎝⎜
⎞⎠⎟
⎞⎠⎟
i=t–3∏ 1 + Fi
Li–l
— −1r)


ECB
Monthly Bulletin
October 2012 S 85
The “Euro area statistics” section of the
Monthly Bulletin focuses on statistics for the
euro area as a whole. More detailed and longer
runs of data, with further explanatory notes, are
available in the “Statistics” section of the ECB’s
website (www.ecb.europa.eu). This allows user-
friendly access to data via the ECB’s Statistical
Data Warehouse (http://sdw.ecb.europa.eu),
which includes search and download facilities.
Further services available in the “Data services”
sub-section include subscriptions to different
datasets and a repository of compressed Comma
Separated Value (CSV) fi les. For further
information, please contact us at: statistics@
ecb.europa.eu.
In general, the cut-off date for the statistics
included in the Monthly Bulletin is the day
preceding the Governing Council of the ECB’s
fi rst meeting of the month. For this issue,
the cut-off date was 2 October 2012.
Unless otherwise indicated, all data series
including observations for 2011 relate to the
“Euro 17” (i.e. the euro area including Estonia)
for the whole time series. For interest rates,
monetary statistics, the HICP and reserve assets
(and, for consistency reasons, the components
and counterparts of M3 and the components
of the HICP), euro area statistical series take
into account the changing composition of the
euro area.
The composition of the euro area has changed a
number of times over the years. When the euro
was introduced in 1999, the euro area comprised
the following 11 countries (the Euro 11):
Belgium, Germany, Ireland, Spain, France,
Italy, Luxembourg, the Netherlands, Austria,
Portugal and Finland. Greece then joined in
2001, forming the Euro 12. Slovenia joined in
2007, forming the Euro 13; Cyprus and Malta
joined in 2008, forming the Euro 15; and
Slovakia joined in 2009, forming the Euro 16.
Finally, Estonia joined in 2011, bringing the
number of euro area countries to 17.
EURO AREA SERIES WITH A FIXED COMPOSITION
Aggregated statistical series for fi xed
compositions of the euro area relate to a given
fi xed composition for the whole time series,
regardless of the composition at the time to which
the statistics relate. For example, aggregated
series are calculated for the Euro 17 (i.e.
aggregating the data of all 17 countries currently
in the euro area) for all years, despite the fact
that the euro area has only had this composition
since 1 January 2011. Unless otherwise
indicated, the ECB’s Monthly Bulletin provides
statistical series for the current composition.
EURO AREA SERIES WITH A CHANGING
COMPOSITION
Aggregated statistical series with a changing
composition take into account the composition
of the euro area at the time to which the statistics
relate. For example, euro area statistical series
with a changing composition aggregate the data
of the Euro 11 for the period up to the end of
2000, the Euro 12 for the period from 2001 to
the end of 2006, and so on. With this approach,
each individual statistical series covers all of the
various compositions of the euro area.
For the HICP, as well as monetary aggregates
and their counterparts, annual rates of change are
compiled from chain-linked indices, with joining
countries’ series linked to the euro area series in
the December index. Thus, if a country joins the
euro area in January of a given year, annual rates
of change relate to the previous composition of
the euro area up to and including December of the
previous year, and the enlarged composition of
the euro area thereafter. Percentage changes are
calculated on the basis of a chain-linked index,
taking account of the changing composition of
the euro area. Absolute changes for monetary
aggregates and their counterparts (transactions)
refer to the composition of the euro area at the
time to which the statistics relate.
GENERAL NOTES

ECB
Monthly Bulletin
October 2012S 86
Given that the composition of the European
currency unit (ECU) does not coincide with the
former currencies of the countries that have
adopted the single currency, pre-1999 amounts
originally expressed in the participating
currencies and converted into ECU at current
ECU exchange rates are affected by movements
in the currencies of EU Member States that have
not adopted the euro. To avoid this effect on the
monetary statistics, pre-1999 data 1 are expressed
in units converted from national currencies at
the irrevocable euro exchange rates established
on 31 December 1998. Unless otherwise
indicated, price and cost statistics before 1999
are based on data expressed in national
currency terms.
Methods of aggregation and/or consolidation
(including cross-country consolidation) have
been used where appropriate.
Recent data are often provisional and may be
revised. Discrepancies between totals and their
components may arise from rounding.
The group “Other EU Member States” comprises
Bulgaria, the Czech Republic, Denmark, Latvia,
Lithuania, Hungary, Poland, Romania, Sweden
and the United Kingdom.
In most cases, the terminology used within the
tables follows international standards, such
as those contained in the European System of
Accounts 1995 and the IMF Balance of Payments
Manual. Transactions refer to voluntary
exchanges (measured directly or derived), while
fl ows also encompass changes in outstanding
amounts owing to price and exchange rate
changes, write-offs and other changes.
In the tables, the wording “up to (x) years”
means “up to and including (x) years”.
OVERVIEW
Developments in key indicators for the euro area
are summarised in an overview table.
MONETARY POLICY STATISTICS
Section 1.4 shows statistics on minimum reserve
and liquidity factors. Maintenance periods for
minimum reserve requirements start every month
on the settlement day of the main refi nancing
operation (MRO) following the Governing
Council meeting for which the monthly
assessment of the monetary policy stance is
scheduled. They end on the day preceding the
corresponding settlement day in the following
month. Annual/quarterly observations refer to
averages for the last reserve maintenance period
of the year/quarter.
Table 1 in Section 1.4 shows the components
of the reserve base of credit institutions
subject to reserve requirements. Liabilities
vis-à-vis other credit institutions subject to the
ESCB’s minimum reserve system, the ECB
and participating national central banks are
excluded from the reserve base. When a credit
institution cannot provide evidence of the
amount of its issues of debt securities with a
maturity of up to two years which are held by
the institutions mentioned above, it may deduct
a certain percentage of these liabilities from its
reserve base. The percentage used to calculate
the reserve base was 10% until November 1999
and has been 30% since that date.
Table 2 in Section 1.4 contains average data
for completed maintenance periods. First,
the reserve requirement of each individual
credit institution is calculated by applying the
reserve ratios for the corresponding categories
of liability to the eligible liabilities, using the
balance sheet data from the end of each calendar
month. Subsequently, each credit institution
deducts from this fi gure a lump-sum allowance
of €100,000. The resulting required reserves are
then aggregated at the euro area level (column 1).
Current account holdings (column 2) are the
Data on monetary statistics in Sections 2.1 to 2.8 are available 1
for periods prior to January 1999 on the ECB’s website (http://
www.ecb.europa.eu/stats/services/downloads/html/index.
en.html) and in the SDW (http://sdw.ecb.europa.eu/browse.
do?node=2018811).

ECB
Monthly Bulletin
October 2012 S 87
EURO AREASTATISTICS
General Notes
aggregate average daily current account holdings
of credit institutions, including those that serve
to fulfi l reserve requirements. Excess reserves
(column 3) are the average current account
holdings over the maintenance period in excess
of the required reserves. Defi ciencies (column 4)
are defi ned as the average shortfalls of current
account holdings from required reserves over
the maintenance period, computed on the basis
of those credit institutions that have not fulfi lled
their reserve requirements. The interest rate on
minimum reserves (column 5) is equal to the
average, over the maintenance period, of the
ECB’s rate (weighted according to the number
of calendar days) on the Eurosystem’s MROs
(see Section 1.3).
Table 3 in Section 1.4 shows the banking
system’s liquidity position, which is defi ned
as euro area credit institutions’ current account
holdings with the Eurosystem in euro. All
amounts are derived from the consolidated
fi nancial statement of the Eurosystem. Other
liquidity-absorbing operations (column 7)
exclude the issuance of debt certifi cates
initiated by NCBs in Stage Two of EMU. Net
other factors (column 10) represent the netted
remaining items in the consolidated fi nancial
statement of the Eurosystem. Credit institutions’
current accounts (column 11) are equal to
the difference between the sum of liquidity-
providing factors (columns 1 to 5) and the sum
of liquidity-absorbing factors (columns 6 to 10).
Base money (column 12) is calculated as the
sum of the deposit facility (column 6), banknotes
in circulation (column 8) and credit institutions’
current account holdings (column 11).
MONEY, BANKING AND OTHER FINANCIAL
CORPORATIONS
Chapter 2 shows balance sheet statistics for MFIs
and other fi nancial corporations. Other fi nancial
corporations comprise investment funds (other
than money market funds, which are part of
the MFI sector), fi nancial vehicle corporations,
insurance corporations and pension funds.
Section 2.1 shows the aggregated balance
sheet of the MFI sector, i.e. the sum of the
harmonised balance sheets of all MFIs resident
in the euro area. MFIs comprise central banks,
credit institutions as defi ned under EU law,
money market funds and other institutions
whose business it is to receive deposits and/or
close substitutes for deposits from entities other
than MFIs and, for their own account (at least
in economic terms), to grant credit and/or make
investments in securities. A complete list of
MFIs is published on the ECB’s website.
Section 2.2 shows the consolidated balance
sheet of the MFI sector, which is obtained by
netting the aggregated balance sheet positions of
MFIs in the euro area. Owing to a small amount
of heterogeneity in recording practices, the sum
of the inter-MFI positions is not necessarily
zero; the balance is shown in column 10 of
the liabilities side of Section 2.2. Section 2.3
sets out the euro area monetary aggregates
and counterparts. These are derived from the
consolidated MFI balance sheet and include
positions of non-MFIs resident in the euro area
held with MFIs resident in the euro area; they
also take account of some monetary assets/
liabilities of central government. Statistics
on monetary aggregates and counterparts are
adjusted for seasonal and trading day effects.
The external liabilities item in Sections 2.1
and 2.2 shows the holdings by non-euro area
residents of: (i) shares/units issued by money
market funds located in the euro area; and
(ii) debt securities issued with a maturity of up
to two years by MFIs located in the euro area.
In Section 2.3, however, these holdings are
excluded from the monetary aggregates and
contribute to the item “net external assets”.
Section 2.4 provides analysis, broken down
by sector, type and original maturity, of loans
granted by MFIs other than the Eurosystem
(i.e. the banking system) resident in the euro
area. Section 2.5 provides analysis, broken
down by sector and instrument, of deposits held
with the euro area banking system. Section 2.6
shows the securities held by the euro area

ECB
Monthly Bulletin
October 2012S 88
banking system, broken down by type of
issuer. Section 2.7 shows a quarterly currency
breakdown for selected MFI balance sheet
items.
Sections 2.2 to 2.6 also provide growth rates
based on those transactions in the form of annual
percentage changes.
Since 1 January 1999 statistical information has
been collected and compiled on the basis of
various ECB regulations concerning the balance
sheet of the monetary fi nancial institution sector.
Since July 2010 this has been carried out on the
basis of Regulation ECB/2008/32 2. Detailed
sector defi nitions are set out in the third edition
of the “Monetary fi nancial institutions and
markets statistics sector manual – Guidance for
the statistical classifi cation of customers” (ECB,
March 2007).
Section 2.8 shows outstanding amounts and
transactions on the balance sheet of euro area
investment funds (other than money market
funds, which are included in the MFI balance
sheet statistics). An investment fund is a
collective investment undertaking that invests
capital raised from the public in fi nancial and/
or non-fi nancial assets. A complete list of euro
area investment funds is published on the ECB’s
website. The balance sheet is aggregated, so
investment funds’ assets include their holdings
of shares/units issued by other investment
funds. Shares/units issued by investment funds
are also broken down by investment policy
(i.e. into bond funds, equity funds, mixed
funds, real estate funds, hedge funds and other
funds) and by type (i.e. into open-end funds and
closed-end funds). Section 2.9 provides further
details on the main types of asset held by euro
area investment funds. This section contains
a geographical breakdown of the issuers of
securities held by investment funds, as well
as breaking issuers down by economic sector
where they are resident in the euro area.
Since December 2008 harmonised statistical
information has been collected and compiled
on the basis of Regulation ECB/2007/8 3
concerning statistics on the assets and liabilities
of investment funds. Further information on
these investment fund statistics can be found
in the “Manual on investment fund statistics”
(ECB, May 2009).
Section 2.10 shows the aggregated balance
sheet of fi nancial vehicle corporations (FVCs)
resident in the euro area. FVCs are entities which
are set up in order to carry out securitisation
transactions. Securitisation generally involves
the transfer of an asset or pool of assets to an
FVC, with such assets reported on the FVC’s
balance sheet as securitised loans, securities
other than shares, or other securitised assets.
Alternatively, the credit risk relating to an asset
or pool of assets may be transferred to an FVC
through credit default swaps, guarantees or other
such mechanisms. Collateral held by the FVC
against these exposures is typically a deposit
held with an MFI or invested in securities other
than shares. FVCs typically securitise loans
which have been originated by the MFI sector.
FVCs must report such loans on their statistical
balance sheet, regardless of whether the relevant
accounting rules allow the MFI to derecognise
the loans. Data on loans which are securitised
by FVCs but remain on the balance sheet of
the relevant MFI (and thus remain in the MFI
statistics) are provided separately. These
quarterly data are collected under Regulation
ECB/2008/30 4 as of December 2009.
Section 2.11 shows the aggregated balance sheet
of insurance corporations and pension funds
resident in the euro area. Insurance corporations
cover both the insurance and reinsurance sectors,
while pension funds include entities which have
autonomy in terms of decision-making and keep
a complete set of accounts (i.e. autonomous
pension funds). This section also contains a
geographical and sectoral breakdown of issuing
counterparties for securities other than shares
held by insurance corporations and pension
funds.
OJ L 15, 20.01.2009, p. 14.2
OJ L 211, 11.08.2007, p. 8.3
OJ L 15, 20.01.2009, p. 1.4

ECB
Monthly Bulletin
October 2012 S 89
EURO AREASTATISTICS
General Notes
EURO AREA ACCOUNTS
Section 3.1 shows quarterly integrated euro area
accounts data, which provide comprehensive
information on the economic activities of
households (including non-profi t institutions
serving households), non-fi nancial corporations,
fi nancial corporations and general government,
as well as on the interaction between these
sectors and both the euro area and the rest of the
world. Non-seasonally adjusted data at current
prices are displayed for the last available quarter,
following a simplifi ed sequence of accounts in
accordance with the methodological framework
of the European System of Accounts 1995.
In short, the sequence of accounts (transactions)
comprises: (1) the generation of income account,
which shows how production activity translates
into various categories of income; (2) the
allocation of primary income account, which
records receipts and expenses relating to various
forms of property income (for the economy as a
whole; the balancing item of the primary income
account is national income); (3) the secondary
distribution of income account, which shows
how the national income of an institutional
sector changes because of current transfers; (4)
the use of income account, which shows how
disposable income is spent on consumption or
saved; (5) the capital account, which shows how
savings and net capital transfers are spent in the
acquisition of non-fi nancial assets (the balancing
item of the capital account is net lending/
net borrowing); and (6) the fi nancial account,
which records the net acquisitions of fi nancial
assets and the net incurrence of liabilities. As
each non-fi nancial transaction is mirrored by a
fi nancial transaction, the balancing item of the
fi nancial account conceptually also equals net
lending/net borrowing as calculated from the
capital account.
In addition, opening and closing fi nancial
balance sheets are presented, which provide a
picture of the fi nancial wealth of each individual
sector at a given point in time. Finally, other
changes in fi nancial assets and liabilities
(e.g. those resulting from the impact of changes
in asset prices) are also shown.
The sectoral coverage of the fi nancial account
and the fi nancial balance sheets is more detailed
for the fi nancial corporation sector, which
is broken down into MFIs, other fi nancial
intermediaries (including fi nancial auxiliaries),
and insurance corporations and pension funds.
Section 3.2 shows four-quarter cumulated fl ows
(transactions) for the “non-fi nancial accounts”
of the euro area (i.e. accounts (1) to (5) above),
also following the simplifi ed sequence of
accounts.
Section 3.3 shows four-quarter cumulated fl ows
(transactions and other changes) for households’
income, expenditure and accumulation accounts,
as well as outstanding amounts in the fi nancial
and non-fi nancial balance sheet accounts,
presenting data in a more analytical manner.
Sector-specifi c transactions and balancing
items are arranged in a way that more clearly
depicts the fi nancing and investment decisions
of households, while respecting the accounting
identities presented in Sections 3.1 and 3.2.
Section 3.4 displays four-quarter cumulated
fl ows (transactions) for non-fi nancial
corporations’ income and accumulation
accounts, as well as outstanding amounts for the
fi nancial balance sheet accounts, presenting data
in a more analytical manner.
Section 3.5 shows four-quarter cumulated
fi nancial fl ows (transactions and other changes)
and outstanding amounts for the fi nancial
balance sheets of insurance corporations and
pension funds.
FINANCIAL MARKETS
The series on fi nancial market statistics for the
euro area cover those EU Member States that
had adopted the euro at the time to which the
statistics relate (i.e. a changing composition),

ECB
Monthly Bulletin
October 2012S 90
with the exception of statistics on securities
issues (Sections 4.1 to 4.4), which relate to the
Euro 16 for the whole time series (i.e. a fi xed
composition).
Statistics on securities other than shares and
statistics on quoted shares (Sections 4.1 to 4.4)
are produced by the ECB using data from the
ESCB and the BIS. Section 4.5 presents MFI
interest rates on euro-denominated deposits
from and loans to euro area residents. Statistics
on money market interest rates, long-term
government bond yields and stock market
indices (Sections 4.6 to 4.8) are produced by the
ECB using data from wire services.
Statistics on securities issues cover: (i) securities
other than shares, excluding fi nancial
derivatives; and (ii) quoted shares. The former
are presented in Sections 4.1, 4.2 and 4.3, while
the latter are presented in Section 4.4. Debt
securities are broken down into short-term
and long-term securities. “Short-term” means
securities with an original maturity of one year
or less (in exceptional cases, two years or less).
Securities with (i) a longer maturity, (ii) optional
maturity dates, the latest of which is more than
one year away, or (iii) indefi nite maturity dates
are classifi ed as “long-term”. Long-term debt
securities issued by euro area residents are
broken down further into fi xed and variable rate
issues. Fixed rate issues consist of issues where
the coupon rate does not change during the life
of the issue. Variable rate issues comprise all
issues where the coupon is periodically refi xed
with reference to an independent interest rate
or index. The euro-denominated securities
indicated in Sections 4.1, 4.2 and 4.3 also include
items expressed in national denominations of
the euro.
Section 4.1 shows securities other than shares,
broken down by original maturity, residency of
the issuer and currency. It presents outstanding
amounts, gross issues and net issues of
securities other than shares, broken down into:
(i) issues denominated in euro and issues in all
currencies; (ii) issues by euro area residents
and total issues; and (iii) total and long-term
maturities. Net issues differ from the changes
in outstanding amounts owing to valuation
changes, reclassifi cations and other adjustments.
This section also presents seasonally adjusted
statistics, including six-month annualised
seasonally adjusted growth rates for total and
long-term debt securities. Seasonally adjusted
data are derived from the index of notional
stocks, from which the seasonal effects have
been removed. See the Technical Notes for
details.
Section 4.2 contains a sectoral breakdown
of outstanding amounts, gross issues and net
issues for issuers resident in the euro area in line
with the ESA 95. The ECB is included in the
Eurosystem.
The total outstanding amounts for total and long-
term debt securities in column 1 of Table 1 in
Section 4.2 correspond to the data on outstanding
amounts for total and long-term debt securities
issued by euro area residents in column 7 of
Section 4.1. The outstanding amounts for total
and long-term debt securities issued by MFIs in
column 2 of Table 1 in Section 4.2 are broadly
comparable with the data on debt securities
issued on the liabilities side of the aggregated
MFI balance sheet in column 8 of Table 2 in
Section 2.1. The total net issues for total debt
securities in column 1 of Table 2 in Section 4.2
correspond to the data on total net issues by
euro area residents in column 9 of Section 4.1.
The residual difference between long-term debt
securities and total fi xed and variable rate long-
term debt securities in Table 1 of Section 4.2
consists of zero coupon bonds and revaluation
effects.
Section 4.3 shows seasonally adjusted and
non-seasonally adjusted growth rates for
debt securities issued by euro area residents
(broken down by maturity, type of instrument,
sector of the issuer and currency), which are
based on fi nancial transactions that occur
when an institutional unit incurs or redeems
liabilities. The growth rates therefore exclude
reclassifi cations, revaluations, exchange rate
variations and any other changes that do

ECB
Monthly Bulletin
October 2012 S 91
EURO AREASTATISTICS
General Notes
not arise from transactions. The seasonally
adjusted growth rates have been annualised
for presentational purposes. See the Technical
Notes for details.
Columns 1, 4, 6 and 8 in Table 1 of Section 4.4
show the outstanding amounts of quoted shares
issued by euro area residents broken down by
issuing sector. The monthly data for quoted
shares issued by non-fi nancial corporations
correspond to the quarterly series shown in
Section 3.4 (fi nancial balance sheet; quoted
shares).
Columns 3, 5, 7 and 9 in Table 1 of Section 4.4
show annual growth rates for quoted shares
issued by euro area residents (broken down by
the sector of the issuer), which are based on
fi nancial transactions that occur when an issuer
issues or redeems shares for cash, excluding
investments in the issuer’s own shares.
The calculation of annual growth rates excludes
reclassifi cations, revaluations and any other
changes that do not arise from transactions.
Section 4.5 presents statistics on all the interest
rates that MFIs resident in the euro area apply
to euro-denominated deposits and loans vis-à-
vis households and non-fi nancial corporations
resident in the euro area. Euro area MFI interest
rates are calculated as a weighted average
(by corresponding business volume) of the euro
area countries’ interest rates for each category.
MFI interest rate statistics are broken down by
type of business coverage, sector, instrument
category and maturity, period of notice or initial
period of interest rate fi xation. These MFI
interest rate statistics replaced the ten transitional
statistical series on euro area retail interest rates
that had been published in the Monthly Bulletin
as of January 1999.
Section 4.6 presents money market interest rates
for the euro area, the United States and Japan.
For the euro area, a broad spectrum of money
market interest rates is covered, ranging from
interest rates on overnight deposits to those on
twelve-month deposits. Before January 1999,
synthetic euro area interest rates were calculated
on the basis of national rates weighted by
GDP. With the exception of the overnight rate
prior to January 1999, monthly, quarterly and
yearly values are period averages. Overnight
deposits are represented by end-of-period
interbank deposit bid rates up to and including
December 1998 and period averages for the euro
overnight index average (EONIA) thereafter.
As of January 1999, euro area interest rates on
one, three, six and twelve-month deposits are
euro interbank offered rates (EURIBOR); prior
to that date, they are London interbank offered
rates (LIBOR) where available. For the United
States and Japan, interest rates on three-month
deposits are represented by LIBOR.
Section 4.7 shows end-of-period rates estimated
from nominal spot yield curves based on AAA-
rated euro-denominated bonds issued by euro
area central governments. The yield curves are
estimated using the Svensson model 5. Spreads
between the ten-year rates and the three-month
and two-year rates are also released. Additional
yield curves (daily releases, including charts and
tables) and the corresponding methodological
information are available at: http://www.ecb.
europa.eu/stats/money/yc/html/index.en.html.
Daily data can also be downloaded.
Section 4.8 shows stock market indices for the
euro area, the United States and Japan.
PRICES, OUTPUT, DEMAND AND LABOUR MARKETS
Most of the data described in this section are
produced by the European Commission (mainly
Eurostat) and national statistical authorities. Euro
area results are obtained by aggregating data
for individual countries. As far as possible, the
data are harmonised and comparable. Statistics
on labour costs indices, GDP and expenditure
components, value added by economic activity,
industrial production, retail sales passenger car
Svensson, L.E., “Estimating and Interpreting Forward Interest 5
Rates: Sweden 1992-1994”, CEPR Discussion Papers, No 1051.
Centre for Economic Policy Research, London, 1994.

ECB
Monthly Bulletin
October 2012S 92
registrations and employment in terms of hours
worked are working day-adjusted.
The Harmonised Index of Consumer Prices
(HICP) for the euro area (Table 1 in Section 5.1)
is available from 1995 onwards. It is based
on national HICPs, which follow the same
methodology in all euro area countries.
The breakdown into goods and services
components is derived from the classifi cation
of individual consumption by purpose (Coicop/
HICP). The HICP covers monetary expenditure by
households on fi nal consumption in the economic
territory of the euro area. The table includes
seasonally adjusted HICP data and experimental
HICP-based estimates of administered prices,
which are compiled by the ECB.
Industrial producer prices (Table 2 in
Section 5.1), industrial production, industrial
turnover and retail sales (Section 5.2) are covered
by Council Regulation (EC) No 1165/98 of
19 May 1998 concerning short-term statistics 6.
Since January 2009 the revised classifi cation
of economic activities (NACE Revision 2), as
covered by Regulation (EC) No 1893/2006 of
the European Parliament and of the Council of
20 December 2006 establishing the statistical
classifi cation of economic activities NACE
Revision 2 and amending Council Regulation
(EEC) No 3037/90, as well as certain
EC Regulations on specifi c statistical domains 7,
has been applied in the production of short-
term statistics. The breakdown by end use of
product for industrial producer prices and
industrial production is the harmonised
sub-division of industry excluding construction
(NACE Revision 2, sections B to E) into Main
Industrial Groupings (MIGs) as defi ned by
Commission Regulation (EC) No 656/2007
of 14 June 2007 8. Industrial producer prices
refl ect the ex-factory gate prices of producers.
They include indirect taxes except VAT and
other deductible taxes. Industrial production
refl ects the value added of the industries
concerned.
The two non-energy commodity price indices
shown in Table 3 in Section 5.1 are compiled
with the same commodity coverage, but using
two different weighting schemes: one based on
the respective commodity imports of the euro
area (columns 2-4), and the other (columns 5-7)
based on estimated euro area domestic demand,
or “use”, taking into account information on
imports, exports and the domestic production
of each commodity (ignoring, for the sake of
simplicity, inventories, which are assumed to
be relatively stable over the observed period).
The import-weighted commodity price index is
appropriate for analysing external developments,
while the use-weighted index is suitable for
the specifi c purpose of analysing international
commodity price pressures on euro area infl ation.
The use-weighted commodity price indices are
experimental data. For more details as regards
the compilation of the ECB commodity price
indices, see Box 1 in the December 2008 issue
of the Monthly Bulletin.
The labour cost indices (Table 5 in Section 5.1)
measure the changes in labour costs per hour
worked in industry (including construction)
and market services. Their methodology is laid
down in Regulation (EC) No 450/2003 of the
European Parliament and of the Council of
27 February 2003 concerning the labour cost
index 9 and in the implementing Commission
Regulation (EC) No 1216/2003 of 7 July 2003 10.
A breakdown of the labour cost indices for the
euro area is available by labour cost component
(wages and salaries, and employers’ social
contributions plus employment-related taxes
paid by the employer less subsidies received
by the employer) and by economic activity.
The ECB calculates the indicator of negotiated
wages (memo item in Table 5 of Section 5.1) on
the basis of non-harmonised, national-defi nition
data.
Unit labour cost components (Table 4 in
Section 5.1), GDP and its components (Tables 1
and 2 in Section 5.2), GDP defl ators (Table 3 in
OJ L 162, 5.6.1998, p. 1.6
OJ L 393, 30.12.2006, p. 1.7
OJ L 155, 15.6.2007, p. 3.8
OJ L 69, 13.3.2003, p. 1.9
OJ L 169, 8.7.2003, p. 37.10
ECB
Monthly Bulletin
October 2012 S 93
EURO AREASTATISTICS
General Notes
Section 5.1) and employment statistics (Table 1
in Section 5.3) are derived from the ESA 95 11
quarterly national accounts. The ESA 95 was
amended by Commission Regulation (EU)
No 715/2010 of 10 August 2010 12 introducing
NACE Revision 2, the updated statistical
classifi cation of economic activities. The
publication of euro area national accounts
data applying this new classifi cation began in
December 2011.
Industrial new orders (Table 4 in Section 5.2)
measure the orders received during the reference
period and cover industries working mainly on
the basis of orders – in particular the textile, pulp
and paper, chemical, metal, capital goods and
durable consumer goods industries. The data are
calculated on the basis of current prices.
Indices for turnover in industry and for the
retail trade (Table 4 in Section 5.2) measure the
turnover, including all duties and taxes (with
the exception of VAT), invoiced during the
reference period. Retail trade turnover covers all
retail trade (excluding sales of motor vehicles
and motorcycles), except automotive fuel. New
passenger car registrations cover registrations of
both private and commercial passenger cars.
Qualitative business and consumer survey data
(Table 5 in Section 5.2) draw on the European
Commission Business and Consumer Surveys.
Unemployment rates (Table 4 in Section 5.3)
conform to International Labour Organization
guidelines. They refer to persons actively
seeking work as a share of the labour force,
using harmonised criteria and defi nitions.
The labour force estimates underlying the
unemployment rate are different from the sum
of the employment and unemployment levels
published in Section 5.3.
GOVERNMENT FINANCE
Sections 6.1 to 6.5 show the general government
fi scal position in the euro area. The data are
mainly consolidated and are based on the
ESA 95 methodology. The annual euro area
aggregates in Sections 6.1 to 6.3 are compiled
by the ECB on the basis of harmonised data
provided by the NCBs, which are regularly
updated. The defi cit and debt data for the euro
area countries may therefore differ from those
used by the European Commission within the
excessive defi cit procedure. The quarterly euro
area aggregates in Sections 6.4 and 6.5 are
compiled by the ECB on the basis of Eurostat
and national data.
Section 6.1 presents annual fi gures on general
government revenue and expenditure on the
basis of defi nitions laid down in Commission
Regulation (EC) No 1500/2000 of 10 July 2000 13
amending the ESA 95. Section 6.2 shows details
of general government gross consolidated debt
at nominal value in line with the Treaty
provisions on the excessive defi cit procedure.
Sections 6.1 and 6.2 include summary data for
the individual euro area countries owing to their
importance within the framework of the Stability
and Growth Pact. The defi cits/surpluses
presented for the individual euro area countries
correspond to excessive defi cit procedure B.9, as
defi ned by Council Regulation (EC) No 479/2009
as regards references to the ESA 95. Section 6.3
presents changes in general government debt.
The difference between the change in the
government debt and the government defi cit –
the defi cit-debt adjustment – is mainly explained
by government transactions in fi nancial assets
and by foreign exchange valuation effects.
Section 6.4 presents non-seasonally adjusted
quarterly fi gures on general government revenue
and expenditure on the basis of defi nitions laid
down in Regulation (EC) No 1221/2002 of the
European Parliament and of the Council of
10 June 2002 on quarterly non-fi nancial accounts
for general government 14. Section 6.5 presents
quarterly fi gures on gross consolidated
government debt, the defi cit-debt adjustment and
the government borrowing requirement. These
fi gures are compiled using data provided by the
OJ L 310, 30.11.1996, p. 1.11
OJ L 210, 11.8.2010, p. 1.12
OJ L 172, 12.7.2000, p. 3. 13
OJ L 179, 9.7.2002, p. 1.14

ECB
Monthly Bulletin
October 2012S 94
Member States under Regulation (EC)
No 501/2004 and Regulation (EC) No 222/2004
and data provided by the NCBs.
EXTERNAL TRANSACTIONS AND POSITIONS
The concepts and defi nitions used in balance of
payments and international investment position
(i.i.p.) statistics (Sections 7.1 to 7.4) are
generally in line with the IMF Balance of
Payments Manual (fi fth edition, October 1993),
the ECB Guideline of 16 July 2004 on the
statistical reporting requirements of the ECB
(ECB/2004/15) 15 and the amending ECB
Guideline of 31 May 2007 (ECB/2007/3) 16.
Additional information regarding the
methodologies and sources used in the euro area
b.o.p. and i.i.p. statistics can be found in the
ECB publication entitled “European Union
balance of payments/international investment
position statistical methods” (May 2007) and in
the reports of the Task Force on Portfolio
Investment Collection Systems (June 2002),
the Task Force on Portfolio Investment Income
(August 2003) and the Task Force on Foreign
Direct Investment (March 2004), all of which
can be downloaded from the ECB’s website.
In addition, a report by the ECB/European
Commission (Eurostat) Task Force on Quality
looking at balance of payments and international
investment position statistics (June 2004) is
available on the website of the Committee on
Monetary, Financial and Balance of Payments
Statistics (www.cmfb.org). The annual quality
report on the euro area b.o.p./i.i.p., which is
based on the Task Force’s recommendations
and follows the basic principles of the ECB
Statistics Quality Framework published in
April 2008, is available on the ECB’s website.
On 9 December 2011 the ECB Guideline on
the statistical requirements of the European
Central Bank in the fi eld of external statistics
(ECB/2011/23) 17 was adopted by the Governing
Council of the ECB. This legal act lays down new
reporting requirements in the fi eld of external
statistics, which mainly refl ect methodological
changes introduced in the sixth edition of the
IMF’s Balance of Payments and International
Investment Position Manual (BPM6). The ECB
will begin publishing the euro area’s b.o.p.,
i.i.p. and international reserves statistics in
accordance with Guideline ECB/2011/23 and
the BPM6 in 2014, with backdata.
The tables in Sections 7.1 and 7.4 follow
the sign convention in the IMF Balance of
Payments Manual – i.e. surpluses in the current
account and the capital account have a plus
sign, while in the fi nancial account a plus sign
denotes an increase in liabilities or a decrease
in assets. In the tables in Section 7.2, both credit
and debit transactions are presented with a plus
sign. Furthermore, as of the February 2008
issue of the Monthly Bulletin, the tables in
Section 7.3 have been restructured in order to
allow the data on the balance of payments, the
international investment position and related
growth rates to be presented together; in the new
tables, transactions in assets and liabilities that
correspond to increases in positions are shown
with a plus sign.
The euro area b.o.p. is compiled by the ECB.
Recent monthly fi gures should be regarded as
provisional. Data are revised when fi gures for
the following month and/or the detailed quarterly
b.o.p. are published. Earlier data are revised
periodically or as a result of methodological
changes in the compilation of the source data.
Table 1 in Section 7.2 also contains seasonally
adjusted data for the current account. Where
appropriate, the adjustment also covers
working day, leap year and/or Easter-related
effects. Table 3 in Section 7.2 and Table 9 in
Section 7.3 present a breakdown of the euro
area b.o.p. and i.i.p. vis-à-vis major partner
countries, both individually and as a group,
distinguishing between EU Member States
outside the euro area and countries or areas
outside the European Union. The breakdown
also shows transactions and positions vis-à-vis
EU institutions (which, with the exception
OJ L 354, 30.11.2004, p. 34.15
OJ L 159, 20.6.2007, p. 48.16
OJ L 65, 3.3.2012, p. 1.17

ECB
Monthly Bulletin
October 2012 S 95
EURO AREASTATISTICS
General Notes
of the ECB, are considered to be outside the
euro area for statistical purposes, regardless
of their physical location) and, for some
purposes, offshore centres and international
organisations. The breakdown does not cover
transactions or positions in portfolio investment
liabilities, fi nancial derivatives or international
reserves. In addition, separate data are not
provided for investment income payable
to Brazil, mainland China, India or Russia.
The geographical breakdown is described in the
article entitled “Euro area balance of payments
and international investment position vis-à-vis
main counterparts” in the February 2005 issue
of the Monthly Bulletin.
The data on the euro area b.o.p. fi nancial
account and i.i.p. in Section 7.3 are based on
transactions and positions vis-à-vis non-residents
of the euro area, regarding the euro area as
a single economic entity (see also Box 9 in the
December 2002 issue of the Monthly Bulletin,
Box 5 in the January 2007 issue of the Monthly
Bulletin and Box 6 in the January 2008 issue
of the Monthly Bulletin). The i.i.p. is valued
at current market prices, with the exception of
direct investment, where book values are used
for unquoted shares, and other investments
(e.g. loans and deposits). The quarterly
i.i.p. is compiled on the basis of the same
methodological framework as the annual i.i.p.
As some data sources are not available on
a quarterly basis (or are available with a delay),
the quarterly i.i.p. is partly estimated on the
basis of fi nancial transactions, asset prices and
foreign exchange developments.
Table 1 in Section 7.3 summarises the i.i.p. and
fi nancial transactions in the euro area b.o.p.
The breakdown of the change in the annual
i.i.p. is obtained by applying a statistical model
to i.i.p. changes other than transactions, using
information from the geographical breakdown
and currency composition of assets and
liabilities, as well as price indices for different
fi nancial assets. In this table, columns 5 and
6 refer to direct investment by resident units
abroad and direct investment by non-resident
units in the euro area.
In Table 5 in Section 7.3, the breakdown into
“loans” and “currency and deposits” is based on
the sector of the non-resident counterpart – i.e.
assets vis-à-vis non-resident banks are classifi ed
as deposits, whereas assets vis-à-vis other
non-resident sectors are classifi ed as loans. This
breakdown follows the distinction made in other
statistics, such as the MFI consolidated balance
sheet, and conforms to the IMF Balance of
Payments Manual.
The outstanding amounts for the Eurosystem’s
international reserves and related assets and
liabilities are shown in Table 7 of Section 7.3.
These fi gures are not fully comparable with
those in the Eurosystem’s weekly fi nancial
statement owing to differences in coverage
and valuation. The data in Table 7 are in line
with the recommendations for the template
on international reserves and foreign currency
liquidity. By defi nition, the assets included in the
Eurosystem’s international reserves take account
of the changing composition of the euro area.
Before countries join the euro area, the assets
of their national central banks are included in
portfolio investment (in the case of securities)
or other investment (in the case of other assets).
Changes in the gold holdings of the Eurosystem
(column 3) are due to transactions in gold within
the terms of the Central Bank Gold Agreement
of 26 September 1999, which was updated
on 27 September 2009. More information on
the statistical treatment of the Eurosystem’s
international reserves can be found in a publication
entitled “Statistical treatment of the Eurosystem’s
international reserves” (October 2000), which
can be downloaded from the ECB’s website. The
website also contains more comprehensive data
in accordance with the template on international
reserves and foreign currency liquidity.
The euro area’s gross external debt statistics
in Table 8 of Section 7.3 represent outstanding
actual (rather than contingent) liabilities vis-à-vis
non-euro area residents that require the payment
of principal and/or interest by the debtor at one
or more points in the future. Table 8 shows a
breakdown of gross external debt by instrument
and institutional sector.
ECB
Monthly Bulletin
October 2012S 96
Section 7.4 contains a monetary presentation
of the euro area balance of payments, showing
the transactions by non-MFIs that mirror the net
external transactions by MFIs. Included in the
transactions by non-MFIs are b.o.p. transactions
for which a sectoral breakdown is not available.
These concern the current and capital accounts
(column 2) and fi nancial derivatives (column 11).
An up-to-date methodological note on the
monetary presentation of the euro area balance
of payments is available in the “Statistics”
section of the ECB’s website. See also Box 1 in
the June 2003 issue of the Monthly Bulletin.
Section 7.5 shows data on euro area external
trade in goods. The source is Eurostat. Value data
and volume indices are seasonally and working
day-adjusted. The breakdown by product
group in columns 4 to 6 and 9 to 11 of Table 1
in Section 7.5 is in line with the classifi cation
contained in the Broad Economic Categories
and corresponds to the basic classes of goods in
the System of National Accounts. Manufactured
goods (columns 7 and 12) and oil (column 13)
are in line with the SITC Rev. 4 defi nition. The
geographical breakdown (Table 3 in Section 7.5)
shows major trading partners both individually
and in regional groups. China excludes Hong
Kong. On account of differences in defi nitions,
classifi cation, coverage and time of recording,
external trade data, in particular for imports, are
not fully comparable with the goods item in the
b.o.p. statistics (Sections 7.1 and 7.2). Part of the
difference arises from the inclusion of insurance
and freight services in the recording of imported
goods in external trade data.
Industrial import prices and industrial producer
export prices (or industrial output prices for
the non-domestic market) shown in Table 2
in Section 7.5 were introduced by Regulation
(EC) No 1158/2005 of the European Parliament
and of the Council of 6 July 2005 amending
Council Regulation (EC) No 1165/98, which is
the principal legal basis for short-term statistics.
The industrial import price index covers
industrial products imported from outside the
euro area under sections B to E of the Statistical
Classifi cation of Products by Activity in the
European Economic Community (CPA) and all
institutional import sectors except households,
governments and non-profi t institutions.
It refl ects the cost, insurance and freight price
excluding import duties and taxes, and refers to
actual transactions in euro recorded at the point
when ownership of the goods is transferred.
The industrial producer export prices cover all
industrial products exported directly by euro
area producers to the extra-euro area market
under sections B to E of NACE Revision 2.
Exports from wholesalers and re-exports are
not covered. The indices refl ect the free on
board price expressed in euro and calculated
at the euro area frontier, including any indirect
taxes except VAT and other deductible taxes.
Industrial import prices and industrial producer
export prices are available by Main Industrial
Grouping as defi ned by Commission Regulation
(EC) No 656/2007 of 14 June 2007. For more
details, see Box 11 in the December 2008 issue
of the Monthly Bulletin.
EXCHANGE RATES
Section 8.1 shows nominal and real effective
exchange rate indices for the euro, which are
calculated by the ECB on the basis of weighted
averages of the euro’s bilateral exchange rates
against the currencies of the selected trading
partners of the euro area. A positive change
denotes an appreciation of the euro. Weights
are based on trade in manufactured goods with
those trading partners in the periods 1995-1997,
1998-2000, 2001-2003, 2004-2006 and 2007-2009
and are calculated to account for third-market
effects. The EER indices are obtained by chain-
linking the indicators based on each of these fi ve
sets of trade weights at the end of each three-year
period. The base period of the resulting EER
index is the fi rst quarter of 1999. The EER-20
group of trading partners is composed of the 10
non-euro area EU Member States plus Australia,
Canada, China, Hong Kong, Japan, Norway,
Singapore, South Korea, Switzerland and the
United States. The EER-40 group comprises the
EER-20 plus the following countries: Algeria,
Argentina, Brazil, Chile, Croatia, Iceland,

ECB
Monthly Bulletin
October 2012 S 97
EURO AREASTATISTICS
General Notes
India, Indonesia, Israel, Malaysia, Mexico,
Morocco, New Zealand, the Philippines, Russia,
South Africa, Taiwan, Thailand, Turkey and
Venezuela. Real EERs are calculated using
consumer price indices, producer price indices,
gross domestic product defl ators and unit labour
costs, both for the manufacturing sector and for
the total economy.
For more detailed information on the calculation
of the EERs, see the relevant methodological
note and ECB Occasional Paper No 2
(“The effective exchange rates of the euro”
by Luca Buldorini, Stelios Makrydakis and
Christian Thimann, February 2002), which can
be downloaded from the ECB’s website.
The bilateral rates shown in Section 8.2 are
monthly averages of those published daily as
reference rates for these currencies. The most
recent rate for the Icelandic krona is 290.0 per
euro and refers to 3 December 2008.
DEVELOPMENTS OUTSIDE THE EURO AREA
Statistics on other EU Member States
(Section 9.1) follow the same principles as data
relating to the euro area. As a result, data on
current and capital accounts and gross external
debt include special-purpose vehicles. The data
for the United States and Japan contained in
Section 9.2 are obtained from national sources.


ECB
Monthly Bulletin
October 2012
14 JANUARY AND 4 FEBRUARY 2010
The Governing Council of the ECB decides
that the interest rate on the main refi nancing
operations and the interest rates on the marginal
lending facility and the deposit facility will
remain unchanged at 1.00%, 1.75% and 0.25%
respectively.
4 MARCH 2010
The Governing Council of the ECB decides
that the interest rate on the main refi nancing
operations and the interest rates on the marginal
lending facility and the deposit facility will
remain unchanged at 1.00%, 1.75% and 0.25%
respectively. It also decides on the details as
regards the tender procedures and modalities
to be applied in its refi nancing operations
up to 12 October 2010, including a return to
variable rate tender procedures in the regular
three-month longer-term refi nancing operations,
starting with the operation to be allotted
on 28 April 2010.
8 APRIL AND 6 MAY 2010
The Governing Council of the ECB decides
that the interest rate on the main refi nancing
operations and the interest rates on the marginal
lending facility and the deposit facility will
remain unchanged at 1.00%, 1.75% and 0.25%
respectively.
10 MAY 2010
The Governing Council of the ECB decides
on several measures to address severe tensions
in fi nancial markets. In particular, it decides
to conduct interventions in the euro area
public and private debt securities markets
(Securities Markets Programme) and to adopt a
fi xed rate tender procedure with full allotment in
the regular three-month longer-term refi nancing
operations in May and June 2010.
10 JUNE 2010
The Governing Council of the ECB decides that the
interest rate on the main refi nancing operations and
the interest rates on the marginal lending facility
and the deposit facility will remain unchanged at
1.00%, 1.75% and 0.25% respectively. In addition,
it decides to adopt a fi xed rate tender procedure
with full allotment in the regular three-month
longer-term refi nancing operations to be allotted
during the third quarter of 2010.
8 JULY AND 5 AUGUST 2010
The Governing Council of the ECB decides that the
interest rate on the main refi nancing operations and
the interest rates on the marginal lending facility
and the deposit facility will remain unchanged at
1.00%, 1.75% and 0.25% respectively.
2 SEPTEMBER 2010
The Governing Council of the ECB decides
that the interest rate on the main refi nancing
operations and the interest rates on the marginal
lending facility and the deposit facility will
remain unchanged at 1.00%, 1.75% and 0.25%
respectively. It also decides on the details as
regards the tender procedures and modalities
to be applied in its refi nancing operations up to
18 January 2011, notably the adoption of a fi xed
rate tender procedure with full allotment in the
three-month longer-term refi nancing operations.
7 OCTOBER AND 4 NOVEMBER 2010
The Governing Council of the ECB decides
that the interest rate on the main refi nancing
operations and the interest rates on the marginal
lending facility and the deposit facility will
remain unchanged at 1.00%, 1.75% and 0.25%
respectively.
I
ANNEXES
CHRONOLOGY OF MONETARY POLICY MEASURES OF THE EUROSYSTEM1
The chronology of monetary policy measures taken by the 1
Eurosystem between 1999 and 2009 can be found in the ECB’s
Annual Report for the respective years.

ECB
Monthly Bulletin
October 2012II
2 DECEMBER 2010
The Governing Council of the ECB decides
that the interest rate on the main refi nancing
operations and the interest rates on the marginal
lending facility and the deposit facility will
remain unchanged at 1.00%, 1.75% and 0.25%
respectively. It also decides on the details as
regards the tender procedures and modalities
to be applied in its refi nancing operations up
to 12 April 2011, notably to continue its fi xed
rate tender procedures with full allotment.
13 JANUARY AND 3 FEBRUARY 2011
The Governing Council of the ECB decides
that the interest rate on the main refi nancing
operations and the interest rates on the marginal
lending facility and the deposit facility will
remain unchanged at 1.00%, 1.75% and 0.25%
respectively.
3 MARCH 2011
The Governing Council of the ECB decides
that the interest rate on the main refi nancing
operations and the interest rates on the marginal
lending facility and the deposit facility will
remain unchanged at 1.00%, 1.75% and 0.25%
respectively. It also decides on the details as
regards the tender procedures and modalities
to be applied in its refi nancing operations up to
12 July 2011, notably to continue its fi xed rate
tender procedures with full allotment.
7 APRIL 2011
The Governing Council of the ECB decides
to increase the interest rate on the main
refi nancing operations by 25 basis points to
1.25%, starting from the operation to be settled
on 13 April 2011. In addition, it decides to
increase the interest rates on both the marginal
lending facility and the deposit facility by 25
basis points, to 2.00% and 0.50% respectively,
both with effect from 13 April 2011.
5 MAY 2011
The Governing Council of the ECB decides
that the interest rate on the main refi nancing
operations and the interest rates on the marginal
lending facility and the deposit facility will
remain unchanged at 1.25%, 2.00% and 0.50%
respectively.
9 JUNE 2011
The Governing Council of the ECB decides
that the interest rate on the main refi nancing
operations and the interest rates on the marginal
lending facility and the deposit facility will
remain unchanged at 1.25%, 2.00% and 0.50%
respectively. It also decides on the details as
regards the tender procedures and modalities
to be applied in its refi nancing operations up to
11 October 2011, notably to continue its fi xed
rate tender procedures with full allotment.
7 JULY 2011
The Governing Council of the ECB decides to
increase the interest rate on the main refi nancing
operations by 25 basis points to 1.50%, starting
from the operation to be settled on 13 July 2011. In
addition, it decides to increase the interest rates on
both the marginal lending facility and the deposit
facility by 25 basis points, to 2.25% and 0.75%
respectively, both with effect from 13 July 2011.
4 AUGUST 2011
The Governing Council of the ECB decides
that the interest rate on the main refi nancing
operations and the interest rates on the marginal
lending facility and the deposit facility will
remain unchanged at 1.50%, 2.25% and
0.75% respectively. It also decides on several
measures to address renewed tensions in some
fi nancial markets. In particular, it decides that the
Eurosystem will conduct a liquidity-providing
supplementary longer-term refi nancing operation
with a maturity of approximately six months as a

ECB
Monthly Bulletin
October 2012
CHRONOLOGY
III
fi xed rate tender procedure with full allotment.
It also decides on the details as regards the tender
procedures and modalities to be applied in its
refi nancing operations up to 17 January 2012,
notably to continue its fi xed rate tender
procedures with full allotment.
8 SEPTEMBER 2011
The Governing Council of the ECB decides
that the interest rate on the main refi nancing
operations and the interest rates on the marginal
lending facility and the deposit facility will
remain unchanged at 1.50%, 2.25% and 0.75%
respectively.
6 OCTOBER 2011
The Governing Council of the ECB decides
that the interest rate on the main refi nancing
operations and the interest rates on the marginal
lending facility and the deposit facility will
remain unchanged at 1.50%, 2.25% and 0.75%
respectively. It also decides on the details of its
refi nancing operations from October 2011 to
10 July 2012, notably to conduct two longer-
term refi nancing operations – one with a maturity
of approximately 12 months in October 2011,
and another with a maturity of approximately
13 months in December 2011 – and to continue
to apply fi xed rate tender procedures with full
allotment in all of its refi nancing operations.
In addition, the Governing Council decides to
launch a new covered bond purchase programme
in November 2011.
3 NOVEMBER 2011
The Governing Council of the ECB decides
to decrease the interest rate on the main
refi nancing operations by 25 basis points to
1.25%, starting from the operation to be settled
on 9 November 2011. In addition, it decides to
decrease the interest rates on both the marginal
lending facility and the deposit facility by
25 basis points, to 2.00% and 0.50% respectively,
both with effect from 9 November 2011.
8 DECEMBER 2011
The Governing Council of the ECB decides
to decrease the interest rate on the main
refi nancing operations by 25 basis points
to 1.00%, starting from the operation to be
settled on 14 December 2011. In addition,
it decides to decrease the interest rates on
both the marginal lending facility and the
deposit facility by 25 basis points, to 1.75%
and 0.25% respectively, both with effect from
14 December 2011. It also decides to adopt
further non-standard measures, notably: (i) to
conduct two longer-term refi nancing operations
with a maturity of approximately three years;
(ii) to increase the availability of collateral;
(iii) to reduce the reserve ratio to 1%; and (iv) to
discontinue, for the time being, the fi ne-tuning
operations carried out on the last day of each
maintenance period.
12 JANUARY 2012
The Governing Council of the ECB decides
that the interest rate on the main refi nancing
operations and the interest rates on the marginal
lending facility and the deposit facility will
remain unchanged at 1.00%, 1.75% and 0.25%
respectively.
9 FEBRUARY 2012
The Governing Council of the ECB decides
that the interest rate on the main refi nancing
operations and the interest rates on the marginal
lending facility and the deposit facility will
remain unchanged at 1.00%, 1.75% and 0.25%
respectively. It also approves specifi c national
eligibility criteria and risk control measures
for the temporary acceptance in a number of
countries of additional credit claims as collateral
in Eurosystem credit operations.

ECB
Monthly Bulletin
October 2012
8 MARCH, 4 APRIL AND 3 MAY 2012
The Governing Council of the ECB decides
that the interest rate on the main refi nancing
operations and the interest rates on the marginal
lending facility and the deposit facility will
remain unchanged at 1.00%, 1.75% and 0.25%
respectively.
6 JUNE 2012
The Governing Council of the ECB decides
that the interest rate on the main refi nancing
operations and the interest rates on the marginal
lending facility and the deposit facility will
remain unchanged at 1.00%, 1.75% and 0.25%
respectively. It also decides on the details as
regards the tender procedures and modalities
to be applied in its refi nancing operations up to
15 January 2013, notably to continue its fi xed
rate tender procedures with full allotment.
5 JULY 2012
The Governing Council of the ECB decides to
decrease the interest rate on the main refi nancing
operations by 25 basis points to 0.75%, starting
from the operation to be settled on 11 July 2012.
In addition, it decides to decrease the interest
rates on both the marginal lending facility and
the deposit facility by 25 basis points, to 1.50%
and 0.00% respectively, both with effect from
11 July 2012.
2 AUGUST 2012
The Governing Council of the ECB decides
that the interest rate on the main refi nancing
operations and the interest rates on the marginal
lending facility and the deposit facility will
remain unchanged at 0.75%, 1.50% and 0.00%
respectively.
6 SEPTEMBER 2012
The Governing Council of the ECB decides
that the interest rate on the main refi nancing
operations and the interest rates on the marginal
lending facility and the deposit facility will
remain unchanged at 0.75%, 1.50% and 0.00%
respectively. It also decides on the modalities
for undertaking Outright Monetary Transactions
(OMTs) in secondary markets for sovereign
bonds in the euro area.
4 OCTOBER 2012
The Governing Council of the ECB decides
that the interest rate on the main refi nancing
operations and the interest rates on the marginal
lending facility and the deposit facility will
remain unchanged at 0.75%, 1.50% and 0.00%
respectively.
IV
ECB
Monthly Bulletin
October 2012
The ECB produces a number of publications which provide information about its core activities:
monetary policy, statistics, payment and securities settlement systems, fi nancial stability and
supervision, international and European cooperation, and legal matters. These include the
following:
STATUTORY PUBLICATIONS
Annual Report –
Convergence Report –
Monthly Bulletin –
RESEARCH PAPERS
Legal Working Paper Series –
Occasional Paper Series –
Research Bulletin –
Working Paper Series –
OTHER/TASK-RELATED PUBLICATIONS
Enhancing monetary analysis –
Financial integration in Europe –
Financial Stability Review –
Statistics Pocket Book –
The European Central Bank: history, role and functions –
The international role of the euro –
The implementation of monetary policy in the euro area (“General Documentation”) –
The monetary policy of the ECB –
The payment system –
The ECB also publishes brochures and information materials on a variety of topics, such as the euro
banknotes and coins, as well as seminar and conference proceedings.
For a complete list of documents (in PDF format) published by the ECB and the European
Monetary Institute, the ECB’s forerunner from 1994 to 1998, please visit the ECB’s website at
http://www.ecb.europa.eu/pub/. Language codes indicate the languages in which each publication
is available.
Unless otherwise indicated, hard copies can be obtained or subscribed to free of charge, stock
permitting, by contacting [email protected]
PUBLICATIONS PRODUCED BY THE EUROPEAN CENTRAL BANK
V


ECB
Monthly Bulletin
October 2012
GLOSSARY
This glossary contains selected items that are frequently used in the Monthly Bulletin. A more
comprehensive and detailed glossary can be found on the ECB’s website (www.ecb.europa.eu/
home/glossary/html/index.en.html).
Autonomous liquidity factors: liquidity factors that do not normally stem from the use of monetary
policy instruments. Such factors are, for example, banknotes in circulation, government deposits
with the central bank and the net foreign assets of the central bank.
Balance of payments (b.o.p.): a statistical statement that summarises, for a specifi c period of
time, the economic transactions of an economy with the rest of the world.
Bank lending survey (BLS): a quarterly survey on lending policies that has been conducted by
the Eurosystem since January 2003. It addresses qualitative questions on developments in credit
standards, terms and conditions of loans and loan demand for both enterprises and households to a
predefi ned sample group of banks in the euro area.
Borrowing requirement (general government): net incurrence of debt by the general
government.
Break-even inflation rate: the spread between the yield on a nominal bond and that on an infl ation-
linked bond of the same (or as similar as possible) maturity.
Capital account: a b.o.p. account that covers all capital transfers and acquisitions/disposals of
non-produced, non-fi nancial assets between residents and non-residents.
Capital accounts: part of the system of national (or euro area) accounts consisting of the change in
net worth that is due to net saving, net capital transfers and net acquisitions of non-fi nancial assets.
Central parity (or central rate): the exchange rate of each ERM II member currency vis-à-vis the
euro, around which the ERM II fl uctuation margins are defi ned.
Compensation per employee or per hour worked: the total remuneration, in cash or in kind, that
is payable by employers to employees, i.e. gross wages and salaries, as well as bonuses, overtime
payments and employers’ social security contributions, divided by the total number of employees
or by the total number of employees’ hours worked.
Consolidated balance sheet of the MFI sector: a balance sheet obtained by netting out
inter-MFI positions (e.g. inter-MFI loans and deposits) in the aggregated MFI balance sheet.
It provides statistical information on the MFI sector’s assets and liabilities vis-à-vis residents of the
euro area not belonging to this sector (i.e. the general government and other euro area residents)
and vis-à-vis non-euro area residents. It is the main statistical source for the calculation of monetary
aggregates, and it provides the basis for the regular analysis of the counterparts of M3.
Collateral: assets pledged or transferred in some form as a guarantee for the repayment of
loans, as well as assets sold under repurchase agreements. Collateral used in Eurosystem reverse
transactions must fulfi l certain eligibility criteria.
Current account: a b.o.p. account that covers all transactions in goods and services, income and
current transfers between residents and non-residents.
VII

ECB
Monthly Bulletin
October 2012
Current transfers account: a technical b.o.p. account in which the value of real resources or
fi nancial items is recorded when these are transferred without receiving anything in exchange.
Current transfers cover all transfers that are not capital transfers.
Debt (financial accounts): loans taken out by households, as well as the loans, debt securities and
pension fund reserves (resulting from employers’ direct pension commitments on behalf of their
employees) of non-fi nancial corporations, valued at market prices at the end of the period.
Debt (general government): the gross debt (currency and deposits, loans and debt securities) at
nominal value outstanding at the end of the year and consolidated between and within the sectors of
general government.
Debt security: a promise on the part of the issuer (i.e. the borrower) to make one or more
payment(s) to the holder (the lender) on a specifi ed future date or dates. Such securities usually
carry a specifi c rate of interest (the coupon) and/or are sold at a discount to the amount that will
be repaid at maturity. Debt securities issued with an original maturity of more than one year are
classifi ed as long-term.
Debt-to-GDP ratio (general government): the ratio of general government debt to GDP at
current market prices. It is the subject of one of the fi scal criteria laid down in Article 126(2) of the
Treaty on the Functioning of the European Union to defi ne the existence of an excessive defi cit.
Deficit (general government): the general government’s net borrowing, i.e. the difference between
total government revenue and total government expenditure.
Deficit-debt adjustment (general government): the difference between the general government
defi cit and the change in general government debt.
Deficit ratio (general government): the ratio of the general government defi cit to GDP at current
market prices. It is the subject of one of the fi scal criteria laid down in Article 126(2) of the Treaty
on the Functioning of the European Union to defi ne the existence of an excessive defi cit. It is also
referred to as the budget defi cit ratio or the fi scal defi cit ratio.
Deflation: a signifi cant and persistent decline in the prices of a very broad set of consumer goods
and services that becomes entrenched in expectations.
Deposit facility: a standing facility of the Eurosystem enabling eligible counterparties to make, on
their own initiative, overnight deposits with the NCB in their respective jurisdiction. Deposits are
remunerated at a pre-specifi ed rate that normally provides a fl oor for overnight market interest rates.
Disinflation: a process of decelerating infl ation that may lead to negative infl ation rates of a
temporary nature.
Direct investment: cross-border investment for the purpose of obtaining a lasting interest in an
enterprise resident in another economy (assumed, in practice, for ownership of at least 10% of
the ordinary shares or voting power). Included are equity capital, reinvested earnings and other
capital associated with inter-company operations. The direct investment account records net
transactions/positions in assets abroad by euro area residents (as “direct investment abroad”) and net
transactions/positions in euro area assets by non-residents (as “direct investment in the euro area”).
VIII

ECB
Monthly Bulletin
October 2012
GLOSSARY
Effective exchange rates (EERs) of the euro (nominal/real): weighted averages of bilateral
euro exchange rates against the currencies of the euro area’s main trading partners. The EER indices
of the euro are calculated against different groups of trading partners: the EER-20 comprises the
ten non-euro area EU Member States and ten trading partners outside the EU, and the EER-40
encompasses the EER-20 and 20 additional countries. The weights used refl ect the share of each
partner country in the euro area’s trade in manufactured goods and account for competition in
third markets. Real EERs are nominal EERs defl ated by a weighted average of foreign, relative to
domestic, prices or costs. They are thus measures of price and cost competitiveness.
Enhanced credit support: the non-standard measures taken by the ECB/Eurosystem during the
fi nancial crisis with a view to supporting fi nancing conditions and credit fl ows above and beyond
what could be achieved through reductions in key ECB interest rates alone.
EONIA (euro overnight index average): a measure of the effective interest rate prevailing in
the euro interbank overnight market. It is calculated as a weighted average of the interest rates on
unsecured overnight lending transactions denominated in euro, as reported by a panel of contributing
banks.
Equities: securities representing ownership of a stake in a corporation, e.g. shares traded on stock
exchanges (quoted shares), unquoted shares and other forms of equity. Equities usually produce
income in the form of dividends.
ERM II (exchange rate mechanism II): the exchange rate arrangement that provides the
framework for exchange rate policy cooperation between the euro area countries and the EU
Member States not participating in Stage Three of EMU.
EURIBOR (euro interbank offered rate): the rate at which what is known as a prime bank is
willing to lend funds (denominated in euro) to another prime bank. The EURIBOR is computed
daily, based on the rates of a sample of selected banks, for different maturities of up to 12 months.
Euro area: the area formed by those EU Member States in which the euro has been adopted as the
single currency in accordance with the Treaty on the Functioning of the European Union.
European Commission surveys: harmonised surveys of business and/or consumer sentiment
conducted on behalf of the European Commission in each of the EU Member States. Such
questionnaire-based surveys are addressed to managers in the manufacturing, construction, retail
and services industries, as well as to consumers. From each monthly survey, composite indicators
are calculated that summarise the replies to a number of different questions in a single indicator
(confi dence indicators).
Eurosystem: the central banking system made up of the ECB and the NCBs of those EU Member
States whose currency is the euro.
Eurozone Purchasing Managers’ Surveys: surveys of business conditions in manufacturing and
in services industries conducted for a number of countries in the euro area and used to compile
indices. The Eurozone Manufacturing Purchasing Managers’ Index (PMI) is a weighted indicator
calculated from indices of output, new orders, employment, suppliers’ delivery times and stocks
of purchases. The services sector survey asks questions on business activity, expectations of future
business activity, the amount of business outstanding, incoming new business, employment, input
IX
ECB
Monthly Bulletin
October 2012
prices and prices charged. The Eurozone Composite Index is calculated by combining the results
from the manufacturing and services sector surveys.
External trade in goods: exports and imports of goods with countries outside the euro area,
measured in terms of value and as indices of volume and unit value. External trade statistics are
not comparable with the exports and imports recorded in the national accounts, as the latter include
both intra-euro area and extra-euro area transactions, and also combine goods and services. Nor are
they fully comparable with the goods item in b.o.p. statistics. Besides methodological adjustments,
the main difference is that imports in external trade statistics are recorded including insurance and
freight services, whereas they are recorded free on board in the goods item in the b.o.p. statistics.
Financial account: a b.o.p. account that covers transactions between residents and non-residents in
direct investment, portfolio investment, other investment, fi nancial derivatives and reserve assets.
Financial accounts: part of the system of national (or euro area) accounts showing the fi nancial
positions (stocks or balance sheets), fi nancial transactions and other changes of the different
institutional sectors of an economy by type of fi nancial asset.
Financial vehicle corporation (FVC): an entity whose principal activity is to carry out
securitisation transactions. An FVC typically issues marketable securities that are offered for sale
to the general public, or sold in the form of private placements. These securities are backed by
a portfolio of assets (typically loans) which are held by the FVC. In some cases, a securitisation
transaction may involve a number of FVCs, where one FVC holds the securitised assets and another
issues the securities backed by those assets.
Fixed rate tender: a tender procedure in which the interest rate is specifi ed in advance by the
central bank and in which participating counterparties bid the amount of money they wish to
transact at the fi xed interest rate.
Fixed rate full-allotment tender procedure: a tender procedure in which the interest rate is
pre-specifi ed by the central bank (fi xed rate) and in which counterparties bid the amount of
money they want to transact at that rate, knowing in advance that all their bids will be satisfi ed
(full allotment).
General government: a sector defi ned in the ESA 95 as comprising resident entities that are
engaged primarily in the production of non-market goods and services intended for individual and
collective consumption and/or in the redistribution of national income and wealth. Included are
central, regional and local government authorities as well as social security funds. Excluded are
government-owned entities that conduct commercial operations, such as public enterprises.
Gross domestic product (GDP): the value of an economy’s total output of goods and services less
intermediate consumption, plus net taxes on products and imports. GDP can be broken down by
output, expenditure or income components. The main expenditure aggregates that make up GDP are
household fi nal consumption, government fi nal consumption, gross fi xed capital formation, changes
in inventories, and imports and exports of goods and services (including intra-euro area trade).
Gross external debt: the outstanding amount of an economy’s actual (i.e. non-contingent) current
liabilities that require payment of principal and/or interest to non-residents at some point in the
future.
X

ECB
Monthly Bulletin
October 2012
GLOSSARY
Harmonised Index of Consumer Prices (HICP): a measure of the development of consumer
prices that is compiled by Eurostat and harmonised for all EU Member States.
Hourly labour cost index: a measure of labour costs, including gross wages and salaries (in cash
and in kind, including bonuses) and other labour costs (employers’ social contributions plus
employment-related taxes paid by the employer minus subsidies received by the employer), per
hour actually worked (including overtime).
Implied volatility: the expected volatility (i.e. standard deviation) in the rates of change of the
price of an asset (e.g. a share or a bond). It can be derived from the asset’s price, maturity date and
exercise price of its options, as well as from a riskless rate of return, using an option pricing model
such as the Black-Scholes model.
Income account: a b.o.p. account that covers two types of transactions with non-residents, namely
(i) those involving compensation of employees that is paid to non-resident workers (e.g., cross-
border, seasonal, and other short-term workers) and (ii) those involving investment income receipts
and payments on external fi nancial assets and liabilities, with the latter including receipts and
payments on direct investment, portfolio investment and other investment, as well as receipts on
reserve assets.
Index of negotiated wages: a measure of the direct outcome of collective bargaining in terms of
basic pay (i.e. excluding bonuses) at the euro area level. It refers to the implied average change in
monthly wages and salaries.
Industrial producer prices: factory-gate prices (transportation costs are not included) of
all products sold by industry, excluding construction, on the domestic markets of the euro area
countries, excluding imports.
Industrial production: the gross value added created by industry at constant prices.
Inflation: an increase in the general price level, e.g. in the consumer price index.
Inflation-indexed government bonds: debt securities issued by the general government, the
coupon payments and principal of which are linked to a specifi c consumer price index.
Insurance corporations and pension funds: fi nancial corporations and quasi-corporations that are
engaged primarily in fi nancial intermediation as the consequence of the pooling of risks.
International investment position (i.i.p.): the value and composition of an economy’s outstanding
net fi nancial claims on (or fi nancial liabilities to) the rest of the world.
International reserves: external assets readily available to and controlled by monetary authorities
for directly fi nancing or regulating the magnitude of payment imbalances through intervention in
exchange markets. The international reserves of the euro area comprise non-euro-denominated
claims on non-euro area residents, gold, special drawing rights and the reserve positions in the IMF
which are held by the Eurosystem.
Investment funds (except money market funds): fi nancial institutions that pool capital raised
from the public and invest it in fi nancial and non-fi nancial assets. See also MFIs.
XI

ECB
Monthly Bulletin
October 2012
Job vacancies: a collective term covering newly created jobs, unoccupied jobs or jobs about to
become vacant in the near future, for which the employer has recently taken active steps to fi nd a
suitable candidate.
Key ECB interest rates: the interest rates, set by the Governing Council, which refl ect the
monetary policy stance of the ECB. They are the rates at the main refi nancing operations, on the
marginal lending facility and on the deposit facility.
Labour force: the sum total of persons in employment and the number of unemployed.
Labour productivity: the output that can be produced with a given input of labour. It can be
measured in several ways, but is commonly measured as GDP (volume) divided by either total
employment or total hours worked.
Liquidity-absorbing operation: an operation through which the Eurosystem absorbs liquidity
in order to reduce excess liquidity, or to create a shortage of liquidity. Such operations can be
conducted by issuing debt certifi cates or fi xed-term deposits.
Longer-term refinancing operation (LTRO): an open market operation with a maturity of more
than one week that is executed by the Eurosystem in the form of a reverse transaction. The regular
monthly operations have a maturity of three months. During the fi nancial market turmoil that started
in August 2007, supplementary operations with maturities ranging from one maintenance period to
36 months were conducted, the frequency of which varied.
M1: a narrow monetary aggregate that comprises currency in circulation plus overnight deposits
held with MFIs and central government (e.g. at the post offi ce or treasury).
M2: an intermediate monetary aggregate that comprises M1 plus deposits redeemable at a period
of notice of up to and including three months (i.e. short-term savings deposits) and deposits with an
agreed maturity of up to and including two years (i.e. short-term time deposits) held with MFIs and
central government.
M3: a broad monetary aggregate that comprises M2 plus marketable instruments, in particular
repurchase agreements, money market fund shares and units, and debt securities with a maturity of
up to and including two years issued by MFIs.
Main refinancing operation (MRO): a regular open market operation executed by the Eurosystem
in the form of reverse transactions. Such operations are carried out through a weekly standard tender
and normally have a maturity of one week.
Marginal lending facility: a standing facility of the Eurosystem enabling eligible counterparties,
on their own initiative, to receive overnight credit from the NCB in their jurisdiction at a
pre-specifi ed rate in the form of a reverse transaction. The rate on loans extended within the scope of
the marginal lending facility normally provides an upper bound for overnight market interest rates.
MFI credit to euro area residents: MFI loans granted to non-MFI euro area residents (including
general government and the private sector) and MFI holdings of securities (shares, other equity and
debt securities) issued by non-MFI euro area residents.
XII

ECB
Monthly Bulletin
October 2012
GLOSSARY
MFI interest rates: the interest rates that are applied by resident credit institutions and other MFIs,
excluding central banks and money market funds, to euro-denominated deposits and loans vis-à-vis
households and non-fi nancial corporations resident in the euro area.
MFI longer-term financial liabilities: deposits with an agreed maturity of over two years,
deposits redeemable at a period of notice of over three months, debt securities issued by euro area
MFIs with an original maturity of more than two years and the capital and reserves of the euro area
MFI sector.
MFI net external assets: the external assets of the euro area MFI sector (such as gold, foreign
currency banknotes and coins, securities issued by non-euro area residents and loans granted to
non-euro area residents) minus the external liabilities of the euro area MFI sector (such as non-euro
area residents’ deposits and repurchase agreements, as well as their holdings of money market fund
shares/units and debt securities issued by MFIs with a maturity of up to and including two years).
MFIs (monetary financial institutions): fi nancial institutions which together form the money-
issuing sector of the euro area. These include (i) the Eurosystem, (ii) resident credit institutions
(as defi ned in EU law), (iii) other fi nancial institutions whose business is to receive deposits
and/or close substitutes for deposits from entities other than MFIs and, for their own account
(at least in economic terms), to grant credit and/or invest in securities, as well as electronic money
institutions that are principally engaged in fi nancial intermediation in the form of issuing electronic
money, and (iv) money market funds, i.e. collective investment undertakings that invest in
short-term and low-risk instruments.
Minimum bid rate: the lower limit to the interest rates at which counterparties may submit bids in
the variable tenders.
Open market operation: a fi nancial market operation executed on the initiative of the central
bank. These operations include reverse transactions, outright transactions as well as the issuance of
fi xed-term deposits or debt certifi cates or foreign exchange swaps. The open market operations can
be liquidity providing or liquidity absorbing.
Other investment: an item in the b.o.p. and the i.i.p. that covers the fi nancial transactions/positions
with non-residents in trade credits, deposits and loans, and other accounts receivable and payable.
Portfolio investment: euro area residents’ net transactions and/or positions in securities issued
by non-residents of the euro area (“assets”) and non-residents’ net transactions and/or positions
in securities issued by euro area residents (“liabilities”). Included are equity securities and debt
securities (bonds and notes, and money market instruments). Transactions are recorded at the
effective price paid or received, less commissions and expenses. To be regarded as a portfolio asset,
ownership in an enterprise must be equivalent to less than 10% of the ordinary shares or voting
power.
Price stability: as defi ned by the Governing Council, a year-on-year increase in the HICP for the
euro area of below 2%. The Governing Council has also made it clear that, in the pursuit of price
stability, it aims to maintain infl ation rates below, but close to, 2% over the medium term.
Purchasing power parity (PPP): the rate at which one currency is converted into another so as
to equalise the purchasing power of the two currencies by eliminating the differences in the price
XIII

ECB
Monthly Bulletin
October 2012
levels prevailing in the countries concerned. In their simplest form, PPPs show the ratio of the
prices in national currency of the same good or service in different countries.
Reference value for M3 growth: the annual growth rate of M3 that is deemed to be compatible
with price stability over the medium term.
Reserve requirement: the requirement for institutions to hold minimum reserves with the central
bank over a maintenance period. Compliance with the requirement is determined on the basis of the
average of the daily balances in the reserve accounts over the maintenance period.
Reverse transaction: an operation whereby the NCB buys or sells assets under a repurchase
agreement or conducts credit operations against collateral.
Securitisation: a transaction or scheme whereby an asset or a pool of cash fl ow-producing assets,
often consisting of loans (mortgages, consumer loans, etc.), is transferred from an originator (usually
a credit institution) to a fi nancial vehicle corporation (FVC). The FVC effectively converts these
assets into marketable securities by issuing debt instruments with principal and interest serviced
through the cash fl ows produced by the asset pool.
Survey of Professional Forecasters (SPF): a quarterly survey that has been conducted by the
ECB since 1999 to collect macroeconomic forecasts on euro area infl ation, real GDP growth and
unemployment from a panel of experts affi liated to fi nancial and non-fi nancial organisations based
in the EU.
Unit labour costs: a measure of total labour costs per unit of output calculated for the euro area as
the ratio of total compensation per employee to labour productivity (defi ned as GDP (volume) per
person employed).
Variable rate tender: a tender procedure where the counterparties bid both the amount of money
they wish to transact with the central bank and the interest rate at which they wish to enter into the
transaction.
Volatility: the degree of fl uctuation in a given variable.
Write-down: a downward adjustment to the value of loans recorded in the balance sheets of MFIs
when it is recognised that the loans have become partly unrecoverable.
Write-off: the removal of the value of loans from the balance sheets of MFIs when the loans are
considered to be totally unrecoverable.
Yield curve: a graphical representation of the relationship between the interest rate or yield and the
residual maturity at a given point in time for suffi ciently homogenous debt securities with different
maturity dates. The slope of the yield curve can be measured as the difference between the interest
rates or yield at two selected maturities.
XIV