Monthly and Annual Rainfall Variability in Peninsular...
11
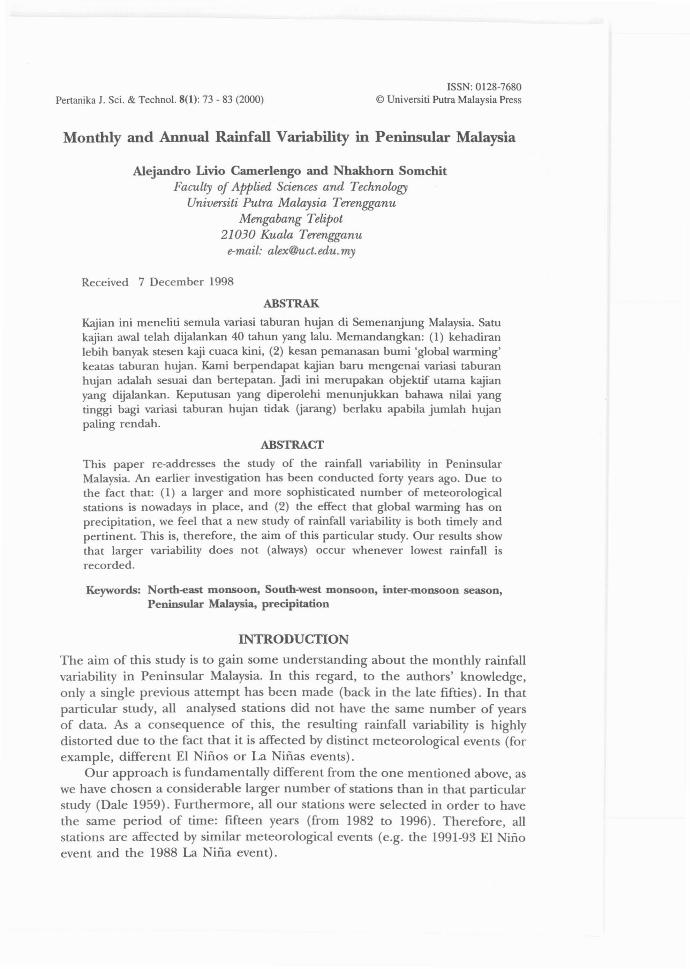
Pertanika 1. Sci. & Techno!' 8(1): 73 - 83 (2000) ISSN: 0128-7680 © Universiti Putra Malaysia Press Monthly and Annual Rainfall Variability in Peninsular Malaysia Alejandro Livio Camerlengo and Nhakhom Somchit Faculty of Applied Sciences and Technology Universiti Putra Malaysia Terengganu Mengabang Telipot 21030 Kuala Terengganu e-mail: [email protected] Received 7 December 1998 ABSTRAK Kajian ini meneliti semula variasi taburan hujan di Semenanjung Malaysia. Satu kajian awal telah dijalankan 40 tahun yang lalu. Memandangkan: (1) kehadiran lebih banyak stesen kaji cuaca kini, (2) kesan pemanasan bumi 'global warming' keatas taburan hujan. Kami berpendapat k,yian barn mengenai variasi taburan hujan adalah sesuai dan bertepatan. Jadi ini merupakan objektif utama kajian yang dijalankan. Keputusan yang diperolehi menunjukkan bahawa nilai yang tinggi bagi variasi taburan hujan tidak (jarang) berlaku apabila jumlah hujan paling rendah. ABSTRACT This paper re-addresses the study of the rainfall variability in Peninsular Malaysia. An earlier investigation has been conducted forty years ago. Due to the fact that: (1) a larger and more sophisticated number of meteorological stations is nowadays in place, and (2) the effect that global warming has on precipitation, we feel that a new study of rainfall variability is both timely and pertinent. This is, therefore, the aim of this particular study. Our results show that larger variability does not (always) occur whenever lowest rainfall is recorded. Keywords: North-east monsoon, South-west monsoon, inter-monsoon season, Peninsular Malaysia, precipitation INTRODUCTION The aim of this study is to gain some understanding about the monthly rainfall variability in Peninsular Malaysia. In this regard, to the authors' knowledge, only a single previous attempt has been made (back in the late fifties). In that particular study, all analysed stations did not have the same number of years of data. As a consequence of this, the resulting rainfall variability is highly distorted due to the fact that it is affected by distinct meteorological events (for example, different EI NiilOs or La Ninas events). Our approach is fundamentally different from the one mentioned above, as we have chosen a considerable larger number of stations than in that particular study (Dale 1959). Furthermore, all our stations were selected in order to have the same period of time: fifteen years (from 1982 to 1996). Therefore, all stations are affected by similar meteorological events (e.g. the 1991-93 EI Nino event and the 1988 La Nina event).
Transcript of Monthly and Annual Rainfall Variability in Peninsular...
Pertanika 1. Sci. & Techno!' 8(1): 73 - 83 (2000)ISSN: 0128-7680
© Universiti Putra Malaysia Press
Monthly and Annual Rainfall Variability in Peninsular Malaysia
Alejandro Livio Camerlengo and Nhakhom SomchitFaculty of Applied Sciences and Technology
Universiti Putra Malaysia TerengganuMengabang Telipot
21030 Kuala Terengganue-mail: [email protected]
Received 7 December 1998
ABSTRAK
Kajian ini meneliti semula variasi taburan hujan di Semenanjung Malaysia. Satukajian awal telah dijalankan 40 tahun yang lalu. Memandangkan: (1) kehadiranlebih banyak stesen kaji cuaca kini, (2) kesan pemanasan bumi 'global warming'keatas taburan hujan. Kami berpendapat k,yian barn mengenai variasi taburanhujan adalah sesuai dan bertepatan. Jadi ini merupakan objektif utama kajianyang dijalankan. Keputusan yang diperolehi menunjukkan bahawa nilai yangtinggi bagi variasi taburan hujan tidak (jarang) berlaku apabila jumlah hujanpaling rendah.
ABSTRACT
This paper re-addresses the study of the rainfall variability in PeninsularMalaysia. An earlier investigation has been conducted forty years ago. Due tothe fact that: (1) a larger and more sophisticated number of meteorologicalstations is nowadays in place, and (2) the effect that global warming has onprecipitation, we feel that a new study of rainfall variability is both timely andpertinent. This is, therefore, the aim of this particular study. Our results showthat larger variability does not (always) occur whenever lowest rainfall isrecorded.
Keywords: North-east monsoon, South-west monsoon, inter-monsoon season,Peninsular Malaysia, precipitation
INTRODUCTION
The aim of this study is to gain some understanding about the monthly rainfallvariability in Peninsular Malaysia. In this regard, to the authors' knowledge,only a single previous attempt has been made (back in the late fifties). In thatparticular study, all analysed stations did not have the same number of yearsof data. As a consequence of this, the resulting rainfall variability is highlydistorted due to the fact that it is affected by distinct meteorological events (forexample, different EI NiilOs or La Ninas events).
Our approach is fundamentally different from the one mentioned above, aswe have chosen a considerable larger number of stations than in that particularstudy (Dale 1959). Furthermore, all our stations were selected in order to havethe same period of time: fifteen years (from 1982 to 1996). Therefore, allstations are affected by similar meteorological events (e.g. the 1991-93 EI Ninoevent and the 1988 La Nina event).

Alejandro Livio Camerlengo and Nhakhorn Somchit
We strongly believe that our approach gives a far better and a more accurateresolution of the rainfall variability than previously attained. In particular, aconsiderable departure from earlier results is obtained.
DATAPrecipitation data of 94 stations were obtained from the "Monthly Summary ofMeteorological Observations" published by the Malaysian Meteorological Service(1982-96). The location as well as the name of each station is shown in Fig. 1and Table 1, respectively.
Singapore
South China Sea
Sumatra
REFERENCE TO CONTOURLINES
LEGEND
L __ 1900mI :. I 150 In
2-
3
~r-------,-----------:-------------------~------'oZ~
Straits of Malacca
5
6
4-
100 101 102 103 104Longitude (East)
Fig 1. Location of the stations analysed in this investigation
74 PertanikaJ. Sci. & Techno\. Vol. 8 No. 1,2000
Monthly and Annual Rainfall Variability in Peninsular Malaysia
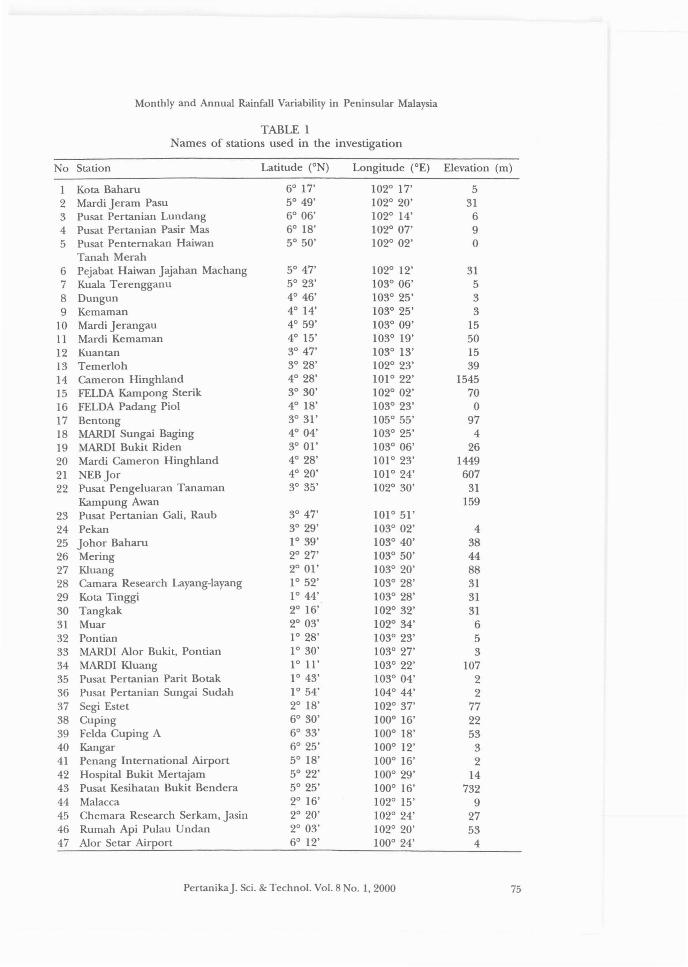
TABLE 1Names of stations used in the investigation
No Station Latitude (ON) Longitude (OE) Elevation (m)
1 Kota Baham 6° 17' 102° 17' 52 Mardi Jeram Pasu 5° 49' 102° 20' 313 Pusat Pertanian Lundang 6° 06' 102° 14' 64 Pusat Pertanian Pasir Mas 6° 18' 102° 07' 95 Pusat Penternakan Haiwan 5° 50' 102° 02' 0
Tanah Merah6 Pejabat Haiwan Jajahan Machang 5° 47' 102° 12' 317 Kuala Terengganu 5° 23' 103° 06' 58 Dungun 4° 46' 103° 25' 39 Kemaman 4° 14' 103° 25' 3
10 Mardi Jerangau 4° 59' 103° 09' 1511 Mardi Kemaman 4° 15' 103° 19' 5012 Kuantan 3° 47' 103° 13' 1513 Temerloh 3° 28' 102° 23' 3914 Cameron Hinghland 4° 28' 101° 22' 154515 FELDA Karnpong Sterik 3° 30' 102° 02' 7016 FELDA Padang Piol 4° 18' 103° 23' 017 Bentong 3° 31' 105° 55' 9718 MARDI Sungai Baging 4° 04' 103° 25' 419 MARDI Bukit Riden 3° 01' 103° 06' 2620 Mardi Cameron Hinghland 4° 28' 101° 23' 144921 NEBJor 4° 20' 101° 24' 60722 Pusat Pengeluaran Tanaman 3° 35' 102° 30' 31
Karnpung Awan 15923 Pusat Pertanian Cali, Raub 3° 47' 101° 51'24 Pekan 3° 29' 103° 02' 425 Johor Baham 1° 39' 103° 40' 3826 Mering 2° 27' 103° 50' 4427 Kluang 2° 01' 103° 20' 8828 Camara Research Layang-layang 1° 52' 103° 28' 3129 Kota Tinggi 1° 44' 103° 28' 3130 Tangkak 2° 16' 102° 32' 3131 Muar 2° 03' 102° 34' 632 Pontian 1° 28' 103° 23' 533 MARDI Alor Bukit, Pontian 1° 30' 103° 27' 334 MARDI Kluang 1° 11' 103° 22' 10735 Pusat Pertanian Parit Botak 1° 43' 103° 04' 236 Pusat Pertanian Sungai Sudah 1° 54' 104° 44' 237 Segi Estet 2° 18' 102° 37' 7738 Cuping 6° 30' 100° 16' 2239 Felda Cuping A 6° 33' 100° 18' 5340 Kangar 6° 25' 100° 12' 341 Penang International Airport 5° 18' 100° 16' 242 Hospital Bukit Mertajam 5° 22' 100° 29' 1443 Pusat Kesihatan Bukit Bendera 5° 25' 100° 16' 73244 Malacca 2° 16' 102° 15' 945 Chemara Research Serkam, Jasin 2° 20' 102° 24' 2746 Rumah Api Pulau Undan 2° 03' 102° 20' 5347 Alor Setar Airport 6° 12' 100° 24' 4
PertanikaJ. Sci. & Technol. Vol. 8 No. 1,2000 75
Alejandro Livio Camerlengo and Nhakhorn Somchit
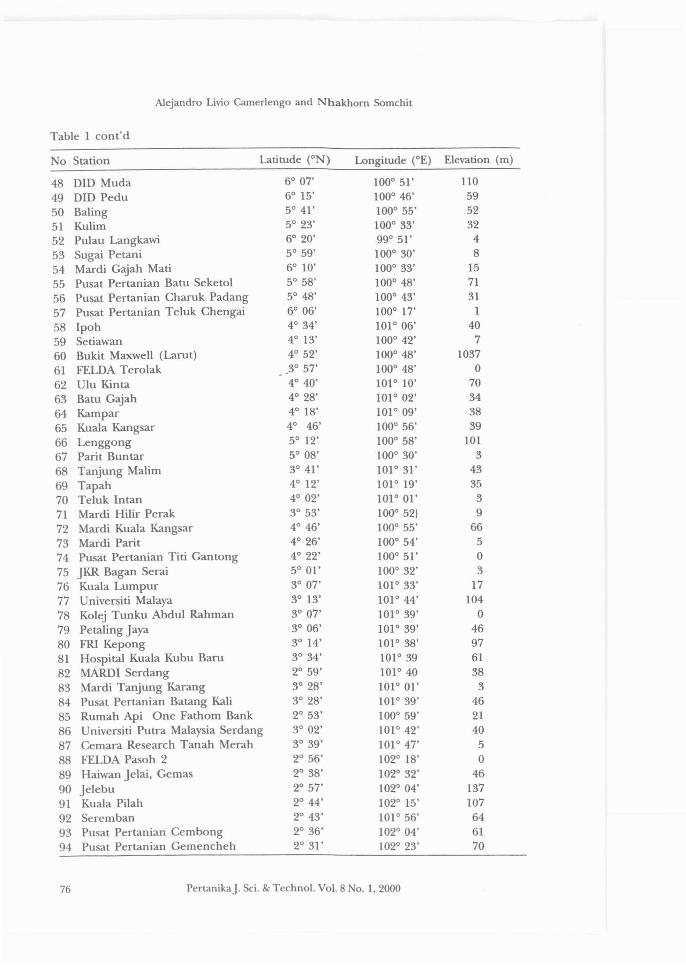
Table 1 cont'd
No Station Latitude (ON) Longitude (OE) Elevation (m)
48 DID Muda 6° 07' 100° 51' 110
49 DID Pedu 6° 15' 100° 46' 59
50 Baling 5° 41' 100° 55' 52
51 Kulim 5° 23' 100° 33' 32
52 Pulau Langkawi 6° 20' 99° 51' 4
53 Sugai Petani 5° 59' 100° 30' 8
54 Mardi Gajah Mati 6° 10' 100° 33' 15
55 Pusat Pertanian Batu Seketol 5° 58' 100° 48' 71
56 Pusat Pertanian Charuk Padang 5° 48' 100° 43' 31
57 Pusat Pertanian Teluk Chengai 6° 06' 100° 17' 1
58 Ipoh 4° 34' lOP 06' 40
59 Setiawan 4° 13' 100° 42' 7
60 Bukit Maxwell (Larut) 4° 52' 100° 4S' 1037
61 FELDA Terolak 3° 57' 100° 4S' 0
62 Ulu Kinta 4° 40' 101° 10' 70
63 Batu Gajah 4° 2S' 101° 02' 34
64 Kampar 4° IS' 101° 09' 3S
65 Kuala Kangsar 4° 46' 100° 56' 39
66 Lenggong 5° 12' 100° 5S' 101
67 Pant Buntar 5° 08' 100° 30' 3
68 Tanjung Malim 3° 41' 101° 31' 43
69 Tapah 4° 12' 101° 19' 35
70 Teluk Intan 4° 02' lOP 01' 3
71 Mardi Hilir Perak 3° 53' 100° 52} 9
72 Mardi Kuala Kangsar 4° 46' 100° 55' 66
73 Mardi Pant 4° 26' 100° 54' 5
74 Pusat Pertanian Titi Gantong 4° 22' 100° 51' 0
75 JKR Bagan Serai 5° 01' 100° 32' 3
76 Kuala Lumpur 3° 07' 101° 33' 17
77 Universiti Malaya 3° 13' 101° 44' 104
78 Kolej Tunku Abdul Rahman 3° 07' 101° 39' 079 Petaling Jaya 3° 06' 101° 39' 46
SO FRI Kepong 3° 14' 101° 3S' 97
81 Hospital Kuala Kubu Baru 3° 34' 101° 39 61
82 MARDI Serdang 2° 59' 101° 40 3S
83 Mardi Tanjung Karang 3° 2S' 101° 01' 3
84 Pusat Pertanian Batang Kali 3° 28' 101° 39' 4685 Rumah Api One Fathom Bank 2° 53' 100° 59' 21
86 Universiti Putra Malaysia Serdang 3° 02' 101° 42' 40
87 Cemara Research Tanah Merah 3° 39' 101° 47' 5
88 FELDA Pasoh 2 2° 56' 102° IS' 0
89 Haiwan Jelai, Gemas 2° 38' 102° 32' 46
90 Jelebu 2° 57' 102° 04' 137
91 Kuala Pilah 2° 44' 102° 15' 107
92 Seremban 2° 43' 101° 56' 64
93 Pusat Pertanian Cembong 2° 36' 102° 04' 6194 Pusat Pertanian Gemencheh 2° 31' 102° 23' 70
76 PertanikaJ. Sci. & Techno!. Vo!. 8 No. 1,2000
Monthly and Annual Rainfall Variability in Peninsular Malaysia
The coefficient of variability is defined as:
C. V. = (SD/~ ) 100,
where SD represents the monthly standard deviation; R, the monthly rainfallaverage and; the subindex i (ranging from 1 to 12), the particular month of theyear. For the sake of comparison with previous results we have chosen to use thesame coefficient of variability.
RESULTS AND DISCUSSION
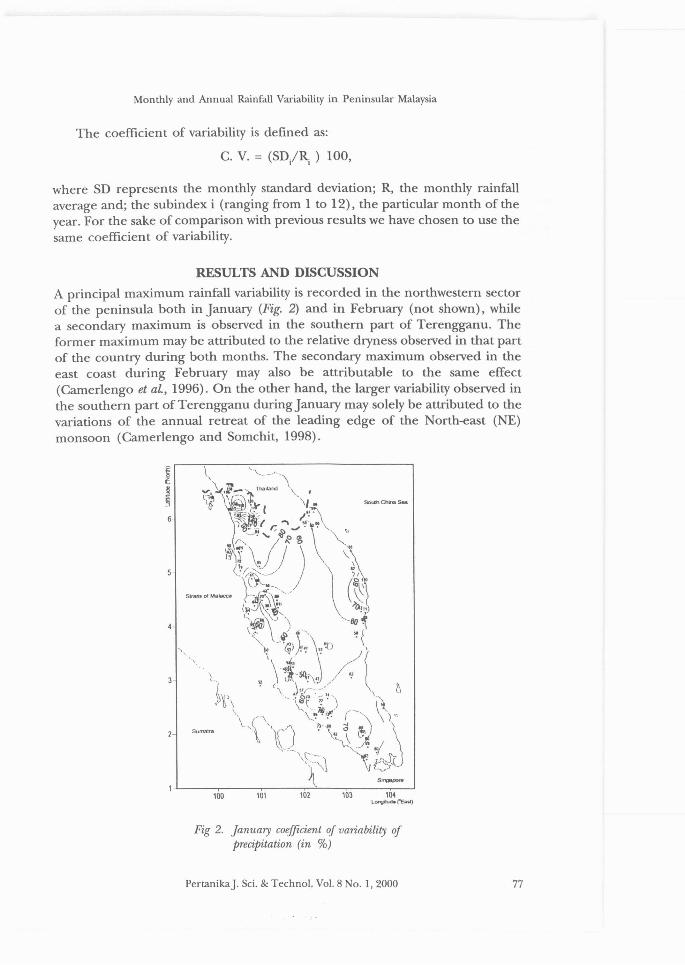
A principal maximum rainfall variability is recorded in the northwestern sectorof the peninsula both in January (Fig. 2) and in February (not shown), whilea secondary maximum is observed in the southern part of Terengganu. Theformer maximum may be attributed to the relative dryness observed in that partof the country during both months. The secondary maximum observed in theeast coast during February may also be attributable to the same effect(Camerlengo et aL, 1996). On the other hand, the larger variability observed inthe southern part of Terengganu during January may solely be attributed to thevariations of the annual retreat of the leading edge of the North-east (NE)monsoon (Camerlengo and Somchit, 1998).
100 101 102 103 104Lorvitucle("Eau)
Fig 2. January coefJicient of variability ofprecipitation (in %)
PertanikaJ. Sci. & Technol. Vol. 8 No.1, 2000 77
Alejandro Livio Camerlengo and Nhakhorn Somchit
Maximum variability, of a slightly lesser magnitude than the one observedin Terengganu, is observed in the third southern part of the peninsula. Thismay also be attributed to the variations of the yearly retreat of the NE monsoon.
Minimum variability is recorded at the windward side of the Titiwangsamountain range in January. However, a larger variation is recorded in this samearea during the following month. This is found in spite of the fact that theFebruary monthly rainfall is larger compared to the January one. It contradictsprevious results in the sense that the largest variability is observed wheneverlesser rainfall is recorded at Peninsular Malaysia's west coast (Dale, 1959).
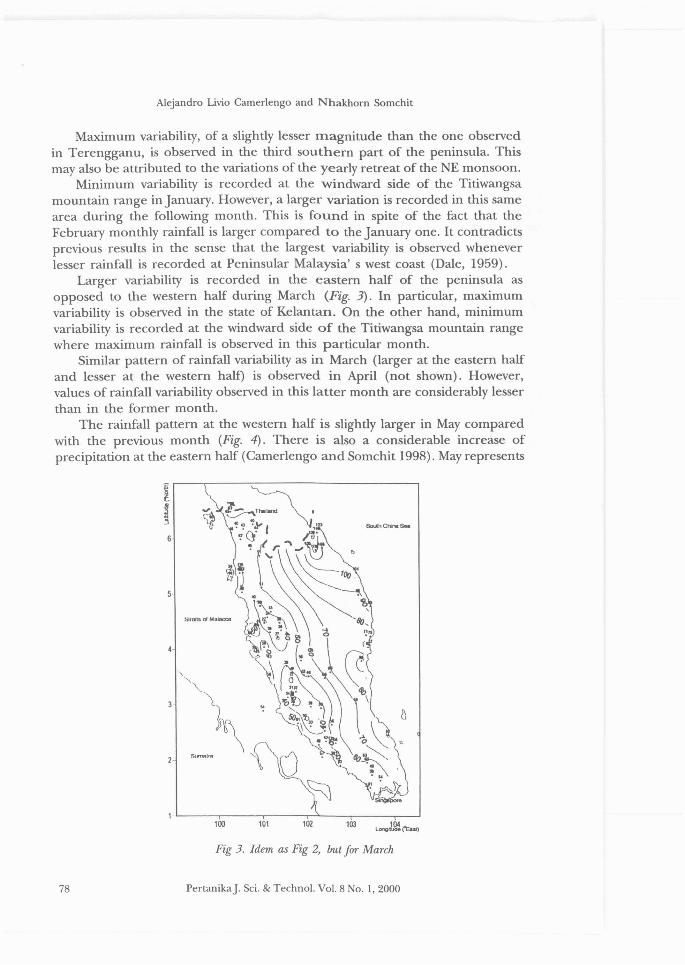
Larger variability is recorded in the eastern half of the peninsula asopposed to the western half during March (Fig. 3). In particular, maximumvariability is observed in the state of Kelantan. On the other hand, minimumvariability is recorded at the windward side of the Titiwangsa mountain rangewhere maximum rainfall is observed in this particular month.
Similar pattern of rainfall variability as in March (larger at the eastern halfand lesser at the western half) is observed in April (not shown). However,values of rainfall variability observed in this latter month are considerably lesserthan in the former month.
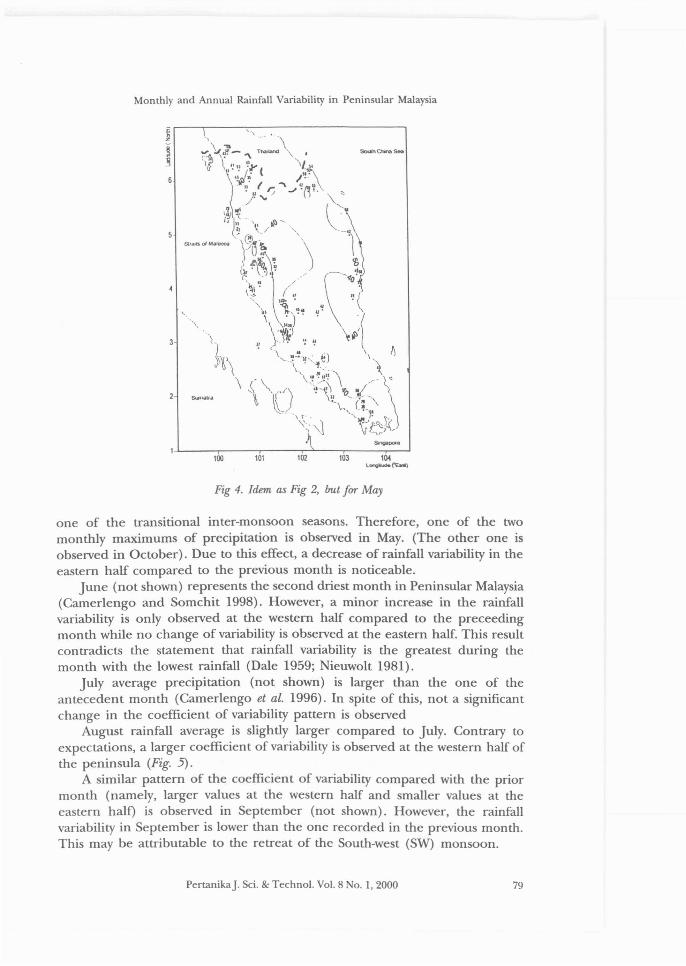
The rainfall pattern at the western half is slightly larger in May comparedwith the previous month (Fig. 4). There is also a considerable increase ofprecipitation at the eastern half (Camerlengo and Somchit 1998). May represents
Ii.'I
100 101 102 103 L~Ib")
78
Fig 3. Idem as Fig 2, but Jor March
PertanikaJ. Sci. & Techno!. Vo!. 8 No.1, 2000
Monthly and Annual Rainfall Variability in Peninsular Malaysia
100 101 102 103 104lOl"Qlluder'En)
Fig 4. Idem as Fig 2, but Jor May
one of the transitional inter-monsoon seasons. Therefore, one of the twomonthly maximums of precipitation is observed in May. (The other one isobserved in October). Due to this effect, a decrease of rainfall variability in theeastern half compared to the previous month is noticeable.
June (not shown) represents the second driest month in Peninsular Malaysia(Camerlengo and Somchit 1998). However, a minor increase in the rainfallvariability is only observed at the western half compared to the preceedingmonth while no change of variability is observed at the eastern half. This resultcontradicts the statement that rainfall variability is the greatest during themonth with the lowest rainfall (Dale 1959; Nieuwolt 1981).
July average precipitation (not shown) is larger than the one of theantecedent month (Camerlengo et at. 1996). In spite of this, not a significantchange in the coefficient of variability pattern is observed
August rainfall average is slightly larger compared to July. Contrary toexpectations, a larger coefficient of variability is observed at the western half ofthe peninsula (Fig. 5).
A similar pattern of the coefficient of variability compared with the priormonth (namely, larger values at the western half and smaller values at theeastern half) is observed in September (not shown). However, the rainfallvariability in September is lower than the one recorded in the previous month.This may be attributable to the retreat of the South-west (SW) monsoon.
PertanikaJ. Sci. & Techno\. Vol. 8 No.1, 2000 79

Alejandro Livio Camerlengo and Nhakhorn Somchit
6
3-
2-
100 101 102 103
Fig 5. Idem as Fig 2, but for August
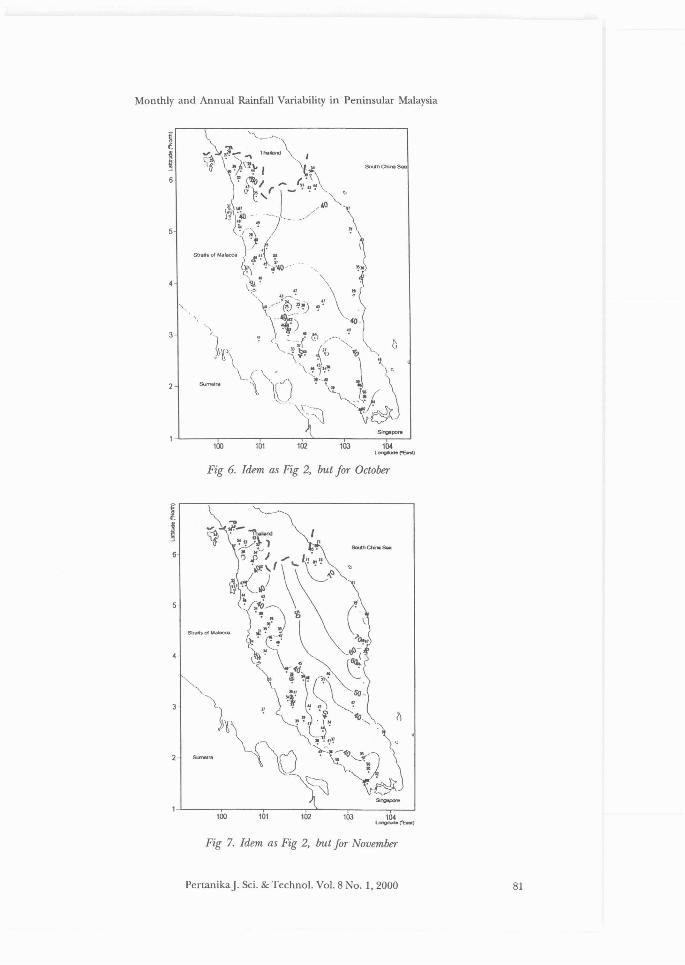
The retreat of the SW monsoon as well as the equatorward migration of theNE monsoon enhances the formation of a broad area of convergence, which inturn favours convection. October represents the other inter-monsoon transitionalperiod. This may help explain the fact that October has the lowest rainfallvariability all across the peninsula (Fig. 6).
There is a sharp contrast between our results at the eastern half of thepeninsula, for this particular month, from previous ones. We strongly believethat this is due to the fact that we are analyzing a larger number of stations forthe same period of time.
November represents the onset of the NE monsoon (Nasir and Camerlengo1997). Our results show a considerable larger variability (than previouslyrecorded) at the east coast (Fig. 7). This may be explained by the annualvariation of the equatorward migration of the NE monsoon.
Thirty percent of the annual precipitation in the states of Kelantan andTerengganu is recorded in November (Camerlengo et aL 1996). Larger variabilityis observed in these two states during November. Our results are in sharpcontradiction with previous ones. This is due to the fact that we are analysinga larger number of stations. We feel that our results represent a betterresolution of the November variability than earlier ones.
In spite of the fact that larger amounts of precipitation are recorded inDecember in the eastern half of the Peninsula compared with the western half,
80 PertanikaJ. Sci. & Techno!' Vo!' 8 No. 1,2000
Monthly and Annual Rainfall Variability in Peninsular Malaysia
100 101 102 103 104L~ro&;)
Fig 6. Idem as Fig 2, but JOT October
100 101 102 103 104Longi~("<l
Fig 7. Idem as Fig 2, but for November
PertanikaJ. Sci. & Techno!. Vol. 8 No. 1,2000 81

Alejandro Livio Camerlengo and Nhakhom Somchit
the coefficient of variability is strikingly similar all across the peninsula (Fig. 8).This represents a sharp departure from earlier results; a larger departure fromnormal values at the eastern half of the peninsular during December (Dale1959) has been observed.
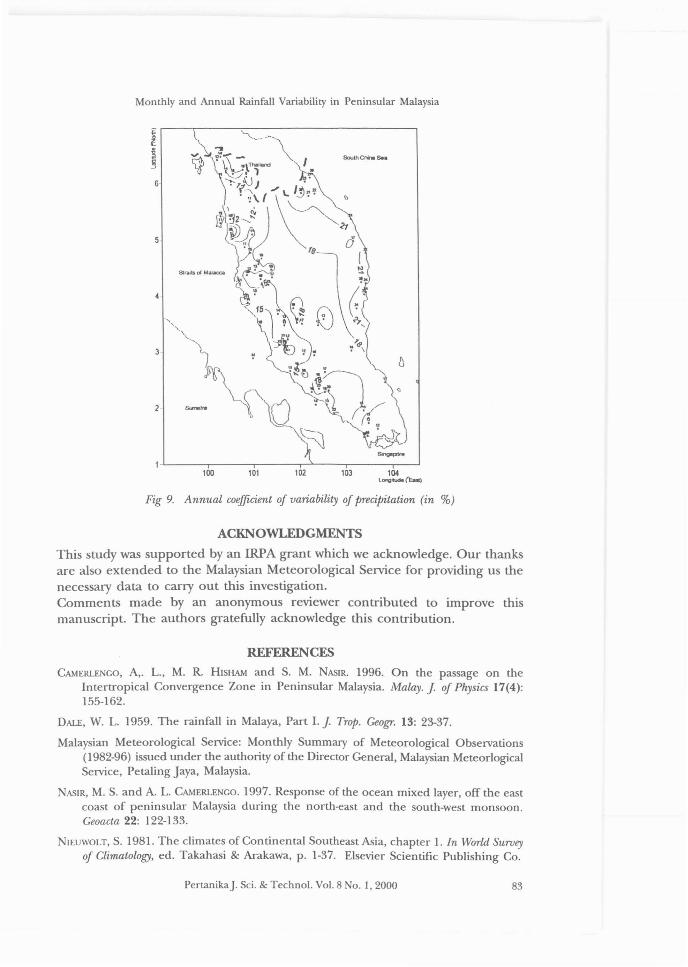
On an annual basis, larger values of rainfall are observed at the eastern half(Camerlengo et al. 1996). As a consequence of this, larger variability is observedin that particular area (Fig. 9). Lesser variability is observed in the northwesternsector of the peninsula where lesser rainfall is also observed annually.
CONCLUSION
Using a different and (we feel) a better methodology, previous results areconfirmed while others had to be disregarded. It is confirmed that theannual rainfall variability at the eastern half is larger than at the westernhalf. Our results show that the statement in the sense that larger variabilityoccurs whenever lowest rainfall is r.ecorded at the western side (of thepeninsula) is rather questionable at best. It certainly does not hold true forthe east coast where almost 30 % of the annual precipitation is recorded inNovember and (following our results) a large variability is attained for thatparticular month.
3-
2-
" ",
(1~\\
100 101 102 103 104Longitude ('East,
82
Fig 8. Idem as fig 2, but for December
PertanikaJ. Sci. & TechnoL Vol. 8 No. 1,2000
Monthly and Annual Rainfall Variability in Peninsular Malaysia
2
100 101 102 103 104Longitude(&.)
Fig 9. Annual coefficient of variability of precipitation (in %)
ACKNOWLEDGMENTS
This study was supported by an IRPA grant which we acknowledge. Our thanksare also extended to the Malaysian Meteorological Service for providing us thenecessary data to carry out this investigation.Comments made by an anonymous reviewer contributed to improve thismanuscript. The authors gratefully acknowledge this contribution.
REFERENCES
CAMERLENCO, A,. L., M. R. HISHAM and S. M. NASIR. 1996. On the passage on theIntertropical Convergence Zone in Peninsular Malaysia. Malay. J of Physics 17(4):155-162.
DALE, W. L. 1959. The rainfall in Malaya, Part 1. J Trop. Geogr. 13: 23-37.
Malaysian Meteorological Service: Monthly Summary of Meteorological Observations(1982-96) issued under the authority of the Director General, Malaysian MeteorlogicalService, Petaling Jaya, Malaysia.
NASIR, M. S. and A. L. CAMERLENCO. 1997. Response of the ocean mixed layer, off the eastcoast of peninsular Malaysia during the north-east and the south-west monsoon.Geoacla 22: 122-133.
NIEUWOLT, S. 1981. The climates of Continental Southeast Asia, chapter 1. In World Surveyof Climatology, ed. Takahasi & Arakawa, p. 1-37. Elsevier Scientific Publishing Co.
PertanikaJ. Sci. & Technol. Vol. 8 o. 1,2000 83