
Monthly Analysis of Teal Ring- Recovery Data Diana Cole, Takis Besbeas, and Byron Morgan.
12
Monthly Analysis of Teal Ring-Recovery Data Diana Cole, Takis Besbeas, and Byron Morgan
-
date post
21-Dec-2015 -
Category
Documents
-
view
220 -
download
0
Transcript of Monthly Analysis of Teal Ring- Recovery Data Diana Cole, Takis Besbeas, and Byron Morgan.

Monthly Analysis of Teal Ring-Recovery Data
Diana Cole, Takis Besbeas, and Byron Morgan

Introduction
• Interested in modelling survival of Teal (Anas Crecca)
• Ring-Recovery Data available• Standard analysis would be biased because
– Teal are born in April– Ringing Year starts in August– Ringed in November, December or January

Standard Model (Annual / Annual)
1 – first year survival probability (annual survival)
a – adult survival probability (annual survival)
– reporting probability
j
i No. ringed 1 2 3 4
1 132 10 2 0 0
2 23 2 1 0
3 426 29 18
4 447 38
ij
jip
aij
a
ij
)1(
)1(1
1
1

Simulation• Simulated data with 40 years of ringing and
recovery, 200 animals ringed each year 1 = 0.3
a = 0.5
= 0.2
• mb month animal born (in previous year)
• mr month animal ringed
• Parameters estimated using the standard yearly model. Simulation repeated 100 times.

Simulation Standard Model (Annual / Annual Model)
1 a
True Value 0.3 0.5 0.2
mb mr mean bias std mean bias std mean bias std
13 (Aug) 1 (Aug) 0.30 0.00 0.011 0.50 0.00 0.017 0.20 0.00 0.004
12 (Jul) 1 (Aug) 0.31 0.01 0.012 0.50 0.00 0.018 0.20 0.00 0.005
9 (Apr) 5 (Dec) 0.53 0.23 0.012 0.50 0.00 0.014 0.20 0.00 0.004

Annual / Monthly Model
1,m – 1st y. monthly survival probability 1,m12 = 1
a,m – adult monthly survival probability a,m12 = a
– reporting probability
model assumes ringed in December
j
i No. ringed 1 2 3 4
1 132 10 2 0 0
2 23 2 1 0
3 426 29 18
4 447 38
ij
jip
ma
ij
mam
mam
ij
)1(
)1(12
,
4)1(12
,
4
,1
4,
4,1

Simulation mb = 9 (Apr), mr = 5 (Dec)
1 a
Model
0.3 0.5 0.2
mean bias std mean bias std mean bias std
annual / annual 0.53 0.23 0.012 0.50 0.00 0.014 0.20 0.00 0.004
annual / monthly 0.30 0.00 0.017 0.50 0.00 0.015 0.20 0.00 0.004

Simulation mb = 9 , mr = 4 (52%), 5 (31%), 6 (17%)
1 a
Model
0.3 0.5 0.2
mean bias std mean bias std mean bias std
annual / annual 0.52 0.22 0.029 0.50 0.00 0.027 0.20 0.00 0.009
annual / monthly 0.28 0.02 0.055 0.50 0.00 0.028 0.20 0.00 0.009

Monthly / Monthly Model
Bird i, ringed in year yr, recovered in year yc, born in month
mb = 9, ringed in month mr, recovered in month mc has probability
bcrcmammyy
mamm
m
bcrcmamm
mamm
m
bcrcmmm
m
i
mm yy
mm yy
mm yy
P
bcrcrb
bcrb
rc
and if)1(
and if)1(
and if)1(
,)(12
,,1
,,,1
,1,1
Index (i) Ringyr (yr) Ringmo (mr) Recyr (yc) Recmo (mc)
1 1959 4 1960 6
2 1959 4 1959 4
3 1959 4 1964 5
4 1959 4 1959 4

Simulation mb = 9 , mr = 4 (50%), 5 (23%), 6 (17%)
1 a
Model
0.3 0.5 0.2
mean bias std mean bias std mean bias std
annual / annual 0.52 0.22 0.029 0.50 0.00 0.027 0.20 0.00 0.009
annual / monthly 0.28 0.02 0.055 0.50 0.00 0.028 0.20 0.00 0.009
monthly / monthly 0.30 0.00 0.035 0.50 0.00 0.025 0.20 0.00 0.009
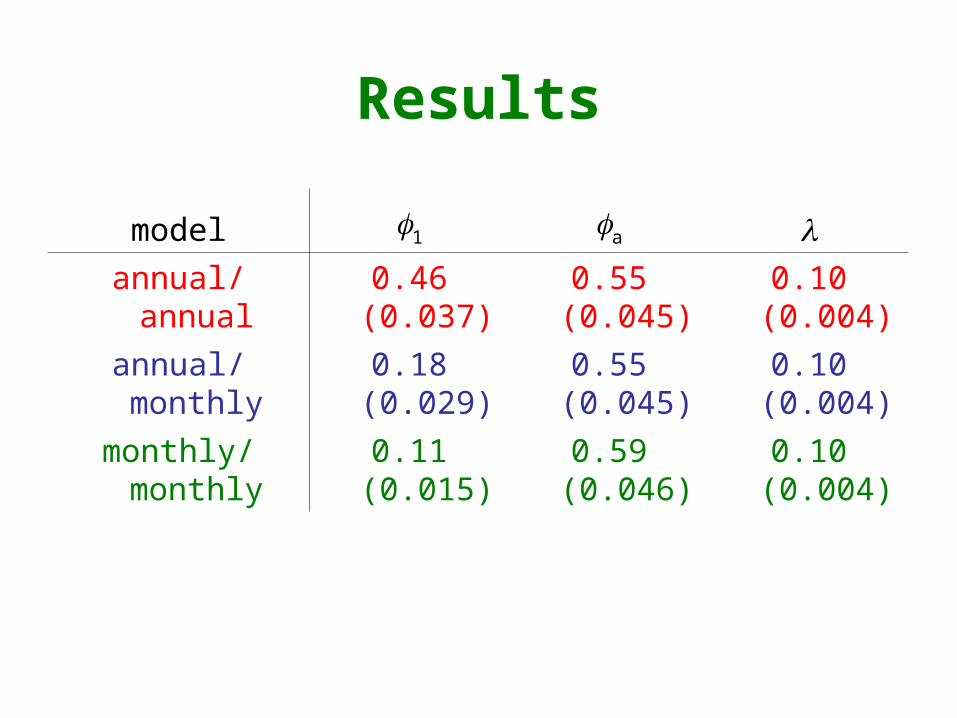
Results
model 1 a
annual/annual 0.46 (0.037) 0.55 (0.045) 0.10 (0.004)
annual/monthly 0.18 (0.029) 0.55 (0.045) 0.10 (0.004)
monthly/monthly 0.11 (0.015) 0.59 (0.046) 0.10 (0.004)

Conclusion and Further Work
• If birds are not ringed soon after birth and / or the ringing year does not start when the birds are ringed, there will be bias in estimating first year survival.
• A monthly structure will remove this bias• Survival does not have to be the same each month –
e.g. lower survival in winter• Teal data also include birds ringed as adults. The sex of
the bird is known. Most of the returns were hunted (2% not hunted).
• Also census data on Teal. Plan to include this as part of an integrated statistical analysis.