Monte Carlo estimation of the rates of lightning strikes on power lines
10
Electric Power Systems Research 49 (1999) 201 – 210 Monte Carlo estimation of the rates of lightning strikes on power lines Roger Holt, Tam T. Nguyen * Energy Systems Centre, Department of Electrical and Electronic Engineering, The Uni6ersity of Western Australia, Nedlands, Perth 6907, Australia Received 2 May 1998; received in revised form 27 July 1998; accepted 9 September 1998 Abstract This paper reports the development of a general method for estimating the rates of lightning strikes on transmission lines using Monte Carlo simulation. Effects of towers, cross-arms, non-level ground, conductor sags and nearby structures are directly represented in the 3-dimension electrogeometric model (EGM). The method developed is a general one that is applicable to any transmission line configuration and is independent of the EGM used. Tedious analytical derivation of more than 100 equations for each configuration as required by analytical methods is avoided altogether. The formulation and a flow chart are detailed in the paper. The shortest distances from the lightning leader tip to individual structures that may be struck are evaluated and then compared with striking distances. The outcome of the comparison identifies the structure which will be struck in each simulation. The exposure area adopted in the simulation is determined on the basis of the transmission line route length and the maximum possible striking distance to ensure that the simulation results in a maximum possible number of strikes on the overhead line. Strokes outside the exposure area will always miss the transmission line and, therefore, have no effects on the results. The method proposed and its software implementation are verified on the basis of results from analytical methods of earlier work, and from field data. © 1999 Elsevier Science S.A. All rights reserved. Keywords: Monte Carlo; Lightning; Shielding failures; Overhead lines; Electrogeometric model 1. Introduction Estimations of the rates of lightning strikes on trans- mission lines using the electrogeometric model [1] have been an area of active research for some time [2–12]. Early publications [1,3,6] concentrated on estima- tions using simplified transmission line configurations where shielded horizontal conductors above level ground were assumed, and the effects of towers and nearby structures were discounted. These simplifica- tions led to an analytical method of estimation. More recently, the analytical method has been extended to include three-dimension electrogeometric model analy- sis to take account of effects of transmission line towers and conductor sags [12]. Each tower and line configura- tion requires detailed geometrical analysis that leads to a set of 168 equations. The analysis has been carried out for three typical tower configurations [12]. The equations are for a system comprising one tower and two half spans on level ground. The drawback of the approach is that, for every new configuration, a de- tailed geometrical analysis needs to be carried out to give another set of 168 equations to be implemented in software for evaluation. Another approach which avoids a tedious geometri- cal analysis in each case is that based on Monte Carlo simulation. Research on the application of the Monte Carlo method for estimating transmission line lightning per- formance was first reported in reference [2]. Starting from this research, the Monte Carlo method has been refined and extended in further work [4] to represent variations in ground profile, trees and conductor sags. However, the analysis reported has been confined to the 2-dimension case only where the effects of towers and cross-arms were discounted in the estimations. Only a passing reference to the use of 3-dimension analysis to * Corresponding author. Tel.: +61-8-3802559; fax: +61-8- 3803747; e-mail: [email protected]. 0378-7796/99/$ - see front matter © 1999 Elsevier Science S.A. All rights reserved. PII:S0378-7796(98)00128-X
-
Upload
roger-holt -
Category
Documents
-
view
215 -
download
0
Transcript of Monte Carlo estimation of the rates of lightning strikes on power lines
Electric Power Systems Research 49 (1999) 201–210
Monte Carlo estimation of the rates of lightning strikes on powerlines
Roger Holt, Tam T. Nguyen *Energy Systems Centre, Department of Electrical and Electronic Engineering, The Uni6ersity of Western Australia, Nedlands,
Perth 6907, Australia
Received 2 May 1998; received in revised form 27 July 1998; accepted 9 September 1998
Abstract
This paper reports the development of a general method for estimating the rates of lightning strikes on transmission lines usingMonte Carlo simulation. Effects of towers, cross-arms, non-level ground, conductor sags and nearby structures are directlyrepresented in the 3-dimension electrogeometric model (EGM). The method developed is a general one that is applicable to anytransmission line configuration and is independent of the EGM used. Tedious analytical derivation of more than 100 equationsfor each configuration as required by analytical methods is avoided altogether. The formulation and a flow chart are detailed inthe paper. The shortest distances from the lightning leader tip to individual structures that may be struck are evaluated and thencompared with striking distances. The outcome of the comparison identifies the structure which will be struck in each simulation.The exposure area adopted in the simulation is determined on the basis of the transmission line route length and the maximumpossible striking distance to ensure that the simulation results in a maximum possible number of strikes on the overhead line.Strokes outside the exposure area will always miss the transmission line and, therefore, have no effects on the results. The methodproposed and its software implementation are verified on the basis of results from analytical methods of earlier work, and fromfield data. © 1999 Elsevier Science S.A. All rights reserved.
Keywords: Monte Carlo; Lightning; Shielding failures; Overhead lines; Electrogeometric model
1. Introduction
Estimations of the rates of lightning strikes on trans-mission lines using the electrogeometric model [1] havebeen an area of active research for some time [2–12].
Early publications [1,3,6] concentrated on estima-tions using simplified transmission line configurationswhere shielded horizontal conductors above levelground were assumed, and the effects of towers andnearby structures were discounted. These simplifica-tions led to an analytical method of estimation. Morerecently, the analytical method has been extended toinclude three-dimension electrogeometric model analy-sis to take account of effects of transmission line towersand conductor sags [12]. Each tower and line configura-tion requires detailed geometrical analysis that leads toa set of 168 equations. The analysis has been carried
out for three typical tower configurations [12]. Theequations are for a system comprising one tower andtwo half spans on level ground. The drawback of theapproach is that, for every new configuration, a de-tailed geometrical analysis needs to be carried out togive another set of 168 equations to be implemented insoftware for evaluation.
Another approach which avoids a tedious geometri-cal analysis in each case is that based on Monte Carlosimulation.
Research on the application of the Monte Carlomethod for estimating transmission line lightning per-formance was first reported in reference [2]. Startingfrom this research, the Monte Carlo method has beenrefined and extended in further work [4] to representvariations in ground profile, trees and conductor sags.However, the analysis reported has been confined to the2-dimension case only where the effects of towers andcross-arms were discounted in the estimations. Only apassing reference to the use of 3-dimension analysis to
* Corresponding author. Tel.: +61-8-3802559; fax: +61-8-3803747; e-mail: [email protected].
0378-7796/99/$ - see front matter © 1999 Elsevier Science S.A. All rights reserved.PII: S 0 3 7 8 -7796 (98 )00128 -X
R. Holt, T.T. Nguyen / Electric Power Systems Research 49 (1999) 201–210202
account for the shielding effects of towers and cross-arms has been made in the open literature [5]. Thedetail of applying the Monte Carlo method in threedimensions for estimating transmission line lightningperformance has not been given in the open literature.
The objective of the present paper is to report thedevelopment of a general method of analysis for the3-dimension case using Monte Carlo simulation.Availability of low-cost computer systems with high-speed processing capability makes Monte Carlo simula-tion a practical method for routine transmission linelightning performance estimation.
The method developed in the paper together with itssoftware implementation is validated using results fromfield data [3,13,14] and also those from the analyticalmethod reported in previous published work [8,11,12].
2. Electrogeometric model
The electrogeometric model is empirical. It is summa-rized in the following in relation to the assumptions onthe path of the lightning leader tip and the strikingdistance [10].
2.1. Path of the lightning leader
The path of the lightning leader is independent ofany structure until the shortest distance between thelightning leader tip and a grounded structure, or theground, is equal to the striking distance associated withthat structure, or ground. When this occurs, the light-ning leader follows a path that leads to that structure.In the cases where there are more than one groundedstructure, the lightning strikes the first structure thatcomes within the striking distance of the lightningleader tip. The lightning leader can only strike onestructure.
2.2. Striking distance
The striking distance associated with a groundedstructure depends on the form of the structure and themagnitude of the stroke current. The general equationfor the striking distance, Sm, is given by [10,12]:
Sm=Km f(I) (1)
In Eq. (1), Km is a scaling coefficient which is depen-dent on the nature of the structure. Reference [12] givesrepresentative values of Km for conductors, towers andthe ground. The function f(I) is a function of the strokecurrent magnitude.
Function f(I) has been determined empirically. Dif-ferent forms of f(I) have been proposed. Recently anIEEE working group [10] recommended the followingfunction:
f (I)=A Ib (2)
Typical ranges of value for A and b were also givenby the IEEE working group.
The lightning stroke current magnitude is a non-de-terministic variable that is generally expressed in theform of a probability distribution function. Differentforms of the probability distribution function have beenproposed in the open literature [5,6,8,10].
3. Monte Carlo method
3.1. Principle
The factors that determine whether a lightning strokewill strike a transmission line are the line configuration,the ground profile, nearby objects or structures, theposition of the lightning leader tip and the magnitudeof the stroke current.
The parameters relating to the line configuration, theground profile and nearby structures are deterministicones. However, the parameters of a lightning strokeexpressed in terms of its leader tip position and thestroke current magnitude are random or non-determin-istic ones.
In Monte Carlo simulation, analysis is carried out fora large number of lightning strokes the parameters ofwhich are selected on the basis of their probabilitydistribution functions.
For each lightning stroke, analysis is carried outusing the electrogeometric model to determine whichobject that the lightning stroke will strike. The ground,conductors, towers or nearby structures are all objectswhich may be struck and are considered in the analysis.
If Nt is the total number of simulations in a period tand A is the area over which the simulation is carriedout, then the ground flash density, gs, is:
gs=Nt
A ·t(3)
If Nc is the number of shield failures which are strikesto phase conductors, and l the length of the overheadline, then the shield failure rate, Frc, is:
Frc=100 Nc
l·t(4)
The unit for Frc in Eq. (4) is expressed in terms ofshield failures per 100 km per year. The result given inEq. (4) is for the ground flash density in Eq. (3). If theground flash density gs is 1 strike/km2/year, then thenormalised failure rate, Fc, is, from Eq. (3) and Eq. (4):
Fc=100Nc ANt l
(5)

R. Holt, T.T. Nguyen / Electric Power Systems Research 49 (1999) 201–210 203
Equations for the strike rates for towers andnearby objects can also be derived using proceduressimilar to that given in Eqs. (3)–(5).
3.2. Formulation
A co-ordinate system (x, y, z) is first nominated.For convenience, the x–y plane is chosen to coincidewith the level earth plane and the z-axis is perpendic-ular to it as shown in Fig. 1. The co-ordinate systemis used to define the positions of the overhead line,natural shields, lightning leader tip and the groundprofile.
The Monte Carlo method is independent of theEGM and lightning current probability distributionfunction. The user may select any of the EGMs andlightning current probability distribution functionsthat are available in published work [7,9,10,12].
Based on a uniform probability distribution, thex–y co-ordinates of the lightning leader tip are ran-domly selected from the exposure area A. The expo-sure area A is determined on the basis of thetransmission line route and the maximum value of thestriking distance, Smax. Striking distances are calcu-lated using the selected EGM. The maximum strikingdistance is found using the maximum value of thestroke current in the lightning distribution functionand the individual elements of the overhead line. Se-lection of an exposure area in this manner ensuresthat the simulation process results in a maximum pos-
Fig. 2. Exposure area in Monte Carlo simulation.
sible number of strikes on the overhead line. Strokesoutside this area will always miss the transmissionline and therefore have no effects on the results. Asan example, an exposure area used in the simulationis given in Fig. 2.
In addition to a set of random (x, y) co-ordinatesfor the leader tip with uniform probability distribu-tion, a random value for the corresponding lightningstroke current magnitude, In, is generated on the basisof its probability distribution function for the n th sim-ulation. This sequence of generating random co-ordi-nates and stroke current magnitude is valid since theirprobability distribution functions are independent ofeach other. It then remains to define the z-co-ordi-nate of the lightning leader tip for use in the analysis.
A number of evaluations will be executed. Aftereach evaluation, the value of z is revised until a sin-gle object is struck. The initial value of z is arbitrarybut good results have been obtained by setting it tothe sum of the maximum striking distance, Smax, andthe height of the highest structure.
The striking distance for each object is calculatedusing the EGM with the appropriate coefficient Km inEq. (1) for the object under consideration and therandomly-generated current magnitude. The strikingdistance for the m th object is denoted by Sm.
With the co-ordinates of the lightning leader tipdefined, the shortest distances from it to individualobjects are calculated.
In Appendix A are summarized the expressions forshortest distances from a point in space to elementswith commonly-encountered geometries: linear seg-ments; planes; and the tops of towers or poles. Con-ductor sags are represented by sub-dividing theconductor into a finite number of linear conductorsegments.
The shortest distance from the lightning leader tipto the m th object is denoted by dm. In Fig. 1 areshown the shortest distances from the lightning leader
Fig. 1. Striking distances and distances from the leader tip to individ-ual objects.
R. Holt, T.T. Nguyen / Electric Power Systems Research 49 (1999) 201–210204
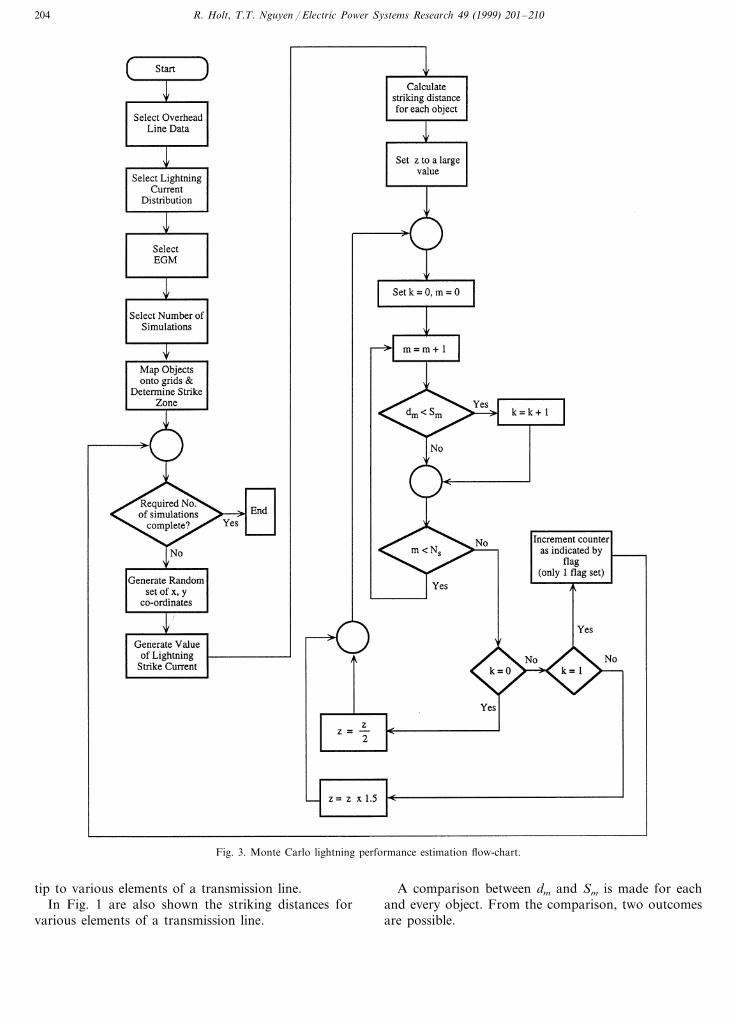
Fig. 3. Monte Carlo lightning performance estimation flow-chart.
tip to various elements of a transmission line.In Fig. 1 are also shown the striking distances for
various elements of a transmission line.
A comparison between dm and Sm is made for eachand every object. From the comparison, two outcomesare possible.

R. Holt, T.T. Nguyen / Electric Power Systems Research 49 (1999) 201–210 205
Table 1Shield failure rates of 275 kV and 400 kV lines, correlation betweensimulation results and field data
Line (kV) Shield failure rates
SimulationField data
Failure/100 km/year Failure/100 km/year
0.45275 0.440.51 0.55400
4. Validation studies
4.1. Correlation with field data
The field data used in the validation study is fromreference [13]. A validation study was carried out toensure that the Monte Carlo method would giverealistic results.
An outage rate of 0.36 outage/100 km/year hasbeen observed for 275 kV lines in the UnitedKingdom. For 400 kV lines, a higher outage rate of0.41 outage/100 km/year has been observed. Theoutage rates due to lightning are for all of the 275kV and 400 kV transmission lines which have severaltower configurations and designs. Footing resistance,insulation strength, the magnitude of the strikecurrent and secondary strikes are some of the factorsthat determine if a shield failure will lead to anoutage.
Brown and Whitehead published data collected inthe Pathfinder project [3] on shield failures and lineoutages. Using the data it can be shown that about80% of shielding failures lead to line outages. On thisbasis, the shield failure rates are derived from thefield data in reference [13] and given in Table 1. Theyare about 1.25 times greater than the observed lineoutage rates.
The results from simulation are compared with thefield data in Table 1. Very close correlation isachieved. In the simulation, typical line configurations[15], tower heights and span lengths were used. Theground flash density is 2 strikes/km2/year [14].
The EGM used in the simulation is that given inEq. (2) with A=6.4 and b=0.65 [10]. Theprobability distribution function for stroke current ofmagnitude I in kA is given in [11]:
P (I)=1
1+� I
IMed
�2.6 (8)
In Eq. (8), the median current, IMed, is 31 kA.The EGM in Eq. (2) and the probability
distribution function in Eq. (8) are used throughoutin the analysis in this paper.
4.2. Correlation with results from analytical method
The Monte Carlo method was tested against anaccepted analytical method developed by Mousa andSrivastava [12]. Numerous tests were carried out. Arepresentative case is reported here.
In Fig. 4 is shown a transmission line which was usedfor the test. The results of the analytical and MonteCarlo estimates are compared in Fig. 5. Pole and
3.2.1. Case 1
dm\Sm m=1, 2,......, Ns (6)
In inequality 6, Ns is the total number of objects. Inthis case, a strike will not occur and further evaluationshave to be carried out. This situation occurs when theleader tip is too far from the objects and for the nextevaluation z is halved.
3.2.2. Case 2
dm5Sm for one or more objects (7)
In this case, further checks are carried out as one ormore strikes have occurred. If only one object satisfiesinequality 7 for the n th simulation, the strike counterfor the object which satisfies inequality 7 is incrementedby 1 and a new set of random parameters are generatedfor the next simulation.
If two or more objects satisfy inequality 7, it meansthat two or more objects could be struck as z is toolow. The z-coordinate of the leader tip is then increasedby 50%. A new set of shortest distances from the leadertip to individual objects is calculated and the compari-son between the shortest distances and striking dis-tances is repeated until only one object is struck.
At the completion of the simulation process thecontents of the strike counters for individual objects aretransferred into an output module for presentation in agraphical format.
The simulation sequence is summarized in the flow-chart of Fig. 3.
Fig. 4. Configuration for the validation study.

R. Holt, T.T. Nguyen / Electric Power Systems Research 49 (1999) 201–210206
conductor heights were varied while all other parame-ters of the transmission line were held constant. Aground flash density of 1.0 strike/km2/year is used inthe estimations.
The accuracy of the Monte Carlo method increaseswith the number of simulations used. Increasing thenumber of simulations also increases the computingtime. The effect of increasing the number of simula-tions is shown in Fig. 5 where one estimate was madeusing 10×103 simulations and another using 50×103
simulations.Estimations based on 50×103 simulations compare
closely with the analytical results. Results producedby using 10×103 simulations give trends but are notsufficiently accurate for practical purposes.
The computing time required of 50×103 simula-tions for each line configuration is about 2 min on a200 MHz Pentium PC.
5. Representative studies
The transmission line configuration of Fig. 6 andthe ground flash density of 1.0 strike/km2/year areused in the following studies. The method allows esti-mates of the shield failure rate, line strike rate, aver-age strike current and pole strike rates. The user canselect any combination of these results. The studiespresented in this paper are typical of those that canbe carried out using the Monte Carlo method.
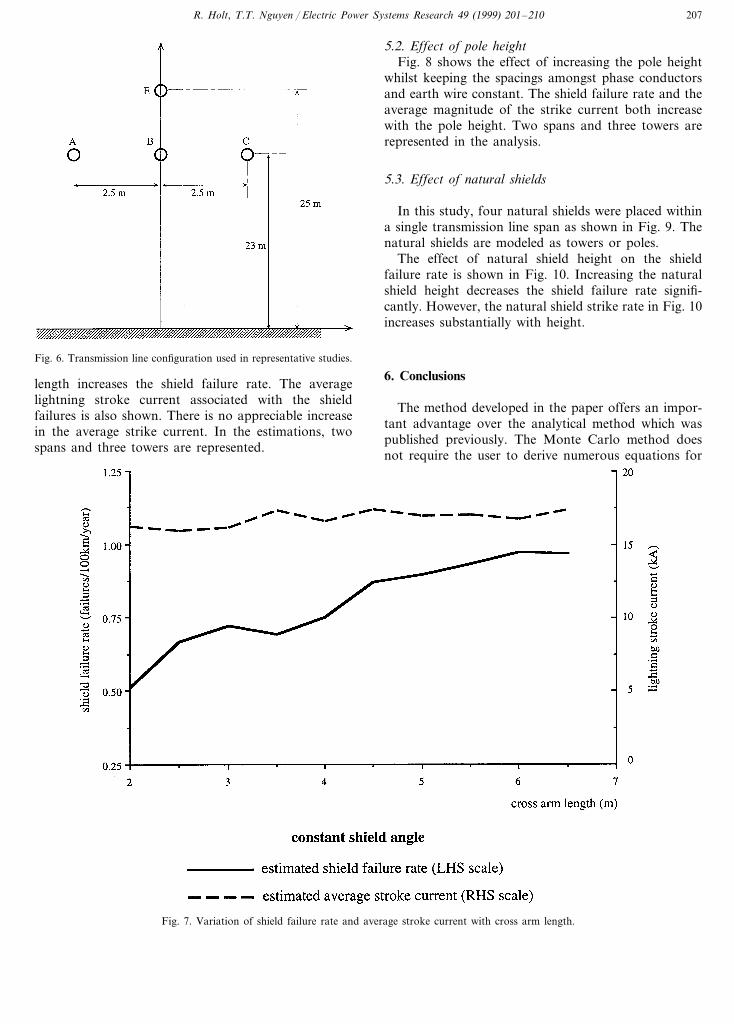
5.1. Effect of cross-arm length
In Fig. 7 is shown the effect of increasing thecross-arm length on the shield failure rate. In theestimation, the shielding angle is kept constant at 45°by raising the shield conductor whilst the height ofthe cross-arms is kept constant. Increasing cross-arm
Fig. 5. Comparison of methods.
R. Holt, T.T. Nguyen / Electric Power Systems Research 49 (1999) 201–210 207
Fig. 6. Transmission line configuration used in representative studies.
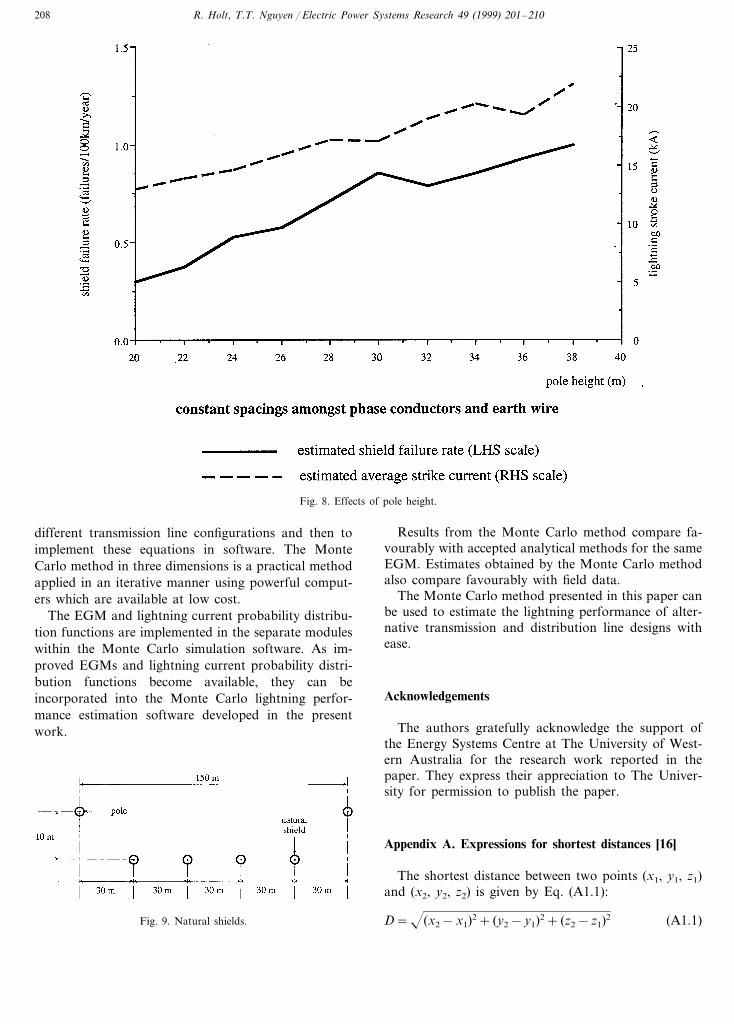
5.2. Effect of pole heightFig. 8 shows the effect of increasing the pole height
whilst keeping the spacings amongst phase conductorsand earth wire constant. The shield failure rate and theaverage magnitude of the strike current both increasewith the pole height. Two spans and three towers arerepresented in the analysis.
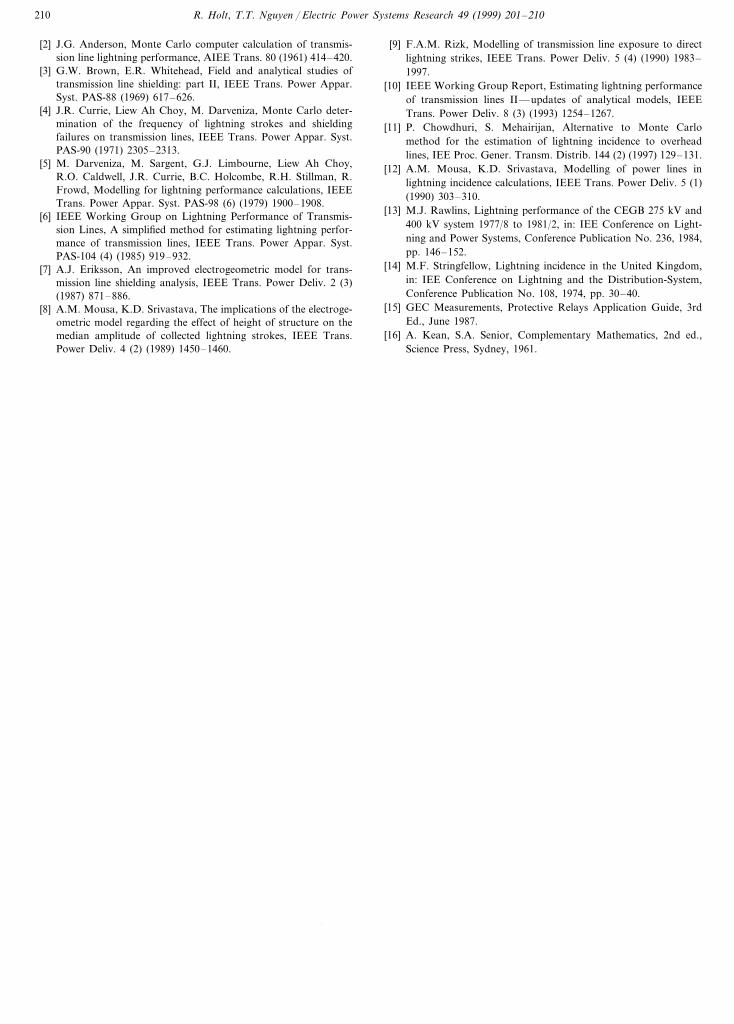
5.3. Effect of natural shields
In this study, four natural shields were placed withina single transmission line span as shown in Fig. 9. Thenatural shields are modeled as towers or poles.
The effect of natural shield height on the shieldfailure rate is shown in Fig. 10. Increasing the naturalshield height decreases the shield failure rate signifi-cantly. However, the natural shield strike rate in Fig. 10increases substantially with height.
6. Conclusions
The method developed in the paper offers an impor-tant advantage over the analytical method which waspublished previously. The Monte Carlo method doesnot require the user to derive numerous equations for
length increases the shield failure rate. The averagelightning stroke current associated with the shieldfailures is also shown. There is no appreciable increasein the average strike current. In the estimations, twospans and three towers are represented.
Fig. 7. Variation of shield failure rate and average stroke current with cross arm length.
R. Holt, T.T. Nguyen / Electric Power Systems Research 49 (1999) 201–210208
Fig. 8. Effects of pole height.
different transmission line configurations and then toimplement these equations in software. The MonteCarlo method in three dimensions is a practical methodapplied in an iterative manner using powerful comput-ers which are available at low cost.
The EGM and lightning current probability distribu-tion functions are implemented in the separate moduleswithin the Monte Carlo simulation software. As im-proved EGMs and lightning current probability distri-bution functions become available, they can beincorporated into the Monte Carlo lightning perfor-mance estimation software developed in the presentwork.
Results from the Monte Carlo method compare fa-vourably with accepted analytical methods for the sameEGM. Estimates obtained by the Monte Carlo methodalso compare favourably with field data.
The Monte Carlo method presented in this paper canbe used to estimate the lightning performance of alter-native transmission and distribution line designs withease.
Acknowledgements
The authors gratefully acknowledge the support ofthe Energy Systems Centre at The University of West-ern Australia for the research work reported in thepaper. They express their appreciation to The Univer-sity for permission to publish the paper.
Appendix A. Expressions for shortest distances [16]
The shortest distance between two points (x1, y1, z1)and (x2, y2, z2) is given by Eq. (A1.1):
D=(x2−x1)2+ (y2−y1)2+ (z2−z1)2 (A1.1)Fig. 9. Natural shields.

R. Holt, T.T. Nguyen / Electric Power Systems Research 49 (1999) 201–210 209
Fig. 10. Effects of natural shield height.
Given a point (x1, y1, z1) and a plane ax+by+cz=dthen the shortest distance between the line and theplane is given in Eq. (A1.2):
D=)ax1+by1+cz1−d
a2+b2+c2
)(A1.2)
Given a point (x1, y1, z1) and a line as defined in Eq.(A1.3) then the shortest distance between the point andline is given in Eq. (A1.4):
x−x0
a=
y−y0
b=
z−z0
c(A1.3)
D
=D[b (z1−z0)−c (y1−y0)]2+ [c (x1−x0)
−a (z1−z0)]2+ [a (y1−y0)−b (x1−x0)]2 (A1.4)
Appendix B. Nomenclature
lightning stroke current (kA)IKm scaling factor for general EGMgs lightning ground strike density
(strikes/km2/year)
maximum striking distance (m)Smax
l total length of overhead line (km)exposure area (km2)Aexposure period (years)t
Nc number of conductor strikes (strikes)number of simulations in Monte CarloNt
analysisshield failure rate (shield failures/100 km/Frc
year)normalized shield failure rateFc
(shield failures/100 km/year)striking distance of the m th object (m)Sm
shortest distance of the m th object fromdm
lightning leader tip (m)total number of objects which may be struckNs
P(I) probability that the lightning stroke currentwill be greater than I
IMed median current of lightning distribution (kA)
References
[1] R.H. Golde, The Frequency of occurrence and the distributionof lightning flashes to transmission lines, AIEE Trans. 64 (1945)902–910.
R. Holt, T.T. Nguyen / Electric Power Systems Research 49 (1999) 201–210210
[2] J.G. Anderson, Monte Carlo computer calculation of transmis-sion line lightning performance, AIEE Trans. 80 (1961) 414–420.
[3] G.W. Brown, E.R. Whitehead, Field and analytical studies oftransmission line shielding: part II, IEEE Trans. Power Appar.Syst. PAS-88 (1969) 617–626.
[4] J.R. Currie, Liew Ah Choy, M. Darveniza, Monte Carlo deter-mination of the frequency of lightning strokes and shieldingfailures on transmission lines, IEEE Trans. Power Appar. Syst.PAS-90 (1971) 2305–2313.
[5] M. Darveniza, M. Sargent, G.J. Limbourne, Liew Ah Choy,R.O. Caldwell, J.R. Currie, B.C. Holcombe, R.H. Stillman, R.Frowd, Modelling for lightning performance calculations, IEEETrans. Power Appar. Syst. PAS-98 (6) (1979) 1900–1908.
[6] IEEE Working Group on Lightning Performance of Transmis-sion Lines, A simplified method for estimating lightning perfor-mance of transmission lines, IEEE Trans. Power Appar. Syst.PAS-104 (4) (1985) 919–932.
[7] A.J. Eriksson, An improved electrogeometric model for trans-mission line shielding analysis, IEEE Trans. Power Deliv. 2 (3)(1987) 871–886.
[8] A.M. Mousa, K.D. Srivastava, The implications of the electroge-ometric model regarding the effect of height of structure on themedian amplitude of collected lightning strokes, IEEE Trans.Power Deliv. 4 (2) (1989) 1450–1460.
[9] F.A.M. Rizk, Modelling of transmission line exposure to directlightning strikes, IEEE Trans. Power Deliv. 5 (4) (1990) 1983–1997.
[10] IEEE Working Group Report, Estimating lightning performanceof transmission lines II—updates of analytical models, IEEETrans. Power Deliv. 8 (3) (1993) 1254–1267.
[11] P. Chowdhuri, S. Mehairijan, Alternative to Monte Carlomethod for the estimation of lightning incidence to overheadlines, IEE Proc. Gener. Transm. Distrib. 144 (2) (1997) 129–131.
[12] A.M. Mousa, K.D. Srivastava, Modelling of power lines inlightning incidence calculations, IEEE Trans. Power Deliv. 5 (1)(1990) 303–310.
[13] M.J. Rawlins, Lightning performance of the CEGB 275 kV and400 kV system 1977/8 to 1981/2, in: IEE Conference on Light-ning and Power Systems, Conference Publication No. 236, 1984,pp. 146–152.
[14] M.F. Stringfellow, Lightning incidence in the United Kingdom,in: IEE Conference on Lightning and the Distribution-System,Conference Publication No. 108, 1974, pp. 30–40.
[15] GEC Measurements, Protective Relays Application Guide, 3rdEd., June 1987.
[16] A. Kean, S.A. Senior, Complementary Mathematics, 2nd ed.,Science Press, Sydney, 1961.
.