MONTANA TRANSPORTATION BY THE NUMBERS
34
MONTANA TRANSPORTATION BY THE NUMBERS: Meeting the State’s Need for Safe, Smooth and Efficient Mobility January 2017 202-466-6706 tripnet.org Founded in 1971, TRIP ® of Washington, DC, is a nonprofit organization that researches, evaluates and distributes economic and technical data on surface transportation issues. TRIP is sponsored by insurance companies, equipment manufacturers, distributors and suppliers; businesses involved in highway and transit engineering and construction; labor unions; and organizations concerned with efficient and safe surface transportation
Transcript of MONTANA TRANSPORTATION BY THE NUMBERS

MONTANA TRANSPORTATION BY THE NUMBERS:
Meeting the State’s Need for Safe, Smooth and
Efficient Mobility
January 2017
202-466-6706
tripnet.org
Founded in 1971, TRIP ® of Washington, DC, is a nonprofit organization that researches, evaluates and distributes economic and technical data on surface transportation issues. TRIP is sponsored by insurance companies, equipment manufacturers, distributors and suppliers; businesses involved in highway and transit engineering and construction; labor unions; and organizations concerned with efficient and safe surface transportation
1
Ten Key Transportation Numbers in Montana
$874 million
The Montana Department of Transportation (MDT) estimates it will face an $874 million average annual shortfall through 2021 in the investment level needed to make further progress in improving road, highway and bridge conditions; improving traffic safety; and, completing needed modernization improvements to enhance economic development opportunities.
50
This report includes information on 50 road, highway and bridge projects that currently cannot proceed due to lack of funding. These projects are needed to improve safety, support economic development opportunities and improve conditions in Montana.
$144.5 million The MDT has delayed $144.5 million in road projects that had been scheduled to begin in 2017 because of a lack of adequate funding.
32 percent
5th 25 percent
Vehicle miles traveled (VMT) in Montana increased by 32 percent from 2000 to 2015 –from 9.9 billion VMT in 2000 to 13 billion VMT in 2015. This was the fifth largest increase in VMT in the nation during that time. VMT in Montana is anticipated to increase by another 25 percent by 2030.
$794 million
Driving on deficient roads costs Montana motorists a total of $794 million annually in the form of additional vehicle operating costs (VOC), congestion-related delays and traffic crashes.
$1,113 – Billings $1,417– Great Falls $1,152 – Missoula
TRIP has calculated the cost to the average motorist in the form of additional VOC, congestion-related delays and traffic crashes. Driving on deficient roads costs the average Billings urban area driver $1,113 annually, while the average driver in the Great Falls area loses $1,417 and the average driver in the Missoula area loses $1,152.
1.58 3rd
Montana’s overall traffic fatality rate of 1.58 fatalities per 100 million vehicle miles of travel in 2014 was the third highest in the U.S. and much higher than the national average of 1.08.
34% - Montana 30% - Billings
52% - Great Falls 26% – Missoula
Thirty-four percent of Montana’s major urban roads are in poor condition. In the Billings, Great Falls and Missoula urban areas, 30 percent, 52 percent and 26 percent of major roads are in poor condition, respectively.
$101 Billion Annually, $101 billion in goods are shipped to and from sites in Montana, mostly by truck.
18%
A total of 18 percent of Montana bridges show significant deterioration or do not meet current design standards. Eight percent of the state’s bridges are structurally deficient and ten percent are functionally obsolete.

2
Executive Summary
Nine years after the nation suffered a significant economic downturn, Montana’s
economy continues to rebound. The rate of economic growth in Montana, which is greatly
impacted by the reliability and condition of the state’s transportation system, has a significant
impact on quality of life in the Treasure State.
An efficient, safe and well-maintained transportation system provides economic and
social benefits by affording individuals access to employment, housing, healthcare, education,
goods and services, recreation, entertainment, family, and social activities. It also provides
businesses access to suppliers, markets and employees, all critical to a business’ level of
productivity and ability to expand. Reduced accessibility and mobility - as a result of traffic
congestion, a lack of adequate capacity, or deteriorated roads, highways, bridges and transit
facilities - diminishes a region’s quality of life by reducing economic productivity and limiting
opportunities for economic, health or social transactions and activities.
With an economy based largely on natural resource extraction, agriculture, manufacturing
and tourism, the quality of Montana’s transportation system plays a vital role in the state’s
economic growth and quality of life.
In this report, TRIP looks at the top transportation numbers in Montana as the state
addresses modernizing and maintaining its system of roads, highways, bridges and transit.
STATE TRANSPORTATION FUNDING IN MONTANA Based on current funding, MDT estimates it will face a funding shortfall of nearly $900 million each year through 2021. While the state will be able to address some needed projects with existing funding, numerous needed projects will not move forward at least through 2022.
• The Montana Department of Transportation (MDT) estimates it would need $1.46 billion annually to allow the state to make further progress in improving road, highway and bridge conditions; enhance traffic safety; and, make further modernization and capacity improvements to support economic development and quality of life.
• Despite those needs, MDT estimates it will face a funding shortfall averaging $874
million each year through 2021. And, while MDT funding is projected to increase slightly from 2016 to 2017, reaching $609 million in 2017, projected funding for 2018 through 2021 will be well below 2017 levels.

3
• The MDT has delayed $144.5 million in road projects that had been scheduled to begin in 2017 because of a lack of adequate funding.
• Based on current levels of state funding, the following preservation or reconstruction
projects are either underway, completed in 2016, or will be underway or completed no later than 2021.
MDT Proposed Funding 2016 FFY 2017 FFY 2018 FFY 2019 FFY 2020 FFY 2021Capital Investment 375,686,967$ 373,222,792$ 345,940,949$ 349,323,661$ 373,732,051$ 380,556,304$ Local Investment 58,589,935$ 69,948,975$ 66,552,620$ 61,909,911$ 43,873,971$ 50,812,034$ Local Fuel Tax Allocation 16,766,000$ 16,766,000$ 16,766,000$ 16,766,000$ 16,766,000$ 16,766,000$ Facilities 5,914,049$ 4,746,721$ 6,503,065$ 5,000,000$ 5,000,000$ 5,000,000$ Maintenance 9,678,876$ 10,112,360$ 10,112,360$ 10,112,360$ 10,112,360$ 10,112,360$ State Funded Maintenance 131,914,914$ 134,123,096$ 126,595,857$ 127,511,020$ 127,511,020$ 127,511,020$ Total 598,550,742$ 608,919,943$ 572,470,850$ 570,622,951$ 576,995,402$ 590,757,718$
861,449,258$ 851,080,057$ 887,529,150$ 889,377,049$ 883,004,598$ 869,242,282$ Annual transportation funding shortfall, assuming $1,460,000,000 in annual needs
Project Name/Location Scope Route Length (miles)
S FK FLATHEAD - HUNGRY HORSE BRIDGE REPLACEMENT N-1 1HUSON-EAST RECONSTRUCTION S-574 11SWAMP CREEK-EAST RECONSTRUCTION N-1 5FRENCHTOWN - E & W REHAB - MAJOR I-90 20US 93 N - POST CREEK HILL RECONSTRUCTION N-5 3RARUS/SILVER BOW CR STRUCTURES BRIDGE REPLACEMENT I-15 1STONE CREEK - NORTH RECONSTRUCTION N-49 7WHITEHALL-SOUTH RECONSTRUCTION P-55 12SOUTH OF BOULDER-SOUTH RECONSTRUCTION S-399 15YELLOWSTONE PARK REHAB N-50 21EMERSON JCT - MANCHESTER REHAB - MAJOR I-15 4WOLF CREEK - N & S REHAB - MAJOR I-15 7KIOWA JCT - N & S RECONSTRUCTION P-58 5GALATA-E&W RECONSTRUCTION N-1 8BYNUM - SOUTH RECONSTRUCTION P-3 6CULBERTSON - EAST RECONSTRUCTION N-1 11ROSEBUD CO LINE - EAST RECONSTRUCTION P-14 11BAINVILLE - SOUTH RECONSTRUCTION S-327 14BR DECK, TERRY-FALLON AREA BRIDGE DECK I-94, X-81020 39SIDNEY TO FAIRVIEW OVERLAY N-20 10LAVINA - SOUTH RECONSTRUCTION N-53 6HOBSON - EAST RECONSTRUCTION N-57 7MISSOURI RIVER BRIDGE (US-191) BRIDGE REHAB N-61 027TH ST-1ST AVE S TO AIRPORT MILL & FILL N-53 3TWO DOT - WEST RECONSTRUCTION P-14 5

4
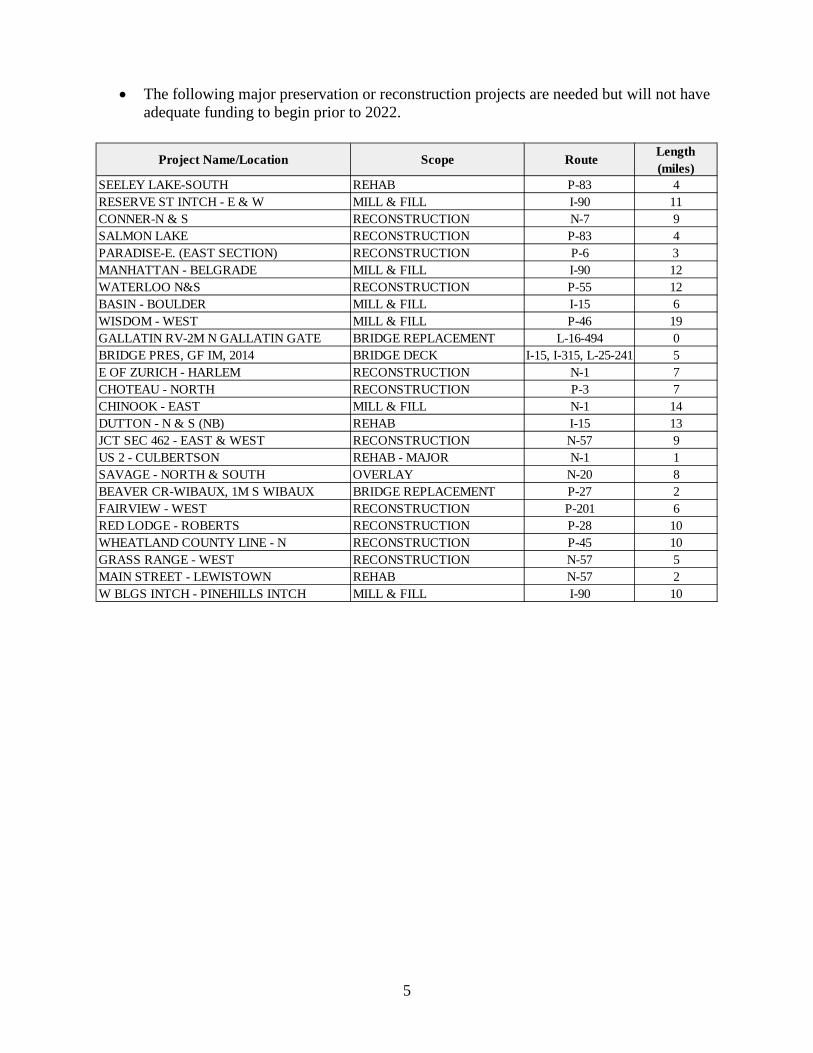
• Based on current levels of state funding, the following capacity expansion or safety projects are either underway, completed in 2016, or will be underway or completed no later than 2021.
Project Name/Location Scope Route Length (miles)
SF 119-SLOPE FLATTEN S-206 SLOPE FLATTENING S-206 9RONAN - NORTH RECONSTRUCTION N-5 1RUSSELL ST - IDAHO TO DAKOTA RECONSTRUCTION U-8105 0RUSSELL ST-BROADWAY TO IDAHO RECONSTRUCTION U-8105 0SF149 S OF STEVENSVLL SFTY IMP MEDIAN AND SHOULDERS S-269 6TOSTON STRUCTURES (US-287) BRIDGE REPLACEMENT N-8 3BELGRADE-SOUTH RECONSTRUCTION N-85 3ROUSE-OAK/STORY MILL-BOZEMAN RECONSTRUCTION P-86 1JCT S-437 - N & S RECONSTRUCTION N-8 6SF 129 -SLOPE FLTTNNG BELGRADE SLOPE FLATTENING P-205 2BELT - N & S - PHASE 3 RECONSTRUCTION N-60, N-57 3LOHMAN-E&W RECONSTRUCTION N-1 10SF 119-JCT S-279/S-231 INT IMPROVEMENTS S-279 1CAPITOL INTCH/CEDAR INTCH/HLNA BRIDGE REPLACE W/ADDED I-15 1SF 149 - YORK RD ROUNDABOUT INT IMPROVEMENTS S-280 0BROADUS INTCHG - MILES CITY INTERCHANGE I-94 0EAST HOLLY STREET - SIDNEY REHAB - MAJOR U-10408 1SF 139-ROUNDABOUT S OF SIDNEY INT IMPROVEMENTS N-20 1SF 129-ROUNDABOUT LAME DEER SAFETY N-37 012 KM EAST OF JORDAN - EAST RECONSTRUCTION N-57 10WEST LAUREL INTCH-WEST PHASE 1 RECONSTRUCTION I-90 0I-90 YELLOWSTONE R - BILLINGS BRIDGE REPLACEMENT I-90 5ROCKVALE - LAUREL (NB LANES) RECONSTRUCTION N-4, P-28 9SF 119-INT IMP - N GRASS RANGE INT IMPROVEMENTS N-57, N-61 1ROCKVALE - LAUREL (2 LANES) RECONSTRUCTION N-4, P-28 9
5
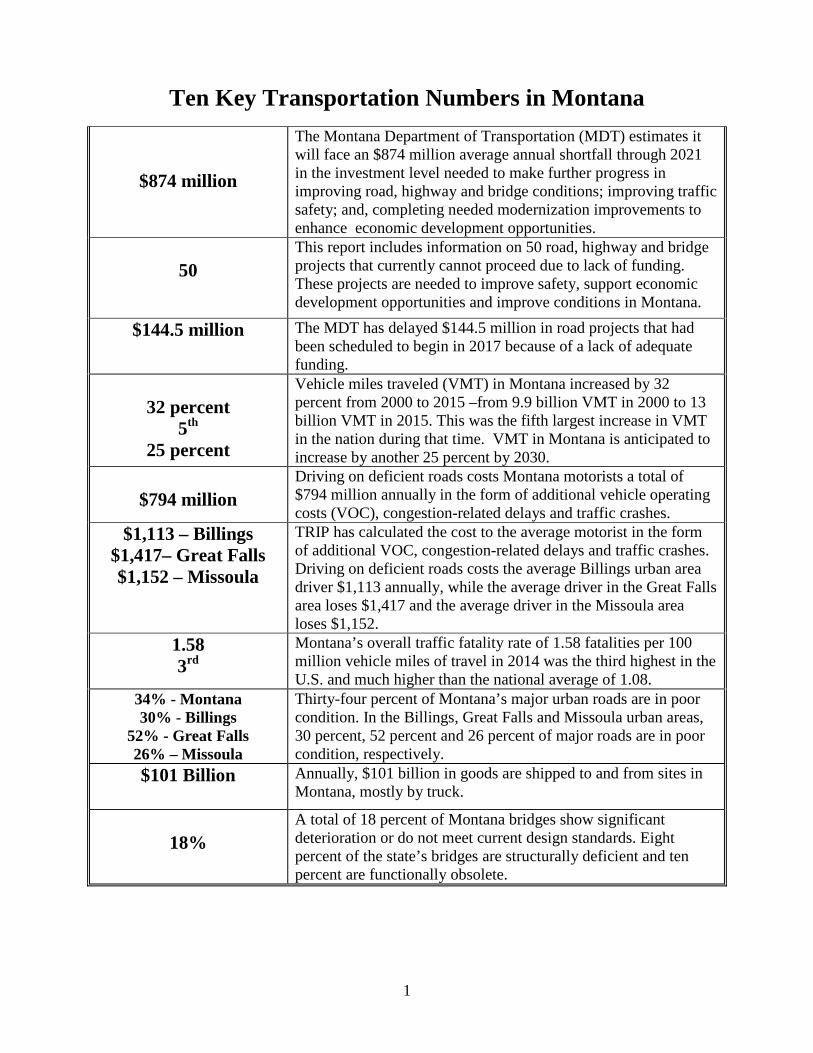
• The following major preservation or reconstruction projects are needed but will not have adequate funding to begin prior to 2022.
Project Name/Location Scope Route Length (miles)
SEELEY LAKE-SOUTH REHAB P-83 4RESERVE ST INTCH - E & W MILL & FILL I-90 11CONNER-N & S RECONSTRUCTION N-7 9SALMON LAKE RECONSTRUCTION P-83 4PARADISE-E. (EAST SECTION) RECONSTRUCTION P-6 3MANHATTAN - BELGRADE MILL & FILL I-90 12WATERLOO N&S RECONSTRUCTION P-55 12BASIN - BOULDER MILL & FILL I-15 6WISDOM - WEST MILL & FILL P-46 19GALLATIN RV-2M N GALLATIN GATE BRIDGE REPLACEMENT L-16-494 0BRIDGE PRES, GF IM, 2014 BRIDGE DECK I-15, I-315, L-25-241 5E OF ZURICH - HARLEM RECONSTRUCTION N-1 7CHOTEAU - NORTH RECONSTRUCTION P-3 7CHINOOK - EAST MILL & FILL N-1 14DUTTON - N & S (NB) REHAB I-15 13JCT SEC 462 - EAST & WEST RECONSTRUCTION N-57 9US 2 - CULBERTSON REHAB - MAJOR N-1 1SAVAGE - NORTH & SOUTH OVERLAY N-20 8BEAVER CR-WIBAUX, 1M S WIBAUX BRIDGE REPLACEMENT P-27 2FAIRVIEW - WEST RECONSTRUCTION P-201 6RED LODGE - ROBERTS RECONSTRUCTION P-28 10WHEATLAND COUNTY LINE - N RECONSTRUCTION P-45 10GRASS RANGE - WEST RECONSTRUCTION N-57 5MAIN STREET - LEWISTOWN REHAB N-57 2W BLGS INTCH - PINEHILLS INTCH MILL & FILL I-90 10

6
• The following major capacity expansion or safety projects are needed but will not have adequate funding to begin prior to 2022.
COST TO MONTANA MOTORISTS OF DEFICIENT ROADS An inadequate transportation system costs Montana motorists a total of $794 million every year in the form of additional vehicle operating costs (VOC), congestion-related delays and traffic crashes.
• Driving on rough roads costs Montana motorists a total of $296 million annually in extra vehicle operating costs. Costs include accelerated vehicle depreciation, additional repair costs, and increased fuel consumption and tire wear.
• Traffic crashes in which roadway design was likely a contributing factor costs Montana
motorists a total of $328 million each year in the form of lost household and workplace productivity, insurance and other financial costs.
• Traffic congestion costs Montana motorists a total of $170 million each year in the form
of lost time and wasted fuel.
• The chart below details the average cost per driver in the state’s largest urban areas and statewide.
Project Name/Location Scope Route Length (miles)
WHITEFISH URBAN RECONSTRUCTION N-5, U-12002 1COURTHOUSE COUPLET-KALISPELL RECONSTRUCTION N-5 0US 93 - RONAN (URBAN) RECONSTRUCTION N-5 3SF 159 FRENCHTOWN MEDIAN RAIL SAFETY I-90 10RUSSELL ST-DAKOTA TO MOUNT RECONSTRUCTION U-8105 1KAGY BLVD - S 19TH TO WILLSON REHAB - MAJOR U-1212 1RR GRADE SEPARATION LIVINGSTON GRADE SEPARATION 1ANACONDA - WEST RECONSTRUCTION P-19 4SF-169 VALLEY SPUR INTX IMPRV INT IMPROVEMENTS P-205, U-1211 0TURNBAY-N OF GALLATIN GATEWAY INT IMPROVEMENTS N-50 1GREAT FALLS - NORTH RECONSTRUCTION N-10 7LINCOLN RD-MONTANA TO I-15 INT IMPROVEMENTS I-15, S-453, U-5826 1SF-169 LINCOLN APPLEGATE INTX INT IMPROVEMENTS U-5826 1EAST OF EAST HELENA - EAST REHAB - MAJOR N-8 3SF 159 LOLA SHEPARD INT IMPRV SAFETY N-8 1BAINVILLE - EAST (PE II) RECONSTRUCTION N-1 8SF 159 SO WIBAUX CRV IMPRV SAFETY P-27 5SF 169 S OF GLASGOW SFTY IMPRV SLOPE FLATTENING P-42 1SF-149 FORSYTH MEDIAN BARRIER GUARDRAIL,SKID TREAT,BR I-94 2LITTLE DRY CREEK - EAST RECONSTRUCTION N-57 7BILLINGS BYPASS RECONSTRUCTION 15US-12 BANK STABILIZATION BANK STABILIZATION N-14, P-14 1BBP - FIVE MILE ROAD RECONSTRUCTION 0SF 159 SE COLUMBUS SHLDR WID SAFETY S-421 2SF129-BILLINGS HRZNTL CRV SIGN SIGNING - UPGRADE 0

7
POPULATION, TRAVEL AND ECONOMIC GROWTH IN MONTANA The rate of population and economic growth in Montana has resulted in increased demands on the state’s major roads and highways, leading to increased wear and tear on the transportation system.
• Montana’s population reached approximately 1 million residents in 2015, a 14 percent increase since 2000. Montana had approximately 781,000 licensed drivers in 2015.
• Vehicle miles traveled (VMT) in Montana increased by 32 percent from 2000 to 2015 –from 9.9 billion VMT in 2000 to 13 billion VMT in 2015. This was the fifth largest increase in VMT in the nation during that time.
• During the first nine months of 2016, VMT in Montana was up 3.3 percent from the first nine months of 2015, ahead of the national rate of VMT growth of three percent during that time.
• By 2030, vehicle travel in Montana is projected to increase by another 25 percent.
• Montana’s gross domestic product (GDP), a measure of the state’s economic output, increased by 43 percent from 2000 to 2015, when adjusted for inflation. This was the seventh largest increase in GDP during that time. U.S. GDP increased 27 percent from 2000 to 2015.
MONTANA ROAD CONDITIONS A lack of adequate state and local funding has resulted in more than one-third of major urban roads and highways in Montana having pavement surfaces in poor condition, providing a rough ride and costing motorists in the form of additional vehicle operating costs.
• The pavement data in this report, which is for all arterial and collector roads and highways, is provided by the Federal Highway Administration (FHWA), based on data submitted annually by the Montana Department of Transportation (MDT) on the condition of major state and locally maintained roads and highways.
Location VOC Safety Congestion TOTALBillings $592 $253 $268 $1,113
Great Falls $872 $311 $234 $1,417Missoula $538 $280 $334 $1,152
Montana - Statewide $296 million $328 million $170 million $794 million

8
• Pavement data for Interstate highways and other principal arterials is collected for all system mileage, whereas pavement data for minor arterial and all collector roads and highways is based on sampling portions of roadways as prescribed by FHWA to insure that the data collected is adequate to provide an accurate assessment of pavement conditions on these roads and highways.
• Thirty-four percent of Montana’s major locally and state-maintained urban roads and
highways have pavements in poor condition, 40 percent are rated in mediocre or fair condition, and the remaining 26 percent are rated in good condition.
• Seven percent of Montana’s major locally and state-maintained rural roads and highways
have pavements in poor condition, 36 percent are rated in mediocre or fair condition, and the remaining 57 percent are rated in good condition.
• The chart below details the share of pavement in poor, mediocre, fair and good condition
in the state’s largest urban areas.
• Roads rated in mediocre to poor condition may show signs of deterioration, including rutting, cracks and potholes. In some cases, these roads can be resurfaced, but often are too deteriorated and must be reconstructed.
• Driving on rough roads costs Montana motorists a total of $296 million annually in extra
vehicle operating costs. Costs include accelerated vehicle depreciation, additional repair costs, and increased fuel consumption and tire wear.
MONTANA BRIDGE CONDITIONS Eighteen percent of locally and state-maintained bridges in Montana show significant deterioration or do not meet current design standards, often because of narrow lanes, inadequate clearances or poor alignment. This includes all bridges that are 20 feet or more in length.
• Eight percent of Montana’s bridges are structurally deficient. A bridge is structurally deficient if there is significant deterioration of the bridge deck, supports or other major components. Structurally deficient bridges are often posted for lower weight or closed to traffic, restricting or redirecting large vehicles, including commercial trucks and emergency services vehicles.
• Ten percent of Montana’s bridges are functionally obsolete. Bridges that are functionally
obsolete no longer meet current highway design standards, often because of narrow lanes, inadequate clearances or poor alignment.
Location Poor Mediocre Fair GoodBillings 30% 20% 17% 33%
Great Falls 52% 24% 7% 18%Missoula 26% 17% 23% 34%

9
• The chart below details the share of structurally deficient or functionally obsolete bridges in Billings, Great Falls, Missoula and statewide..
HIGHWAY SAFETY AND FATALITY RATES IN MONTANA Montana’s traffic fatality rate is the third highest in the nation. Improving safety features on Montana’s roads and highways would likely result in a decrease in the state’s traffic fatalities and serious crashes. It is estimated that roadway features are likely a contributing factor in approximately one-third of all fatal and serious traffic crashes.
• A total of 1,024 people were killed in Montana traffic crashes from 2010 to 2014, an average of 205 fatalities per year.
• Montana’s overall traffic fatality rate of 1.58 fatalities per 100 million vehicle miles of
travel in 2014 was significantly higher than the national average of 1.08 and the third highest in the nation.
• Montana’s non-interstate rural roads have a disproportionately high fatality rate. The fatality rate on Montana’s non-interstate rural roads in 2014 was three times higher than on all other roads in the state (2.41 fatalities per 100 million vehicle miles of travel vs. 0.79).
• The vast distances between Montana’s populated areas and medical care heighten the need for a well-maintained, modern and safe system or roadways. Nearly all (96 percent) roadway departure fatalities and serious injuries occur in rural areas, making this type of severe crash the most common in Montana between 2004 and 2013. These crashes accounted for 67 percent of all fatalities and 55 percent of serious injuries.
• The chart below details the average number of people killed in traffic crashes from 2013 to 2015 in the state’s largest urban areas, as well as the cost per motorist of traffic crashes.
Structurally Functionally TotalLocation Deficient Obsolete BridgesBillings 4% 13% 287
Great Falls 3% 15% 188Missoula 7% 20% 209
Montana - Statewide 8% 10% 5,243

10
• Traffic crashes in Montana imposed a total of $985 million in economic costs in 2014. TRIP estimates that traffic crashes in which roadway features were likely a contributing factor imposed $328 million in economic costs in 2014.
• According to a 2015 National Highway Traffic Safety Administration (NHTSA) report,
the economic costs of traffic crashes includes work and household productivity losses, property damage, medical costs, rehabilitation costs, legal and court costs, congestion costs and emergency services.
• Roadway features that impact safety include the number of lanes, lane widths, lighting,
lane markings, rumble strips, shoulders, guard rails, other shielding devices, median barriers and intersection design. The cost of serious crashes includes lost productivity, lost earnings, medical costs and emergency services.
• Several factors are associated with vehicle crashes that result in fatalities, including driver behavior, vehicle characteristics and roadway features. TRIP estimates that roadway features are likely a contributing factor in approximately one-third of fatal traffic crashes.
• Where appropriate, highway improvements can reduce traffic fatalities and crashes while improving traffic flow to help relieve congestion. Such improvements include removing or shielding obstacles; adding or improving medians; improved lighting; adding rumble strips, wider lanes, wider and paved shoulders; upgrading roads from two lanes to four lanes; and better road markings and traffic signals.
• Investments in rural traffic safety have been found to result in significant reductions in serious traffic crashes. A 2012 report by the Texas Transportation Institute (TTI) found that improvements completed recently by the Texas Department of Transportation that widened lanes, improved shoulders and made other safety improvements on 1,159 miles of rural state roadways resulted in 133 fewer fatalities on these roads in the first three years after the improvements were completed (as compared to the three years prior). TTI estimates that the improvements on these roads are likely to save 880 lives over 20 years.
Average Cost PerLocation Fatalities DriverBillings 19 $253
Great Falls 12 $311Missoula 15 $280

11
MONTANA TRAFFIC CONGESTION Increasing levels of traffic congestion cause significant delays in Montana, particularly in its larger urban areas, choking commuting and commerce. Traffic congestion robs commuters of time and money and imposes increased costs on businesses, shippers and manufacturers, which are often passed along to the consumer.
• Based on Texas Transportation Institute (TTI) estimates, the value of lost time and wasted fuel in Montana is approximately $170 million per year.
• The chart below details the number of hours lost to congestion by the average driver in
the state’s largest urban areas, as well as the annual cost of traffic congestion per driver in the form of lost time and wasted fuel.
• Increasing levels of congestion add significant costs to consumers, transportation companies, manufacturers, distributors and wholesalers and can reduce the attractiveness of a location to a company when considering expansion or where to locate a new facility.
FEDERAL TRANSPORTATION FUNDING While the five-year federal surface transportation program includes modest funding increases and provides states with greater funding certainty, it falls far short of providing the level of funding needed to meet the nation’s highway and transit needs.
• Signed into law in December 2015, the Fixing America’s Surface Transportation Act (FAST Act), provides modest increases in federal highway and transit spending, allows states greater long-term funding certainty and streamlines the federal project approval process. But the FAST Act does not provide adequate funding to meet the nation’s need for highway and transit improvements and does not include a long-term and sustainable funding source.
• The five-year, $305 billion FAST Act will provide a boost of approximately 15 percent
in national highway funding and 18 percent in national transit funding over the duration of the program, which expires in 2020.
• According to the 2015 AASHTO Transportation Bottom Line Report, a significant boost
in investment in the nation’s roads, highways, bridges and public transit systems is needed to improve their condition and to meet the nation’s transportation needs.
• AASHTO’s report found that based on an annual one percent increase in VMT annual
investment in the nation’s roads, highways and bridges needs to increase 36 percent, from $88 billion to $120 billion, to improve conditions and meet the nation’s mobility needs.
Hours CongestionLocation Lost CostBillings 12 hours $268
Great Falls 11 hours $234Missoula 15 hours $334

12
Investment in the nation’s public transit system needs to increase from $17 billion to $43 billion.
• The Bottom Line Report found that if the national rate of vehicle travel increased by 1.4 percent per year, the needed annual investment in the nation’s roads, highways and bridges would need to increase by 64 percent to $144 billion. If vehicle travel grows by 1.6 percent annually the needed annual investment in the nation’s roads, highways and bridges would need to increase by 77 percent to $156 billion.
TRANSPORTATION AND ECONOMIC GROWTH IN MONTANA The efficiency of Montana’s transportation system, particularly its highways, is critical to the health of the state’s economy. Businesses rely on an efficient and dependable transportation system to move products and services. A key component in business efficiency and success is the level and ease of access to customers, markets, materials and workers.
• Annually, $101 billion in goods are shipped to and from sites in Montana, mostly by truck.
• Sixty-seven percent of the goods shipped annually to and from sites in Montana are
carried by trucks and another 12 percent are carried by courier services or multiple mode deliveries, which include trucking.
• Increasingly, companies are looking at the quality of a region’s transportation system when deciding where to re-locate or expand. Regions with congested or poorly maintained roads may see businesses relocate to areas with a smoother, more efficient and more modern transportation system.
• Highway accessibility was ranked the number two site selection factor behind only the availability of skilled labor in a 2015 survey of corporate executives by Area Development Magazine.
• The Federal Highway Administration estimates that each dollar spent on road, highway
and bridge improvements results in an average benefit of $5.20 in the form of reduced vehicle maintenance costs, reduced delays, reduced fuel consumption, improved safety, reduced road and bridge maintenance costs and reduced emissions as a result of improved traffic flow.
Sources of information for this report include the Montana Department of Transportation (MDT), the Federal Highway Administration (FHWA), the American Association of State Highway and Transportation Officials (AASHTO), the Bureau of Transportation Statistics (BTS), the U.S. Census Bureau, the Texas Transportation Institute (TTI) and the National Highway Traffic Safety Administration (NHTSA).

13
Introduction
Montana’s roads, highways and bridges form vital transportation links for the state’s
residents, visitors and businesses, providing daily access to homes, jobs, shopping, natural
resources and recreation. Modernizing Montana’s transportation system is critical to quality of
life and economic competitiveness in the Treasure State.
Supporting quality of life and a robust economy in Montana requires that the state
provide a safe, efficient and well-maintained transportation system. Inadequate transportation
investment, which will result in deteriorated transportation facilities and diminished access, will
negatively affect economic competitiveness and quality of life in Montana.
To accommodate population and economic growth, maintain its level of economic
competitiveness and achieve further economic growth, Montana will need to maintain and
modernize its roads, highways and bridges by improving the physical condition of its
transportation network and enhancing the system’s ability to provide efficient, reliable and safe
mobility for residents, visitors and businesses. Making needed improvements to Montana’s
roads, highways, bridges and transit systems could also provide a significant boost to the state’s
economy by creating jobs in the short term and stimulating long-term economic growth as a
result of enhanced mobility and access.
This report examines the condition, use and safety of Montana’s roads, highways and
bridges, funding needs, and the future mobility needs of the state. Sources of information for
this report include the Montana Department of Transportation (MDT), the Federal Highway
Administration (FHWA), the American Association of State Highway and Transportation
Officials (AASHTO), the Bureau of Transportation Statistics (BTS), the U.S. Census Bureau, the

14
Texas Transportation Institute (TTI), and the National Highway Traffic Safety Administration
(NHTSA).
Population, Travel and Economic Trends in Montana
Montana motorists and businesses require a high level of personal and commercial
mobility. To foster quality of life and spur continued economic growth in Montana, it will be
critical that the state provide a safe and modern transportation system that can accommodate
future growth in population, tourism, business, recreation and vehicle travel.
Montana’s population grew to approximately 1 million residents in 2015, a 14 percent
increase since 2000.1 Montana had approximately 781,000 licensed drivers in 2015.2 From
2000 to 2015, Montana’s gross domestic product (GDP), a measure of the state’s economic
output, increased by 43 percent, when adjusted for inflation.3 This was the seventh largest
increase in GDP during that time.4 U.S. GDP increased 27 percent from 2000 to 2015.5
From 2000 to 2015, annual VMT in Montana increased by 32 percent, from 9.9 billion
miles traveled annually to 13 billion miles traveled annually.6 This was the fifth largest increase
in the nation during that time. During the first nine months of 2016, vehicle miles of travel in
Montana were 3.3 percent higher than the first nine months of 2015.7 U.S. vehicle miles of
travel were three percent higher during the first nine months of 2016 than the first nine months of
2015.8
Based on population and other lifestyle trends, TRIP estimates that travel on Montana’s
roads and highways will increase by another 25 percent by 2030.9

15
Condition of Montana’s Roads
The life cycle of Montana’s roads is greatly affected by the state and local governments’
ability to perform timely maintenance and upgrades to ensure that road and highway surfaces last
as long as possible.
The pavement data in this report, which is for all arterial and collector roads and
highways, is provided by the Federal Highway Administration (FHWA), based on data submitted
annually by the Montana Department of Transportation (MDT) on the condition of major state
and locally maintained roads and highways. Pavement data for Interstate highways and other
principal arterials is collected for all system mileage, whereas pavement data for minor arterial
and all collector roads and highways is based on sampling portions of roadways as prescribed by
FHWA to insure that the data collected is adequate to provide an accurate assessment of
pavement conditions on these roads and highways.
Thirty-four percent of Montana’s major locally and state-maintained urban roads and
highways have pavements rated in poor condition.10 Another 40 percent of Montana’s major
urban roads are rated in mediocre or fair condition and the remaining 26 percent are rated in
good condition.11
Seven percent of Montana’s major locally and state-maintained rural roads and highways
have pavements rated in poor condition.12 Another 36 percent of Montana’s major rural roads
are rated in mediocre or fair condition and the remaining 57 percent are rated in good
condition.13
The chart below details pavement conditions on major urban roads in the state’s largest
urban areas.14

16
Chart 1. Pavement conditions on major roads in the state’s largest urban areas.
Source: TRIP analysis of Federal Highway Administration data.
Pavement failure is caused by a combination of traffic, moisture and climate. Moisture
often works its way into road surfaces and the materials that form the road’s foundation. Road
surfaces at intersections are even more prone to deterioration because the slow-moving or
standing loads occurring at these sites subject the pavement to higher levels of stress. It is critical
that roads are fixed before they require major repairs because reconstructing roads costs
approximately four times more than resurfacing them.15 As roads and highways continue to age,
they will reach a point of deterioration where routine paving and maintenance will not be
adequate to keep pavement surfaces in good condition and costly reconstruction of the roadway
and its underlying surfaces will become necessary.
The Costs to Motorists of Roads in Inadequate Condition
TRIP has calculated the additional cost to motorists of driving on roads in poor, mediocre
or fair condition. When roads are in poor, mediocre or fair condition – which may include
potholes, rutting or rough surfaces – the cost to operate and maintain a vehicle increases. These
additional vehicle operating costs (VOC) include accelerated vehicle depreciation, additional -
vehicle repair costs, increased fuel consumption and increased tire wear. TRIP estimates that
additional VOC borne by Montana motorists as a result of deteriorated road conditions is $296
million annually, or $385 per driver.16 Drivers in the state’s urban areas tend to have a higher
vehicle operating cost. The average driver in the Billings urban area loses $592 annually as a
Location Poor Mediocre Fair GoodBillings 30% 20% 17% 33%
Great Falls 52% 24% 7% 18%Missoula 26% 17% 23% 34%

17
result of driving on deteriorated roads while the average Great Falls area driver loses $872
annually and the average Missoula area driver loses $538 annually.
Additional vehicle operating costs have been calculated in the Highway Development
and Management Model (HDM), which is recognized by the U.S. Department of Transportation
and more than 100 other countries as the definitive analysis of the impact of road conditions on
vehicle operating costs. The HDM report is based on numerous studies that have measured the
impact of various factors, including road conditions, on vehicle operating costs.17
The HDM study found that road deterioration increases ownership, repair, fuel and tire
costs. The report found that deteriorated roads accelerate the pace of depreciation of vehicles and
the need for repairs because the stress on the vehicle increases in proportion to the level of
roughness of the pavement surface. Similarly, tire wear and fuel consumption increase as roads
deteriorate since there is less efficient transfer of power to the drive train and additional friction
between the road and the tires.
TRIP’s additional VOC estimate is based on taking the average number of miles driven
annually by a motorist, calculating current VOC based on AAA’s 2015 VOC and then using the
HDM model to estimate the additional VOC paid by drivers as a result of substandard roads.18
Additional research on the impact of road conditions on fuel consumption by the Texas
Transportation Institute (TTI) is also factored in to TRIP’s vehicle operating cost methodology.
Bridge Conditions in Montana
Montana’s bridges form key links in the state’s highway system, providing communities
and individuals access to employment, schools, shopping and medical facilities, and facilitating
commerce and access for emergency vehicles.

18
Eighteen percent of Montana’s locally and state- maintained bridges (20 feet or longer)
are currently rated as structurally deficient or functionally obsolete.
Eight percent of Montana’s locally and state maintained bridges are rated as structurally
deficient.19 A bridge is structurally deficient if there is significant deterioration of the bridge
deck, supports or other major components. Bridges that are structurally deficient may be posted
for lower weight limits or closed if their condition warrants such action. Deteriorated bridges can
have a significant impact on daily life. Restrictions on vehicle weight may cause many vehicles –
especially emergency vehicles, commercial trucks, school buses and farm equipment – to use
alternate routes to avoid posted bridges. Redirected trips also lengthen travel time, waste fuel
and reduce the efficiency of the local economy.
Ten percent of Montana’s locally and state maintained bridges are rated functionally
obsolete.20 Bridges that are functionally obsolete no longer meet current highway design
standards, often because of narrow lanes, inadequate clearances or poor alignment with the
approaching roadway.
The chart below details the share of bridges in the state’s largest urban areas that are
structurally deficient or functionally obsolete.
Chart 2. Share of structurally deficient and functionally obsolete bridges in Montana’s largest urban areas and statewide.
Source: TRIP analysis of Federal Highway Administration National Bridge Inventory.
Structurally Functionally TotalLocation Deficient Obsolete BridgesBillings 4% 13% 287
Great Falls 3% 15% 188Missoula 7% 20% 209
Montana - Statewide 8% 10% 5,243

19
The service life of bridges can be extended by performing routine maintenance such as
resurfacing decks, painting surfaces, insuring that a facility has good drainage and replacing
deteriorating components. But, most bridges will eventually require more costly reconstruction
or major rehabilitation to remain operable.
Traffic Safety in Montana
A total of 1,024 people were killed in Montana traffic crashes from 2010 to 2014, an
average of 205 fatalities per year.21
Chart 3. Traffic Fatalities in Montana from 2010 – 2014. Year Fatalities 2010 189 2011 209 2012 205 2013 229 2014 192 Total 1,024
Source: National Highway Traffic Safety Administration.
Three major factors are associated with fatal vehicle crashes: driver behavior, vehicle
characteristics and roadway features. It is estimated that roadway features are likely a
contributing factor in approximately one-third of fatal traffic crashes. Roadway features that
impact safety include the number of lanes, lane widths, lighting, lane markings, rumble strips,
shoulders, guard rails, other shielding devices, median barriers and intersection design.
Montana’s overall traffic fatality rate of 1.58 fatalities per 100 million vehicle miles of
travel in 2014 was significantly higher than the national average of 1.08 and the third highest in
the nation.22 The traffic fatality rate on the state’s rural roads is disproportionately high. The
fatality rate on Montana’s non-interstate rural roads is three times higher than on all other roads
in the state (2.41 fatalities per 100 million vehicle miles of travel vs. 0.79).23

20
The vast distances between Montana’s populated areas and medical care heighten the
need for a well-maintained, modern and safe system or roadways. Nearly all (96 percent)
roadway departure fatalities and serious injuries occur in rural areas, making this type of severe
crash the most common in Montana between 2004 and 2013.24 These crashes accounted for 67
percent of all fatalities and 55 percent of serious injuries.25
The chart below details the number of people killed in traffic crashes in the state’s largest
urban areas between 2013 and 2015, as well as the cost of traffic crashes per driver.
Chart 4. Average fatalities between 2013 and 2015 and crash cost per driver.
Source: TRIP analysis.
Traffic crashes in Montana imposed a total of $985 million in economic costs in 2014.26
TRIP estimates that traffic crashes in which roadway features were likely a contributing factor
imposed approximately $328 million in economic costs in 2014.27
According to a 2015 National Highway Traffic Safety Administration (NHTSA) report,
the economic costs of traffic crashes includes work and household productivity losses, property
damage, medical costs, rehabilitation costs, legal and court costs, congestion costs and
emergency services.28
Improving safety on Montana’s roadways can be achieved through further improvements
in vehicle safety; improvements in driver, pedestrian, and bicyclist behavior; and, a variety of
improvements in roadway safety features.
The severity of serious traffic crashes could be reduced through roadway improvements,
where appropriate, such as adding turn lanes, removing or shielding obstacles, adding or
Average Cost PerLocation Fatalities DriverBillings 19 $253
Great Falls 12 $311Missoula 15 $280

21
improving medians, widening lanes, widening and paving shoulders, improving intersection
layout, and providing better road markings and upgrading or installing traffic signals. Roads with
poor geometry, with insufficient clear distances, without turn lanes, having inadequate shoulders
for the posted speed limits, or poorly laid out intersections or interchanges, pose greater risks to
motorists, pedestrians and bicyclists.
Investments in rural traffic safety have been found to result in significant reductions in
serious traffic crashes. A 2012 report by TTI found that improvements completed recently by
TxDOT that widened lanes, improved shoulders and made other safety improvements on 1,159
miles of rural state roadways resulted in 133 fewer fatalities on these roads in the first three years
after the improvements were completed (as compared to the three years prior).29 TTI estimates
that the improvements on these roads are likely to save 880 lives over 20 years.30
Traffic Congestion in Montana
Increasing levels of traffic congestion cause significant delays in Montana, particularly in
its larger urban areas, choking commuting and commerce. Traffic congestion robs commuters of
time and money and imposes increased costs on businesses, shippers and manufacturers, which
are often passed along to the consumer.
Based on TTI methodology, TRIP estimates the value of lost time and wasted fuel in
Montana is approximately $170 million per year. The chart below details the number of hours
lost annually for each driver in the state’s largest urban areas, as well as the per-driver cost of
lost time and wasted fuel due to congestion.

22
Chart 5. Annual hours lost to congestion and congestion costs per driver.
Source: Texas Transportation Institute Urban Mobility Report.
Increasing levels of congestion add significant costs to consumers, transportation
companies, manufacturers, distributors and wholesalers. Increased levels of congestion can
reduce the attractiveness of a location to a company when considering expansion or where to
locate a new facility. Congestion costs can also increase overall operating costs for trucking and
shipping companies, leading to revenue losses, lower pay for employees, and higher consumer
costs.
Montana Transportation Funding
The Montana Department of Transportation estimates it would need $1.46 billion
annually to allow the state to make further progress in improving road, highway and bridge
conditions; enhance traffic safety; and, make further modernization and capacity improvements
to support economic development and quality of life.31
Despite those needs, MDT estimates it will face a funding shortfall that will average $874
million annually through 2021. And, while MDT funding is projected to increase slightly from
2016 to 2017, reaching $609 million in 2017, projected funding for 2018 through 2021 will be
well below 2017 levels each year.32
The chart below provides information on the annual funding for MDT from 2016 through
2021. The chart also indicates the projected shortfall each year assuming $1.46 million in annual
needs.
Hours CongestionLocation Lost CostBillings 12 hours $268
Great Falls 11 hours $234Missoula 15 hours $334

23
Chart 6. Annual MDT projected funding and annual projected funding shortfall.
Source: MDT response to TRIP survey.
The MDT has delayed $144.5 million in road projects that had been scheduled to begin in
2017 because of a lack of adequate funding.33 Of the $144.5 million total price tag, $130
million would come from federal sources and $14.5 million from state funds required as a
match.34
While the state will be able to address some needed projects with existing funding,
numerous needed projects will not move forward at least through 2022.
Based on current levels of state funding, the following preservation, reconstruction,
capacity expansion and safety projects were either underway, completed in 2016, or will be
underway or completed no later than 2021.
MDT Proposed Funding 2016 FFY 2017 FFY 2018 FFY 2019 FFY 2020 FFY 2021Capital Investment 375,686,967$ 373,222,792$ 345,940,949$ 349,323,661$ 373,732,051$ 380,556,304$ Local Investment 58,589,935$ 69,948,975$ 66,552,620$ 61,909,911$ 43,873,971$ 50,812,034$ Local Fuel Tax Allocation 16,766,000$ 16,766,000$ 16,766,000$ 16,766,000$ 16,766,000$ 16,766,000$ Facilities 5,914,049$ 4,746,721$ 6,503,065$ 5,000,000$ 5,000,000$ 5,000,000$ Maintenance 9,678,876$ 10,112,360$ 10,112,360$ 10,112,360$ 10,112,360$ 10,112,360$ State Funded Maintenance 131,914,914$ 134,123,096$ 126,595,857$ 127,511,020$ 127,511,020$ 127,511,020$ Total 598,550,742$ 608,919,943$ 572,470,850$ 570,622,951$ 576,995,402$ 590,757,718$
861,449,258$ 851,080,057$ 887,529,150$ 889,377,049$ 883,004,598$ 869,242,282$ Annual transportation funding shortfall, assuming $1,460,000,000 in annual needs

24
Chart 7. Needed Montana preservation or reconstruction projects that are either underway, completed in 2016 or will be underway or completed no later than 2021.
Source: MDT response to TRIP survey.
Based on current levels of state funding, the following capacity expansion or safety
projects were either underway, completed in 2016, or will be underway or completed no later
than 2021.
Project Name/Location Scope Route Length (miles)
S FK FLATHEAD - HUNGRY HORSE BRIDGE REPLACEMENT N-1 1HUSON-EAST RECONSTRUCTION S-574 11SWAMP CREEK-EAST RECONSTRUCTION N-1 5FRENCHTOWN - E & W REHAB - MAJOR I-90 20US 93 N - POST CREEK HILL RECONSTRUCTION N-5 3RARUS/SILVER BOW CR STRUCTURES BRIDGE REPLACEMENT I-15 1STONE CREEK - NORTH RECONSTRUCTION N-49 7WHITEHALL-SOUTH RECONSTRUCTION P-55 12SOUTH OF BOULDER-SOUTH RECONSTRUCTION S-399 15YELLOWSTONE PARK REHAB N-50 21EMERSON JCT - MANCHESTER REHAB - MAJOR I-15 4WOLF CREEK - N & S REHAB - MAJOR I-15 7KIOWA JCT - N & S RECONSTRUCTION P-58 5GALATA-E&W RECONSTRUCTION N-1 8BYNUM - SOUTH RECONSTRUCTION P-3 6CULBERTSON - EAST RECONSTRUCTION N-1 11ROSEBUD CO LINE - EAST RECONSTRUCTION P-14 11BAINVILLE - SOUTH RECONSTRUCTION S-327 14BR DECK, TERRY-FALLON AREA BRIDGE DECK I-94, X-81020 39SIDNEY TO FAIRVIEW OVERLAY N-20 10LAVINA - SOUTH RECONSTRUCTION N-53 6HOBSON - EAST RECONSTRUCTION N-57 7MISSOURI RIVER BRIDGE (US-191) BRIDGE REHAB N-61 027TH ST-1ST AVE S TO AIRPORT MILL & FILL N-53 3TWO DOT - WEST RECONSTRUCTION P-14 5
25
Chart 8. Needed Montana capacity expansion or safety projects that are either underway, completed in 2016 or will be underway or completed no later than 2021.
Source: MDT response to TRIP survey.
The following major preservation or reconstruction projects are needed but will not have
adequate funding to begin prior to 2022.
Project Name/Location Scope Route Length (miles)
SF 119-SLOPE FLATTEN S-206 SLOPE FLATTENING S-206 9RONAN - NORTH RECONSTRUCTION N-5 1RUSSELL ST - IDAHO TO DAKOTA RECONSTRUCTION U-8105 0RUSSELL ST-BROADWAY TO IDAHO RECONSTRUCTION U-8105 0SF149 S OF STEVENSVLL SFTY IMP MEDIAN AND SHOULDERS S-269 6TOSTON STRUCTURES (US-287) BRIDGE REPLACEMENT N-8 3BELGRADE-SOUTH RECONSTRUCTION N-85 3ROUSE-OAK/STORY MILL-BOZEMAN RECONSTRUCTION P-86 1JCT S-437 - N & S RECONSTRUCTION N-8 6SF 129 -SLOPE FLTTNNG BELGRADE SLOPE FLATTENING P-205 2BELT - N & S - PHASE 3 RECONSTRUCTION N-60, N-57 3LOHMAN-E&W RECONSTRUCTION N-1 10SF 119-JCT S-279/S-231 INT IMPROVEMENTS S-279 1CAPITOL INTCH/CEDAR INTCH/HLNA BRIDGE REPLACE W/ADDED I-15 1SF 149 - YORK RD ROUNDABOUT INT IMPROVEMENTS S-280 0BROADUS INTCHG - MILES CITY INTERCHANGE I-94 0EAST HOLLY STREET - SIDNEY REHAB - MAJOR U-10408 1SF 139-ROUNDABOUT S OF SIDNEY INT IMPROVEMENTS N-20 1SF 129-ROUNDABOUT LAME DEER SAFETY N-37 012 KM EAST OF JORDAN - EAST RECONSTRUCTION N-57 10WEST LAUREL INTCH-WEST PHASE 1 RECONSTRUCTION I-90 0I-90 YELLOWSTONE R - BILLINGS BRIDGE REPLACEMENT I-90 5ROCKVALE - LAUREL (NB LANES) RECONSTRUCTION N-4, P-28 9SF 119-INT IMP - N GRASS RANGE INT IMPROVEMENTS N-57, N-61 1ROCKVALE - LAUREL (2 LANES) RECONSTRUCTION N-4, P-28 9
26
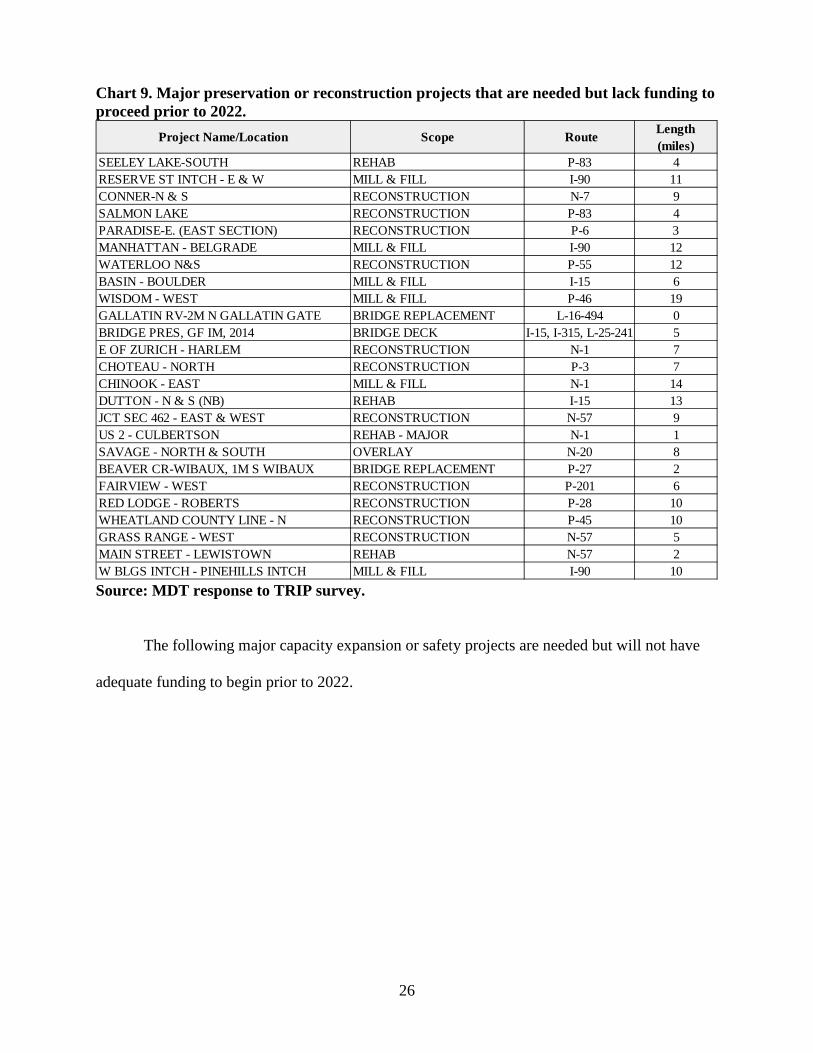
Chart 9. Major preservation or reconstruction projects that are needed but lack funding to proceed prior to 2022.
Source: MDT response to TRIP survey.
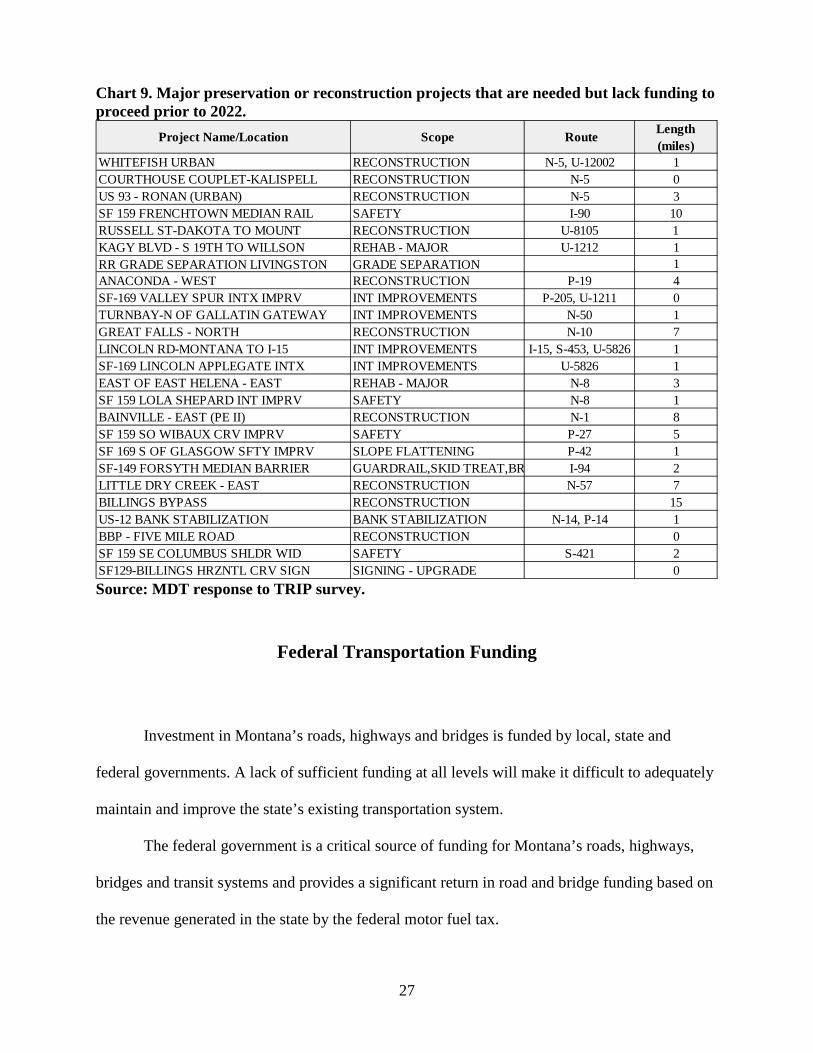
The following major capacity expansion or safety projects are needed but will not have
adequate funding to begin prior to 2022.
Project Name/Location Scope Route Length (miles)
SEELEY LAKE-SOUTH REHAB P-83 4RESERVE ST INTCH - E & W MILL & FILL I-90 11CONNER-N & S RECONSTRUCTION N-7 9SALMON LAKE RECONSTRUCTION P-83 4PARADISE-E. (EAST SECTION) RECONSTRUCTION P-6 3MANHATTAN - BELGRADE MILL & FILL I-90 12WATERLOO N&S RECONSTRUCTION P-55 12BASIN - BOULDER MILL & FILL I-15 6WISDOM - WEST MILL & FILL P-46 19GALLATIN RV-2M N GALLATIN GATE BRIDGE REPLACEMENT L-16-494 0BRIDGE PRES, GF IM, 2014 BRIDGE DECK I-15, I-315, L-25-241 5E OF ZURICH - HARLEM RECONSTRUCTION N-1 7CHOTEAU - NORTH RECONSTRUCTION P-3 7CHINOOK - EAST MILL & FILL N-1 14DUTTON - N & S (NB) REHAB I-15 13JCT SEC 462 - EAST & WEST RECONSTRUCTION N-57 9US 2 - CULBERTSON REHAB - MAJOR N-1 1SAVAGE - NORTH & SOUTH OVERLAY N-20 8BEAVER CR-WIBAUX, 1M S WIBAUX BRIDGE REPLACEMENT P-27 2FAIRVIEW - WEST RECONSTRUCTION P-201 6RED LODGE - ROBERTS RECONSTRUCTION P-28 10WHEATLAND COUNTY LINE - N RECONSTRUCTION P-45 10GRASS RANGE - WEST RECONSTRUCTION N-57 5MAIN STREET - LEWISTOWN REHAB N-57 2W BLGS INTCH - PINEHILLS INTCH MILL & FILL I-90 10
27
Chart 9. Major preservation or reconstruction projects that are needed but lack funding to proceed prior to 2022.
Source: MDT response to TRIP survey.
Federal Transportation Funding
Investment in Montana’s roads, highways and bridges is funded by local, state and
federal governments. A lack of sufficient funding at all levels will make it difficult to adequately
maintain and improve the state’s existing transportation system.
The federal government is a critical source of funding for Montana’s roads, highways,
bridges and transit systems and provides a significant return in road and bridge funding based on
the revenue generated in the state by the federal motor fuel tax.
Project Name/Location Scope Route Length (miles)
WHITEFISH URBAN RECONSTRUCTION N-5, U-12002 1COURTHOUSE COUPLET-KALISPELL RECONSTRUCTION N-5 0US 93 - RONAN (URBAN) RECONSTRUCTION N-5 3SF 159 FRENCHTOWN MEDIAN RAIL SAFETY I-90 10RUSSELL ST-DAKOTA TO MOUNT RECONSTRUCTION U-8105 1KAGY BLVD - S 19TH TO WILLSON REHAB - MAJOR U-1212 1RR GRADE SEPARATION LIVINGSTON GRADE SEPARATION 1ANACONDA - WEST RECONSTRUCTION P-19 4SF-169 VALLEY SPUR INTX IMPRV INT IMPROVEMENTS P-205, U-1211 0TURNBAY-N OF GALLATIN GATEWAY INT IMPROVEMENTS N-50 1GREAT FALLS - NORTH RECONSTRUCTION N-10 7LINCOLN RD-MONTANA TO I-15 INT IMPROVEMENTS I-15, S-453, U-5826 1SF-169 LINCOLN APPLEGATE INTX INT IMPROVEMENTS U-5826 1EAST OF EAST HELENA - EAST REHAB - MAJOR N-8 3SF 159 LOLA SHEPARD INT IMPRV SAFETY N-8 1BAINVILLE - EAST (PE II) RECONSTRUCTION N-1 8SF 159 SO WIBAUX CRV IMPRV SAFETY P-27 5SF 169 S OF GLASGOW SFTY IMPRV SLOPE FLATTENING P-42 1SF-149 FORSYTH MEDIAN BARRIER GUARDRAIL,SKID TREAT,BR I-94 2LITTLE DRY CREEK - EAST RECONSTRUCTION N-57 7BILLINGS BYPASS RECONSTRUCTION 15US-12 BANK STABILIZATION BANK STABILIZATION N-14, P-14 1BBP - FIVE MILE ROAD RECONSTRUCTION 0SF 159 SE COLUMBUS SHLDR WID SAFETY S-421 2SF129-BILLINGS HRZNTL CRV SIGN SIGNING - UPGRADE 0

28
Most federal funds for highway and transit improvements in Montana are provided by
federal highway user fees, largely an 18.4 cents-per-gallon tax on gasoline and a 24.4 cents-per-
gallon tax on diesel fuel. Since 2008 revenue into the federal Highway Trust Fund has been
inadequate to support legislatively set funding levels so Congress has transferred approximately
$53 billion in general funds and an additional $2 billion from a related trust fund into the federal
Highway Trust Fund.35
Signed into law in December 2015, the Fixing America’s Surface Transportation Act
(FAST Act), provides modest increases in federal highway and transit spending. The five-year
bill also provides states with greater funding certainty and streamlines the federal project
approval process. But, the FAST Act does not provide adequate funding to meet the nation’s
need for highway and transit improvements and does not include a long-term and sustainable
funding source.
The five-year, $305 billion FAST Act will provide a boost of approximately 15 percent in
highway funding and 18 percent in transit funding over the duration of the program, which
expires in 2020.36 In addition to federal motor fuel tax revenues, the FAST Act will also be
funded by $70 billion in U.S. general funds, which will rely on offsets from several unrelated
federal programs including the Strategic Petroleum Reserve, the Federal Reserve and U.S.
Customs.
According to the 2015 AASHTO Transportation Bottom Line Report, a significant boost
in investment in the nation’s roads, highways, bridges and public transit systems is needed to
improve their condition and to meet the nation’s transportation needs. The AASHTO report
found that based on an annual one percent increase in VMT that annual investment in the
nation’s roads, highways and bridges needs to increase by 36 percent, from $88 billion to $120

29
billion to improve conditions and meet the nation’s mobility needs.37 Investment in the nation’s
public transit system needs to increase from $17 billion to $43 billion.38
The 2015 AASHTO Transportation Bottom Line Report found that if the rate of vehicle
travel increased by 1.4 percent per year, the needed annual investment in the nation’s roads,
highways and bridges would need to increase by 64 percent, to $144 billion. If vehicle travel
grows by 1.6 percent annually the needed annual investment in the nation’s roads, highways and
bridges would need to increase by 77 percent, to $156 billion.39
Importance of Transportation to Economic Growth
Today’s culture of business demands that an area have well-maintained and efficient
roads, highways and bridges if it is to remain economically competitive. Global communications
and the impact of free trade in North America and elsewhere have resulted in a significant
increase in freight movement, making the quality of a region’s transportation system a key
component in a business’s ability to compete locally, nationally and internationally.
Businesses have responded to improved communications and the need to cut costs with a
variety of innovations including just-in-time delivery, increased small package delivery, demand-
side inventory management and e-commerce. The result of these changes has been a significant
improvement in logistics efficiency as firms move from a push-style distribution system, which
relies on large-scale warehousing of materials, to a pull-style distribution system, which relies on
smaller, more strategic movement of goods. These improvements have made mobile inventories
the norm, resulting in the nation’s trucks literally becoming rolling warehouses.
Highways are vitally important to continued economic development in Montana,
particularly to the state’s manufacturing, mineral extraction, agriculture and tourism industries.

30
As the economy expands, creating more jobs and increasing consumer confidence, the demand
for consumer and business products grows. In turn, manufacturers ship greater quantities of
goods to market to meet this demand, a process that adds to truck traffic on the state’s highways
and major arterial roads.
Every year, $101 billion in goods are shipped to and from sites in Montana, mostly by
trucks.40 Sixty-seven percent of the goods shipped annually to and from sites in Montana are
carried by trucks and another 12 percent are carried by courier services or multiple-mode
deliveries, which include trucking.41
The cost of road and bridge improvements are more than offset by the reduction of user
costs associated with driving on rough roads, the improvement in business productivity, the
reduction in delays and the improvement in traffic safety. The Federal Highway Administration
estimates that each dollar spent on road, highway and bridge improvements results in an average
benefit of $5.20 in the form of reduced vehicle maintenance costs, reduced delays, reduced fuel
consumption, improved safety, reduced road and bridge maintenance costs and reduced
emissions as a result of improved traffic flow.42
Local, regional and state economic performance is improved when a region’s surface
transportation system is expanded or repaired. This improvement comes as a result of the initial
job creation and increased employment created over the long-term because of improved access,
reduced transport costs and improved safety.
Increasingly, companies are looking at the quality of a region’s transportation system
when deciding where to re-locate or expand. Regions with congested or poorly maintained roads
may see businesses relocate to areas with a smoother, more efficient and more modern
transportation system. Highway accessibility was ranked the number two site selection factor

31
behind only the availability of skilled labor in a 2015 survey of corporate executives by Area
Development Magazine.43
Conclusion
As Montana works to build and enhance a thriving, growing and dynamic state, it will be
critical that it is able to address the state’s most significant transportation issues by providing a
21st century network of roads, highways, bridges and transit that can accommodate the mobility
demands of a modern society.
Montana will need to modernize its surface transportation system by improving the
physical condition of its transportation network and enhancing the system’s ability to provide
efficient, safe and reliable mobility for residents, visitors and businesses. Making needed
improvements to the state’s roads, highways, bridges and transit systems could provide a
significant boost to the economy by creating jobs in the short term and stimulating long-term
economic growth as a result of enhanced mobility and access.
While the modest funding increase provided by the FAST Act will be helpful, numerous
projects to improve the condition and expand the capacity of Montana’s roads, highways, bridges
and transit systems will not be able to proceed without a substantial boost in state or local
transportation funding. If Montana is unable to complete needed transportation projects it will
hamper the state’s ability to improve the condition and efficiency of its transportation system or
enhance economic development opportunities and quality of life.
# # #
32
Endnotes
1 U.S. Census Bureau (2015). 2 Highway Statistics (2015). Federal Highway Administration. DL-1C 3 TRIP analysis of Bureau of Economic Analysis data. 4 Ibid. 5 Ibid. 6 U.S. Department of Transportation - Federal Highway Administration: Highway Statistics 2000 and 2015. 7 TRIP analysis of Federal Highway Administration’s monthly Traffic Volume Trends (2016) Federal Highway Administration. 8 Ibid. 9 TRIP calculation based on U.S. Census and Federal Highway Administration data. 10 Ibid. 11 Ibid. 12 Ibid. 13 Ibid. 14 Ibid. 15 Selecting a Preventative Maintenance Treatment for Flexible Pavements. R. Hicks, J. Moulthrop. Transportation Research Board. 1999. Figure 1. 16 TRIP calculation. 17 Highway Development and Management: Volume Seven. Modeling Road User and Environmental Effects in HDM-4. Bennett, C. and Greenwood, I. 2000. 18 Your Driving Costs. American Automobile Association. 2015. 19 Federal Highway Administration National Bridge Inventory, 2016 (data is for 2015). 20 Ibid. 21 Federal Highway Administration National Highway Traffic Safety Administration, 2010-2014. 22 TRIP analysis of National Highway Traffic Safety Administration and Federal Highway Administration data (2015). 23 Ibid. 24 MDT response to TRIP survey. 25 Ibid. 26 TRIP estimate based on NHTSA report “The Economic and Societal Impact Of Motor Vehicle Crashes, 2010 (Revised), 2015. P. 146. 27 Ibid. 28 The Economic and Societal Impact Of Motor Vehicle Crashes, 2010 (Revised) (2015). National Highway Traffic Safety Administration. P. 1. https://crashstats.nhtsa.dot.gov/Api/Public/ViewPublication/812013 29 Adding Highway Shoulders, Width, Reduce Crash Numbers and Save Lives (August 9, 2012). Texas Transportation Institute. 30 Ibid. 31 Montana Department of Transportation (2017). Response to TRIP survey. 32 Ibid. 33 30 Road Projects Halted in Montana Due to Budget Shortfall (2017). Governing the States and Localities. http://www.governing.com/topics/transportation-infrastructure/tns-montana-road-projects-budget.html 34 Ibid. 35 “Surface Transportation Reauthorization and the Solvency of the Highway Trust Fund,” presentation by Jim Tymon, American Association of State Highway and Transportation Officials (2014). 36 2015 “Fixing America’s Surface Transportation Act.” (2015) American Road and Transportation Builders Association. http://www.artba.org/newsline/wp-content/uploads/2015/12/ANALYSIS-FINAL.pdf 37 2015 AASHTO Bottom Line Report (2014) AASHTO. P. 2.

33
38 Ibid. 39 Ibid. 40 TRIP analysis of Bureau of Transportation Statistics, U.S. Department of Transportation. 2012 Commodity Flow Survey, State Summaries. 41 Ibid. 42 FHWA estimate based on its analysis of 2006 data. For more information on FHWA’s cost-benefit analysis of highway investment, see the 2008 Status of the Nation's Highways, Bridges, and Transit: Conditions and Performance. 43 Area Development Magazine (2016). 30th Annual Survey of Corporate Executives: Availability of Skilled Labor New Top Priority. http://www.areadevelopment.com/Corporate-Consultants-Survey-Results/Q1-2016/corporate-executive-site-selection-facility-plans-441729.shtml