Monsanto Europe SA/NV January 2014 - Homepage -...
47
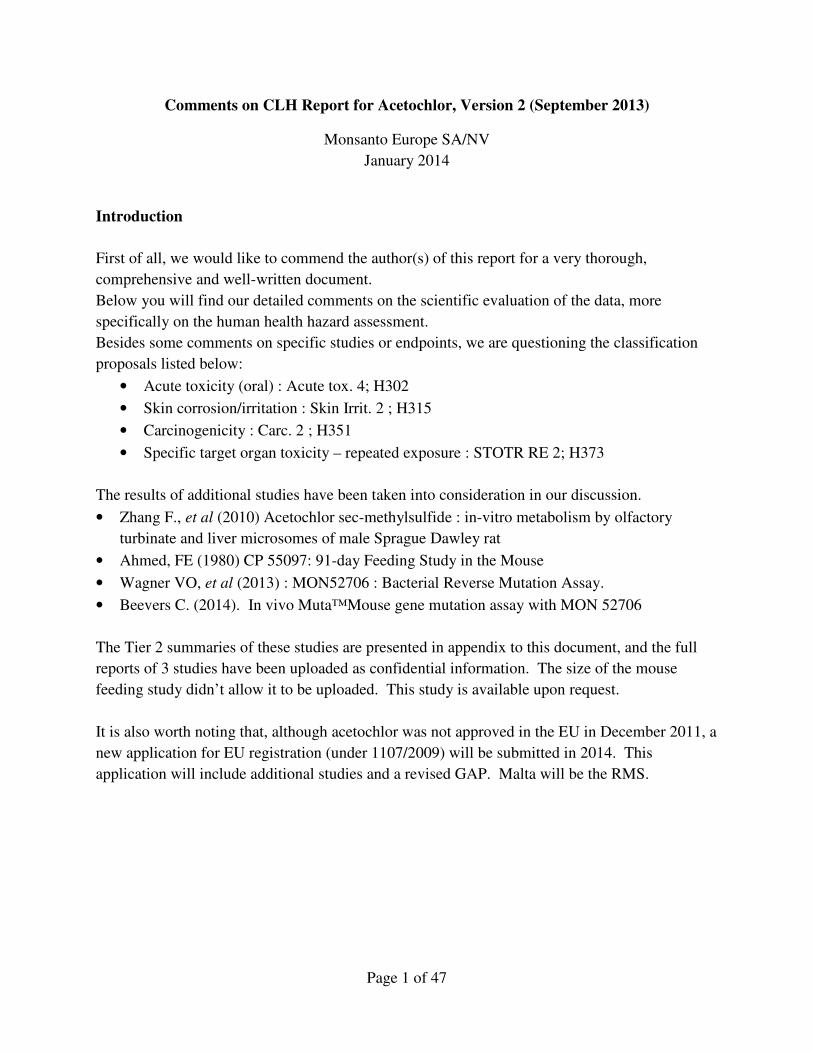
Page 1 of 47 Comments on CLH Report for Acetochlor, Version 2 (September 2013) Monsanto Europe SA/NV January 2014 Introduction First of all, we would like to commend the author(s) of this report for a very thorough, comprehensive and well-written document. Below you will find our detailed comments on the scientific evaluation of the data, more specifically on the human health hazard assessment. Besides some comments on specific studies or endpoints, we are questioning the classification proposals listed below: • Acute toxicity (oral) : Acute tox. 4; H302 • Skin corrosion/irritation : Skin Irrit. 2 ; H315 • Carcinogenicity : Carc. 2 ; H351 • Specific target organ toxicity – repeated exposure : STOTR RE 2; H373 The results of additional studies have been taken into consideration in our discussion. • Zhang F., et al (2010) Acetochlor sec-methylsulfide : in-vitro metabolism by olfactory turbinate and liver microsomes of male Sprague Dawley rat • Ahmed, FE (1980) CP 55097: 91-day Feeding Study in the Mouse • Wagner VO, et al (2013) : MON52706 : Bacterial Reverse Mutation Assay. • Beevers C. (2014). In vivo Muta™Mouse gene mutation assay with MON 52706 The Tier 2 summaries of these studies are presented in appendix to this document, and the full reports of 3 studies have been uploaded as confidential information. The size of the mouse feeding study didn’t allow it to be uploaded. This study is available upon request. It is also worth noting that, although acetochlor was not approved in the EU in December 2011, a new application for EU registration (under 1107/2009) will be submitted in 2014. This application will include additional studies and a revised GAP. Malta will be the RMS.
Transcript of Monsanto Europe SA/NV January 2014 - Homepage -...
Page 1 of 47
Comments on CLH Report for Acetochlor, Version 2 (September 2013)
Monsanto Europe SA/NV
January 2014
Introduction
First of all, we would like to commend the author(s) of this report for a very thorough,
comprehensive and well-written document.
Below you will find our detailed comments on the scientific evaluation of the data, more
specifically on the human health hazard assessment.
Besides some comments on specific studies or endpoints, we are questioning the classification
proposals listed below:
• Acute toxicity (oral) : Acute tox. 4; H302
• Skin corrosion/irritation : Skin Irrit. 2 ; H315
• Carcinogenicity : Carc. 2 ; H351
• Specific target organ toxicity – repeated exposure : STOTR RE 2; H373
The results of additional studies have been taken into consideration in our discussion.
• Zhang F., et al (2010) Acetochlor sec-methylsulfide : in-vitro metabolism by olfactory
turbinate and liver microsomes of male Sprague Dawley rat
• Ahmed, FE (1980) CP 55097: 91-day Feeding Study in the Mouse
• Wagner VO, et al (2013) : MON52706 : Bacterial Reverse Mutation Assay.
• Beevers C. (2014). In vivo Muta™Mouse gene mutation assay with MON 52706
The Tier 2 summaries of these studies are presented in appendix to this document, and the full
reports of 3 studies have been uploaded as confidential information. The size of the mouse
feeding study didn’t allow it to be uploaded. This study is available upon request.
It is also worth noting that, although acetochlor was not approved in the EU in December 2011, a
new application for EU registration (under 1107/2009) will be submitted in 2014. This
application will include additional studies and a revised GAP. Malta will be the RMS.

Page 2 of 47
Page 3 of 47
PART B : SCIENTIFIC EVALUATION OF THE DATA
4. HUMAN HEALTH HAZARD ASSESSMENT
A brief summary of our two major comments on this section are provided below.
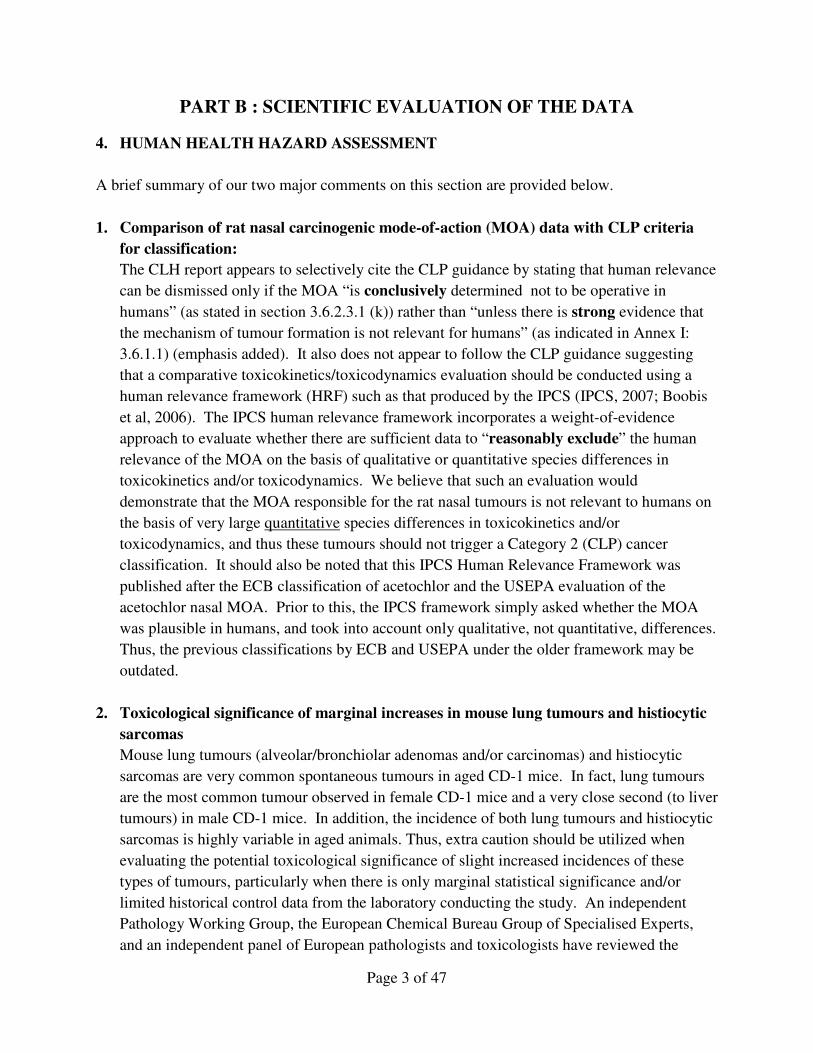
1. Comparison of rat nasal carcinogenic mode-of-action (MOA) data with CLP criteria
for classification:
The CLH report appears to selectively cite the CLP guidance by stating that human relevance
can be dismissed only if the MOA “is conclusively determined not to be operative in
humans” (as stated in section 3.6.2.3.1 (k)) rather than “unless there is strong evidence that
the mechanism of tumour formation is not relevant for humans” (as indicated in Annex I:
3.6.1.1) (emphasis added). It also does not appear to follow the CLP guidance suggesting
that a comparative toxicokinetics/toxicodynamics evaluation should be conducted using a
human relevance framework (HRF) such as that produced by the IPCS (IPCS, 2007; Boobis
et al, 2006). The IPCS human relevance framework incorporates a weight-of-evidence
approach to evaluate whether there are sufficient data to “reasonably exclude” the human
relevance of the MOA on the basis of qualitative or quantitative species differences in
toxicokinetics and/or toxicodynamics. We believe that such an evaluation would
demonstrate that the MOA responsible for the rat nasal tumours is not relevant to humans on
the basis of very large quantitative species differences in toxicokinetics and/or
toxicodynamics, and thus these tumours should not trigger a Category 2 (CLP) cancer
classification. It should also be noted that this IPCS Human Relevance Framework was
published after the ECB classification of acetochlor and the USEPA evaluation of the
acetochlor nasal MOA. Prior to this, the IPCS framework simply asked whether the MOA
was plausible in humans, and took into account only qualitative, not quantitative, differences.
Thus, the previous classifications by ECB and USEPA under the older framework may be
outdated.
2. Toxicological significance of marginal increases in mouse lung tumours and histiocytic
sarcomas
Mouse lung tumours (alveolar/bronchiolar adenomas and/or carcinomas) and histiocytic
sarcomas are very common spontaneous tumours in aged CD-1 mice. In fact, lung tumours
are the most common tumour observed in female CD-1 mice and a very close second (to liver
tumours) in male CD-1 mice. In addition, the incidence of both lung tumours and histiocytic
sarcomas is highly variable in aged animals. Thus, extra caution should be utilized when
evaluating the potential toxicological significance of slight increased incidences of these
types of tumours, particularly when there is only marginal statistical significance and/or
limited historical control data from the laboratory conducting the study. An independent
Pathology Working Group, the European Chemical Bureau Group of Specialised Experts,
and an independent panel of European pathologists and toxicologists have reviewed the

Page 4 of 47
acetochlor data and available historical control information and concluded that the
marginally increased incidences of both lung tumours and histiocytic sarcomas observed in
the long-term mouse studies with acetochlor were not treatment-related. The USEPA has
concluded that both of these tumours were only equivocally and/or possibly related to
treatment with acetochlor, and that neither of them were a “tumor of concern for human
exposure”. Therefore, the mouse lung tumours and histiocytic sarcomas should not be
considered relevant for the purposes of classification.
The following pages provide more details concerning these comments, as well as a number of
additional comments, several of which are relatively minor and unlikely to impact the EChA
conclusions or classifications but are provided to help improve the accuracy and/or completeness
of the report.
4.1. Toxicokinetics
4.1.1. Non-human information
Although we generally agree with the information provided in this section, we believe that the
discussion of p-OH sec-methyl sulfoxide should be emphasized as the primary route of quinone
imine formation and that the discussion of p-OH EMA as a route of formation should be
deemphasized. The weight-of-evidence indicates that ethylmethylaniline (EMA) is likely to be,
at most, only a very minor precursor to DABQI formation relative to the sulfoxide metabolite.
Although EMA was initially believed to be the key precursor responsible for DABQI formation,
it was later determined that this was due to flawed experimental conditions that either favored
EMA formation (i.e., in vitro studies conducted without an NADPH-regenerating system) or that
resulted in the inadvertent removal of the sulfoxide moiety (i.e., protein binding studies
conducted using 6N HCl). Subsequent studies have demonstrated that the sulfoxide metabolite is
the key precursor to DABQI formation following acetochlor administration and that EMA plays,
at most, only a very minor role.
Further support for this position can be found in the report on the in vitro metabolism of
acetochlor sec-methyl sulfide in rats (Zhang, Hansen, and Saghir 2010), which is included along
with this submission (Tier summary in appendix to this document, and full report uploaded as
confidential information). Results from the study strongly support a pathway involving p-OH
sec-methyl sulfoxide as the primary route of quinone imine formation. We recommend that the
metabolic pathway showing the major metabolic transformations of acetochlor in the rat in
Figure 1 should be replaced with the attached modified pathway. The main difference between
the revised figure and the original one is that formation of p-OH EMA and its subsequent
conversion to quinone imine has been removed because we do not consider it to be a major
pathway.

Page 5 of 47
N
O Cl
O GIT
N
O Cl
OH
N
O Cl
OGlu
NH
O Cl
NH
O SG
N
O SG
O
N
O SCys-NAc
O
Liver
NH
O SCys-NAc
NH
O Cl
N
O Cl
OH NH
O SH
GIT
Nasal tissue
NH
O S O
HO
N
O S O
O
(a) (b)
(d) (e)
(h) (g) (f)
(i)
NH
O S O
Liver
NH
O S O
O NH
O S
(c)
Figure 1 : Major metabolic pathway of acetochlor in the rat
(Simplified version of a very complex pathway. A number of minor metabolites, including those
formed following hydroxylation of the alkyl group side chains, are not shown).

Page 6 of 47
Metabolites with potential to exceed 0.1 µg/L only in exceptional circumstance (t-NCA)
We agree with the conclusion (page 29) that the weight of evidence suggests that the metabolite
norchloroacetochlor (t-NCA) is not a clastrogenic agent in vitro and in vivo. However, to
address the potential mutagenicity concerns previously raised during the EU review, an Ames
assay was repeated, and a MutaTMMouse in vivo gene mutation assay just conducted with t-NCA.
No evidence of genotoxicity was noted in either assay, which further supports the overall weight-
of-evidence that t-NCA does not have any significant genotoxic potential. A summary of these
studies is provided in appendix to this document, and the full reports have been uploaded as
confidential information.
4.1.2 Human information
The weight of evidence indicates that ethylmethylaniline (EMA) is likely to be at most only a
very minor precursor to DABQI formation relative to the sulfoxide metabolite (as discussed in
4.1). Based on an article by Coleman et al (2000), the CLH report concludes that human liver
microsomes have similar rates of metabolism of acetochlor to CMEPA (dealkylated acetochlor,
which we refer to as sec-acetochlor) as rat liver microsomes, and that the subsequent rate of
metabolism from CMEPA to EMA is greater in humans than in rats. The CLH report then
concludes that EMA is “plausibly carcinogenic” because it could be further metabolized to a
quinoneimine (DABQI).
The fact that EMA may possibly be metabolized to trace levels of DABQI formation in humans
does not necessarily mean that it should be considered carcinogenic to humans. Quantitative
species differences in formation of EMA in vivo as well as its subsequent conversion to DABQI
should be considered in the assessment, as indicated by the IPCS human relevance framework
cited above.
In addition, there are several aspects to the Coleman et al. (2000) publication that should be
noted:
•••• Coleman et al. suggest that the genotoxicity and carcinogenicity of the acetanilides is directly
related to the rate of hepatic dealkylation of the parent chloroacetanilide to the corresponding
2-chloro-N-(2,6-dialkylphenyl)acetamide (CDAPA; CMEPA for acetochlor and metolachlor,
CDEPA for alachlor and butachlor) and then subsequent metabolism to either DEA (for
alachlor and butachlor) or EMA (for acetochlor and metolachlor). However, the rate of
production of CDAPA or DEA/EMA in the liver does not appear to correlate with the in vivo
toxicology findings. For example, none of the chemicals tested by Coleman et al. produced a
genotoxic response in the in vivo rat liver UDS assay except at hepatotoxic dose levels. In
addition, metolachlor was the only acetanilide tested that produced liver tumours below the
MTD but it was ranked last by Coleman et al. in CDAPA formation. In contrast, acetochlor
was reported to produce the most CDAPA by Coleman et al., yet it produced an increased

Page 7 of 47
incidence of liver tumours only at a dose level greatly exceeding the MTD. There was also
no relationship to nasal tumour production since alachlor was the most potent nasal
carcinogen but was ranked second to last in hepatic CDAPA formation. Finally, no nasal
tumours were noted in two long-term feeding studies in mice despite the fact that CDAPA
was the primary plasma metabolite.
•••• Coleman et al. (2000) apparently did not include an NADPH-regenerating system, which is
generally considered obligatory for oxidative reactions catalyzed by mammalian cytochrome
P-450 enzymes, when evaluating the formation of DEA and EMA from CDAPA. As a
consequence, the conversion of the CMEPA (sec-acetochlor) to EMA by hepatic arylamidase
was measured only in the absence of a competing metabolic pathway. In contrast, they
reported that no EMA was detected after a 20-minute incubation of parent acetochlor in the
presence of an NADPH-regenerating system and only very low levels were detected after a
one-hour incubation. Thus, the results from all such in vitro experiments conducted in the
absence of an NADPH-regenerating system (including several previously conducted by
Monsanto) should be interpreted with extreme care.
Page 8 of 47
4.2 Acute Toxicity:
4.2.1. Non-human information
4.2.1.1. Acute toxicity : oral
The acute oral LD50 for males in the Cummins study should be 4238 mg/kg, as reported in Table
14, not 2389 mg/kg as indicated in text.
4.2.4. Comparison with criteria
We disagree with the proposal to classify acetochlor for acute oral toxicity. The weight of
evidence from two acute oral toxicity studies indicates that the rat oral LD50 is greater than 2000
mg/kg. There were no significant differences between sexes in either study and the combined
LD50 of 2148 mg/kg from the cited study (Branch, 1982) as well as the male (4238 mg/kg) and
female (4015 mg/kg) LD50 values from the other study (Cummins, 1986) do not meet the
criteria for classification. Thus, acetochlor should not be classified for acute oral toxicity.
4.4. Irritation
4.4.1 Skin irritation
4.4.1.4. Comparison with criteria
Acetochlor was severely irritating in a 4-hr skin irritation study using test material produced by
ICI (Barlow and Ishmael, 1989), but was essentially non-irritating in a study conducted using
more stringent conditions (24-hour exposures to both abraded and unabraded skin) using test
material produced by Monsanto (Branch, 1982). The fact that more stringent conditions were
utilized in the Branch (1982) study, which was conducted prior to publication of OECD
guidelines, should not result in it being considered unacceptable, as indicated in Table 15. The
discrepancy in the results between the two studies may be due to the difference in purity of the
test materials used (89.4% for the ICI material vs. 96.3% for the Monsanto material). It should
be noted that ICI no longer produces acetochlor and that the test material used in the Branch
study is more representative of the technical material currently being produced by Monsanto.

Page 9 of 47
4.7. Repeated dose toxicity
4.7.1.1.1. Short term oral toxicity studies
For the Broadmeadow (1989) study, Tables 18 and 21, and text on pages 50 & 56, indicate that 2
mg/kg/day should be a LOAEL instead of a NOAEL because of the presence of granuloma in
one male and one female, and reduced glycogen in one male. However, no granulomas were
noted in males or females at either 10 or 50 mg/kg/day, which strongly indicates that the lesions
at 2 mg/kg/day were not treatment related. In addition, single animals with reduced glycogen
were also noted in the control and 10 mg/kg/day female groups. Thus, the weight of evidence
supports the previous PRAPeR (and USEPA) conclusion that 2 mg/kg/day was the NOAEL for
this study.
Oral short term toxicity studies in dogs :
Testicular effects in dogs: The paragraph immediately preceding Table 19 states, “At first,
findings observed in testes were associated with lymphocytic orchitis …” . This should be
clarified to indicate that Creasy concluded that only the testicular lesions in one of five dogs at
10 mg/kg/day were attributed to lymphocytic orchitis. This was the only animal in the study that
exhibited multifocal tubular necrosis with associated lymphoid infiltrate. The testicular lesions
in the high-dose animals (tubular degeneration, maturation arrest, spermatid giant cells,
Epidimydes hypospermia) were all attributed to test article administration, but in absence of
lymphocytic orchitis. The observation of lymphocytic orchitis, a pathology commonly
encountered in beagle dogs, in one dog at 10 mg/kg and at none of all the other dose levels
confirms that this lesion is incidental and not related to treatment . The fact that no testicular
lesions were observed at 12 mg/kg/day in the other 1-yr dog study supports this conclusion.
4.7.1.10. Conclusions on classification for repeat dose toxicity
We agree that the kidney and liver are target organs following high doses of acetochlor.
However, the conclusion that “severe effects on kidney (interstitial nephritis, chronic vasculitis
and tubular basophilia) and liver (fatty infiltration) were observed after repeated exposure below
the cut-off levels”, and that these findings justify R48/22 classification, does not appear to be
warranted based on the following:
•••• The interstitial nephritis and/or chronic vasculitis reported in the kidneys from a few male
dogs at 10 mg/kg/day from one 12-month dog study (Broadmeadow, 1989) were reported to
be of “minimal” severity (individual histopathology data). Minimal severity is generally
considered to be a histologic change that barely exceeds the normal limits and that is unlikely
to produce any functional impairment. As such, these findings should not trigger
classification.

Page 10 of 47
•••• An increased incidence of renal tubular basophilia was reported in male mice at 1.1
mg/kg/day in the 18-month mouse study (Amyes, 1989). However, the severity of the lesion
in all animals at this level was minimal, there was no clear dose-response, and no such
findings were reported even at ~500-fold higher dose levels in a 23-month mouse study
(Ahmed, 1981). These findings were not considered evidence of a treatment-related adverse
effect by either the USEPA or Japan FSC. Therefore, we believe that these findings were of
questionable toxicological significance and should not trigger classification. This is further
supported by the lack of renal effects in the mouse 90-day study (Ahmed, 1980). A Tier
summary of this study is provided in appendix and the study is available upon request.
•••• Moderate diffuse fatty infiltration of the liver was reported in one male dog at 12 mg/kg/day
in the other 12-month dog study (Ahmed, 1981) but was not accompanied by any treatment-
related changes in liver weight or clinical pathology. The few statistically significant
differences in LDH, SGOT or cholesterol at this dose level were sporadic (only seen
occasionally despite being evaluated monthly throughout the study), were similar to the
values seen in control animals at other time points in this study, and were well within the
normal historical control ranges for beagle dogs of this age. In addition, the fatty infiltration
observed in 1/6 animals at the higher dose was scored as “mild”. Thus, it is our opinion that
the finding of fatty infiltration of the liver in the 12 mg/kg animal is of questionable
toxicological significance and not sufficient to trigger classification,

Page 11 of 47
4.9. Germ cell mutagenicity
4.9.1. Non-human information
In vitro gene mutation studies
•••• The text in the 3rd
paragraph (page 65) states that “Nevertheless, the concentrations which
induce[d] a mutagenic response in the 1st study were not tested in the 2
nd.” We believe this is
erroneous as the 2nd
study included concentrations that were higher than the 1st study (e.g., no
mutagenic response at 150 or 200 µg/ml in the 2nd study compared to weakly positive
responses at 125 and/or 150 µg/ml in the 1st study).
•••• Although the 3rd
paragraph states that purity was unspecified, the purity of the test material
used in the mouse lymphoma assay (Mitchell et al., 1982) was specified as 95.6% in the
appendix of the study report. A similar statement about lack of purity information was also
mentioned on page 79, section 4.9.1.1.2.
In vivo genotoxicity : Chromosomal aberrations
Page 68 of the CLH report (related to in-vivo studies) indicates that two of the three studies
evaluating chromosomal aberrations “were not considered acceptable, either by the absence of
toxicity or cytotoxicity at the highest dose tested (Farrow and Cortina, 1983) or because no
certainty that the bone marrow has been exposed to the test substance (Cavagnaro and Cortina,
1985).” Similar statements were made elsewhere (Table 24, pages 85 and 87). Although a third
study was considered acceptable, we believe that the rationales cited for rejection of the first two
studies are incorrect for the following reasons:
•••• Farrow and Cortina (1983): The highest dose tested (500 mg/kg) in this rat bone marrow
chromosomal aberration study caused a statistically significant decrease in body weight gain
in both males and females over the 48-hr test period. In addition, this dose level was one-
half of the dose (1000 mg/kg) that caused 75% mortality in the range-finding study. Thus,
the highest dose level tested should be considered acceptable.
•••• Cavagnaro and Cortina (1985): The highest dose tested in this mouse bone marrow
micronucleus study (2000 mg/kg) is the limit dose according to the current OECD guideline,
and caused mortality in 43% (23/54) of the animals dosed, with an apparent decrease in the
PCE/NCE ratio in surviving high-dose animals. In addition, clinical signs of toxicity were
noted at both 2000 and 660 mg/kg. Furthermore, previous ADME studies have demonstrated
that acetochlor is well-absorbed after oral administration to rodents and is found at
significant levels in the blood and bone marrow. Since bone marrow is a highly perfused
tissue, the levels of acetochlor and/or its metabolites in bone marrow should be similar to that
observed in the blood (Guidance for Industry, S2(R1) Genotoxicity Testing and Data
Interpretation for Pharmaceuticals Intended for Human Use, US FDA, ICH, June 2012).

Page 12 of 47
Therefore, based on the toxicity and ADME data, there should be high confidence that the
bone marrow was indeed sufficiently exposed to the test material.
In-vivo genotoxicity : Comet assay
The CLH report indicates that the rat nasal comet assay was not considered acceptable due to an
inappropriate rationale for the dose level used (1750 ppm). We disagree with this criticism for
the following reasons:
•••• This study was intended to determine if there was any evidence of chromosomal or DNA
damage in nasal turbinates at a dose level (1750 ppm) that slightly exceeded the chronic
MTD and produced nasal tumors in rats. This would help determine if there was a genotoxic
or non-genotoxic mode of action for the formation of these tumours.
•••• Although body weight data were not reported for this study, clear evidence of toxicity was
noted at the same or similar dose levels in other studies. Decreased food consumption,
decreased body weights, increased organ weights and/or nasal pathology (including tumors)
were observed after a similar duration of exposure at 1750 ppm in two 2-generation rat
reproduction studies (Milburn, 2001; Willoughby, 1989). In addition, significantly decreased
food consumption and body weight gain and increased relative liver and kidney weights were
noted at 2000 ppm in a previous 90-day rat study (Broadmeadow, 1986).
In vivo genotoxicity - Dominant lethal assays
The text and Table 25 indicates that no toxicity was observed in 3 of the dominant lethal studies.
However, we believe this is inaccurate for 2 of the 3 studies. Decreases in body weight (~7.5%)
and cumulative weight gain (~27%) were noted in the high-dose (2000 ppm) male rats after 9
weeks of dosing in the Naylor (1987) study. Initial weight loss followed by decreases (generally
~5%) in body weight were observed in high-dose (3500 ppm) male mice in the Milburn (1986b)
study. In addition, although a minor detail, the rats used in the Naylor study were Charles River
Sprague Dawley rats, not Alderly Park (Alpk AP (SD)) rats, and the high-dose level in this study
was 2000 ppm, not 1500 ppm as reported near the top of page 102 (section 4.9.1.2.3).

Page 13 of 47
4.10. Carcinogenicity
4.10.1. Non-human information
4.10.1.1.2. Oral carcinogenesis in mice
Non-neoplastic kidney findings in 78-wk mouse study (Amyes, S.J. (1989))
The last two sentences of text prior to Table 45.8 state, “Significantly increase[d] incidence of
renal tubular basophilia was noted in males from the dose level of 10 ppm. In addition, there
was a low incidence of hyperplasia of the renal tubular epithelium which achieved statistical
significance in male which received 1000 ppm (p≤0.05).” Unfortunately, the last sentence may
be misleading as it could be interpreted to mean that tubular hyperplasia was also noted at 10
ppm. In fact, as shown in the table below, there was no renal tubular hyperplasia observed in
males at 10 ppm, and only a single occurrence at 100 ppm. In addition, although the incidence
of hyperplasia at 1000 ppm was statistically significant (p≤ 0.05) when evaluating only those
animals sacrificed at 78 weeks (4/34), it was not statistically significant when evaluating all 50
animals assigned to the oncogenic portion of the study (4/50). For clarity, we suggest that the
following data for hypertrophy and hyperplasia be added to Table 45.8.
Selected Renal Tubular Lesions in 18-Month Mouse Oncogenicity Study (Amyes, 1989)
Males Females
Dose (ppm) 0 10 100 1000 0 10 100 1000
# animals examined 50 50 50 50 50 50 50 50
hypertrophy 1 1 0 3 0 1 1 1
hyperplasia 0 0 1 4 0 0 0 0
** p≤ 0.05
** p ≤ 0.01
4.10.3. Other relevant information
These pages cite USEPA conclusions from the fourth and fifth Cancer Assessment Review
Committee (CARC) reports. More recent EPA wording regarding the mouse tumours varies
slightly depending on the document, but all conclude that the evidence for mouse tumours being
related to acetochlor treatment is weak or equivocal.123
1 Human Health Risk Assessment (January 22, 2007) (http://www.regulations.gov/#!documentDetail;D=EPA-HQ-OPP-2006-
0203-0005) 2 Pesticide Tolerance, Final Rule (May 16, 2007) (http://www.gpo.gov/fdsys/pkg/FR-2007-05-16/pdf/E7-9430.pdf) 3 Human Health Risk Assessment (July 1, 2009) (http://www.regulations.gov/#!documentDetail;D=EPA-HQ-OPP-2009-0002-
0005)

Page 14 of 47
Alachlor
•••• To avoid potential confusion, it should be noted that the two forestomach tumours noted in
one of the acetochlor chronic rat studies are very different from the glandular stomach
tumours observed with alachlor.
•••• It would be useful to also indicate the 2004 EFSA PPR conclusion for rat nasal tumors
produced by alachlor: “While the mode of action could be relevant to humans, it is extremely
unlikely that concentrations of the active metabolite would be achieved to initiate the chain
of events terminating in cancer” [emphasis added].
•••• It might also be worth mentioning that the nasal tumour potency for acetochlor is
significantly less than that of alachlor, which would suggest the likelihood of acetochlor
being carcinogenic in humans is even less than “extremely unlikely”.
•••• The last sentence in the 2nd
paragraph states, “It was concluded to classify alachlor with R40
based on the same tumours found in rats and mice after administration of acetochlor (ECB,
2002)” [emphasis added]. That sentence appears to be misleading as alachlor did not
produce forestomach tumours in rats or histiocytic sarcomas in mice. Although a slight
increase in incidence of lung tumours was noted in mice, it was within the historical control
range and was not considered treatment related by ECCO (Doc. SANCO/4330/2001 rev. 3-1
(18.09.2003)) or the USEPA.
Tumours findings for related acetanilides (Table 46)
•••• Both alachlor and butachlor produced the same type of tumors in the glandular stomach of
the rat. These are very different than the two forestomach tumours noted in one of the three
acetochlor chronic rat studies.
•••• Several rat nasal epithelial tumors were also produced by metolachlor, which is classified by
the EPA as a Group C or Possible human carcinogen, not “probable” as is indicated in the
table.

Page 15 of 47
4.10.4. Summary and discussion of carcinogenicity
4.10.4.1 Carcinogenesis in rats
Mode of action for nasal tumours
The weight-of-evidence indicates that ethylmethylaniline (EMA) is likely to be, at most, only a
very minor precursor to DABQI formation relative to the sulfoxide metabolite. Although EMA
was initially believed to be the key precursor responsible for DABQI formation, it was later
determined that this was due to flawed experimental conditions that either favored EMA
formation (i.e., in vitro studies conducted without an NADPH-regenerating system) or that
resulted in the inadvertent removal of the sulfoxide moiety (i.e., protein binding studies
conducted using 6N HCl). Subsequent studies have demonstrated that the sulfoxide metabolite is
the key precursor to DABQI formation following acetochlor administration and that EMA plays,
at most, only a very minor role. However, the fact that the EMA pathway plays no more than a
minimal role is not always apparent in the CLH discussions.
For example:
• page 137, first paragraph: The relative importance of the two potential pathways leading to
DABQI from acetochlor is not indicated. Although DABQI was originally believed to result
from para-hydroxylation of EMA, it was later demonstrated that the vast majority of the
DABQI produced from acetochlor was derived from p-hydroxylation of sulfoxide metabolite.
Some studies have suggested that small amounts of EMA can be produced in the liver in
vitro but this has not been confirmed in vivo (e.g., EMA was not identified in rat plasma).
This is in contrast to alachlor where DEA phenol sulfate (a metabolite of the corresponding
DEA analog of EMA) and several other metabolites that could potentially lead to DABQI
were observed in addition to the corresponding alachlor sulfoxide.
•••• page 139, 4th
and 5th
paragraphs; bottom of page 141; and top of page 142: Initially, the
acetochlor-protein adducts found in rat nasal tissue were believed to originate from 3-ethyl,
5-methyl-benzoquinoneimine (EMIQ). However, it was later determined that these adducts
contained the sulfoxide side chain and thus probably resulted from binding with the
sulfoxide, not EMA (Green, 2001). Unfortunately, the experimental conditions used in the
initial experiment inadvertently removed this side chain. Thus, it may be more accurate to
modify the text to replace “EMIQ” with “EMIQ-sulfoxide” or more simply “DABQI”. In
addition, the statement at the top of page 142 that “the analysis of adducts cannot distinguish
whether it is originated from the sulfide or EMA” is misleading. As previously indicated, the
analytical method used by Green (2001) did distinguish between the sulfoxide and EMA.
Unfortunately, the method used in the previous assays did not.
•••• page 144, discussions regarding EMA: Based on the in vitro data, we cannot exclude the
possibility that very small amounts of EMA may be produced by humans. However, the p-
hydroxylation rate of EMA in primate nasal tissue is substantially (~24-fold) less than in rats.

Page 16 of 47
Please also see additional comments regarding EMA in the previous Toxicokinetics section
and in the subsequent section on Carcinogenicity - comparison with criteria.
4.10.4.2. Carcinogenesis in mice
Lung tumours in CD-1 mice
•••• There appear to be some minor errors in Table 49. The Life Science Research (LSR) data is
based on 13 studies of 18-month duration, not 11. In addition, the data shown for 24-month
studies at LSR is actually from Inveresk.
•••• It should be noted on pages 149-150 that the initial EPA comparison of “censored” data
from the acetochlor chronic studies to “uncensored” historical control data was inappropriate
as the denominators used for calculating the incidence are different (EPA excludes all
animals dying prior to the first observation of a tumour, which generally results in an
increase in the calculated incidence value). It is not possible to use the EPA approach for
historical control data. Thus, while it may be appropriate to use censored incidence data for
EPA calculations of cancer slope factor, these values should not be used for other purposes,
esp. comparing to uncensored historical control data.
•••• The in-house LSR historical data was based on only 13 studies of 18-month duration. No
historical control data were available from the contract laboratory conducting the 23-month
study. Therefore, we believe that use of additional historical control data from studies
conducted elsewhere at approximately the same time is appropriate for use with both studies.
We agree with the factors listed for the weight of evidence evaluation of the toxicological
significance of the incidence of the lung tumours, except for the use of historical control data (as
commented above). However, in our opinionthe results of this analysis strongly indicate that the
association is too weak for classification.
4.10.5. Comparison with criteria:
The 7th paragraph on page 152 states, “The CLP guidance (chapter 3.6.2.3.2(k) states that “only
if a mode of action of tumour development is conclusively determined not to be operative in
humans then the carcinogenic evidence for that tumour may be discounted.”
Although the quote is accurate, the use of the word “conclusively” in this sentence appears to be

Page 17 of 47
somewhat inconsistent with the text in Annex I to CLP regulation point 3.6.1.1 which states,
“Substances which have induced benign and malignant tumours in well performed experimental
studies on animals are considered also to be presumed or suspected human carcinogens unless
there is strong evidence that the mechanism of tumour formation is not relevant for humans”
(emphasis added). The criteria for “strong” rather than “conclusive’ evidence is more consistent
with the rest of section 3.6.2.3.2 (k) which states that the mode of action evaluations should be
conducted on a case-by-case basis taking into consideration “comparative
toxicokinetics/toxicodynamics between the animal test species and humans to determine the
relevance of the results to humans”, and the recommendation that the IPCS Framework for
Analyzing the Relevance of a Cancer Mode of Action for Humans (WHO, 2007; Boobis et al,
2006) should be used for the evaluation. The IPCS and similar frameworks are also cited in the
introduction to section 3.6.2.3.
The IPCS Human Relevance Framework (HRF) asks the following 3 questions:
(1) Is the WOE sufficient to establish the carcinogenic MOA in animals?
(2) Can the human relevance of the MOA be reasonably excluded on the basis of
qualitative differences in key events between animals and humans?
(3) Can the human relevance of the MOA be reasonably excluded on the basis of
quantitative differences in either kinetics or dynamics between animals and humans?
For acetochlor, each of the three questions above is addressed below.
(1) The answer to the first question is YES - a non-genotoxic, threshold-mediated
carcinogenic MOA for acetanilide-induced rat nasal tumours has been well-established.
The key event is the formation of a reactive DABQI metabolite that forms adducts with
nasal proteins and induces cytotoxicity, prolonged cell proliferation, and eventual
development of nasal olfactory tumours. For acetochlor, the predominant pathway
leading to DABQI is para-hydroxylation of the sulfoxide metabolite by the rat olfactory
tissue. However, we cannot exclude the possibility that very small amounts of DABQI
may be formed through the EMA pathway
(2) The answer to the second question is NO – we cannot exclude the theoretical possibility
that the key event, formation of DABQI, would occur to some extent in humans. Both
monkey and human nasal tissues were unable to para-hydroxylate the sulfoxide
metabolite of acetochlor, which is the primary precursor to DABQI in the rat. However,
a very low rate of para-hydroxylation (approximately 4% of the rate in rats) was observed
when monkey nasal tissue was incubated with ethylmethylaniline (EMA) (Green, 1998).
Although EMA was not identified in rat plasma, based on in vitro data, we cannot
exclude the possibility that very minor amounts of EMA may be formed in rats and/or
humans, and subsequently be para-hydroxylated to a DABQI.

Page 18 of 47
(3) The weight of evidence indicates that the answer to the third question is YES – the
carcinogenic MOA can be “reasonably excluded” in humans when taking into account
toxicokinetics and toxicodynamics. Very large species differences in the overall
metabolism of acetochlor indicate that the amount of DABQI produced in rats is
significantly higher than in mice, which do not develop nasal tumours, and at least
several orders of magnitude higher than in primates and humans. The low levels of
DABQI produced in the mouse were not sufficient to lead to detectable accumulation in
nasal tissues, formation of DABQI-protein adducts, nasal cell proliferation or nasal
tumours. The amount of DABQI that theoretically may be produced in humans (from
either sulfoxide or EMA) would be at least several orders of magnitude lower than in
mice (due to much lower rate of para-hydroxylation in humans vs. mice), and thus would
be exceedingly unlikely to initiate the chain of events terminating in cancer.
Based upon similar data for alachlor, the EFSA PPR panel concluded that “While the mode of
action could be relevant to humans, it is extremely unlikely that concentrations of the active
metabolite would be achieved to initiate the chain of events terminating in cancer” [emphasis
added]. Since the carcinogenic potency of acetochlor is significantly lower than that of alachlor,
and since the sulfoxide metabolite is much more prominent with acetochlor than with alachlor
(for which evidence of DEA formation was observed in rat plasma), the likelihood that these
events would occur following exposure to acetochlor would be even lower. Also, it should be
noted that the PPR conclusion on alachlor was published in 2004, which was prior to the
publication in 2006 & 2007 of the IPCS HRF, which asks whether the data are sufficient to
“reasonably exclude” the human relevance of the mode of action instead of whether the
occurrence of the key event would be “plausible” in humans, which was the language used in the
earlier human relevance framework developed by IPCS or ILSI/RSI (Meek et al., 2003). As
discussed in the newer IPCS framework document, the change in wording was made to
recognize that the requirement to demonstrate that a MOA was unequivocally not “plausible” in
humans was too strict, and that “decisions about the adequacy of weight of evidence are not
absolute”.
Therefore, based on the substantial quantitative species differences, it can be concluded
that rat nasal tumours produced by acetochlor are not relevant to humans and should not
trigger classification.
The CLH report indicates that no mode of action data are available for the mouse lung tumours
and histiocytic sarcomas. That is true since it is unlikely that these tumours are treatment related.
Mouse lung tumours (alveolar/bronchiolar adenomas and/or carcinomas) and histiocytic
sarcomas are very common spontaneous tumours in aged CD-1 mice. In fact, lung tumours are
the most common tumour observed in female CD-1 mice and a very close second (to liver
tumours) in male CD-1 mice. In addition, the incidence of both lung tumours and histiocytic
sarcomas is highly variable in aged animals. Thus, extra caution should be utilized when
evaluating the potential toxicological significance of slight increased incidences of these types of
Page 19 of 47
tumours, particularly when there is only marginal statistical significance and/or limited historical
control data from the laboratory conducting the study. An independent Pathology Working
Group, the ECB Group of Specialised Experts, and a more recent independent panel of European
pathologists and toxicologists have reviewed the data and concluded that both the marginal
increases in incidences of lung tumours and histiocytic sarcomas observed in the long-term
mouse studies with acetochlor were not treatment-related. The USEPA has also recently
concluded that the increased incidences of mouse lung tumours and histiocytic sarcomas were
equivocal and/or only possibly related to treatment, and represent no greater than a negligible
risk of cancer.
Therefore, the mouse lung tumours and histiocytic sarcomas should not be considered
relevant for the purposes of classification.
4.10.6. Conclusions on classification and labelling:
The current EPA cancer classification for acetochlor is “suggestive evidence of carcinogenic
potential.” The phrase “probable human carcinogen” was an older classification that was revised
in January 2007 and should be deleted. However, as previously indicated, the most recent EPA
evaluation of the potential human relevance of the MOA for the rat nasal tumours was conducted
in 2004, prior to issuance of the 2007 IPCS Human Relevance Framework which incorporated
quantitative species differences into the evaluation.

Page 20 of 47
4.12. Other effects
4.12.1. Non-human information
4.12.1.2. Immunotoxicity
A 28-day mouse sheep red blood cell assay has recently been completed. No evidence of
immunotoxicity or other toxicity was noted at any dose level. The NOAEL for that study was
approximately 1535 mg/kg/day. This study will be submitted in 2014 along with a new
application for EU Annex I approval.
4.12.2. Summary and discussion
52 weeks oral (capsule) study in dogs (Broadmeadow, 1989)
It would be useful to note that the brain lesions and clinical signs of neurotoxicity noted in one of
the 1-yr dog studies was probably secondary to renal toxicity. The neurological effects were
noted only at 50 mg/kg/day, a level which produced significant renal pathology (nephritis,
hyperplasia of the collecting ducts and pelvic epithelium, cortical atrophy and /or fibrosis,
vasculitis, and sometimes necrosis) in all animals. Surviving high-dose animals exhibited
significantly increased levels of urea, creatinine and BUN. No evidence of brain or kidney
pathology was noted at 40 mg/kg/day in the other 1-yr dog study. Thus, the brain lesions may
have been the result of uremic encephalopathy. The renal toxicity also would have resulted in
less efficient renal clearance and thus substantially higher blood levels of acetochlor and/or its
metabolites, which could have contributed to the neurological effects observed.

Page 21 of 47
Appendix
Tier summaries of studies
• Zhang F., et al (2010) Acetochlor sec-methylsulfide : in-vitro metabolism by olfactory
turbinate and liver microsomes of male Sprague Dawley rat
• Ahmed, FE (1980) CP 55097: 91-day Feeding Study in the Mouse
• Wagner VO, et al (2013) : MON52706 : Bacterial Reverse Mutation Assay.
• Beevers C. (2014). In vivo Muta™Mouse gene mutation assay with MON 52706, Monsanto
Study No. CV-2013-0032
Page 22 of 47
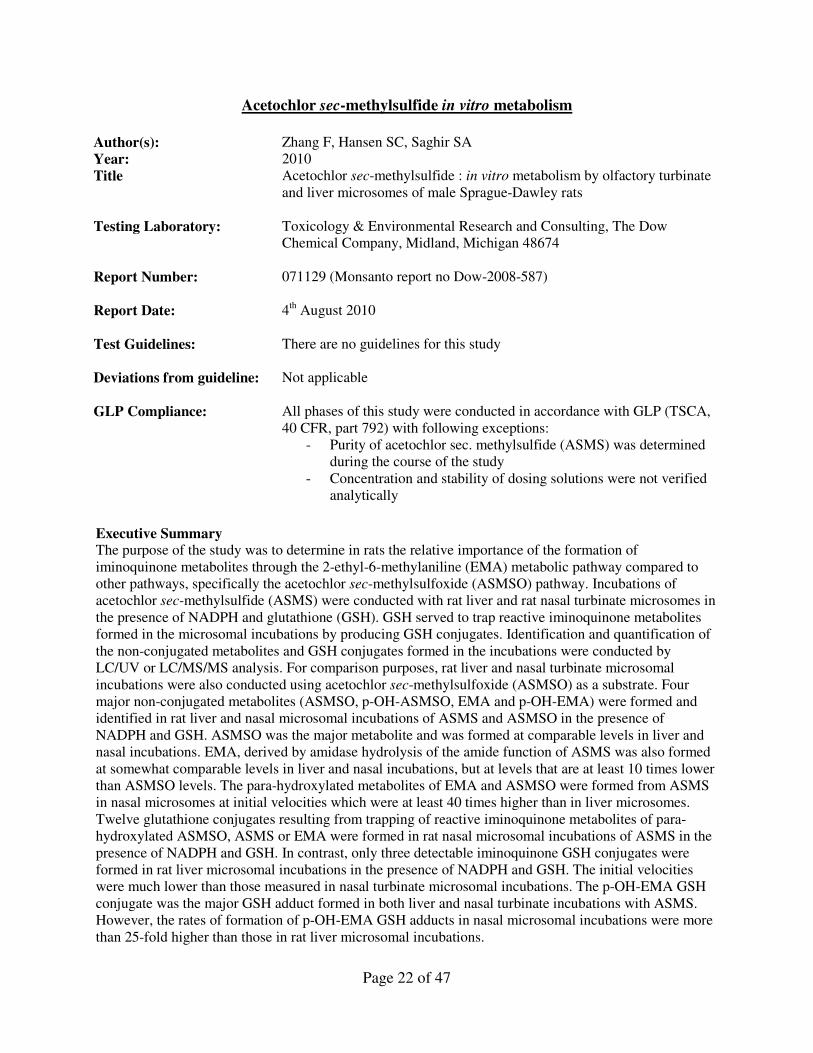
Acetochlor sec-methylsulfide in vitro metabolism
Author(s): Zhang F, Hansen SC, Saghir SA
Year: 2010
Title
Acetochlor sec-methylsulfide : in vitro metabolism by olfactory turbinate
and liver microsomes of male Sprague-Dawley rats
Testing Laboratory: Toxicology & Environmental Research and Consulting, The Dow
Chemical Company, Midland, Michigan 48674
Report Number: 071129 (Monsanto report no Dow-2008-587)
Report Date: 4th August 2010
Test Guidelines: There are no guidelines for this study
Deviations from guideline: Not applicable
GLP Compliance: All phases of this study were conducted in accordance with GLP (TSCA,
40 CFR, part 792) with following exceptions:
- Purity of acetochlor sec. methylsulfide (ASMS) was determined
during the course of the study
- Concentration and stability of dosing solutions were not verified
analytically
Executive Summary The purpose of the study was to determine in rats the relative importance of the formation of
iminoquinone metabolites through the 2-ethyl-6-methylaniline (EMA) metabolic pathway compared to
other pathways, specifically the acetochlor sec-methylsulfoxide (ASMSO) pathway. Incubations of
acetochlor sec-methylsulfide (ASMS) were conducted with rat liver and rat nasal turbinate microsomes in
the presence of NADPH and glutathione (GSH). GSH served to trap reactive iminoquinone metabolites
formed in the microsomal incubations by producing GSH conjugates. Identification and quantification of
the non-conjugated metabolites and GSH conjugates formed in the incubations were conducted by
LC/UV or LC/MS/MS analysis. For comparison purposes, rat liver and nasal turbinate microsomal
incubations were also conducted using acetochlor sec-methylsulfoxide (ASMSO) as a substrate. Four
major non-conjugated metabolites (ASMSO, p-OH-ASMSO, EMA and p-OH-EMA) were formed and
identified in rat liver and nasal microsomal incubations of ASMS and ASMSO in the presence of
NADPH and GSH. ASMSO was the major metabolite and was formed at comparable levels in liver and
nasal incubations. EMA, derived by amidase hydrolysis of the amide function of ASMS was also formed
at somewhat comparable levels in liver and nasal incubations, but at levels that are at least 10 times lower
than ASMSO levels. The para-hydroxylated metabolites of EMA and ASMSO were formed from ASMS
in nasal microsomes at initial velocities which were at least 40 times higher than in liver microsomes.
Twelve glutathione conjugates resulting from trapping of reactive iminoquinone metabolites of para-
hydroxylated ASMSO, ASMS or EMA were formed in rat nasal microsomal incubations of ASMS in the
presence of NADPH and GSH. In contrast, only three detectable iminoquinone GSH conjugates were
formed in rat liver microsomal incubations in the presence of NADPH and GSH. The initial velocities
were much lower than those measured in nasal turbinate microsomal incubations. The p-OH-EMA GSH
conjugate was the major GSH adduct formed in both liver and nasal turbinate incubations with ASMS.
However, the rates of formation of p-OH-EMA GSH adducts in nasal microsomal incubations were more
than 25-fold higher than those in rat liver microsomal incubations.

Page 23 of 47
Similar non-conjugated and GSH conjugated metabolites were formed in a limited number of incubations
of ASMSO in rat liver or nasal turbinate microsomes in the presence of NADPH and GSH. At similar
substrate concentrations, the incubation of ASMSO with nasal turbinate microsomes formed almost 5
times more total GSH conjugates than the incubation of ASMS. The rate of formation of GSH adducts of
p-OH ASMSO in nasal turbinate microsome incubations was found to be more than 10-fold higher when
ASMSO was used as a substrate compared to ASMS. The rate of formation of p-OH EMA GSH adducts
in nasal turbinate microsome incubations was more than 10-fold higher when ASMS was used as a
substrate compared to ASMSO. The vast majority of GSH conjugates formed in nasal turbinate
microsomal incubations of ASMSO are formed from p-OH-ASMSO (> 98%), unlike ASMS which
formed reactive iminoquinone metabolites primarily via p-OH-EMA.
The toxicity of acetochlor to the olfactory epithelium is believed to result from site-specific formation of
iminoquinone metabolites which can bind to cysteine residues of essential cell proteins in the olfactory
epithelium. The level of GSH conjugate formation in nasal turbinate microsomes provides a measure of
the relative contributions of the various iminoquinone metabolites to the observed toxicity. ASMSO is the
predominant metabolite circulating in plasma of rats treated with acetochlor. Therefore, the results of this
in vitro study, which show that >98% of iminoquinone metabolites formed from ASMSO in nasal
turbinate microsomes are derived from p-OH-ASMSO, indicate that the p-OH-ASMSO pathway is the
predominant pathway contributing to acetochlor nasal toxicity.
I. MATERIAL AND METHODS
A. MATERIALS
1. Test Materials: Description: Acetochlor sec-methylsulfide, N-(2-ethyl-6-methylphenyl)-
2-(methylsulfanyl) acetamide (ASMS, CAS #: 34256-82-
1)
Appearance: Not reported
Lot/Batch #: GLP-0705-18642-A
Purity/content: 99%
Stability: Test substance was used before the recertification date of
31/05/2009
Description: Acetochlor sec-methylsulfoxide, N-(2-ethyl-6-
methylphenyl)-2-(methylsulfinyl) acetamide (ASMSO)
Appearance: Not reported
Lot/Batch #: GLP-0709-18584-A
Purity/content: 98%
Stability: Test substance was used before the recertification date of
31/10/2009
Description: Acetochlor sec-methylsulfoxide phenol, p-hydroxy
acetochlor sec-methylsulfoxide, N-(2-ethyl-4-hydroxy-6-
methylphenyl)-2-(methylsulfinyl) acetamide (p-OH
ASMSO)
Appearance: Not reported
Lot/Batch #: GLP-0705-18644-A
Purity/content: 98%
Stability: Test substance was used before the recertification date of
31/05/2009
Page 24 of 47
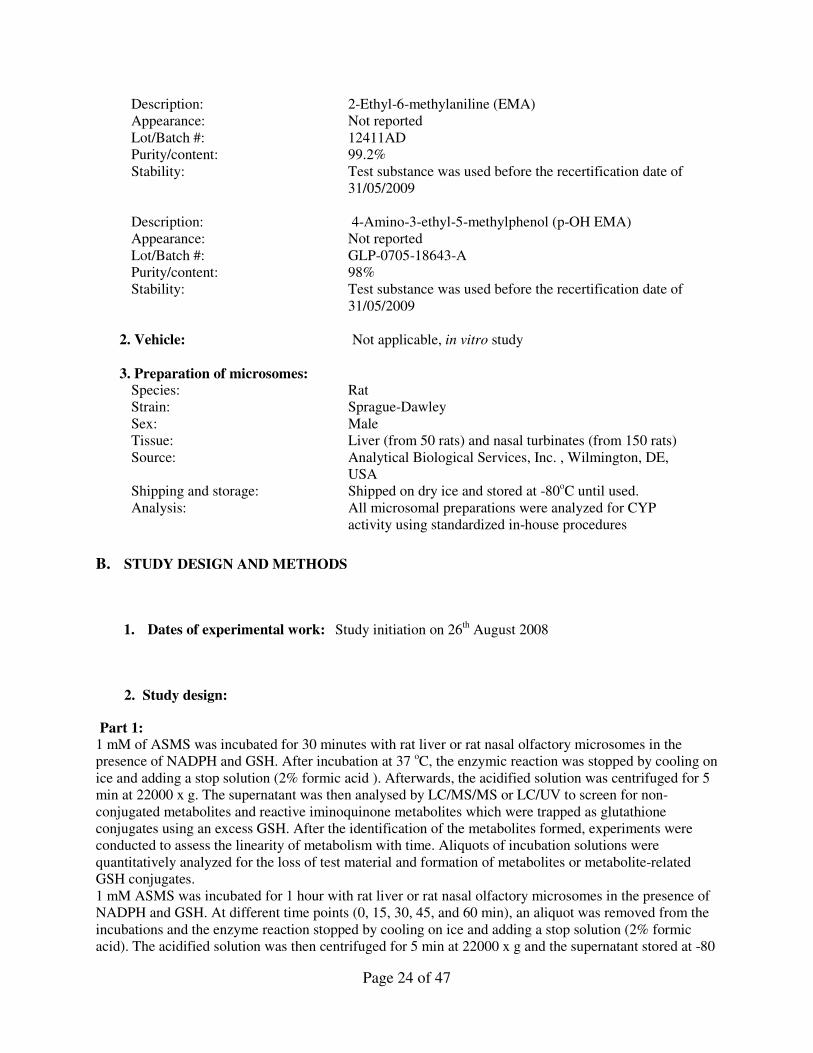
Description: 2-Ethyl-6-methylaniline (EMA)
Appearance: Not reported
Lot/Batch #: 12411AD
Purity/content: 99.2%
Stability: Test substance was used before the recertification date of
31/05/2009
Description: 4-Amino-3-ethyl-5-methylphenol (p-OH EMA)
Appearance: Not reported
Lot/Batch #: GLP-0705-18643-A
Purity/content: 98%
Stability: Test substance was used before the recertification date of
31/05/2009
2. Vehicle: Not applicable, in vitro study
3. Preparation of microsomes: Species: Rat
Strain: Sprague-Dawley
Sex: Male
Tissue: Liver (from 50 rats) and nasal turbinates (from 150 rats)
Source: Analytical Biological Services, Inc. , Wilmington, DE,
USA
Shipping and storage: Shipped on dry ice and stored at -80oC until used.
Analysis: All microsomal preparations were analyzed for CYP
activity using standardized in-house procedures
B. STUDY DESIGN AND METHODS
1. Dates of experimental work: Study initiation on 26th August 2008
2. Study design:
Part 1: 1 mM of ASMS was incubated for 30 minutes with rat liver or rat nasal olfactory microsomes in the
presence of NADPH and GSH. After incubation at 37 oC, the enzymic reaction was stopped by cooling on
ice and adding a stop solution (2% formic acid ). Afterwards, the acidified solution was centrifuged for 5
min at 22000 x g. The supernatant was then analysed by LC/MS/MS or LC/UV to screen for non-
conjugated metabolites and reactive iminoquinone metabolites which were trapped as glutathione
conjugates using an excess GSH. After the identification of the metabolites formed, experiments were
conducted to assess the linearity of metabolism with time. Aliquots of incubation solutions were
quantitatively analyzed for the loss of test material and formation of metabolites or metabolite-related
GSH conjugates.
1 mM ASMS was incubated for 1 hour with rat liver or rat nasal olfactory microsomes in the presence of
NADPH and GSH. At different time points (0, 15, 30, 45, and 60 min), an aliquot was removed from the
incubations and the enzyme reaction stopped by cooling on ice and adding a stop solution (2% formic
acid). The acidified solution was then centrifuged for 5 min at 22000 x g and the supernatant stored at -80
Page 25 of 47
oC pending quantitative analysis. For control experiments, incubations with or without substrate, NADPH,
microsomes, or GSH were carried out. In addition, a control incubation of 1 mM ASMS without NADPH
and duplicate incubations of 1 mM ASMSO in the presence or absence of NADPH were conducted under
similar conditions to further verify the metabolites formed.
Part 2: The results from the Part 1 time-course study showed that the formation rates of most of the non-
conjugated and GSH-conjugated metabolites were linear through 30 min of incubation. Therefore, the
microsomal incubations for determining the kinetics of metabolite formation were conducted for 30
minutes. Three replicates of rat liver or rat nasal olfactory microsomes were incubated at six different
concentrations of ASMS (6.4, 3.2, 1.6, 0.8, 0.4, and 0.2 mM) in the presence of NADPH and GSH. The
incubations were conducted under the conditions described in Part 1. After 30 minutes, the enzymic
reaction was stopped by cooling on ice and adding a stop solution (2% formic acid). The respective
solutions were then centrifuged for 5 min at 22000 x g and the supernatants analysed for non conjugated
metabolites (ASMSO, EMA, p-OH-EMA, and p-OH-ASMSO) and various GSH conjugates. The rates of
metabolism were calculated using Lineweaver-Burk plots.
II. RESULTS AND DISCUSSION Four major non-conjugated metabolites i.e. EMA, p-OH-EMA, ASMSO, and p-OH ASMSO were
identified in rat liver or rat nasal olfactory microsomal incubations of ASMS in the presence of NADPH
and GSH. The molecular structures corresponding to the metabolite peaks were confirmed with enhanced
product ion (EPI) mass spectral analysis of the authentic standards of EMA, p-OH EMA, ASMSO, and p-
OH-ASMSO. However, using full-scan EPI-LC/MS/MS conditions, no metabolite-related GSH
conjugates were detected in the Part 1 microsomal incubations. This is probably due to the low detection
sensitivity of these low-level metabolites.
To further explore the possibility of ASMS metabolite-related GSH conjugate formation, p-OH-EMA and
p-OH-ASMSO analytical standards were incubated with rat liver or rat nasal olfactory microsomes in the
presence of NADPH and GSH. After full-scan EPI-LC/MS/MS analysis of the processed incubation
solutions, four major GSH conjugates were detected. These were tentatively identified as isomers of GSH
conjugates of p-OH-ASMSO and GSH conjugates of di-OH-ASMSO and p-OH-EMA. The identified
GSH conjugate metabolites and non-conjugated metabolite standards were used to optimize the
LC/MS/MS instrument to develop a sensitive LC/MS/MS method to detect and quantify the identified
metabolites from microsomal incubations of ASMS. After optimization of the LC/MS/MS method,
Multiple-Reaction-Monitoring (MRM) transitions were used to analyze metabolites formed from
microsomal incubations. Detection and identification of non-conjugated metabolites by LC/MRM Four non-conjugated metabolites (p-OH ASMSO, ASMSO, p-OH-EMA, and EMA) were formed from
both rat liver and nasal olfactory turbinate microsomal incubations of ASMS. Besides those four
metabolites, four other novel metabolites were detected (some of them were isomers of parahydroxylated
ASMSO and EMA). Detection and identification of GSH conjugate metabolites by LC/MRM Five p-OH ASMSO/di-OH ASMS GSH conjugates, 5 p-OH/di-OH ASMSO GSH conjugates, and 2 p-
OH-EMA GSH conjugates were detected in incubations of ASMS with rat nasal olfactory microsomes in
the presence of NADPH and GSH. In contrast, only 2 p-OH-ASMSO GSH conjugates and 1 p-OH EMA
GSH conjugate were detected in rat liver microsomal incubations in the presence of NADPH and GSH.
Among all GSH conjugates, 3 were identified as GSH conjugates formed from microsomal incubation of
p-OH ASMSO and 1 was identified as a GSH conjugate of p-OH EMA. No further efforts were made to
elucidate the structures of the other GSH conjugates.

Page 26 of 47
Time course study of microsomal incubation of ASMS The rates (Vi) of the formation of non-GSH adducts are summarized in Table 5.8.2.1/04-1. Rates were
measured at 0.2, 0.4, 0.8, 1.6, 3.2 and 6.4 mM of substrate. Only the results obtained with 0.8 mM ASMS
are discussed below to allow comparison with the rates measured with a similar substrate concentration of
ASMSO (1 mM).
Table 5.8.2.1/04-1: Vi (nmol/mg protein/min) of the formation of non-GSH adducts at 0.8 mM ASMS (n=3)
when incubated with rat liver and nasal turbinate microsomes in the presence of NADPH and GSH
Microsomes ASMS →ASMSO ASMS→→
p-OH ASMSO
ASMS→
EMA
ASMS→
p-OH EMA
Liver 2.499 <0.005 0.209 0.005
Nasal turbinates 4.308 0.222 0.082 0.206
The data in the table show that:
- the rate of para-hydroxylation in nasal microsomes is much greater than in liver microsomes
(approx. 40-fold and more),
- the rates of formation of p-OH ASMSO and p-OH EMA are high and comparable in nasal
turbinate microsomes,
- the rate of S-oxidation of ASMS to ASMSO is very high and comparable in liver and nasal
microsomes,
- the rates of EMA formation from ASMS is somewhat higher (approx. 2.5-fold) in the liver than in
nasal microsomes (approx. 2.5-fold) but these rates are approx. 10 (liver) to 50 (nasal turbinates)
times lower than the rate of formation of ASMSO.
From the control incubation without NADPH (ASMS + microsomes + GSH), EMA is formed in a
somewhat higher (approx. 2-fold) concentration in rat nasal microsomal incubations than in rat liver
microsomal incubations. These data are consistent with higher activity of amidase (which hydrolyzes the
ASMS to EMA) in rat nasal microsomes than in rat liver microsomes. Due to the limit of the replicate
number (only one incubation was conducted for the control incubation), more incubations may be needed
to confirm this conclusion.
The rates (Vi) of the formation of GSH adducts are summarized in Table 5.8.2.1/04-2.
Table 5.8.2.1/04-2: Vi (nmol/mg protein/min) of the formation of p-OH EMA GSH adducts at 0.8 mM ASMS
(n=3) when incubated with rat liver and nasal turbinate microsomes in the presence of NADPH and GSH
Microsomes ASMS→→→p-OH EMA GSH adducts
Liver 0.0014
Nasal turbinates 0.0347
Page 27 of 47
The data in the table show that the rate of formation of EMA derived GSH adducts in nasal turbinate
microsomes is much greater than in liver microsomes (approx. 25-fold). Also the formation of all other
GSH conjugates is much greater than in liver microsomes (data not shown).
The ratio of p-OH-EMA GSH to all “other GSH conjugates” is fairly comparable in either microsomal
incubation. Higher levels of EMA are formed in nasal microsomal incubation without NADPH, when
compared to EMA formed in nasal microsomal incubation with NADPH. These results are consistent
with NADPH reducing the level of EMA by enabling downstream oxidative metabolism.
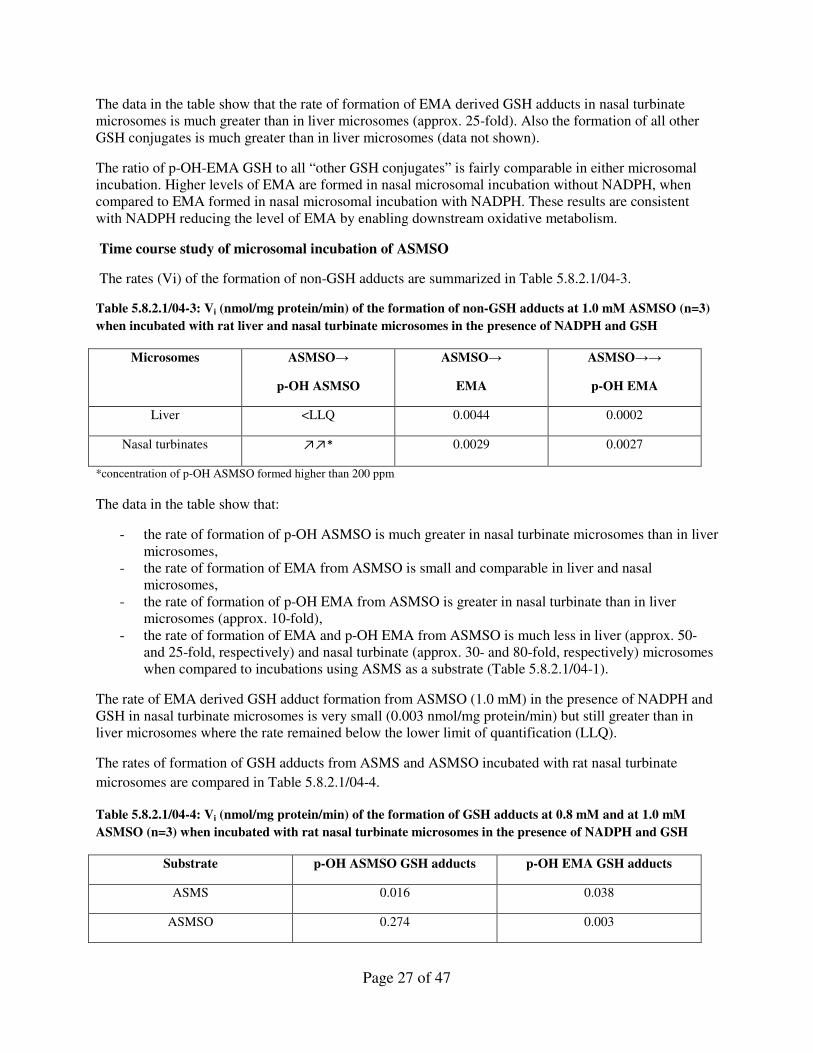
Time course study of microsomal incubation of ASMSO
The rates (Vi) of the formation of non-GSH adducts are summarized in Table 5.8.2.1/04-3.
Table 5.8.2.1/04-3: Vi (nmol/mg protein/min) of the formation of non-GSH adducts at 1.0 mM ASMSO (n=3)
when incubated with rat liver and nasal turbinate microsomes in the presence of NADPH and GSH
Microsomes ASMSO→
p-OH ASMSO
ASMSO→
EMA
ASMSO→→
p-OH EMA
Liver <LLQ 0.0044 0.0002
Nasal turbinates ↗↗* 0.0029 0.0027
*concentration of p-OH ASMSO formed higher than 200 ppm
The data in the table show that:
- the rate of formation of p-OH ASMSO is much greater in nasal turbinate microsomes than in liver
microsomes,
- the rate of formation of EMA from ASMSO is small and comparable in liver and nasal
microsomes,
- the rate of formation of p-OH EMA from ASMSO is greater in nasal turbinate than in liver
microsomes (approx. 10-fold),
- the rate of formation of EMA and p-OH EMA from ASMSO is much less in liver (approx. 50-
and 25-fold, respectively) and nasal turbinate (approx. 30- and 80-fold, respectively) microsomes
when compared to incubations using ASMS as a substrate (Table 5.8.2.1/04-1).
The rate of EMA derived GSH adduct formation from ASMSO (1.0 mM) in the presence of NADPH and
GSH in nasal turbinate microsomes is very small (0.003 nmol/mg protein/min) but still greater than in
liver microsomes where the rate remained below the lower limit of quantification (LLQ).
The rates of formation of GSH adducts from ASMS and ASMSO incubated with rat nasal turbinate
microsomes are compared in Table 5.8.2.1/04-4.
Table 5.8.2.1/04-4: Vi (nmol/mg protein/min) of the formation of GSH adducts at 0.8 mM and at 1.0 mM
ASMSO (n=3) when incubated with rat nasal turbinate microsomes in the presence of NADPH and GSH
Substrate p-OH ASMSO GSH adducts p-OH EMA GSH adducts
ASMS 0.016 0.038
ASMSO 0.274 0.003

Page 28 of 47
The data in the table show that:
- The rate of p-OH ASMSO GSH adduct formation is greater (approx. 17-fold) when ASMSO is
the substrate,
- The rate of p-OH ASMSO GSH adduct formation is much greater (approx. 91-fold) than that of
p-OH EMA GSH adduct formation when ASMSO is the substrate,
- The rate of formation of ASMSO and EMA derived adducts is low and comparable (only 2-fold
difference) when ASMS is the substrate,
- The rate of formation of p-OH EMA GSH adducts from ASMS is greater (approx. 13-fold) than
from ASMSO as substrate.
III. CONCLUSIONS
The vast majority of reactive metabolites (iminoquinone molecular species trapped as GSH conjugates)
from ASMSO in nasal turbinates of the rat are formed from p-OH-ASMSO (>98%). In contrast, the lower
amount of total reactive metabolites from ASMS arose primarily from p-OH-EMA. The rate of formation
of GSH adducts of p-OH ASMSO in nasal turbinate microsome incubations was found to be more than
10-fold greater when ASMSO was used as a substrate compared to ASMS. The rate of formation of p-OH
EMA GSH adducts in nasal turbinate microsome incubations was more than 10-fold greater when ASMS
was used as a substrate.
ASMSO has been identified as the major acetochlor metabolite plasma in rats (species where nasal
tumors are produced) which means that most of the hepatic ASMS is S-oxidized to ASMSO before it
reaches the systemic circulation. ASMSO is virtually absent in plasma of mice, a species in which no
nasal tumors are produced (CA 5.8.2/03). In consequence, ASMSO is the most important substrate that is
offered to the nasal turbinate tissue for further metabolism into reactive molecular species. The results of
this in vitro study show that virtually all of the ASMSO reactive metabolites in rat nasal microsomal
incubations arise from initial hydroxylation of ASMSO, followed by oxidation to iminoquinone
molecular species. Since Green et al.(CA 5.8.2/03) showed no measureable hydroxylation of ASMSO in
primate or human nasal microsomes, there is little chance of reactive metabolite formation via this
pathway in these two species. Green (CA 5.8.2/02) also showed that the formation of p-OH-EMA in
microsomal incubation of EMA in primate nasal fractions is 23 times less than in rat nasal microsomal
incubations. The rate of p-OH EMA formation in primates was also more than 20-fold less than in mice, a
species which did not develop nasal tumors. The results of this in vitro metabolism study together with
the ADME data demonstrating that ASMSO is the predominant circulating plasma metabolite, indicate
that the vast majority of the reactive iminoquinone molecular species formed in nasal tissue in the rat as a
result of acetochlor exposure is generated via the sulfoxide pathway and that any contributions from the
EMA pathway are minimal.

Page 29 of 47
Acetochlor 90-day mouse feeding study
Author(s): Ahmed, FE
Year: 1980
Title: CP 55097: 91-day Feeding Study in the Mouse
Testing Laboratory: Pharmacopathics Research Laboratories Inc., Laurel, Maryland 20707,
USA
Report Number: 7912 (sponsor’s report number: PR-79-050)
Report Date: 12th November 1981
Test Guidelines: No specific test guidelines were available at the time of the conduct of the
study but the basic principles of the OECD test guideline for sub-chronic
toxicity in rodents (TG 408) have been followed.
Deviations from guideline: Deviations from OECD test guideline 408 (adopted on 21st September
1998) are:
- No ophthalmological examination
- No neurobehavioral observations
- Organ weights not complete
- No hematology measurements
- No blood biochemistry measurements
- No urinalysis
- No recovery group
GLP Compliance: A statement of the quality assurance unit of the laboratory has been added
to the report.
Executive Summary
Random bred albino CD-1 mice of 21 days of age were put in quarantine for 9 days before the start of the
study. Ten animals per sex were used for baseline histopathology and 40 animals were extra and were
sacrificed on day 0. 20 animals per sex were treated with acetochlor at 0, 800, 2000 and 6000 ppm in the
diet. No abnormal clinical findings were observed during the entire course of the study. Three mice died:
one control female after 48 days, and 2 high dose females after 7 and 12 days since the start of the test.
There were no test compound related changes in feed consumption and feed efficiency. A statistically
significant decrease in body weight was observed in both sexes at the high dose group. Statistically
significant changes in absolute and relative organ weights were observed in both sexes in various dose
groups, however without any histopathological correlate. The NOAEL that can be derived from this study
is 2000 ppm based on a significant decrease in body weight at the high dose level.
I. MATERIAL AND METHODS
A. MATERIALS
1. Test Materials:
Description: Acetochlor (MON 097, CP55097)

Page 30 of 47
Appearance: Dark brown liquid with an offensive odor
Lot/Batch #: XHK-119
Purity/content: 91.3% w/w
Stability: Expected to be stable for the duration of the study
2. Vehicle: Feed, provided ad libitum.
3. Test animals:
Species: Mouse
Strain: Swiss albino CD-1
Sex: Males and females
Age: The animals were received at the laboratory at the age of 21 days
(weanlings) and put in quarantine for 9 days prior to the start of the
study
Weight at dosing: Mean body weight of the animals in the control group at the start of
treatment was 20 g for males and 16 g for females
Source: Charles River Breeding Laboratories, Wilmington, Mass., USA
Acclimation period: 9 days
Diet: Charles River 19RF meal for rat, mouse and hamster, Agway of
Syracuse, New York, USA
Water: Howard county public water supply provided by Washington Suburban
Sanitary Commission
Housing: Individually housed in wire mesh cages
Environmental
conditions:
Atmospheric change at 10 times per hour. The temperature was kept at
approximately 22.8 ± 0.9oC, with humidity at approximately 45% to
70%. The light/dark cycle was approximately 12 hours on and 12 hours
off
4. Preparation of test diets:
Test diets were prepared weekly by mixing the given amount of test substance with the appropriate
amount of basic diet in a Patterson-Kelley two cubic feet mixer. Fresh diets were prepared weekly.
B. STUDY DESIGN AND METHODS
1. Dates of experimental work: Dosing started on 27th July, 1979.
2. Study design:
Dose levels:
0, 800, 2000, 6000 mg/kg diet (ppm)
Animals/dose level: 20 males and 20 females
Exposure time:
91 days
Route of exposure:
Oral
Vehicle: Feed, provided ad libitum

Page 31 of 47
Dose administration:
Diet, prepared weekly and based on the group weekly mean body
weight and data taken two weeks ago
Analysis of diet:
Analysis of the diet indicated that the test substance was properly
mixed in the feed and that it was stable when left at room
temperature for at least a week
Clinical observations:
All animals were inspected daily for clinical signs. Positive findings
were documented as they occurred. Negative findings were
documented once a week. Any abnormal signs observed were
routinely followed up either to clinical recovery or to moribund
condition, whereupon the animal was sacrificed
Ophthalmology:
Not performed
Body weight:
Recorded every week during the study, starting at one week before
treatment
Feed consumption:
Measured by weighing the feed containers full of feed at the
beginning of the week (full weight) and the same feed containers
with the remaining at the end of the week (empty weight). The
difference between the full and empty weights represented the net
feed consumption
Hematology:
Not performed
Blood biochemistry:
Not performed
Urinalysis:
Not performed
Gross necropsy:
All moribund animals were sacrificed within 16 hours so as to
prevent autolysis of tissues. Prior to necropsy animals were fasted
overnight, weighed and euthanized.
Organ weights:
Brain, heart, liver, kidney and gonads of all surviving animals were
weighed at termination of the study
Histopathology:
Tissues that were examined microscopically: - from randomly selected 10 male and 10 female mice prior to
initiation of the study,
- from all mice in the control and high-dose groups at the end
of the study,
- from all gross lesions observed in the course of the complete
necropsy,
- from heart, lungs, liver and kidneys of all mice from the
intermediate dose groups, and
- in all other test groups when significant changes have been
observed in these tissues in the high dose group
Following tissues were examined in animals which received
complete histopathology: adrenals, aorta, bladder (urinary), bone,

Page 32 of 47
bone marrow, brain, cecum, colon, duodendum, esophagus, eye and
optic nerve, gall bladder, heart, ileum, jejenum, kidneys, liver, lungs
and bronchi, lymph nodes, mammary glands (if palpable), skeletal
muscle, peripheral nerve (sciatic), ovaries, pancreas, parathyroids,
penis, pituitary, prostate, salivary glands (submaxillary), skin, spinal
cord, spleen, stomach, testes, thymus, thyroids, trachea, uterus and
vagina.
II. RESULTS AND DISCUSSION
Diet data:
Analysis of the diet: Not reported
Chemical consumption: Not reported
Toxicology data: No clinical abnormalities were observed throughout the course of the study.
One control female mouse was found dead after 48 days on test. One high-dose female mouse was
sacrificed after seven days on test and one high-dose female mouse died after twelve days on test.
Statistically significant decreases in feed consumption have been observed in all dose groups but these are
not considered to be compound related. The feed efficiency in both sexes at the various dose levels was
not remarkably different from the control groups.
A statistically significant decrease in body weight as compared to the control group has been observed in
the males of the mid dose group (weeks 10 and 12) and the high-dose group (from week 1 until the end of
the study). In the females, no statistical significance was observed in either the low or the mid dose
groups throughout the duration of the study. A statistically significant decrease was observed in the high-
dose group from weeks 5 through 13. The changes in body weight at the high dose are considered to be
test substance related.
Statistically significant changes in absolute mean organ weight were a decrease for brain in males at the
high dose, an increase for liver in males at the mid and high dose and females at the low and mid dose, an
increase for kidney in males at the low and the mid dose and a decrease in females at the high dose, and a
decrease for gonads in females at the high dose.
Statistically significant changes in relative mean organ weight were an increase for brain in males at the
high dose, an increase for heart in males at the mid and high dose, an increase for liver in males at the mid
and high dose and in females at all dose levels (not dose related), and an increase for kidney in males at
all dose levels and in females only at the mid dose.
No test substance related gross pathology findings were noted in any of the mice that died or were
sacrificed in the study.
None of all the histopathological findings noted were found to be test substance related.
III. CONCLUSIONS
The decrease in body weight noted in males and females dosed at 6000 ppm acetochlor in the diet is
considered to be related to treatment. The changes in organ weights at the lower dose levels remained
without any histopathological correlates and should be considered to be of no toxicological significance.
The NOAEL level that can be derived from this study is 2000 ppm.
Page 33 of 47
t-Norchloroacetochlor - Ames Bacterial Mutation Assay (Repeat Study)
Report: Wagner, III, V.O. and VanDyke, M.R. (2013) MON 52706: Bacterial Reverse
Mutation Assay. Monsanto study No. BRL-2013-0134.
Guidelines: This study meets the requirements of OECD test guideline 471 (1997)
GLP: yes
Executive Summary
In a reverse gene mutation assay in bacteria, Salmonella typhimurium tester strains TA98, TA100, TA1535,
TA1537 and Escherichia coli tester strain WP2 uvrA were exposed to MON 52706 (>99% purity), using
dimethylsulfoxide (DMSO) solvent. An initial toxicity-mutation assay was conducted where MON 52706
was tested up to the limit concentration, 5000 �g/plate. No positive mutagenic responses were observed with
any of the tester strains in either the presence or absence of S9 activation. Precipitate was observed at 5000
µg per plate. No toxicity was observed. Dose levels of 15, 50, 150, 500, 1500 and 5000 �g per plate ±S9
were used for the confirmatory mutagenicity assay using the plate incorporation method. Precipitate was
observed at 5000 µg per plate. No toxicity was observed. The positive controls induced the appropriate
responses in the corresponding strains.
No positive mutagenic responses were observed in any of the tests. It was concluded that MON 52706
was not mutagenic in the bacterial strains tested, either in the presence or absence of metabolic activation.
I. Materials and Methods
A. Materials:
1. Test Material: MON 52706
Description: Pale yellow liquid
Lot/Batch#: GLP-1212-22321-T
Purity: >99 %
CAS#: Not available
Stability of test compound: The test substance was expected to be stable for the duration
of testing.
Solvent used: Dimethylsulfoxide (DMSO)
2. Control Materials:
Negative: DMSO
Solvent/
final concentration:
DMSO at 0.1 mL/plate

Page 34 of 47
Positive:
non-activation: 2-nitrofluorene: 1.0 �g/plate TA98
sodium azide: 1.0 �g/plate TA100, TA1535
9-aminoacridine: 75 �g/plate TA1537
methyl methanesulfonate: 1000 �g/plate WP2 uvrA
activation: 2-Aminoanthracene: 1.0 �g/plate TA98, TA1535, TA1537;
2.0 �g/plate TA100; 15 �g/plate WP2 uvrA
1. Activation
The S9 preparations were from livers of Aroclor 1254-induced rats (Lot Nos. 3017 and 3062 from
Moltox, Boone, NC). The metabolic activation ability of the S9 was characterized using varying
S9 and positive control concentrations. The composition of the S9 mix is shown below:
Component: Concentration:
Phosphate buffer (pH 7.4) 100 mM
Glucose 6-phosphate 5 mM
β-nicotinamide-adenine dinucleotide phosphate 4 mM
Potassium chloride 33 mM
Magnesium chloride 8 mM
S9 10 % (v/v)
2. Test Concentrations:
a. Initial Toxicity-Mutation Assay:
Plate incorporation assay: 1.5, 5.0, 15, 50, 150, 500, 1500 and 5000 �g per plate were
evaluated with and without S9 activation in Salmonella typhimurium strains TA98, TA100,
TA1535, TA1537, and Escherichia coli strain WP2 uvrA, in duplicate plates.
b. Confirmatory Mutagenicity Assay:
Plate incorporation assay: 15, 50, 150, 500, 1500 and 5000 �g per plate were
evaluated in triplicate in the presence and absence of S9 activation in Salmonella
typhimurium strains TA98, TA100, TA1535, TA1537, and Escherichia coli strain
WP2 uvrA, in triplicate plates.
B. Test Performance:
The study was conducted during the period March to April, 2013.
1. Plate incorporation method
Page 35 of 47
One-half (0.5) milliliter of S9 or Sham mix, 100 �L of tester strain (cells seeded) and 50 �L of
vehicle or test substance dilution were added to 2.0 mL of molten selective top agar at 45±2°C.
After vortexing, the mixture was overlaid onto the surface of 25 mL of minimal bottom agar.
When plating the positive controls, the test substance aliquot was replaced by a 50 �L aliquot of
appropriate positive control. After the overlay had solidified, the plates were inverted and
incubated for 48 to 72 hours at 37±2°C. Plates that were not counted immediately following the
incubation period were stored at 2-8°C until colony counting could be conducted.
2. Statistics
None.
3. Evaluation Criteria
For each replicate plating, the mean and standard deviation of the number of revertants per plate
were calculated and are reported.
For the test substance to be evaluated positive, it must cause a dose-related increase in the mean
revertants per plate of at least one tester strain over a minimum of two increasing concentrations
of test substance.
Data sets for tester strains TA1535 and TA1537 were judged positive if the increase in mean
revertants at the peak of the dose response was greater than or equal to 3.0-times the mean vehicle
control value. Data sets for tester strains TA98, TA100 and WP2 uvrA were judged positive if the
increase in mean revertants at the peak of the dose response was greater than or equal to 2.0-times
the mean vehicle control value.
An equivocal response is a biologically relevant increase in a revertant count that partially meets
the criteria for evaluation as positive. This could be a dose-responsive increase that does not
achieve the respective threshold cited above or a non-dose responsive increase that is equal to or
greater than the respective threshold cited. A response will be evaluated as negative, if it is
neither positive nor equivocal.
II. Results and Discussion
A. Initial Toxicity-Mutation Assay
The maximum dose tested was 5000 �g per plate, which is the maximum concentration recommended
by test guidelines (OECD 471, 1997). The dose levels tested were 1.5, 5.0, 15, 50, 150, 500, 1500
and 5000 �g per plate. No positive mutagenic responses were observed with any of the tester strains
in either the presence or absence of S9 activation. Precipitate was observed at 5000 µg per plate. No
toxicity was observed. Based on the findings of the initial toxicity-mutation assay, the maximum
dose plated in the confirmatory mutagenicity assay was 5000 µg per plate.
Page 36 of 47
B. Confirmatory Mutagenicity Assay
No positive mutagenic responses were observed with any of the tester strains either the presence or
absence of S9 activation. The dose levels tested were 15, 50, 150, 500, 1500 and 5000 �g per plate.
Precipitate was observed at 5000 µg per plate. No toxicity was observed.
The vehicle controls and positive controls in the initial toxicity-mutation assay and confirmatory
mutagenicity assays were within the acceptable historical ranges and fulfilled the requirements for a
valid assay.
III. Conclusions
The results of the Bacterial Reverse Mutation Assay indicate that, under the conditions of this study,
MON 52706 did not cause a positive mutagenic response with any of the tester strains in either the
presence or absence of Aroclor-induced rat liver S9.

Page 37 of 47
Mean Revertants Per Plate
STRAIN
DOSE
LEVEL
(µg/plate)
Initial Experiment Confirmatory Experiment
+S9 -S9 +S9 -S9
Count Ratio1 Count Ratio Count Ratio Count Ratio
TA98 5000 18 0.6 13 0.7 20 1.0 6 0.5
1500 17 0.6 18 1.0 20 1.0 7 0.6
500 25 0.8 10 0.6 25 1.2 9 0.8
150 16 0.5 9 0.5 22 1.0 8 0.7
50 23 0.8 15 0.8 25 1.2 13 1.2
15 34 1.1 14 0.8 19 0.9 8 0.7
5 29 1.0 12 0.7 - - - -
1.5 19 0.6 20 1.1 - - - -
VEHICLE 30 - 18 - 21 - 11 -
POSITIVE 502 16.7 170 9.4 466 22.2 182 16.5
TA100 5000 74 0.9 89 0.9 59 0.7 76 0.9
1500 51 0.6 95 1.0 80 0.9 101 1.2
500 76 0.9 73 0.8 78 0.9 92 1.1
150 93 1.1 96 1.0 99 1.1 85 1.0
50 91 1.1 84 0.9 85 1.0 95 1.2
15 105 1.3 97 1.0 74 0.8 100 1.2
5 77 0.9 74 0.8 - - - -
1.5 100 1.2 69 0.7 - - - -
VEHICLE 84 - 96 - 89 - 81 -
POSITIVE 533 6.3 519 5.4 592 6.7 532 6.6
1Ratio of treated/vehicle control

Page 38 of 47
STRAIN
DOSE
LEVEL
(µg/plate)
Initial Experiment Confirmatory Experiment
+S9 -S9 +S9 -S9
Count Ratio1 Count Ratio Count Ratio Count Ratio
TA1535 5000 6 0.8 16 2.0 7 0.7 15 1.4
1500 13 1.6 18 2.3 9 0.9 14 1.3
500 7 0.9 10 1.3 11 1.1 14 1.3
150 10 1.3 13 1.6 8 0.8 12 1.1
50 12 1.5 11 1.4 9 0.9 9 0.8
15 10 1.3 16 2.0 13 1.3 10 0.9
5 14 1.8 16 2.0 - - - -
1.5 16 2.0 11 1.4 - - - -
VEHICLE 8 - 8 - 10 - 11 -
POSITIVE 79 9.9 541 67.6 97 9.7 463 42.1
TA1537 5000 4 0.7 8 2.0 8 1.3 11 1.1
1500 6 1.0 5 1.3 6 1.0 4 0.4
500 10 1.7 2 0.5 8 1.3 6 0.6
150 5 0.8 4 1.0 6 1.0 9 0.9
50 4 0.7 5 1.3 7 1.2 9 0.9
15 10 1.7 7 1.8 6 1.0 10 1.0
5 6 1.0 6 1.5 - - - -
1.5 7 1.2 4 1.0 - - - -
VEHICLE 6 - 4 - 6 - 10 -
POSITIVE 27 4.5 230 57.5 26 4.3 240 24.0
1Ratio of treated/vehicle control

Page 39 of 47
STRAIN
DOSE
LEVEL
(µg/plate)
Initial Experiment Confirmatory Experiment
+S9 -S9 +S9 -S9
Count Ratio1 Count Ratio Count Ratio Count Ratio
WP2uvrA 5000 22 1.1 20 1.0 20 0.6 15 0.8
1500 17 0.9 17 0.9 21 0.7 16 0.8
500 20 1.0 20 1.0 19 0.6 21 1.1
150 16 0.8 21 1.1 17 0.5 22 1.2
50 21 1.1 28 1.4 20 0.6 28 1.5
15 18 0.9 19 1.0 26 0.8 19 1.0
5 20 1.0 17 0.9 - - - -
1.5 21 1.1 20 1.0 - - - -
VEHICLE 20 - 20 - 32 - 19 -
POSITIVE 305 15.3 285 14.3 312 9.8 299 15.7
1Ratio of treated/vehicle control

Page 40 of 47
In Vivo Transgenic Gene Mutation Study in Mice with MON 52706
Author(s) Beevers C.
Year: 2014
Title: In vivo Muta™Mouse gene mutation assay with MON 52706
Testing Laboratory: Covance Laboratories Ltd., North Yorkshire, England
Lab Report Number: 8279760
Monsanto Study Number: CV-2013-0032
Monsanto Report Number: MSL002544
Report Date: January 16, 2014
Guidelines: OECD Guideline 488 (2011), revised 2013
Deviations from Guidelines: No
GLP Compliance: Yes
Executive Summary
The objective of this study was to evaluate the potential of MON 52706 to induce gene mutations in mice
following repeated oral administration. In this study, MON 52706 was administered for 28 days to 4
groups of 7 transgenic female MutaTM
Mice at dietary concentrations of 0, 600, 1800 and 6000 ppm
(intended to achieve dose levels of 0, 100, 300 and 1000 mg/kg/day, respectively). A fifth group of 7
female mice was administered ethylnitrosourea (ENU), a known mutagen, for use as a positive control.
All animals were sacrificed on Day 31, three days after the last day of dosing, and subjected to a complete
gross necropsy. Selected organs were weighed and examined microscopically. DNA was isolated from
the lungs and bone marrow and evaluated for the presence of gene mutation in the lacZ gene.
No increase in gene mutation frequency was observed in MON 52706 treated animals. Therefore,
MON 52706 is not considered to be mutagenic to female mice.
Introduction
The objective of this study was to evaluate the potential of MON 52706, a minor soil metabolite of
acetochlor, to induce gene mutations in lung and bone marrow of female MutaTM
Mice. These two tissues
were selected for evaluation since equivocal increases in the incidence of lung tumours and histiocytic
sarcomas were observed in female mice in chronic feeding studies with parent acetochlor.
The Muta™Mouse (lacZ/GalE) assay is capable of detecting point mutations and small deletions in a
wide variety of tissues from treated animals. The genome of the MutaTM
Mouse strain contains 40 copies
of a transgenic lambda gt10 vector, each of which contains a bacterial lacZ gene, within every DNA-
bearing cell of the animal. The lacZ gene encodes for the β-galactosidase enzyme, which is not present in
the normal mouse. Treatments are performed in vivo, with sufficient treatment and expression time to
permit any mutations to be expressed. Cellular DNA is extracted from selected tissues at necropsy and
subsequently packaged into lambda bacteriophage. The packaged bacteriophage are then used to transfect
a culture of E. coli C lac- galE
- Kan
r (galE
- Amp
r). Only bacteriophage units containing a lacZ gene from
the transgenic vector in the mouse DNA are viable and capable of transfecting a bacterial cell. Successful
transfection enables replication of the bacteriophage and transfection of neighbouring bacterial cells. This

Page 41 of 47
results in the formation of a visible plaque, i.e. an area of bacterial cell lysis, in a lawn of uninfected
viable bacterial cells. Furthermore, due to the galE- status of the host bacterial strain cells, only cells
infected with a non-functional (i.e. mutated) lacZ gene can form plaques on the positive selection plates.
Methods
Range-finding Study
A 14-day dose range-finding study was completed using 6 MutaMice to assess palatability and overt
toxicity following dietary administration of MON 52706. Three female test mice were fed a diet
containing 4500 ppm MON 52706 for a period of 7 days followed by additional 7 days of dosing with
diet containing 6000 ppm MON 52706. A separate group of three control mice were fed normal diet for a
period of 14 days. Transient slight decreases in food consumption were noted in the MON 52706-treated
animals. However, there were no test substance related findings on survival, clinical observations or body
weight.
Main Study
Species: Mouse
Strain: CD2-lacZ80/HazfBR (Muta™Mouse)
Sex: Female
Source: Harlan UK
Test Substance:
Lot/Batch#:
Purity:
Positive Control:
Negative
(Vehicle)
Control:
MON 52706 (norchloroacetochlor)
GLP-1212-22321-T
>99%
Ethylnitrosurea (ENU, Sigma-Aldrich, Poole, UK).
Diet
Study Design:
Group
Description
Number of
Animals
Targeted Diet
Concentration
(ppm)
Targeted Dose
(mg/kg/day)
Vehicle control 7 0 0
MON 52706
Low 7 600 100
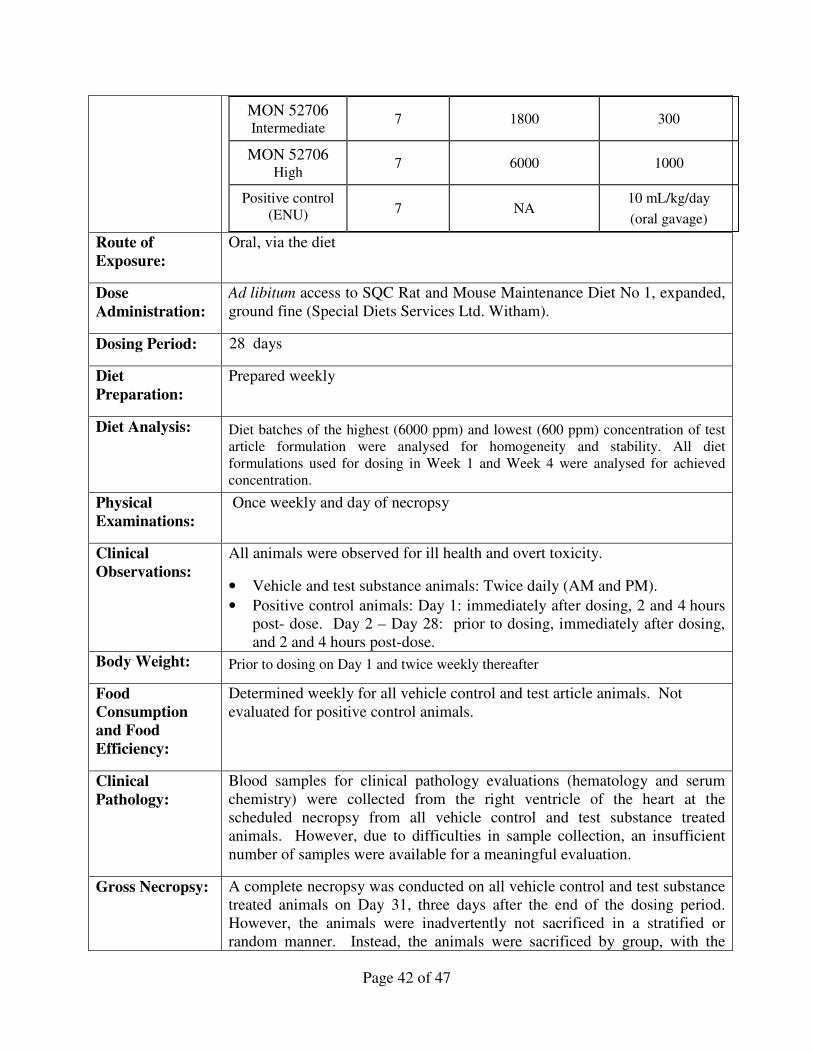
Page 42 of 47
MON 52706
Intermediate 7 1800 300
MON 52706
High 7 6000 1000
Positive control
(ENU) 7 NA 10 mL/kg/day
(oral gavage)
Route of
Exposure:
Oral, via the diet
Dose
Administration:
Ad libitum access to SQC Rat and Mouse Maintenance Diet No 1, expanded,
ground fine (Special Diets Services Ltd. Witham).
Dosing Period: 28 days
Diet
Preparation:
Prepared weekly
Diet Analysis: Diet batches of the highest (6000 ppm) and lowest (600 ppm) concentration of test
article formulation were analysed for homogeneity and stability. All diet
formulations used for dosing in Week 1 and Week 4 were analysed for achieved
concentration.
Physical
Examinations:
Once weekly and day of necropsy
Clinical
Observations:
All animals were observed for ill health and overt toxicity.
• Vehicle and test substance animals: Twice daily (AM and PM).
• Positive control animals: Day 1: immediately after dosing, 2 and 4 hours
post- dose. Day 2 – Day 28: prior to dosing, immediately after dosing,
and 2 and 4 hours post-dose.
Body Weight: Prior to dosing on Day 1 and twice weekly thereafter
Food
Consumption
and Food
Efficiency:
Determined weekly for all vehicle control and test article animals. Not
evaluated for positive control animals.
Clinical
Pathology:
Blood samples for clinical pathology evaluations (hematology and serum
chemistry) were collected from the right ventricle of the heart at the
scheduled necropsy from all vehicle control and test substance treated
animals. However, due to difficulties in sample collection, an insufficient
number of samples were available for a meaningful evaluation.
Gross Necropsy: A complete necropsy was conducted on all vehicle control and test substance
treated animals on Day 31, three days after the end of the dosing period.
However, the animals were inadvertently not sacrificed in a stratified or
random manner. Instead, the animals were sacrificed by group, with the

Page 43 of 47
vehicle control and 600 ppm groups being sacrificed in the morning, and the
remaining groups being sacrificed in the afternoon. Although the order of
sacrifice would not have affected any in-life data or the mutation results, this
may have had an impact on one or more other parameters.
Organ Weights: Adrenal glands, brain, heart, kidneys, liver, spleen, thymus, and uterus from
all vehicle control and test substance treated animals
Tissue
Collection:
About 30 tissues from all vehicle control and test substance treated animals
were preserved in formalin for possible histopath evaluation. Samples of
lung, bone marrow, liver and spleen were flash frozen in liquid nitrogen for
possible gene mutation evaluation.
Histopathology: Liver, kidney and gross lesions were evaluated microscopically for all
animals. Sternum (with marrow), spleen, and lungs were examined from
high-dose and vehicle control animals.
Gene Mutation
Evaluation:
Genomic DNA from frozen lung and bone marrow samples was isolated
using Recoverase™ DNA extraction kits. The isolated DNA was then
packaged into bacteriophage heads, which were then transfected into E. coli
C lac- galE
- Kan
r (galE
- Amp
r). The phage/bacteria were then suspended in
top agar and plated for overnight incubation. Following overnight
incubations, plates were manually scored for the number of clear plaques on
each plate.
Statistics:
Mutant Frequency:
The positive control group (Group 7) was compared to the vehicle control (Group 3)
using a two-sample t-test. The test was interpreted with one-sided risk for increased
response with increasing dose. Groups 3, 4, 5 and 6 were analyzed using one-way
analysis of variance (ANOVA). An overall dose response test was performed along
with Dunnett’s test for pair wise comparisons of each treated group with the vehicle
control. All tests were performed with a one-sided risk for increasing response.
Levene's test for equality of variances between the groups was also performed and,
in all cases, this showed no evidence of heterogeneity (P>0.01).
Toxicology Parameters:
The positive control group (Group 7) was excluded from statistical analysis. Food
consumption, feed efficiency, body weight gains, terminal body weights, absolute
organ weights, organ to body weight ratios, haematology and clinical chemistry
variables were analyzed using one-way analysis of variance (ANOVA). Levene's
test for equality of variances among the groups was performed. Where this showed
no evidence of heterogeneity (P>0.05), and the group effect from the ANOVA was
significant (P≤0.05), pair wise comparisons with control were made using Dunnett's
test.

Page 44 of 47
Results and Discussion
Diet Analysis: Diet analysis confirmed the homogeneity and target concentrations of MON 52706 at 600 and
6000 mg/kg diet. Concentrations after 9 days at room temperature were 14% and 12% lower than
at Day 0, for the 600 and 6000 mg/kg diets, respectively. This was believed to be due, at least in
part, to incomplete extraction rather than an indication of lack of stability of MON 52706.
However, in either case, the slightly lower recovery after 9 days was not considered to be a
concern since the achieved dose levels were slightly greater than intended.
Clinical Observations: There were no test substance related deaths or clinical findings.
Body Weight:
There was no statistically significant effect on body weight observed in any group treated with
Error! Reference source not found. compared to the concurrent vehicle control. However,
Group 6 showed a statistically significant decrease (53%) in overall body weight gain (Day 1 to
Day 29) compared to the vehicle control.

Page 45 of 47
Table 1: Body Weight and Weight Gain (g)
Group Day 1 Day 29
Cumulative Gain
(Day 29 – Day 1)
0 ppm 20.6 23.8 3.2
600 ppm 21.7 25.1 3.3
1800 ppm 21.8 23.7 1.9
6000 ppm 20.5 22.0 1.5* *p <0.05
Food Consumption: There was a slight decrease in food consumption in the 6000 ppm animals, primarily during the
first two weeks of the study.
Table 2: Average Weekly Food consumption
Group Days 1-8 Days 8-15 Days 15-22 Days 22-29
0 ppm 31.3 30.2 29.5 29.1
600 ppm 28.5 29.6 31.2 30.3
1800 ppm 30.7 30.6 30.7 29.7
6000 ppm 26.4** 27.7 28.9 27.4
** p<=0.01
Test Substance Intake: Mean test substance intake met or exceeded targeted doses throughout the course of the
study.
Table 3: Mean Test Substance Intake Over 28 Days of Dosing
Target Dietary Level (ppm) Mean Test Substance Intake1 (mg/kg/day)
0 0
600 112
1800 345
6000 1130 1Based on nominal dietary concentrations.
Proof of Exposure: Proof of test substance exposure to the bone marrow and lungs was not demonstrated as part of
this study. However, a subsequent 5-day oral repeat dosing study (Study No. SW-2013-0572)
demonstrated the presence of substantial amounts of MON 52706 in blood (plasma) after oral
gavage administration to mice.

Page 46 of 47
The bone marrow is a well-perfused tissue and the level of test article in the bone marrow is
generally comparable to that in the blood or plasma. Accordingly, measurement of plasma levels
of test material to confirm exposure to bone marrow is considered acceptable by the ICH
guidelines (ICH S2(R1), 2012). The lung is also a highly perfused tissue. Thus, the detection of
substantial amounts of MON 52706 in plasma after oral gavage administration is considered to be
sufficient to demonstrate exposure to both the bone marrow and lungs.
Clinical Chemistry: No statistically significant changes in clinical chemistry parameters were seen in animals dosed
with Error! Reference source not found., although it is noted that for many parameters data
were available for too few animals to allow valid and reliable statistical analysis.
Macroscopic Observations: No treatment related gross pathological findings.
Organ Weights: There were no statistically significant differences in absolute or relative organ weights.
Table 4: Average Absolute Organ Weights
Group
Adrena
l (g)
Brain
(g)
Heart
(g)
Kidney
(g)
Liver
(g)
Spleen
(g)
Thymu
s (g)
Uterus
(g)
0 ppm 0.009 0.365 0.130 0.323 1.378 0.122 0.062 0.146
600 ppm 0.009 0.365 0.128 0.328 1.391 0.122 0.065 0.244
1800
ppm 0.010 0.362 0.140 0.481 1.304 0.119 0.056 0.188
6000
ppm 0.010 0.354 0.125 0.312 1.273 0.113 0.055 0.148 None significantly different from control group
Table 5: Average Organ Weight-to-Body Weight Ratios
Group
Adrena
l Brain Heart Kidney Liver Spleen
Thymu
s Uterus
0 ppm 0.0379 1.5101 0.5428 1.3326 5.6666 0.5120 0.2578 0.6175
600 ppm 0.0379 1.4391 0.5090 1.3029 5.5960 0.4939 0.2574 0.9932
1800
ppm 0.0403 1.5104 0.5815 1.9565 5.4452 0.4956 0.2315 0.7739
6000
ppm 0.0444 1.6031 0.5651 1.4090 5.7235 0.5119 0.2510 0.6668 None significantly different from control group
Microscopic Observations: There were no treatment-related adverse microscopic findings.

Page 47 of 47
An initial microscopic evaluation of liver sections showed a possible slight decrease in glycogen
vacuolation in treated animals. However, this was considered likely to be an artifact of the
necropsy order (which resulted in a longer period of fasting for the mid- and high-dose animals
compared to the control and low-dose animals) and not a treatment-related adverse finding.
Focal nephropathy was found in the kidneys of two high-dose animals. However, in both cases,
the lesion affected only a single tubule, and was therefore not considered to be test article related.
There were no treatment related findings in the sternum (with marrow), spleen or lung.
Gene Mutation: There was no indication of any increase in mutation frequency in either lungs or bone marrow
from animals treated with MON 52706. Substantial increases in mutation frequency were
observed in both lung and bone marrow from animals treated with ENU, a known mutagen, thus
demonstrating the ability of this assay to detect gene mutations.
Table 6: Mutation Frequency in Lung and Bone Marrow
Group Dose
Level
(ppm)
Mutation Frequency (x 10-6
)
Lung Bone Marrow
Mean SD n Mean SD n
Neg. Control 0 43.30 12.2 6 32.79 17.5 6
MON 52706 600 48.56 9.5 7 35.40 17.8 7
MON 52706 1800 52.06 16.5 7 32.31 13.1 7
MON 52706 6000 49.40 22.9 7 36.35 15.2 5
Pos. Control - 354.35*** 97.2 7 883.23*** 184.1 7 *** P≤0.001
Conclusions: No evidence of any increase in gene mutation frequency was observed when MON 52706 was
administered to female mice for 28 days at dose levels up to 6000 ppm (approximately 1000
mg/kg/day). Therefore, MON 52706 is not considered to be mutagenic to female mice.