Monroe County Department of Transportation Vertical Curve ... · PDF fileMonroe County...
11
Monroe County Department of Transportation Vertical Curve Safety Study Monroe County, New York July 2011 PREPARED FOR: Monroe County Department of Transportation 50 West Main Street Suite 6100 Rochester, NY 14614 PREPARED BY: 255 East Avenue Rochester, New York 14604 project # 434934
Transcript of Monroe County Department of Transportation Vertical Curve ... · PDF fileMonroe County...

Monroe County Department of Transportation Vertical Curve Safety Study
Monroe County, New York
July 2011
PREPARED FOR:
Monroe County Department of Transportation
50 West Main Street Suite 6100
Rochester, NY 14614
PREPARED BY:
255 East Avenue Rochester, New York 14604
project # 434934

ES-1
Monroe County Department of Transportation Vertical Curve Safety Study July 2011
1.0 Executive Summary The Monroe County Vertical Curve Safety Study was initiated by the Monroe County Department of Transportation (MCDOT) to identify/investigate all vertical curve locations within the County. Monroe County Department of Transportation owns and maintains approximately 274 roads within the County, containing 663 centerline miles. The purpose of this Vertical Curve Safety Study is to identify non-standard vertical curves on County roads and to evaluate non-standard vertical curve locations within the County that have a history of safety concerns. Non-standard vertical curves do not meet the minimum sight distance requirements for a crest vertical curve as defined by the American Association of State Highway and Transportation Officials (AASHTO). The study scope and parameters have been developed in consultation with Monroe County and the MCDOT point system for prioritizing vertical curves and the procedures conform to guidelines recommended by AASHTO. The intent is to identify vertical curves where improvements are proposed for consideration by Monroe County.
The overall project study area included all County Route roadways and intersections within Monroe County. Figure ES-1 identifies the roadways studied. Using data supplied by MCDOT, an inventory of vertical curve locations was compiled and rated based on a series of factors. Key factors include high incidents of accidents in the areas where the vertical curves are located, and stopping sight distances that are less than values recommended by AASHTO for the roadway’s 85th percentile speeds. Locations that met the criteria were highlighted for further investigation. Survey data was used to further investigate the effect of each vertical curve location on stopping sight distance and to determine a list of locations for recommended remediation. The steps taken to complete the project analysis are previewed below and identified in Figure ES-2. A predetermined series of Filters was used to pinpoint the High priority Candidate Vertical Curve Locations that were recommended for mitigation. A brief description of each filter is summarized below; further discussion follows within the text of this section.

ES-2
Monroe County Department of Transportation Vertical Curve Safety Study July 2011

ES-3
Monroe County Department of Transportation Vertical Curve Safety Study July 2011
The process used to complete the project analysis is illustrated in Figure ES-2.
Figure ES-2 – Filter Flowchart to Identify High Priority Candidate Vertical Curve Locations
3 yr Accident Rate/ Average Accident Rate Ratio > 1
Safety Score >11
Profile Check Indicates Non-Standard Sight Distance near
the Crest
Video Check Indicates Sight Distance may
be Limited
No Further Action
No
No
No
No
Yes
Yes
Yes
Yes
No Figure ES-2
Field Measurement
Confirm VC
Identification of all Monroe
County Links and Nodes
Filter B
Filter C
Filter D
Filter E
Filter F
Locations Mitigated
Develop Recommendations
Filter A
Indicate Locations and Review
Detailed Accident Reports

ES-4
Monroe County Department of Transportation Vertical Curve Safety Study July 2011
“Filter A” – Accident Ratio Comparison 1. A total of 1,678 nodes and 2,803 links for a total of 4,481 locations were identified
within the County Route road system. 2. A spreadsheet was created to track the entries associated with each location. 3. The accident rates for reportable accidents for each link and the average accident
rates were identified. 4. The ratio between the Average Three Year Accident Rate and the Average Accident
Rate was calculated. 5. All locations with ratios greater than or equal to one were identified as potential
candidate locations and progressed to the next filter (Filter B). A total of 1,303 locations were progressed.
“Filter B” – Safety Score Determination
1. The total number of accidents where the terrain description included reference to a curve was logged for each location listed. The following “roadway characteristic” codes were transferred to the link calculation spreadsheet:
03 - Straight and Hillcrest 04 - Curve and Level 05 - Curve and Grade 06 - Curve and Hillcrest
All accidents with curve codes were included in the analysis to encompass accidents located on a vertical curve that may have been miscoded in the accident report.
2. The Average Daily Traffic (ADT) volume was entered for each link. 3. The 85th Percentile speed was estimated and entered into the spreadsheet for each
link identified in this filter. The speed limit plus 10 mph was used to estimate the 85th Percentile speed.
4. Terrain Navigator Pro software was used to determine the vertical curve locations for each location with an accident rating ratio greater than one. After the grade variations were confirmed in a later step, the SSD and ISD were measured and entered into the calculation sheet
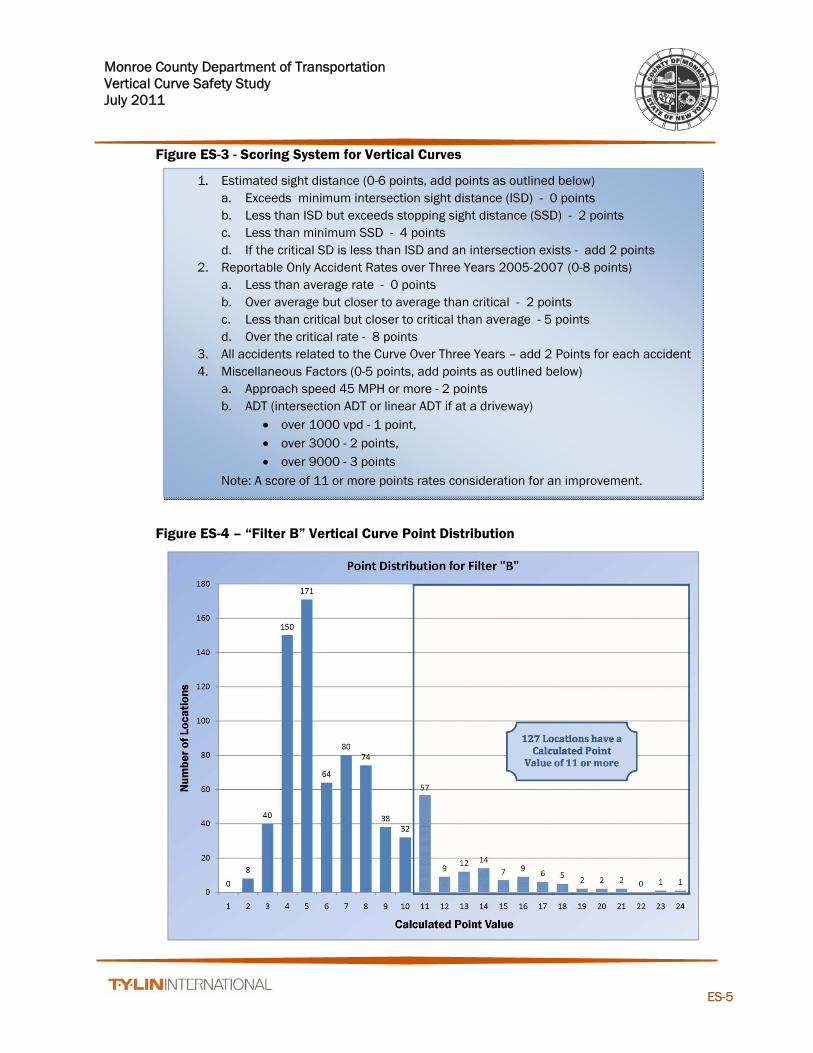
5. A point system was developed considering the accidents, volume, speed and estimated sight distance. The total point value was evaluated for each location identified within this filter and sorted from highest to lowest. A total of 127 locations were identified with a safety score of eleven (11) or greater and, based on statistical analysis significance, were progressed to the next level (Filter C). Figure ES-3 outlines the point determinations scale used to determine the overall scores. Refer to Figure ES-4 for a breakdown of the total number of locations based on the overall total score value.
ES-5
Monroe County Department of Transportation Vertical Curve Safety Study July 2011
1. Estimated sight distance (0-6 points, add points as outlined below) a. Exceeds minimum intersection sight distance (ISD) - 0 points b. Less than ISD but exceeds stopping sight distance (SSD) - 2 points c. Less than minimum SSD - 4 points d. If the critical SD is less than ISD and an intersection exists - add 2 points
2. Reportable Only Accident Rates over Three Years 2005-2007 (0-8 points) a. Less than average rate - 0 points b. Over average but closer to average than critical - 2 points c. Less than critical but closer to critical than average - 5 points d. Over the critical rate - 8 points
3. All accidents related to the Curve Over Three Years – add 2 Points for each accident 4. Miscellaneous Factors (0-5 points, add points as outlined below)
a. Approach speed 45 MPH or more - 2 points b. ADT (intersection ADT or linear ADT if at a driveway)
over 1000 vpd - 1 point, over 3000 - 2 points, over 9000 - 3 points
Note: A score of 11 or more points rates consideration for an improvement.
Figure ES-3 - Scoring System for Vertical Curves
Figure ES-4 – “Filter B” Vertical Curve Point Distribution

ES-6
Monroe County Department of Transportation Vertical Curve Safety Study July 2011
“Filter C” – USGS Profile Check The 127 locations isolated in the previous filter with the highest overall total point values were evaluated for sight distance with United States Geotechnical Survey (USGS) maps to isolate vertical curve locations. A total of 86 locations with potential sight distance issues were progressed to the next filter (Filter D).
“Filter D” – Video Check Vertical curve locations analyzed within this filter were verified with video. If the video inspection revealed limited sight distance over the vertical curve’s crest and the safety score was eleven (11) or greater, the locations were further investigated. A total of 15 locations were progressed to the next filter (Filter E).
“Filter E” – Survey Check
1. Each of the 15 vertical curve locations was profiled with survey data using LIDAR to obtain detailed contour points.
2. Based on MCDOT speed data (which replaced the estimated 85th Percentile speed used in Filter B), the preferable Stopping Sight Distances (SSD) and Intersection Sight Distances (ISD) were overlaid onto each profile.
3. Out of the 15 locations analyzed with the video check, 14 were determined to have vertical curve crest profiles that conflict with the preferable Stopping Sight Distances (SSD) and Intersection Sight Distances (ISD). These 14 locations were progressed to the next filter (Filter F) for identification and mitigation recommendation.
“Filter F” - Recommendations Short term and long term recommendations were considered and identified if appropriate for each of the vertical curve locations isolated within this filter. A total of 14 locations were detected and plotted on Geographic Information System (GIS) map to display the High Priority Candidate Vertical Curve Locations within the County. Within this filter, details of the MV104 accident reports were checked. Information pertaining to the type of accident, location of the vehicle(s) before the collision, traffic condition, light condition, weather, road surface condition, and collision type were investigated to isolate accident patterns and to determine corrective mitigation measures. Each candidate vertical curve location recommended for remediation through this filter was plotted on a GIS map to identify cluster locations and recommend mitigation measures to improve safety at the vertical curve. Figure ES-5 illustrates clusters of vertical curve locations with respect to the overall vertical curve locations identified in the beginning of this study. A majority of the High Priority Candidate Vertical Curve Locations recommended for mitigation are located on the southeast side of Monroe County in eight different towns.

ES-7
Monroe County Department of Transportation Vertical Curve Safety Study July 2011
Figure ES-5 includes a list of the 14 candidate vertical curve locations rated from highest priority to lowest priority based on the total overall score. Information pertaining to the road name and the location of the vertical curve are reported in this table.
To remediate the High Priority Candidate Vertical Curve Locations within the County, a series of mitigation measures ranging from “short term” to “long term” are recommended. The mitigation measures recommended for each priority vertical curve location is intended to increase the existing sight distance and/or reduce the driver speeds while minimizing physical change to cross street profiles and driveway grading. Based on record data, survey data, geometrical configurations and surrounding terrain, short term and long term mitigation measures are suggested to improve current safety conditions for the candidate vertical curve locations. No Action Required At 8 of the 14 curve locations, the safety record indicates that the existing conditions are adequate, even though the sight distance may be limited. Warning signs are posted where required, passing is prohibited, and no accident patterns related to the curves were found. Short Term Mitigation Improvements such as new sign panels and passing zone restrictions can be implemented within a short period that may address and reduce the potential for accidents related to the vertical curve. The following short term mitigation measures can be applied immediately minimal planning:
Passing zone restriction Elimination of existing passing zones within the vertical curve minimizes the potential for head on collisions. This measure is recommended for four locations as identified in Figure ES-6.
Advisory speed limit plaque An advisory speed limit sign is used to supplement an intersection warning sign with a speed recommendation based on the operating characteristic and condition of the road section. As illustrated in Figure ES-6, a 40 MPH advisory speed is recommended in one location based on Manual on Uniform Traffic Control Devices for Streets and Highways (MUTCD) requirements.
Intersection warning signs An Intersection warning sign is positioned before an intersection to notify the drive of an upcoming intersection and the possibility of turning or entering traffic. An intersection warning sign is recommended in one location based MUTCD requirements.

ES-8
Monroe County Department of Transportation Vertical Curve Safety Stud July 2011

ES-9
Monroe County Department of Transportation Vertical Curve Safety Study July 2011
Long Term Mitigation Other safety enhancements require funding to be identified and to allocate design and construction time. The costs associated with each of the long term recommendations presented in this study are based on isolated locations. Spot improvements are typically more costly per linear foot to construct than more extensive construction projects. Therefore, it is recommended that the long term modifications outlined in this study be implemented during the next road improvement project opportunity. The following examples demonstrate long term improvements that facilitate improved maneuverability and/or enhanced sight distance: Widen shoulder sections
Five (5) to eight (8) foot wide paved shoulders along both sides of the road provide a refuge area for parked vehicles or for a car to pass a stopped vehicle. Five (5) foot wide paved shoulders along both sides of the road improve the driver’s maneuverability and ability to avoid a crash. Approximately twenty percent of the candidate vertical curve locations identified within this study are recommended for this type of mitigation.
Profile adjustment Adjustments made to a vertical curve crest to lengthen the curve can increase the
stopping sight distance within the vertical curve. Based on accident histories and the level of potential physical impacts and costs, profile adjustments are not recommended for the candidate vertical curve locations.
A range of mitigation options and the projected costs associated with the improvements for the short term and long term time frames are identified in Figure ES-6. The table collectively represents the short term and long term recommendations for each of the 14 High Priority Candidate Vertical Curve Locations identified. An estimate of the cost (in current dollars) to implement each improvement is included in the table for Monroe County Department of Transportation’s consideration. Conclusion Shoulder improvements are recommended in three locations. Canfield Road has a high occurrence of parking and pedestrian activity within the area of two vertical curves. The other two locations were selected based on high operating speeds within areas with ineffective shoulder sections limiting driver maneuverability. Out of the 4,481 link and node locations analyzed in this Report, 14 High Priority Candidate Vertical Curve Locations were identified. These locations were prioritized based on an overall score comprised of accident data, Annual Daily Traffic (ADT) volumes, 85th percentile speed and stopping sight distances. Using a sensitivity analysis, an eleven (11) point cut-off value was identified. As such, based on the criteria used for this study, 14 High Priority Candidate Vertical Curve Locations are studied and 6 are recommended to Monroe County Department of Transportation for mitigation consideration. No action is required for the other 8. Specific locations are identified in Figure ES-6.

ES-10
Monroe County Department of Transportation Vertical Curve Safety Study July 2011
Figure ES-6 –Table of Recommended Improvements
Road/Town Description Points Improvement Description Costs Improvement Description Costs Comments
1 Canfield Road, Mendon V. C. "A" is approx. 2,050' west of Mendon Center Rd. 24 No Action Recommended $0Install new 3,300 LF 8' wide shoulder on both sides of Canfield Road at Vertical A -B $584,430
V. C. "B" is approx. 1,460' west of Mendon Center Road. No Action Recommended $0$0 $584,430 $584,430
2 Ayrault Road, Perinton Intersection of Ayrault Rd. and Willowick Dr. 23Add a W2-2 "Intersection Warning" sign on Ayrault Road (EB), west of Willowick Drive $350 No Action Recommended $0
The shoulder width and clear zone within the studied area is appropriate for the road and the actual stopping sight distance is within 5 feet of the recommended intersection sight distance.
$350 $0 $350
3 Turk Hill Road, Perinton 460 ft’ south of Whisperwood Dr. 19 No Action Recommended $0 No Action Recommended $0The road section within the proximity of the vertical curve is clearly signed/marked and the pavement section is adequate.
$0 $0 $0
4 Turk Hill Road, Perinton 720’ north of Ayrault Rd. 19 No Action Recommended $0 No Action Recommended $0The road section is clearly signed/marked and the pavement section is appropriate for the road. The actual stopping sight distance is within 15 feet of the recommended stopping sight distance.
$0 $0 $0
5 Middle Road, Henrietta 1,025’ south of Erie Station Road 18 No Action Recommended $0 No Action Recommended $0
The road section is clearly signed/marked and the shoulder width and clear zone are appropriate for the road. Because several driveways are located within the vertical curve, there would be substantial impacts to adjust the profile.
$0 $0 $0
6 Calkins Road, Henrietta Approximately 900’ west of Henrietta-Pittsford Rd. 17 No Action Recommended $0 No Action Recommended $0 The road section is clearly signed/marked and the pavement section is appropriate for the road. $0 $0 $0
7 Boughton Hill Road, Mendon Approximately 1,000’ east of West Bloomfield Rd. 16Eliminate the existing eastbound passing zone within the proximity of the curve (approximately 300'). $225
Install new 3,800 LF 6' wide shoulder on both sides of Boughton Hill Road at the Vertical Curve $564,470
Within the vertical curve section, a passing zone exists. The speed limit is 55 mph and the pavement section is narrow without a paved shoulder section.
$225 $564,470 $564,695
8 Turk Hill Road, Perinton Approx. 500’ north of Whisperwood Dr. 16 No Action Recommended $0 No Action Recommended $0The road section within the vertical curve is clearly signed/marked and the shoulder width and clear zone are appropriate for the road.
$0 $0 $0
9 North Road, Wheatland Approx. 1,100’ west of Wheatland Center Road. 16Eliminate the existing westbound passing zone within the proximity of the curve (approximately 700'). $525
Install new 3,000 LF 5' wide shoulder on both sides of North Road between Cedar Ave. and Wheatland Center Road $388,400
Within the vertical curve section, a passing zone exists. The speed limit is 55 mph and the lane widths and shoulder sections are narrow.
$525 $388,400 $388,925
10 Morgan Road, Chili 1,340’ east of Union Station 15Eliminate the existing eastbound passing zone within the proximity of the curve (approximately 400'). $300 No Action Recommended $0
A passing zone is located within the vertical curve section and the shoulder width and clear zone are appropriate for the road.
$300 $0 $300
11 Ayrault Road, Perinton Approx. 800’ east of Hogan Road 14 No Action Recommended $0 No Action Recommended $0The road section is clearly signed/marked and the shoulder width and clear zone are appropriate for the road.
$0 $0 $0
12 East River Road, Henrietta Intersection of East Henrietta Road and Brooks Rd. 14 No Action Recommended $0 No Action Recommended $0Intersection warning signs are present and the pavement section within the proximity of the vertical curve is adequate.
$0 $0 $0
13 Reed Road, Sweden Vertical curve “A” is approx. 215’ west of Root Rd. 14Eliminate the existing westbound passing zone within the proximity of the curve (approximately 700'). $375 No Action Recommended $0
Vertical curve “B” is approx. 800’ west of Root Rd.
Add W13-1P, "40 MPH" advisory speed panel to the existing W2-2 sign on Reed Road, west of Root Road in the eastbound direction near V.C. "B". $150 No Action Recommended
$525 $0 $525
14 Bennett Road, Parma Approx. 530’ north of Curtis Rd. 12 No Action Recommended $0 No Action Recommended $0The southbound approach is well signed before the stop sign and speeds are low on the approach.
$0 $0 $0* Include accidents involving deer and accidents outside of the vertical curve
TOTAL COSTS: $1,925 $1,537,300 $1,539,225
Total Costs per Location
Short Term Recommendations Long Term Recommendations
Two vertical curves exist within this section. Roadside parking occurs on the shoulder and pedestrian activity is high.
Due to the intersection, a passing zone restriction and an advisory speed on the advanced intersection warning sign is recommended. The lane widths and shoulder sections are narrow in this section.