Monk, Courtenay; Sandefur, Justin; Teal, Francis …...Does Doing an Apprenticeship Pay Off?...
40
www.ssoar.info Does doing an apprenticeship pay off? Evidence from Ghana Monk, Courtenay; Sandefur, Justin; Teal, Francis Veröffentlichungsversion / Published Version Arbeitspapier / working paper Empfohlene Zitierung / Suggested Citation: Monk, C., Sandefur, J., & Teal, F. (2008). Does doing an apprenticeship pay off? Evidence from Ghana. (RECOUP Working Papers, 12). Cambridge: University of Cambridge, Faculty of Education, Research Consortium on Educational Outcomes and Poverty (RECOUP). https://nbn-resolving.org/urn:nbn:de:0168-ssoar-68637 Nutzungsbedingungen: Dieser Text wird unter einer CC BY-NC-ND Lizenz (Namensnennung-Nicht-kommerziell-Keine Bearbeitung) zur Verfügung gestellt. Nähere Auskünfte zu den CC-Lizenzen finden Sie hier: https://creativecommons.org/licenses/by-nc-nd/4.0/deed.de Terms of use: This document is made available under a CC BY-NC-ND Licence (Attribution-Non Comercial-NoDerivatives). For more Information see: https://creativecommons.org/licenses/by-nc-nd/4.0
Transcript of Monk, Courtenay; Sandefur, Justin; Teal, Francis …...Does Doing an Apprenticeship Pay Off?...
www.ssoar.info
Does doing an apprenticeship pay off? Evidencefrom GhanaMonk, Courtenay; Sandefur, Justin; Teal, Francis
Veröffentlichungsversion / Published VersionArbeitspapier / working paper
Empfohlene Zitierung / Suggested Citation:Monk, C., Sandefur, J., & Teal, F. (2008). Does doing an apprenticeship pay off? Evidence from Ghana. (RECOUPWorking Papers, 12). Cambridge: University of Cambridge, Faculty of Education, Research Consortium on EducationalOutcomes and Poverty (RECOUP). https://nbn-resolving.org/urn:nbn:de:0168-ssoar-68637
Nutzungsbedingungen:Dieser Text wird unter einer CC BY-NC-ND Lizenz(Namensnennung-Nicht-kommerziell-Keine Bearbeitung) zurVerfügung gestellt. Nähere Auskünfte zu den CC-Lizenzen findenSie hier:https://creativecommons.org/licenses/by-nc-nd/4.0/deed.de
Terms of use:This document is made available under a CC BY-NC-ND Licence(Attribution-Non Comercial-NoDerivatives). For more Informationsee:https://creativecommons.org/licenses/by-nc-nd/4.0
RECOUP Working Paper 12
Does Doing an Apprenticeship Pay Off?Evidence from Ghana
Courtney Monk, Justin Sandefur and Francis TealUniversity of Oxford
January 2008
OthoGinimesTD
M
Does Doing an Apprenticeship Pay Off? Evidence from Ghana∗
Courtney Monk†, Justin Sandefur and Francis TealCentre for the Study of African Economies
Department of EconomicsUniversity of Oxford
January 2008
Abstract
In Ghana there is a highly developed apprenticeship system where young men and womenundertake sector-specific private training, which yields skills used primarily in the informalsector. In this paper we use a 2006 urban based household survey with detailed questions onthe background, training and earnings of workers in both wage and self-employment to askwhether apprenticeship pays off. We show that apprenticeship is by far the most importantinstitution providing training and is undertaken primarily by those with junior high schoolor lower levels of education. The summary statistics indicate that those who have done anapprenticeship earn much less than those who have not. This suggests that endogenous se-lection into the apprenticeship system is important, and we take several measures to addressthis issue. We find a significant amount of heterogeneity in the returns to apprenticeshipacross education. Our most conservative estimates imply that for currently employed people,who did apprenticeships but have no formal education, the training increases their earningsby 50%. However this declines as education levels rise. We argue that our results are con-sistent with those who enter apprenticeship with no education having higher ability thanthose who enter with more education.
Keywords: Apprenticeship; Africa; Training; Treatment; Control functionJEL Classification Codes: O12; J24
∗The data used in this paper were collected by the Centre for the Study of African Economies (CSAE),xford, in collaboration with the Ghana Statistical Office (GSO) in 2006. The survey was funded in part bye Department for International Development (DfID) of the UK as part of its work on assessing the outcomes
f education and the Economic and Social Research Council (ESRC) as part of the Global Poverty Researchroup. We have been assisted by numerous collaborators in enabling us to collect this data. We are also greatlydebted to Moses Awoonor-Williams, Geeta Kingdon and Andrew Zeitlin for their assistance in the design andplementation of the survey. We would also like to thank seminar participants in Oxford and Cambridge,pecially Christopher Colclough and Geeta Kingdon, who provided very helpful comments on an earlier draft.his paper forms part of the Research Consortium on Educational Outcomes and Poverty (RECOUP). NeitherfID nor any of the partner institutions are responsible for any of the views expressed here.†Corresponding author: [email protected]; Economics Department, Manor Road Building,
anor Road, Oxford OX1 3UQ, United Kingdom; Tel: +44 (0)1865 271077.
1
bs364
Typewritten Text

1 Introduction
Skills training in Ghana occurs in both the private and public sectors. By far the most important
institution which provides such training in the private sector is the traditional apprenticeship
system. Apprentices are young men and women who undertake highly sector-specific training.
Some of these apprentices then go on to form their own businesses, others go on to work in
the firm in which they were apprentices as masters/mistresses, some move to other firms or
occupations. While much is known about the institution in terms of its structures and forms,
we know much less about how well apprenticeship pays relative to other forms of training and
relative to more academic education. Given the prevalence of apprenticeships, we believe that
improving our knowledge about the returns to such training is very important. Moreover, in light
of the rise in the importance of the informal sector in providing job opportunities in urban areas
(Kingdon, Sandefur, & Teal, 2006), and the accompanying dominance of apprenticeship as the
training option in this sector, the questions regarding the size of the returns to apprenticeship
are all the more relevant.1
We attempt to fill the gap in the literature by focusing here explicitly on apprenticeships.
We begin by speculating about the underlying dimensions of apprenticeship training, both
economic and social. The economic consequences from doing an apprenticeship are twofold:
apprenticeships raise one’s potential earnings and also improve one’s chances of having a job.
In addition, apprenticeship is a social as well as an economic undertaking for many young
Ghanaians. As apprentices, young people mature while developing job-oriented skills.
In this paper we focus exclusively on the effect of apprenticeships on earnings for those people
who report an earned income. We abstract from the issue of labour market participation.
Rather, we are choosing to compare two similar groups: income earners who have not invested
in apprenticeship training and income earners who have. Therefore our research question is1While we address questions specific to Ghanaian apprenticeship, the analysis links to the long history in
Ghana, and elsewhere, of the relative value of academic relative to vocational education (Foster, 1965a, 1965b)and to the policy debate as to how public provision compares with the private provision of training (Middleton,Ziderman, & van Adams, 1993).
2

very specific: does apprenticeship pay for those who have earned income?
Measuring these economic returns to apprenticeship is a difficult undertaking for three reasons.
First, the data requirements are quite important; as Frazer (2006) argues, apprenticeship is most
commonly a form of skill acquisition which pays off in self-employment if the apprentice acquires
sufficient capital to start their own business. Thus to establish the effect of apprenticeship it
is essential to observe individuals in both the wage and self-employment sectors. We use data
from the CSAE/GSO’s Ghana Urban Panel Household Survey (GUPHS) that includes detailed
information on training for individuals and measures the incomes of the self-employed with as
much accuracy as possible in a manner that allows incomes to be compared across the formal
and informal sectors.
Secondly, the endogeneity of education caused by omitted unobservables must be addressed.
We use a control function approach (in the first stage) in order to have a flexible functional
form in the earnings equation. In addition, we are interested in the interplay between education
and apprenticeship and must explicitly allow for the potential importance of the returns to
education being convex.
Finally, we deal with the endogeneity issues surrounding apprenticeship inherent in our non-
experimental data. The main reason why endogeneity would be an issue is an omitted variables
problem due to ability: people who are more able are more likely to earn a high return from
apprenticeship and earn a high income. Alternatively it may be true that less able people choose
apprenticeship over education more often than high ability people, or less able individuals have
difficulty finding jobs and therefore go into an apprenticeship. We control for ability by including
scores on skills tests and the score on the Raven’s test. An additional source of endogeneity
may be a specific “aptitude for apprenticing” which makes certain individuals benefit much
more from this type of training than others. To address endogeneity caused by ability bias
(that remains unobservable after the Raven’s test) and this so-called aptitude bias, we also
pursue an instrumenting strategy, using a treatment effects (IV) approach as well as a control
function in the first stage. The control function offers the advantage over the IV that allows for
3

heterogeneity across the education spectrum, which proves to be crucial here.
In the next section, we assess how important apprenticeship is as a form of training in order to
motivate the need for this analysis. In Section 3 we describe the relationship between education
and apprenticeship choices. Section 4 describes the data, and Section 5 discusses modeling
issues. Section 6 presents the results and argues that the payoff from being an apprentice
depends on the education level at which it is undertaken. In Section 7, we present an internal
rate of return analysis. A final section concludes.
2 How important is apprenticeship as a form of training?
We begin by establishing the importance of apprenticeship in Ghana.2 We draw on the 1984
and 2000 Ghanaian Censuses, the Ghana Living Standards Survey 4 (GLSS 4), and our own
data to argue that apprenticeship is a key form of training. It is common among workers in all
sectors but especially among urban workers in the informal sector.
Table 1: Manufacturing Employment in the Population Census
1984 2000 GrowthEmpl. Share Empl. Share Rate
Wage EmployeesPublic 27,172 4.6 34,275 4.3 1.5Private 65,931 11.2 100,174 12.7 2.6Apprentices 25,332 4.3 78,834 10.0 7.1Other 18,684 3.2 15,873 2.0 -1.0Total Employed 137,119 23.3 229,156 29.1 3.2
Self-EmployedWithout Employees 430,029 73.1 490,276 62.2 0.8With Employees 21,270 3.6 68,636 8.7 7.3Total Self-Employed 451,299 76.7 558,912 70.9 1.3
Total 588,418 100.0 788,068 100.0 1.8Source: Author’s calculations based on published statistics from the Ghana Statistical Service census reports
(Ghana Statistical Service, 1984, 2005).
As Table 1 shows, there has been a marked increase in the absolute number of (current) appren-2While there are several formal institutions that offer vocational training in Ghana, we focus here on traditional
apprenticeships that take place in the enterprise itself.
4

tices across the manufacturing sector in Ghana, and their portion of wage employees has also
risen substantially from 1984 to 2000. It is likely that much of the increase in the number of
people trained in apprenticeships has been absorbed by small firms and the self-employed.
Table 2: Training among working age Ghanaians, 1998-99, GLSS 4
Urban Rural AllNo. Share No. Share No. Share
Total SampleCurrent Apprentices 364 2.7 380 2.8 744 5.6Past Apprentices 1,008 7.5 1,473 11.0 2,481 18.5No Apprentice Training 3,472 25.9 6,706 50.0 10,178 75.9Total 4,844 36.1 8,559 66.4 13,403 100.0
Source: Author’s calculations based on the GLSS 4. Sample excludes those under age 15 and over age 65 and
those who did not report apprenticeship status.
Table 2 shows summary statistics for the working age population—all people between ages 15
and 65, whether in or out of the labour force—from the GLSS 4. Apprentices make up nearly
25% of working-age Ghanaians and 28% of urban residents, assuming the GLSS is a nationally
representative sample; this figure is even higher for the employed (figures not reported).
Table 3: Training and Apprentices in Ghana, 2006, GUPHS
No. ShareApprentices
No Formal Training 1,078 65.6Current Apprentices 122 7.4Past Apprentices 317 19.3Any Other Vocational/Technical Training 126 7.7Total 1,643 100.0
Training EventsCurrent Apprentices 122 15.4Past Apprentices 317 40.1Current vocational trainees 16 2.0Past vocational trainees 112 14.2Current on-the-job trainees 40 5.1Past on-the-job trainees 158 20.0Trained teacher/nurse 25 3.2Total number of training events 790 100.0
Source: Author’s calculations based on the GUPHS. Total number of training events does not account for double
counting, e.g. one person with vocational and apprenticeship training counts as two events.
5
Within our sample of people aged from 15 to 65 from the GUPHS, including those both in
and outside the labour force, 26.7% have done some form of training as an apprentice (see
Table 3).3 In Table 3 we also identify both current and past training events of all types (voca-
tional/technical, apprenticeship, on-the-job and teacher/nursing) in order to demonstrate that
apprenticeship is by far the most common.4 Current apprenticeships account for 15% of the
training events in the survey while past apprenticeships comprise 40%. The second most impor-
tant form of training is that classified as on-the-job, followed by vocational training, excluding
that for teachers and nurses, who constitute 3% of the training events.
2.1 Shortage of literature
We believe that we have now established the importance of apprenticeship as a form of skills
training in Ghana. Yet there is a dearth of research on this topic. Most studies investigate
the private and social returns to formal training in developing countries but there are few
papers on apprenticeships specifically (as indicated in the literature review by Middleton et
al. (1993)). Rosholm, Nielsen, and Dabalen (2007) find a 20% wage increase due to formal
training in Kenya and Zambia. However, they focus only on training undertaken at formal
vocational and technical institutions; apprenticeships are mentioned only briefly and are not
explicitly studied. Using data from Ghana, Jones (2001) finds a statistically significant, large
positive return to vocational training for wage earners when it is differentiated from formal
education. Jones (2001) does not highlight this result in her paper, but the coefficient in her
earnings equation is roughly .5, which, assuming her vocational variable is a dummy variable,
would imply that workers with formal vocational training earn 65% more than those who do
not, on average.
As for apprenticeships, Grootaert (1988) finds a small and insignificant return to years of ap-
prenticeship for urban residents and 17% increase in annual earnings from a year of appren-3This figure includes people who have also undertaken teaching and nursing training.4Many individuals do more than one form of training. The ”training events” in Table 3 do not correct for
double counting.
6
ticeship for rural residents in Cote d’Ivoire, though apprenticeship is not treated as endogenous
in the earnings equation. Mabawonku (1979), in contrast, found very high rates of return for
apprenticeships in northern Nigeria. In a more recent paper, Frazer (2006) uses Ghanaian Man-
ufacturing Enterprise Survey (GMES) and GLSS 4 data from the 1990s and presents earnings
equations in which the return to apprenticeship is very low on average, though he assumes
apprenticeship is exogenous. He finds with the GLSS 4 that wages rise by about 7% for those
with apprenticeship training in his sample that includes all workers; wage earners earn only
slightly more after doing an apprenticeship, though this is insignificant. However the return for
the self-employed, who benefit most from apprenticeship in Frazer’s model, is much higher at
19% and is statistically significant. He also finds in the GMES data that wage employees in the
manufacturing sector actually earn less if they have done apprenticeships.
In assessing the returns to apprenticeships this literature currently has two limitations. First,
nearly all of these papers look at the wage returns to training undertaken by those in wage
employment. By measuring self-employment in a manner comparable to wage earners, our data
(the 2006 GUPHS)allow us to assess the return in a more comprehensive and believable way.
Second, there is a distinct lack of research treating the econometric issues of endogeneity of the
apprenticeship decision. Our paper addresses both of these concerns.
3 Educational background and occupational outcomes of theapprentices
In Table 4 we present the educational background of the individuals in the sample and for
apprentices in order to asses how their educational patterns differ. Table 5 presents a similar
breakdown for occupational outcomes.
It is clear from Table 4 that by far the most common pattern for apprentices is to enter training
after the end of junior high school, which under the old education system was the end of middle
school. Of those individuals in the sample who had done an apprenticeship in the past, 74%
entered at the junior high school level. However, it will prove to be of importance for the results
7
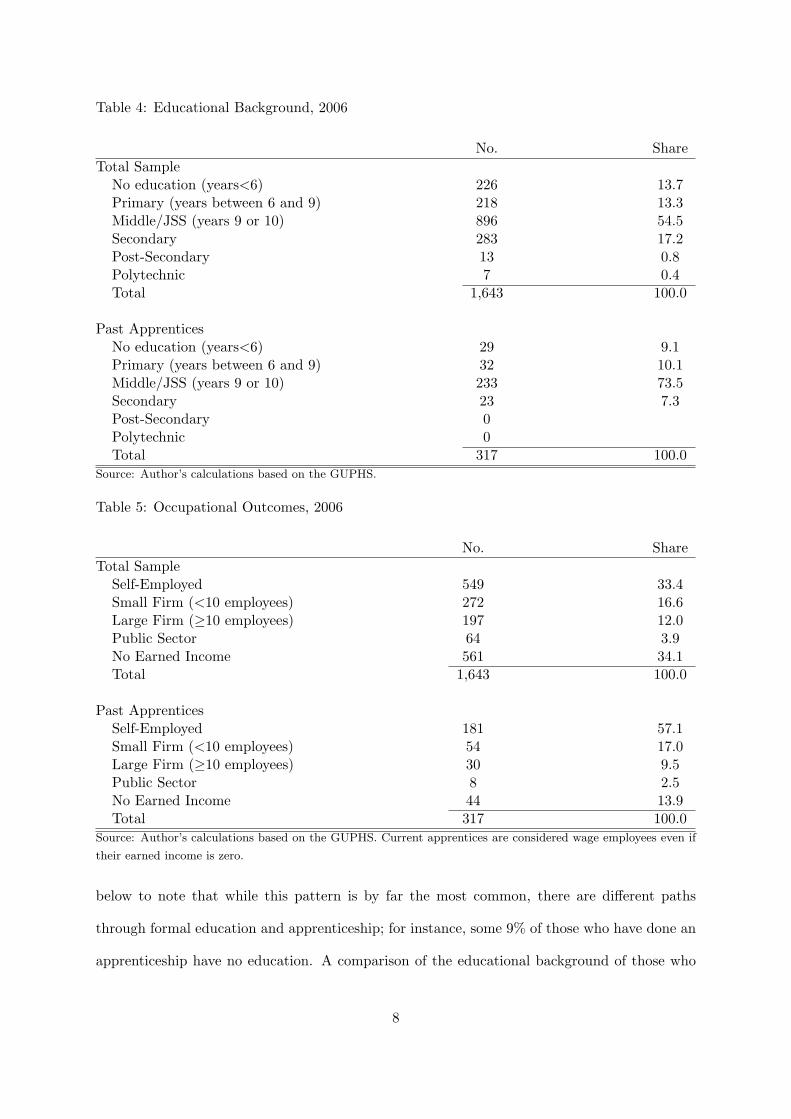
Table 4: Educational Background, 2006
No. ShareTotal Sample
No education (years<6) 226 13.7Primary (years between 6 and 9) 218 13.3Middle/JSS (years 9 or 10) 896 54.5Secondary 283 17.2Post-Secondary 13 0.8Polytechnic 7 0.4Total 1,643 100.0
Past ApprenticesNo education (years<6) 29 9.1Primary (years between 6 and 9) 32 10.1Middle/JSS (years 9 or 10) 233 73.5Secondary 23 7.3Post-Secondary 0Polytechnic 0Total 317 100.0
Source: Author’s calculations based on the GUPHS.
Table 5: Occupational Outcomes, 2006
No. ShareTotal Sample
Self-Employed 549 33.4Small Firm (<10 employees) 272 16.6Large Firm (≥10 employees) 197 12.0Public Sector 64 3.9No Earned Income 561 34.1Total 1,643 100.0
Past ApprenticesSelf-Employed 181 57.1Small Firm (<10 employees) 54 17.0Large Firm (≥10 employees) 30 9.5Public Sector 8 2.5No Earned Income 44 13.9Total 317 100.0
Source: Author’s calculations based on the GUPHS. Current apprentices are considered wage employees even if
their earned income is zero.
below to note that while this pattern is by far the most common, there are different paths
through formal education and apprenticeship; for instance, some 9% of those who have done an
apprenticeship have no education. A comparison of the educational background of those who
8

did an apprenticeship with the whole sample shows that it is those with junior secondary or
below who are more likely to be apprentices than those with higher levels of education. Indeed
there is nobody in the sample who undertook an apprenticeship who completed a post secondary
qualification.
Table 5 shows that the most common pattern for apprentices is to be self-employed. Many
of them also work in small firms (as defined as firms with fewer than 10 employees). This is
further evidence that the role of apprenticeship in urban settings is very particularly important
for informal sector jobs.
4 Measuring incomes for the self-employed
In order to answer the question does apprenticeship pay it is clearly crucial to be able to measure
self-employment income. Our data are taken from a longitudinal labor market survey conducted
by the Centre for the Study of African Economies (CSAE) at Oxford University, under the
direction of the authors and in collaboration with the Ghana Statistical Office (GSO). The
urban panel survey collects information on incomes, education and labor market experience,
household characteristics and various other modules for labour force participants (ages 15 to
65) in urban areas. For Ghana these areas span the four largest urban centers in the country:
Accra (and neighboring Tema), Kumasi, Takoradi and Cape Coast. The samples were based
on a stratified random sample of urban households from the 2000 census in Ghana.5 While the
initial sample was household based, interviews were conducted on an individual basis, and the
unit of analysis in what follows will be at the individual level.
Collecting income data on the self-employed in low-income countries is a controversial endeavor.
Field guides for the World Bank’s Living Standards Measurement Surveys (LSMS), which serve
as the international standard for household surveys in development economics, recommend5We should note that the analysis in this paper does not incorporate data from the Ghana Manufacturing
Enterprise Survey (GMES). The GUPHS and the GMES are conducted in parallel with a common survey instru-ment. However, we restrict ourselves in this paper to the population based sample of the GUPHS, excluding thefirm-based sample of manufacturing employees interviewed through the GMES. A total of 830 were interviewedin the first round of the survey in Ghana, which was conducted between October 2003 and June 2004.
9
survey managers not collect this information. The stated rationale is that self-employed business
people in the informal sector rarely keep written accounts and their self-reported income data
may be too noisy to be of use. For household based enterprises, the distinction between business
and personal expenditures may be completely alien to respondents. We acknowledge the validity
of these concerns.
However, because the non-agricultural self-employed constitute a majority of the urban working
population in Ghana, we feel measuring such incomes is essential to our current objective
of understanding the impact of apprenticeship on welfare. Our income measure for the self-
employed is based on self-reported profits. Profits are net of routine operating expenses and
gross of fixed capital expenditure, if any. The concepts of “revenue”, “business costs”, and
“profits” are explained to respondents by enumerators with experience in conducting firm and
household surveys. As the surveys are entered directly onto handheld computers, a simple
mechanical check forces enumerators to go over the numbers again if revenue, cost and profit
figures are inconsistent. Enumerators have reported few conceptual difficulties with this portion
of the questionnaire.6
5 Modeling the effects of training
Because apprenticeship is a binary variable, there are several approaches that we use to model its
impact on earnings. Our estimation strategy broadly follows two methods. In one approach, we
draw on the program evaluation literature and estimate the treatment effect of apprenticeship
training using IV. We estimate the results under various assumptions. We also attempt to
improve on the efficiency of the estimators where possible. In a second method, we use a
control function in the first stage, essentially treating apprenticeship as a simple endogenous
regressor like any other. Both methods rely on the same set of instruments (discussed in Section6In the results in Section 6, we do not “trim the sample” to account for possible misreporting of earnings.
However, we did rerun the regressions without the bottom 1% and top 1% of income earners, and the resultswere unchanged.
10
5.3).7
5.1 Treatment effects
Let’s start with the treatment effects approach.8 Let a be the binary treatment indicator (where
a = 1 denotes treatment and a = 0 otherwise), and the outcome of interest is defined as y0
without treatment and y1 with treatment. In our analysis, a is apprenticeship, and the outcome
of interest is earnings. The standard problem is that we do not observe the counterfactual, i.e.
what earnings would be for the apprentice had he/she not done the apprenticeship. The average
treatment effect (ATE) is defined as:
ATE = E(y1 − y0)
The average treatment effect on the treated (ATT) is then:
ATT = E(y1 − y0|a = 1)
In this paper, we are most interested in determining ATT, as we want to find out how appren-
ticeship has affected earnings for those people who have actually done it. The observed outcome
y can be expressed as:
y = y0 + a(y1 − y0)
If we express y0 and y1 as the sum of their means and stochastic parts:
y1 = µ1 − v1,E(v1) = 0 (1)
y0 = µ0 − v0,E(v0) = 0 (2)
it is then helpful to express y as a switching model:
y = µ0 + (µ1 − µ0)a + v0 + a(v1 − v0) (3)7As discussed in Section 3, the link between education and the returns to apprenticeship are crucial in this
analysis. As will become clear below, the problem of a common support meant that we did not pursue a propensityscore matching analysis of the data and instead chose a more flexible framework.
8Note that this section relies heavily on the exposition in Chapter 18 of Wooldridge (2002), as well as Fafchamps(2006).
11
The ATE (unconditional on x) is then the coefficient on a, and the last term allows for an
individual-specific effect of a. Estimating Equation 3 by OLS yields inconsistent estimates
because typically a is correlated with the error term, i.e. participation in training is correlated
with some unobserved characteristic(s). However, if v0 = v1, which implies that ATE=ATT ,
and a is randomly assigned, then OLS estimates are consistent because the last term disappears.
Alternatively, assuming that y0 and y1 are mean independent of a as opposed to v0 = v1 would
also produce consistent OLS estimates because E(v1 − v0|x, a) = E(v1 − v0|x) = 0.
5.1.1 Homogeneous treatment
In this paper, we start by adopting the assumption that the stochastic (unobservable) elements
of y0 and y1 are equal: v0 = v1. This is also known as the common treatment effect assumption
(because it implies ATE = ATT ). It does not allow for size of the treatment effect to vary over
different values of x, and it explicitly imposes homogeneous treatment effects across individuals.
It implies that everyone benefits in the same way from the treatment. We can then write down
the following simple Mincerian wage model (Mincer, 1974):
Models 1a, 1b: ln(wage)i = γ + αai + xiβ0 + u0i (4)
where ai is a dummy variable that takes the value of 1 if the person has completed an apprentice-
ship and zero otherwise, and xi is an vector of individual characteristics. We are interested in
finding out the value of α, the ATE. Although we do not have the interaction term from Equa-
tion 3 to worry about, we still want consider the possibility that a and u0 may be correlated.
If we believe a to be endogenous, then this regression can be estimated by IV, instrumenting
the endogenous binary variable with instruments z (Wooldridge, 2002). This is also called the
dummy endogenous variable model (Heckman, 1978). We will refer to this method as Model
1a. Although v0 = v1, we do not need the additional assumption of conditional mean indepen-
dence of the treatment a and v0 and v1 (conditioned on x). This is because the interaction
term in Equation 3 will disappear (and hence no interaction term is included in Equation 4).
Conditional mean independence is replaced with the standard IV assumptions that a vector z
12

of instruments is available. Thus the three assumptions necessary for Model 1a are: v0 = v1;
L(v0|x, z) = L(v0|x); and L(a|x, z) 6= L(a|z) (where L is the linear projection).
To improve on the efficiency of the simple IV estimator from Model 1a when the endogenous
variable is binary, one can adopt slightly stronger assumptions: v0 = v1; E(v0|x, z) = L(v0|x) or
the expectation of v0 is linear in x; P(a = 1|a,x) = G(x, z) is of known parametric form; and
V ar(v0|x, z) = σ20 (homoskedasticity). Effectively, we alter Model 1a to estimate a probit model
in the first stage P(a = 1|a,x) = G(x, z) by maximum likelihood, here regressing apprenticeship
on x and z, and then using the predicted values Gi (the propensity score) from this probit as
the instrument in the second stage. We will refer to this as Model 1b.
5.1.2 Heterogeneous treatment
In Models 1a and 1b, we have assumed that v0 = v1. However, it is more interesting to consider
the possibility that ATE and ATT may not be equal across individuals and that treatment
effects may be heterogeneous. Indeed, we can allow for an individual specific effect, such that
v0 6= v1 by specifying a functional form for v0 and v1:
v1 = g1(x)− e1
v0 = g0(x)− e0
Here, we must assume conditional mean independence: E(y0|x, a) = E(y0|x) and E(y1|x, a) =
E(y1|x). If we also assume that g1(x) and g0(x) are linear functions and that E(v0) = E(v1) = 0,
then our equation that we would like to estimate becomes a heterogeneous treatment effects
model with an interaction term allowing for the treatment effect to vary over values of x:
Models 2a, 2b, 2c: ln(wage)i = γ + αai + xiβ0 + [ai(xi − x)]δ + errori (5)
It follows that consistent estimators of ATE and ATT are:
ATE = α
13

ATE(x) = α + ((xi − x)δ)
ATT (x) = α +
(N∑
i=1
ai
)−1 [ N∑i=1
ai(xi − x)δ
]where ATT is essentially the ATE weighted (conditioned) by participation. We can estimate
this regression by OLS, which we call Model 2a. If we drop the assumption E(v1) = E(v0) = 0
and replace it with E(v1|x, z) = E(v1|x) and E(v0|x, z) = E(v0|x), then we must also assume
e0 = e1 in order to have consistent estimates.
Keeping the linear form of g1(x) and g0(x), then we can use IV to estimate Equation 5. The
IV estimator with the interaction terms is still consistent. We can proceed with instrumenting
in two ways. First, we use the interaction of z with the demeaned covariates as instruments
(in addition to z). We call this Model 2b. Alternatively, we estimate the same probit P(a =
1|a,x) = G(x, z) in the first stage and find the predicted values. We use the predicted values, as
well as the predicted values interacted with the chosen demeaned covariates, as the instruments
in the second stage (Model 2c). This method is more efficient than Model 2b if we (again)
assume homoskedasticity of v0.
We are interested in heterogeneous treatment effects because it is quite possible that the return
to apprenticeship may vary along the education and/or experience spectrums. Indeed, we will
see later in the paper that the effect of apprenticeship on earnings is highly dependent on the level
of education that one has attained. Allowing for the interaction then between apprenticeship and
(demeaned) education as in Models 2a, 2b, and 2c will prove to be extremely important.
5.2 Control function
Finally, another approach outside of the treatment effects literature is the control function
which calls for a basic 2SLS. We estimate a first stage linear probability model by regressing
apprenticeship on the exogenous regressors and the instruments, while also controlling for city
fixed effects. Because this involves a generated regressor, standard errors must then be boot-
strapped in the second stage. It is worth nothing that this procedure is very similar to Model
1b, but we are simply using the residuals from our estimation of G as a regressor in the earnings
14
equation, and G is estimated by OLS. Although this approach makes the strong assumption
that we have correctly specified the parametric form for G, it potentially allows for more flexi-
bility in the functional form used for earnings. Indeed, we are able to introduce an interaction
term—apprenticeship interacted with demeaned education—into the modeling process in order
to compare the control function results with the results from Section 5.1.2. In addition, we use
a linear probability model in the first stage regression to simplify the correction (bootstrapping)
of the standard errors in the second stage.
5.3 Can we identify the effects of apprenticeship?
In this paper, we are concerned with two sources of endogeneity. The first is the standard
problem of the endogeneity of education, due to its correlation with unobserved elements in the
error term that simultaneously affect earnings and therefore bias the OLS results. The second
is the endogeneity associated with apprenticeship training.
5.3.1 Education
The labour economics literature on estimating the returns to education in the face of the endo-
geneity of education is extensive (see Card (2001) for a detailed discussion). In this paper we
adopt a control function approach, which allows greater flexibility than the standard IV. This is
crucial because of the convex nature of the returns to education, leading us to include a squared
education term in our specification. Education is instrumented with household background
variables that are correlated with the unobservables but not directly causally related to earn-
ings (or variable of interest): closest brother’s education (years) and closest sister’s education
(years). Those people without a brother and/or sister (a very small number, less than 1% of
our estimation sample) or a missing value are assigned the mean.9 These instruments are vari-
ables which are plausibly correlated (ideally strongly) with one’s own education, as they reveal
something about parental preferences for education as well as family background and common9We also experimented with dropping them and giving those without siblings a value of zero; these changes
do not affect the results in a significant way.
15
familial characteristics, but should have no relevant impact on one’s current earnings.
Other possibilities for instruments that we considered were mother’s education, father’s educa-
tion, distance from primary school, and distance from secondary school. Although these vari-
ables seem like good candidates a priori, they did not pass the overidentification tests and were
thus invalidated. Therefore we did not include them in our first stage control function.
5.3.2 Apprenticeship
There are two sources of endogeneity of apprenticeship. The first is an omitted variables problem
due to general ability, e.g. intelligence. Omitted ability will bias OLS estimates of the return
to apprenticeship upward if high ability individuals are more likely to do an apprenticeship. If,
on the other hand, it is the less able who cannot find a job or perform poorly in school who do
an apprenticeship, then the bias might be downward. The second source of endogeneity may be
unobserved “aptitude for apprenticing”, i.e. those who enter apprenticeships have unobserved
aptitude for such training and therefore experience higher returns than others would. This is
a standard selection story that would cause the OLS estimates to be biased upwards. Given
these potential directions of bias, we have no priors as to the overall sign of the bias in the
OLS.
We partly address the issue of unobserved ability by controlling directly for ability in the
earnings equation. We use several unique measures of ability which are usually unobserved to
the econometrician in other datasets. The GUPHS included four comprehensive skills tests:
mathematics, English and reading. In addition, a Raven’s test was administered to all the
individuals. This test aims to measure innate ability, ideally unrelated to academic learning.
Implementing individual scores on these tests as dependent variables in our earnings regression
should attenuate the omitted ability problem.
However, we are not convinced that the Raven’s test is capturing all of what constitutes ability.
Moreover, the problem of unobserved aptitude for apprenticing is also a concern. There is a
distinct possibility that there are other unobserved attributes that drive selection into appren-
16

ticeship. Therefore we choose instruments that address this problem of unobservables. We aim
to capture the decision to do apprenticeships by measuring access to an apprenticeship network
and access to outside capital. These concepts form the basis of our instrument choices.
The first instrument we use reflects familial apprenticeship networking. We determine the
number of other household members who have also done an apprenticeship. This is admittedly
a rather crude and inexact measure, as it is not taken from the household roster but is rather
dependent on whom in the household was interviewed at the individual level; however, it is
presumably still correlated with the true value.
We are also interested in assessing access to credit. The convexity of the returns to formal
education in Ghana imply that the best outcome by far for a child is to stay in formal education
through university. In part these returns are due to the access to lucrative public sector jobs
that comes with a university degree. For families who cannot afford the long-term investment in
education the apprenticeship system offers an access to private sector training, though they are
typically viewed as a last resort by parents—it is not viewed as a particularly desired outcome
(Haan & Serriere, 2002). However apprenticeships may require a fee, and there is certainly
an opportunity cost to doing them, so access to credit or savings matter for the decision to
undertake this investment.
Therefore we choose two additional instruments that have a bearing on an individual’s access to
capital: a dummy for household access to credit, which takes the value of one if anyone in the
household reported borrowing money from any source in the past year and zero otherwise; and a
dummy for having internal, piped water in the house as a wealth indicator. Those with missing
values for these three instruments are given the value of zero (the median and mode value of
each); borrowing is relatively rare, so we felt it would be distortionary to replace missing values
with the mean value. We had a choice to drop these observations but chose to keep the sample
size as large as possible. We also considered using a third instrument—the amount (in cedis)
others had borrowed in the household—but it was a weak instrument and tests indicated that
it was redundant. Excluding it from the instrument set raised the precision of our estimates
17

without affecting the point estimates in our final results.10
In addition, we make an explicit effort to ensure that these instruments (or at least a subset of
them) identify apprenticeship separately from education—the concern is that access to capital
influences formal education choices as well as apprenticeship. This concern does prove somewhat
important when we regress education on its own instruments as well as the instruments for
apprenticeship (results included in Appendix A, Table 13). However, the household’s access to
credit dummy is insignificant. This variable, then, is the most important for our identification
strategy. If our instruments are successful in identifying participation in the apprenticeship
system, then we should be able to find the causal effect of this training on earnings, conditional
on observable individual characteristics.
6 Does being an apprentice pay?
6.1 Returns to apprenticeship
In Table 6 we report the descriptive statistics on which our analysis will be based. The sample
is narrowed down to positive income earners. It excludes students, children under 1811, adults
over 65 and current apprentices. We assume that the individuals who did not complete the
skills tests were unable to do so and therefore received zeros (this is a small proportion of the
sample and does not change the results for the skills substantively). Observations with missing
values for other relevant variables are dropped. Overall we are left with 931 individuals with
an earned income.
The portion of apprentices in the sample is just under 29%. This reflects the fact that apprentices
are relatively more successful in finding a job and are therefore more likely to be employed than
others who have not done apprenticeships. Table 6 also suggests that there is an important10The contemporaneous nature of our instruments could be a possible criticism of this approach. Since the
GUHPS is part of a panel, it would be possible to look for lagged values of these instruments, although ideallywe would need to know the values of such variables at the time when the apprenticeship started. We did notpursue this possibility because this would have narrowed down our sample size. We leave this avenue open forfuture research.
11We did not include 15 to 18 year olds, even though some of them may be working, because as we are excludingstudents, this would impose artificial selectivity onto the sample.
18

Table 6: Summary Statistics
Past Apprentices Non-apprenticesN = 931 Mean St. Dev. Mean St. Dev.Male (=1 if male) 0.48 (0.50) 0.43 (0.50)Age (years) 34.1 (9.5) 36.1 (10.8)Raven’s Score (out of 20) 4.13 (4.48) 4.73 (4.96)Education (years) 8.56 (2.83) 8.08 (4.39)Experience (years) 16.7 (9.6) 21.9 (12.4)Monthly earnings (in 2006 cedis) 750,597 (604,817) 929,207 (945,326)Ln(monthly earnings) 11.15 (0.86) 11.26 (0.99)N 268 663
Median earnings by education and genderNo academic education (N = 136):
Monthly earnings 800,000 480,000Monthly earnings if female 686,000 420,000Monthly earnings if male 1,600,000 500,000
Any academic education (N = 795):Monthly earnings 600,000 700,000Monthly earnings if female 400,000 500,000Monthly earnings if male 800,000 800,000
Source: Author’s calculations based on the 2006 GUPHS. Experience is labour market experience, defined as
(Age - Education - Training time - 6). Training time is self-reported time (in years) spent in vocational training
and/or apprenticeship. Earnings for the self-employed are based on self-reported profits.
distinction in terms of earnings profiles between those who do apprenticeships after receiving
no formal education and those who do so after going to school.12 This divergence in earnings
for apprentices across the education spectrum, noted in Section 5.3, will prove important in the
regression analysis.
Table 7 presents the second stage earnings equations. Earnings here are defined as monthly
earnings in 2006 cedis. All the regressions include controls for additional skills tests and regional
dummies, whose coefficients are not reported here. We excluded other determinants of earnings,
such as occupation, because these are very likely to be determined in part by apprenticeship.
Columns [1], [2] and [3] present three basic earnings functions to establish a basis for how the12This distinction is a key reason why propensity score matching methods were difficult to use with these data.
First, a common support is difficult to achieve because it is very rare for people in higher education to pursueapprenticeships. Second, the common support that can be established by comparing those with similar educationlevels presents problems with too few observations. Third, we would like to model the relationship between thereturn to apprenticeship and the level of education explicitly using an interaction term; this would not be possiblewith propensity score matching.
19

effects of apprenticeship may impact on earnings. We do not address any endogeneity problems
in these columns. The first important thing to notice is that, without any controls, those with
apprenticeship training earn on average less than other workers without apprenticeship training
(Column [1]). This result clearly suggests selection into apprenticeship is an issue; no one would
undertake costly privately funded training that offered no or negative return, and as we have
already shown it is by far the most common form of training in Ghana.
In Column [2] we only control for gender, experience, hours worked and education, in Column [3]
we include our control for reasoning ability, the Raven’s score, as well as other skills (numeracy,
English and reading—these three coefficients are not reported and are statistically insignificant).
While this measure of ability decreases the return to education a little the impact is not large.
This is consistent with a very wide range of evidence that any positive upwards bias on the OLS
estimates of the return to education through any correlation between ability and education
are small (see Card (2001) for a review). This ability variable does seem to suggest that the
coefficient for apprenticeship in Column [2] is biased downwards due to ability, as the same
coefficient is now positive in Column [3]. It may be because relatively low ability people do
apprenticeships as an alternative to education. So, by controlling for ability, we find a positive,
though insignificant and small, return to apprenticeship.
In Columns [4] through [9] in Table 7, we introduce a term “Educ control”, which is the
predicted residuals from a first stage control function for education (this methodology then
requires bootstrapping of the standard errors because we have a generated regressor, which
we do to 1000 repetitions). First stage results can be found in the Appendix. In Column
[5], we follow the reasoning behind Model 2a and interact apprenticeship with (demeaned)
education.13 The ATE is then equal to .037, which means that apprenticeship has a small but
very reasonable return of 3.8% (= e.037 − 1). We can also consider how this return changes
across years of education. For example, for people with no years of education, earnings rise by13We also tested other specifications in which we included several other demeaned interaction terms, but they
were individually and jointly insignificant, so we were able to narrow it down to just the interaction term withdemeaned education.
20

Figure 1: Returns to Apprenticeship, based on Table 7 Model 2a.
-0.4
-0.2
0
0.2
0.4
0.6
0.8
1
0 2 4 6 8 10 12
Pa
yo
ff t
o a
pp
ren
tices
hip
in
ln
(ea
rnin
gs)
Education
Return Upper and Lower Bounds
just under 59% (= e(.037−.052∗(−8.22)) − 1) due to apprenticeship. This result is very precisely
identified.14 The effect of apprenticeship on earnings depends on when on the education path
the apprenticeship is undertaken. A graph of the ATE and its confidence intervals can be seen
in Figure 1.15 The return is statistically different from zero below six years of education, but
the confidence intervals do not allow us to reject the hypothesis of a positive return at the end
of secondary school. The ATT, which is the ATE weighted by participation, in Column [5] is
.02 for apprentices with the mean education level and .407 for those with no education. This
implies that former apprentices with no education increased their earnings by 50% by doing the
apprenticeship.
However, we have yet to control for any remaining endogeneity of participation in apprenticeship
that is not captured by the Raven’s score variable. This is presented in Columns [6] through
[10] in Table 7. Columns [6], [7], [8], and [9] use Model 1a, Model 1b, Model 2b, and Model 2c,
respectively. Columns [8] and [9] allow for the treatment effect to vary across levels of education,
which Model 2a implies is non-ignorable. First stage results are included in the Appendix. The14A linear combination of these two coefficients, evaluated for zero years of education (mean education is 8.22)
and using robust but not bootstrapped standard errors, gives a coefficient of .461 with a t-stat of 2.66 and aconfidence interval of .121 to .802, clearly different from zero.
15The confidence intervals for this graph are based on robust and not bootstrapped standard errors. Thistechnicality makes little difference to the graph’s message or appearance.
21
striking feature is that once we instrument for apprenticeship, the returns to this training rise
significantly, and the coefficient on the interaction term becomes positive. The precision of the
IV estimates is not as high as one would hope; this may be because the IV specification is too
rigid to capture non-linearities across the education spectrum.
Column [10] offers a more flexible control function approach, where the first stage for apprentice-
ship is run as a linear probability model. “App Control” refers to the predicted residuals from
this first stage (the results of the first stage are in the Appendix). Here again, as in Columns [8]
and [9], the coefficient on the apprenticeship dummy is much higher than in Column [5]. This
indicates that we may be correct in thinking that there are additional unobservable characteris-
tics that bias the OLS results downwards. Specifically, general ability of the average apprentice
could be quite low and thus pushes down the observed return. This result also provides rather
strong evidence that an upward bias of the OLS induced by aptitude for apprenticing is not
present—otherwise the point estimate in Column [10] would be closer to if not lower than Col-
umn [5]. However, we are not able to estimate the return very precisely as our standard errors
remain too high.
Here the ATT equals .484, so apprenticeship raises earnings by about 62% (= e.484 − 1) for
those who did the training (ceteris paribus). For those with no education, their income is more
than doubled by the training (1.37 = e.864 − 1). This is a substantial gain and suggests that
apprenticeship for those without education is a reasonable substitute for primary school. For
those with 9 or 10 years of education, the ATT is .460, which translates to a 58% increase in
earnings due to the training.16
16The results are not particularly sensitive to using a subset of the instruments. For example, if we run themodel in Column [10] of Table 7 with any subset of the three instruments, the coefficient on the apprenticeshipdummy varies from .409 to .758 but is never significant; the coefficient on the App x (Ed - Ed) term is always-.051 and significant at the 5% level.
22

Tab
le7:
Full
sam
ple
-dependent
vari
able
:ln
(earn
ings)
Model
2a
Model
1a
Model
1b
Model
2b
Model
2c
(1)
(2)
(3)
(4)
(5)
(6)
(7)
(8)
(9)
(10)
Ln(h
rsw
ork
edper
wee
k)
.186
.166
.168
.177
.172
.172
.166
.170
.183
(.064)∗∗∗
(.065)∗∗
(.066)∗∗
(.066)∗∗∗
(.071)∗∗
(.070)∗∗
(.082)∗∗
(.071)∗∗
(.063)∗∗∗
Male
.429
.381
.362
.363
.346
.347
.346
.347
.340
(.058)∗∗∗
(.059)∗∗∗
(.065)∗∗∗
(.066)∗∗∗
(.070)∗∗∗
(.069)∗∗∗
(.076)∗∗∗
(.068)∗∗∗
(.068)∗∗∗
Exper
ience
(yea
rs)
.028
.031
.028
.027
.032
.032
.032
.032
.029
(.010)∗∗∗
(.010)∗∗∗
(.011)∗∗
(.011)∗∗
(.012)∗∗∗
(.012)∗∗∗
(.014)∗∗
(.012)∗∗∗
(.012)∗∗
Exper
ience
2(y
ears
2/100)
-.030
-.034
-.019
-.018
-.026
-.025
-.027
-.026
-.015
(.021)
(.021)
(.030)
(.030)
(.031)
(.031)
(.034)
(.031)
(.031)
Educa
tion
(yea
rs)
-.066
-.071
-.028
-.025
-.081
-.076
-.080
-.077
-.027
(.024)∗∗∗
(.024)∗∗∗
(.061)
(.060)
(.076)
(.073)
(.000)
(.000)
(.060)
Educa
tion2
(yea
rs2/100)
.917
.843
.839
.795
1.0
79
1.0
54
1.0
95
1.0
64
.791
(.159)∗∗∗
(.165)∗∗∗
(.168)∗∗∗
(.167)∗∗∗
(.276)∗∗∗
(.230)∗∗∗
(.369)∗∗∗
(.240)∗∗∗
(.171)∗∗∗
Educ
Contr
ol
-.044
-.031
-.016
-.019
-.026
-.021
-.029
(.058)
(.057)
(.063)
(.063)
(.091)
(.064)
(.058)
Past
appre
ntice
-.107
-.002
.028
.025
.037
.546
.491
.511
.497
.502
(.065)
(.063)
(.064)
(.062)
(.062)
(.419)
(.351)
(.503)
(.348)
(.367)
App
x(E
d-E
d)
-.052
.033
.008
-.051
(.020)∗∗∗
(.232)
(.066)
(.021)∗∗
Raven
’ssc
ore
.020
.018
.019
.021
.021
.020
.021
.020
(.008)∗∗
(.008)∗∗
(.009)∗∗
(.009)∗∗
(.009)∗∗
(.010)∗∗
(.009)∗∗
(.009)∗∗
App
Contr
ol
-.478
(.367)
Obs.
931
931
931
931
931
931
931
931
931
931
R2
.007
.167
.182
.182
.188
.13
.14
.125
.137
.189
Educa
tion
Contr
olFunct
ion
no
no
no
yes
yes
yes
yes
yes
yes
yes
Appre
ntice
Tre
atm
ent
Effec
tno
no
no
no
no
yes
yes
yes
yes
no
Appre
ntice
Contr
olFunct
ion
no
no
no
no
no
no
no
no
no
yes
Met
hod
OLS
OLS
OLS
IVIV
IVIV
IVIV
IV
Sta
ndard
erro
rsin
colu
mns[1
]-[3
]are
het
erosc
edast
icity
robust
.Sta
ndard
ser
rors
inco
lum
ns[4
]-[1
0]are
boots
trapped
to1000
repet
itio
ns.
“E
duc
contr
ol”
isth
epre
dic
ted
resi
duals
from
afirs
tst
age
contr
olfu
nct
ion
for
educa
tion.
“A
pp
contr
ol”
isth
epre
dic
ted
resi
duals
from
afirs
tst
age
contr
olfu
nct
ion
for
appre
ntice
ship
.R
egre
ssio
ns
inco
lum
ns
[2]-[1
0]
als
oin
clude
contr
ols
for
oth
ersk
ills
(math
emati
cs,E
nglish
and
readin
g)
as
wel
las
city
dum
mie
s.∗,∗∗
and
∗∗∗
indic
ate
signifi
cance
level
sof90%
,95%
and
99%
,re
spec
tivel
y.
23

Altogether, the results in Table 7 suggest a positive impact of apprenticeship on earnings for
those with very low levels of education. This return is heterogeneous and declines with the level
of education. The range in how much apprenticeships pay off may indicate that different kinds
of people enter apprenticeship at different points. Lower ability people get into apprenticeship
later on in their lives only after acquiring some formal education; they exit education before
secondary school because they are not academically successful enough to continue. A different
group of relatively bright people who cannot afford long-term schooling costs choose to enter
apprenticeships earlier after little or no schooling. These people might have done even better to
pursue formal education but were unable to do so because of limited access to credit. In sum,
although low ability explains why some apprentices earn a low return, credit constraints also
explain the pattern seen in the results.
In addition, there is no evidence of an upward bias due to aptitude for apprenticing. On the
other hand, there is some evidence of a downward bias to the OLS estimates due to omitted un-
observed ability. However this evidence is weak, as both the Wu-Hausman F-test of endogeneity
and the insignificance of the App Control term in Column [10] indicate that instrumenting is
not ultimately necessary. A possible explanation may be the elements of ability that remain
unobserved to us only affect one’s return to apprenticeship (and not one’s earnings without an
apprenticeship). Or alternatively this could indicate that the selection mechanism is captured
through observed education—so once we have controlled for the interaction between education
and apprenticeship, there is no remaining unobservable selection to correct. In either case, the
OLS estimates would provide an unbiased estimate of the return to apprenticeship (for those
that do it).17
17Note that the results are extremely sensitive to the choice of instruments—it is possible to find a significantresult with different instruments but we endeavor here to be very strict with our instrumenting strategy in aneffort to produce non-spurious results.
24

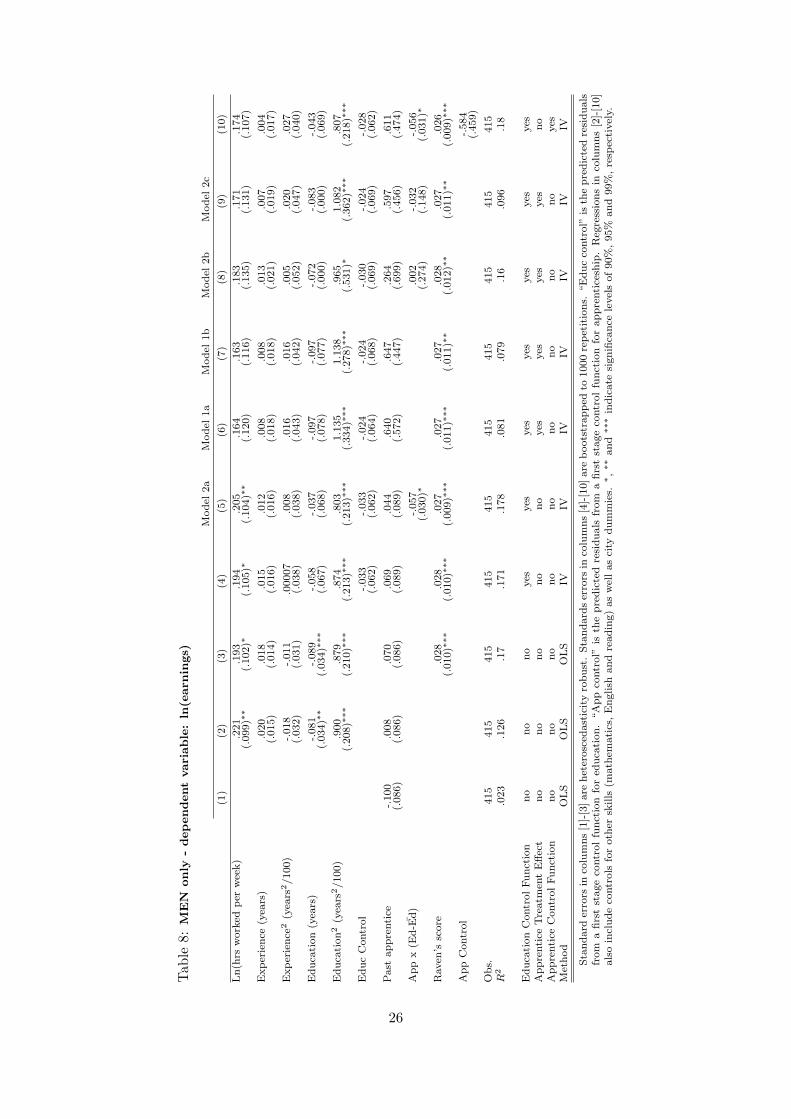
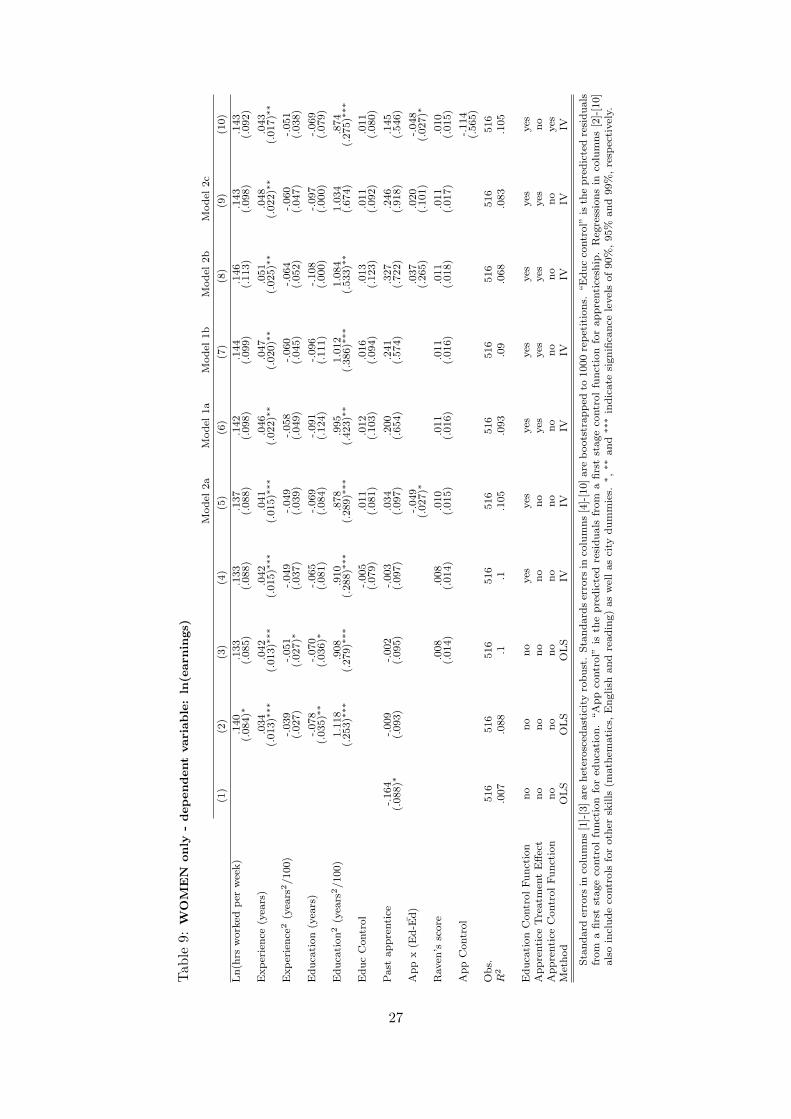
6.2 Gender differences
We have not yet explicitly considered the gender difference. However, men and women do not do
the same type of apprenticeships. Women train almost exclusively in tailoring or hairdressing.
Men tend to train in manufacturing as mechanics, carpenters and metal workers, though some
also do craft-working and tailoring. Thus the type of skills acquired in the apprenticeship system
varies systematically along gender lines, as does the type of firm entered afterwards.
We explore several ways in which we could capture a gender effect, if one exists. First, we
introduce an interaction term between apprenticeship and gender, which is insignificant in all
models. Second, we investigate different specifications with gender interaction terms (interacted
with the exogenous dependent variables). The results are not sensitive to these changes. Third,
we run the same regressions as in Section 6.1, but do them separately for men and women.18
These results are presented in Tables 8 and 9. The coefficient on the past apprentice dummy is
now higher for men than for women, though not statistically different.
We suggest three reasons why this may be true. First, we know that the return to apprenticeship
falls as education rises. Girls who do apprenticeships are, on average, more educated than boys
who do apprenticeships, and this is one reason why they experience lower returns. Second, it
may be that the skills that women acquire in apprenticeship are not as valuable. Apprenticeships
for women thus contain much less training than apprenticeships for men, and are therefore worth
much less in the labour market. Thirdly, the return to apprenticeship may come in a different
form for girls. Specifically, it may be true that women see the return to apprenticeship through
a higher probability of finding a job. We explored this hypothesis briefly as an extension of this
work and it does appear that in a very simple probit of labour participation in which working is
regressed on apprenticeship, education, education squared, age and age squared, the marginal
effect of doing an apprenticeship is nearly twice as high for women as men (16% versus 9%). On
the other hand, women who do apprenticeships are not more likely to be married, or to work
in a particular sector. Further exploration of these ideas is left for another paper.18The first stages are run separately as well.
25
Tab
le8:
MEN
only
-dependent
vari
able
:ln
(earn
ings)
Model
2a
Model
1a
Model
1b
Model
2b
Model
2c
(1)
(2)
(3)
(4)
(5)
(6)
(7)
(8)
(9)
(10)
Ln(h
rsw
ork
edper
wee
k)
.221
.193
.194
.205
.164
.163
.183
.171
.174
(.099)∗∗
(.102)∗
(.105)∗
(.104)∗∗
(.120)
(.116)
(.135)
(.131)
(.107)
Exper
ience
(yea
rs)
.020
.018
.015
.012
.008
.008
.013
.007
.004
(.015)
(.014)
(.016)
(.016)
(.018)
(.018)
(.021)
(.019)
(.017)
Exper
ience
2(y
ears
2/100)
-.018
-.011
.00007
.008
.016
.016
.005
.020
.027
(.032)
(.031)
(.038)
(.038)
(.043)
(.042)
(.052)
(.047)
(.040)
Educa
tion
(yea
rs)
-.081
-.089
-.058
-.037
-.097
-.097
-.072
-.083
-.043
(.034)∗∗
(.034)∗∗∗
(.067)
(.068)
(.078)
(.077)
(.000)
(.000)
(.069)
Educa
tion2
(yea
rs2/100)
.900
.879
.874
.803
1.1
35
1.1
38
.965
1.0
82
.807
(.208)∗∗∗
(.210)∗∗∗
(.213)∗∗∗
(.213)∗∗∗
(.334)∗∗∗
(.278)∗∗∗
(.531)∗
(.362)∗∗∗
(.218)∗∗∗
Educ
Contr
ol
-.033
-.033
-.024
-.024
-.030
-.024
-.028
(.062)
(.062)
(.064)
(.068)
(.069)
(.069)
(.062)
Past
appre
ntice
-.100
.008
.070
.069
.044
.640
.647
.264
.597
.611
(.086)
(.086)
(.086)
(.089)
(.089)
(.572)
(.447)
(.699)
(.456)
(.474)
App
x(E
d-E
d)
-.057
.002
-.032
-.056
(.030)∗
(.274)
(.148)
(.031)∗
Raven
’ssc
ore
.028
.028
.027
.027
.027
.028
.027
.026
(.010)∗∗∗
(.010)∗∗∗
(.009)∗∗∗
(.011)∗∗∗
(.011)∗∗
(.012)∗∗
(.011)∗∗
(.009)∗∗∗
App
Contr
ol
-.584
(.459)
Obs.
415
415
415
415
415
415
415
415
415
415
R2
.023
.126
.17
.171
.178
.081
.079
.16
.096
.18
Educa
tion
Contr
olFunct
ion
no
no
no
yes
yes
yes
yes
yes
yes
yes
Appre
ntice
Tre
atm
ent
Effec
tno
no
no
no
no
yes
yes
yes
yes
no
Appre
ntice
Contr
olFunct
ion
no
no
no
no
no
no
no
no
no
yes
Met
hod
OLS
OLS
OLS
IVIV
IVIV
IVIV
IV
Sta
ndard
erro
rsin
colu
mns[1
]-[3
]are
het
erosc
edast
icity
robust
.Sta
ndard
ser
rors
inco
lum
ns[4
]-[1
0]are
boots
trapped
to1000
repet
itio
ns.
“E
duc
contr
ol”
isth
epre
dic
ted
resi
duals
from
afirs
tst
age
contr
olfu
nct
ion
for
educa
tion.
“A
pp
contr
ol”
isth
epre
dic
ted
resi
duals
from
afirs
tst
age
contr
olfu
nct
ion
for
appre
ntice
ship
.R
egre
ssio
ns
inco
lum
ns
[2]-[1
0]
als
oin
clude
contr
ols
for
oth
ersk
ills
(math
emati
cs,E
nglish
and
readin
g)
as
wel
las
city
dum
mie
s.∗,∗∗
and
∗∗∗
indic
ate
signifi
cance
level
sof90%
,95%
and
99%
,re
spec
tivel
y.
26
Tab
le9:
WO
MEN
only
-dependent
vari
able
:ln
(earn
ings)
Model
2a
Model
1a
Model
1b
Model
2b
Model
2c
(1)
(2)
(3)
(4)
(5)
(6)
(7)
(8)
(9)
(10)
Ln(h
rsw
ork
edper
wee
k)
.140
.133
.133
.137
.142
.144
.146
.143
.143
(.084)∗
(.085)
(.088)
(.088)
(.098)
(.099)
(.113)
(.098)
(.092)
Exper
ience
(yea
rs)
.034
.042
.042
.041
.046
.047
.051
.048
.043
(.013)∗∗∗
(.013)∗∗∗
(.015)∗∗∗
(.015)∗∗∗
(.022)∗∗
(.020)∗∗
(.025)∗∗
(.022)∗∗
(.017)∗∗
Exper
ience
2(y
ears
2/100)
-.039
-.051
-.049
-.049
-.058
-.060
-.064
-.060
-.051
(.027)
(.027)∗
(.037)
(.039)
(.049)
(.045)
(.052)
(.047)
(.038)
Educa
tion
(yea
rs)
-.078
-.070
-.065
-.069
-.091
-.096
-.108
-.097
-.069
(.035)∗∗
(.036)∗
(.081)
(.084)
(.124)
(.111)
(.000)
(.000)
(.079)
Educa
tion2
(yea
rs2/100)
1.1
18
.908
.910
.878
.995
1.0
12
1.0
84
1.0
34
.874
(.253)∗∗∗
(.279)∗∗∗
(.288)∗∗∗
(.289)∗∗∗
(.423)∗∗
(.386)∗∗∗
(.533)∗∗
(.674)
(.275)∗∗∗
Educ
Contr
ol
-.005
.011
.012
.016
.013
.011
.011
(.079)
(.081)
(.103)
(.094)
(.123)
(.092)
(.080)
Past
appre
ntice
-.164
-.009
-.002
-.003
.034
.200
.241
.327
.246
.145
(.088)∗
(.093)
(.095)
(.097)
(.097)
(.654)
(.574)
(.722)
(.918)
(.546)
App
x(E
d-E
d)
-.049
.037
.020
-.048
(.027)∗
(.265)
(.101)
(.027)∗
Raven
’ssc
ore
.008
.008
.010
.011
.011
.011
.011
.010
(.014)
(.014)
(.015)
(.016)
(.016)
(.018)
(.017)
(.015)
App
Contr
ol
-.114
(.565)
Obs.
516
516
516
516
516
516
516
516
516
516
R2
.007
.088
.1.1
.105
.093
.09
.068
.083
.105
Educa
tion
Contr
olFunct
ion
no
no
no
yes
yes
yes
yes
yes
yes
yes
Appre
ntice
Tre
atm
ent
Effec
tno
no
no
no
no
yes
yes
yes
yes
no
Appre
ntice
Contr
olFunct
ion
no
no
no
no
no
no
no
no
no
yes
Met
hod
OLS
OLS
OLS
IVIV
IVIV
IVIV
IV
Sta
ndard
erro
rsin
colu
mns[1
]-[3
]are
het
erosc
edast
icity
robust
.Sta
ndard
ser
rors
inco
lum
ns[4
]-[1
0]are
boots
trapped
to1000
repet
itio
ns.
“E
duc
contr
ol”
isth
epre
dic
ted
resi
duals
from
afirs
tst
age
contr
olfu
nct
ion
for
educa
tion.
“A
pp
contr
ol”
isth
epre
dic
ted
resi
duals
from
afirs
tst
age
contr
olfu
nct
ion
for
appre
ntice
ship
.R
egre
ssio
ns
inco
lum
ns
[2]-[1
0]
als
oin
clude
contr
ols
for
oth
ersk
ills
(math
emati
cs,E
nglish
and
readin
g)
as
wel
las
city
dum
mie
s.∗,∗∗
and
∗∗∗
indic
ate
signifi
cance
level
sof90%
,95%
and
99%
,re
spec
tivel
y.
27
7 Rate of return analysis
We have found that doing an apprenticeship leads to a rise in earnings, the size of which
depends on one’s level of education. These returns seem at first to be quite high, so we include
a rate of return analysis here to show that the point estimates found in the regressions are not
unreasonable.
In Table 10 we calculate the internal rate of return (IRR) for the apprenticeship investment.
Two groups are compared: those with zero education and those with 10 years of education.
We find the IRR by calculating the difference in earnings predicted by the regression results in
Tables 7 and thus the table shows a range of estimates. The calculation is done on an annual
basis assuming a three year apprenticeship, during which the apprentice loses the median annual
income for his/her level of education. These foregone earnings are actually the bulk of the cost
of the apprenticeship, as the upfront fee is low relative to that (or in about 20% of the cases
is nothing at all). When we assume a positive fee, we take the mean of the fees reported by
current apprentices in the 2006 GUPHS. This is the most accurate valuation of current fees
available.19 The predicted earnings are evaluated at every year, at the corresponding level of
experience, for 30 years. The IRR is the rate at which the net present value of the investment
just equals zero.
This analysis is rough and is not meant to convey exact rates of return. We use only the point
estimates in the calculation and do not evaluate the returns at the edges of the confidence
intervals for each estimate. Nevertheless, these internal rates of return seem sensible. People
break even on their apprenticeship investment after about 7 or 8 years of working. Compared
with the real return on education, the figures in Table 10 shed some light on why formal educa-
tion may be preferable to apprenticeship, especially for those students who have survived past
primary school. However, those who end up doing an apprenticeship without formal education19These fees, when put into 1998 cedis, are close to what is reported in the GLSS 4 as well. We also have data
on what former apprentices paid for their apprenticeships but we feel that the exercise to put these values intoreal terms introduces too much noise into the variable.
28

Table 10: Internal Rate of Return
No education 10 years of educationAssuming median upfront master fee (500,000 cedis):
Model 2a 11.6% naColumn [10] 22.1% 10.2%
Assuming no upfront master fee:Model 2a 12.0% naColumn [10] 23.3% 10.5%
IRR evaluated with the predicted values from models in Table 7. Median fee is that reportedby current apprentices in the 2006 GUPHS. Median income for those with no education isassumed to be 410,000 cedis and for those with 10 years it is 600,000 cedis. “na” means thatthe IRR does not exist (i.e. the investment is never recovered).
do markedly better than similarly uneducated workers who do not do an apprenticeship.
8 Summary and conclusion
Apprenticeship is, on the basis of our survey and other Ghanaian data sources, by far the
most important form of training in urban Ghana. Of the training events our survey identified,
over half were either current or past apprenticeships. The vast majority of apprenticeships are
undertaken by those with junior high school or less. Given the prevalence of apprenticeship
as a form of training in Ghana, as well as its important role in the growing informal sector, a
natural question is whether apprenticeship pays off for those people who undertake it.
Our earnings data suggest that those who did an apprenticeship earn less than those with no
training. This apparent paradox is suggestive of a selection story. We have investigated how
far ability, credit constraints and formal education can explain this outcome. Three dimensions
of ability have been modeled. The first is that observable in our data as a result of Raven’s,
literacy and numeracy tests. The second two dimensions of ability we have termed general
ability and an aptitude for apprenticeship. We seek to identify their possible effects by using
different instrumenting procedures for the apprenticeship dummy variable. Our instruments
are designed, in part, to capture the possible role that credit constraints play in the decision to
invest in apprenticeship. The final element we have investigated is the role of formal education
29

in the return to apprenticeship.
We limit our sample in order to make meaningful comparisons between workers with earned
income who do an apprenticeship and those who do not. We find that controls for observable
ability do change the return to undertaking apprenticeship to be positive but it remains low
(and insignificant). By far the most important factor affecting the return to apprenticeship is
the level of formal education of those undertaking the apprenticeship. Our most conservative
estimate implies that for currently employed people, who did apprenticeships but have no formal
education, the training increases their earnings by 50%. The return declines as education rises.
It is possible these education levels are closely related to what we have termed general ability.
Those who enter apprenticeship with no formal education may well be atypically able while
those who enter it with junior high school are generally low ability.
Our instrumenting procedure is designed to allow for the possibility that unobserved general
ability, not fully captured by the education variable, may be biasing down the returns to ap-
prenticeship. However we have noted that if the unobserved ability in the data is what we
have termed “an aptitude for apprenticing” then the bias in the estimate on the apprentice-
ship dummy will be upwards. While we cannot reject the hypothesis that apprenticeship is
exogenous we interpret the evidence as showing that the OLS estimates with controls for formal
education are a lower bound for the return to apprenticeship. The first stage regression can
be given an interpretation as showing a role for credit constraints in the decision to undertake
apprenticeship, although its importance relative to the roles of general ability and aptitude
remains an open question.
We conduct a rate of return analysis which provides a check on the point estimates and shows
that the regression results imply rates of return of up to 20% if we are willing to accept the
point estimates from instrumenting. In addition, we find that men who do apprenticeships
earn higher returns than women who do them, though this difference is not significant. The
increment in earnings is only one aspect of the return to apprenticeship and these other aspects,
an increased probability of a job and its social role, may be more important for women than
30
men.
Our analysis has shown that for some choosing the apprenticeship route can yield a high return.
Nonetheless, the fact that we identify a positive impact of apprenticeship on earnings should
not distract us from the bigger picture, which is that workers who did an apprenticeship are
now earning less than other workers who did not do this type of training. We are not able
to model here the feedback effects that mean that apprentices are still not “succeeding”, in
terms of earnings, in the overall labour market. There is something else that then causes
their low earnings. Poor earnings for apprentices may result from two factors: unobservable
individual characteristics and unobservable workplace characteristics. We have explored the
first factor in this paper as an explanation for selection into the apprenticeship system. The
second factor depends on how trained apprentices move through the labour market. Entering
the apprenticeship system puts workers on a path to the informal sector and shuts them out
of more lucrative formal sector jobs. Indeed, qualitative studies find that apprentices tend to
be isolated from formal wage employment. This issue raises further questions about the effect
of apprenticeship on occupational choice as well as questions as to what causes the market
segmentation that is so characteristic of labour markets in Africa. Exploration of these questions
is left to future research.
31

A Apprenticeship in Ghana
Traditional apprenticeships in West Africa are widespread. In Ghana, the practice is particularly
common, especially in the informal sector. The market for apprenticeships is more established
and has flourished over time.
Although every apprenticeship is different, in general a written or oral agreement is made
between the “master” or “mistress” and the parents/guardians of the potential apprentice. The
education of an adolescent is effectively transferred from the parent to the master (Boehm,
1995). As a result, apprenticeships are as much socialization as training. Often, the master will
receive a fee, but other times the apprentice will work for reduced (or no) wages. Entry is for the
most part open for anyone who can pay the training fee: minimum education requirements are
non-existent, and other necessary qualifications besides ethnic or clan identity are uncommon
(Middleton et al., 1993). Skills transfer occurs mainly by watching and imitating the master
(Johanson & Adams, 2004). The apprenticeship usually lasts for a fixed term (typically 3 or 4
years).
The nature of the training is sector-specific and often product-specific; apprentices may learn
how to manufacture only one item, for example (Frazer, 2006). They also learn trade-related
skills such as how to handle tools and repair machines, as well as general business management
skills like sourcing, pricing, and contracting. Relative to more formal vocational training, ap-
prenticeships are much more flexible. Apprentices also have more relevant skills because they
do hands-on work as opposed to classroom training.
Nearly all apprentices want to set up their own business after their training is completed, as this
is by far the most rewarding outcome. However, this may require substantial start-up capital,
especially in manufacturing.
32
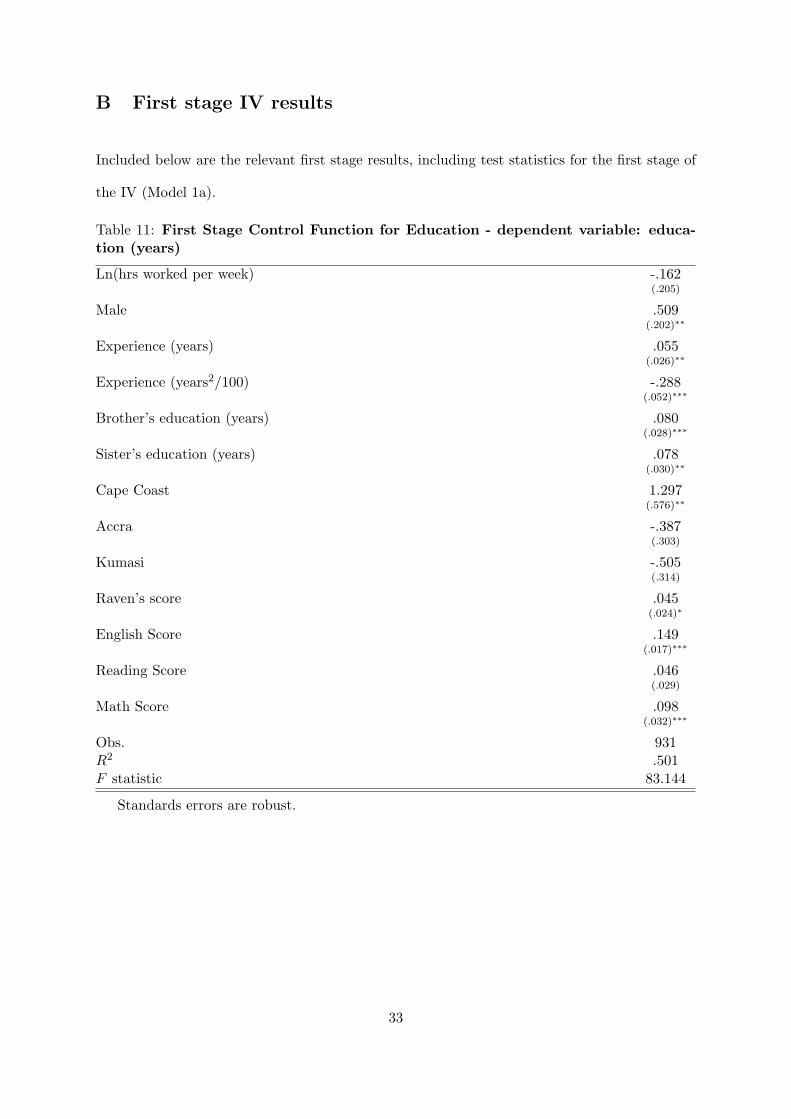
B First stage IV results
Included below are the relevant first stage results, including test statistics for the first stage of
the IV (Model 1a).
Table 11: First Stage Control Function for Education - dependent variable: educa-tion (years)
Ln(hrs worked per week) -.162(.205)
Male .509(.202)∗∗
Experience (years) .055(.026)∗∗
Experience (years2/100) -.288(.052)∗∗∗
Brother’s education (years) .080(.028)∗∗∗
Sister’s education (years) .078(.030)∗∗
Cape Coast 1.297(.576)∗∗
Accra -.387(.303)
Kumasi -.505(.314)
Raven’s score .045(.024)∗
English Score .149(.017)∗∗∗
Reading Score .046(.029)
Math Score .098(.032)∗∗∗
Obs. 931R2 .501F statistic 83.144
Standards errors are robust.
33
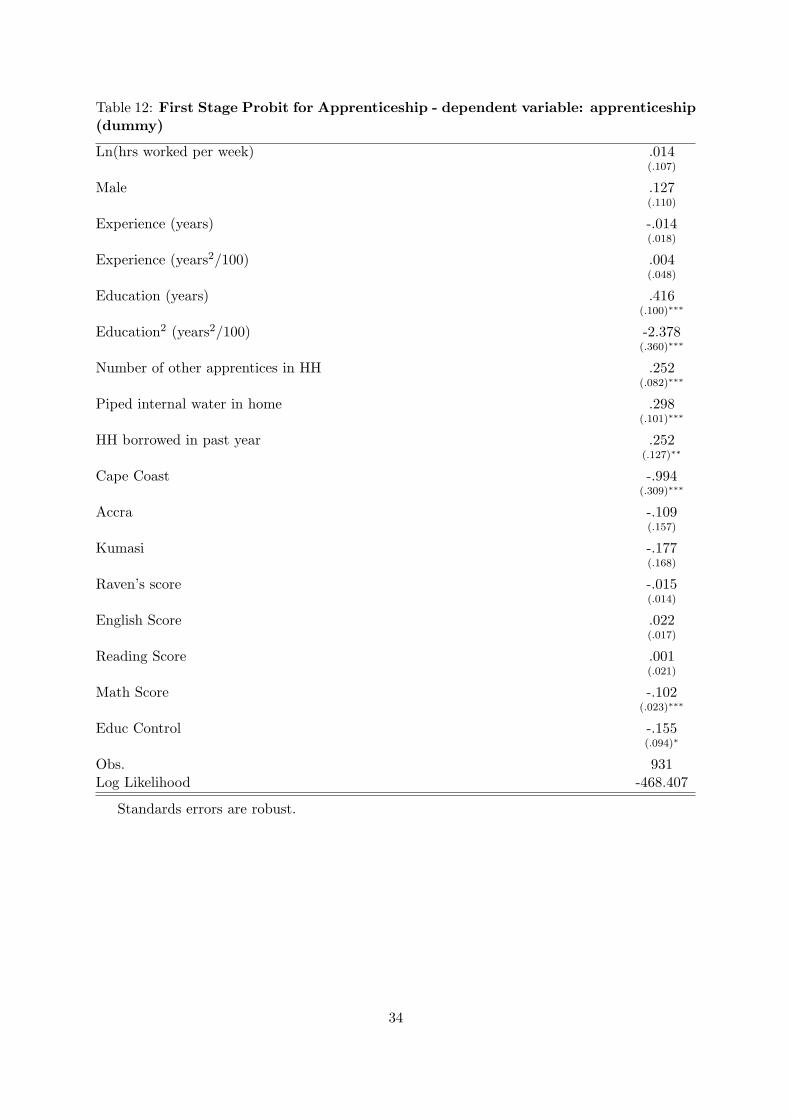
Table 12: First Stage Probit for Apprenticeship - dependent variable: apprenticeship(dummy)
Ln(hrs worked per week) .014(.107)
Male .127(.110)
Experience (years) -.014(.018)
Experience (years2/100) .004(.048)
Education (years) .416(.100)∗∗∗
Education2 (years2/100) -2.378(.360)∗∗∗
Number of other apprentices in HH .252(.082)∗∗∗
Piped internal water in home .298(.101)∗∗∗
HH borrowed in past year .252(.127)∗∗
Cape Coast -.994(.309)∗∗∗
Accra -.109(.157)
Kumasi -.177(.168)
Raven’s score -.015(.014)
English Score .022(.017)
Reading Score .001(.021)
Math Score -.102(.023)∗∗∗
Educ Control -.155(.094)∗
Obs. 931Log Likelihood -468.407
Standards errors are robust.
34

Table 13: Identification check for apprenticeship instruments - dependent variable:education (years)
Male 1.460(.218)∗∗∗
Experience (years) -.036(.032)
Experience (years2/100) -.193(.064)∗∗∗
Brother’s education (years) .121(.032)∗∗∗
Sister’s education (years) .178(.032)∗∗∗
Number of other apprentices in HH -.458(.184)∗∗
Piped internal water in home .462(.229)∗∗
HH borrowed in past year .379(.304)
Cape Coast 1.619(.655)∗∗
Accra -.190(.324)
Kumasi -.805(.344)∗∗
Obs. 931R2 .35
Standards errors are robust.
35

Table 14: Test statistics for Model 1a (IV)
First stage F-statistic, distributed as F(15,915) 16.37P-value 0.000Hansen J-statistic (overidentifying test), distributed as χ2
(2) 0.411P-value 0.8143Difference in Sargan-Hansen statistics (endogeneity test), distributed as χ2
(1) 1.798P-value 0.1800
These test statistics are robust.
36

References
Boehm, U. (1995). Human resource development in African small- and micro-enterprises: Therole of apprenticeship. In H. Bass, R. Kappel, M. Wauschkuhn, & K. Wohlmuth (Eds.),African development perspectives yearbook, vol. 5: Regional perspectives on labour andemployment. Berlin: Schelzky & Jeep.
Card, D. (2001). Estimating the return to schooling: progress on some persistent econometricproblems. Econometrica, 69, 1127-1160.
Fafchamps, M. (2006). Program evaluation and treatment effects. (unpublished manuscript,Oxford University, accessed online October 2006)
Foster, P. J. (1965a). Education and economic development. In C. A. Anderson & M. J. Bowman(Eds.), The vocational school fallacy in development planning. Chicago, IL: Aldine.
Foster, P. J. (1965b). Education and social change in Ghana. London: Routeledge and KeganPaul.
Frazer, G. (2006). Learning the master’s trade: Apprenticeship and human capital in Ghana.Journal of Development Economics, 81, 259-298.
Ghana Statistical Service. (1984). Report on the 1984 population and housing census. (StatisticalService, P.O. Box 1098, Accra, Ghana)
Ghana Statistical Service. (2005). Demographic, health and economic characteristics: Reporton the 2000 population and housing census. (Statistical Service, P.O. Box 1098, Accra,Ghana)
Grootaert, C. (1988). Cote d’Ivoire’s vocational and technical education. Washington, DC.(WPS 19. World Bank, Population and Human Resources Department)
Haan, H. C., & Serriere, N. (2002). Training for work in the informal sector: Fresh evidence fromWest Africa and Central Africa. Turin, Italy: International Training Center, InternationalLabour Organisation.
Heckman, J. (1978). Dummy endogenous variables in a simultaneous equation system. Econo-metrica, 46, 931-959.
Johanson, R., & Adams, A. (2004). Skills development in Sub-Saharan Africa. Washington,DC: The World Bank.
Jones, P. (2001). Are educated workers really more productive? Journal of DevelopmentEconomics, 64, 5779.
Kingdon, G., Sandefur, J., & Teal, F. (2006, December). Labor market flexibility, wages andincomes in sub-Saharan Africa in the 1990s. African Development Review, 18, 392-427.
Mabawonku, A. (1979). An economic evaluation of apprenticeship training in western Nigeriansmall-scale industries. East Lansing, MI. (African Rural Economy Paper 17. MichiganState University)
Middleton, J. A., Ziderman, A., & van Adams, A. (1993). Skills for productivity: Vocationaleducation and training in developing countries. New York, NY: Oxford University Press.
Mincer, J. (1974). Schooling, experience and earnings. New York, NY: National Bureau ofEconomic Research.
Rosholm, M., Nielsen, H. S., & Dabalen, A. (2007). Evaluation of training in African enterprises.Journal of Development Economics, 84, 310-329.
Wooldridge, J. (2002). Econometric analysis of cross section and panel data. Cambridge, MA:MIT Press.
37

For publication enquiries, please contact:
Communication Officer
RECOUP
Faculty of Education
184 Hills Road
Cambridge CB2 8PQ
United Kingdom
tel: (01223) 507231 e-mail: [email protected]
www.educ.cam.ac.uk/RECOUP/index.html
ISSN 1754–2464