Monitoring WASH services the Liberia story
15
PRESENTATION BY : ABDUL HAFIZ KOROMA NATIONAL COORINATOR NATIONAL WASH PROMOTIONS COMMITTEE 1
-
Upload
irc -
Category
Technology
-
view
275 -
download
0
Transcript of Monitoring WASH services the Liberia story

PRESENTATION BY :ABDUL HAFIZ KOROMA
NATIONAL COORINATORNATIONAL WASH PROMOTIONS COMMITTEE
1
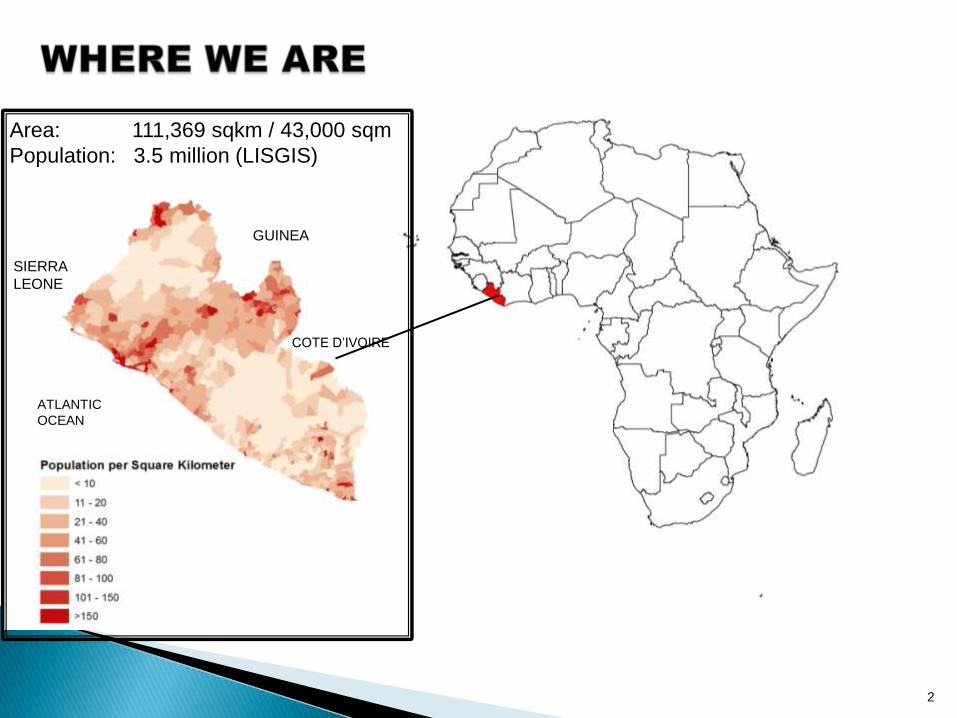
Monrovia
Area: 111,369 sqkm / 43,000 sqm
Population: 3.5 million (LISGIS)
SIERRA
LEONE
GUINEA
COTE D’IVOIRE
ATLANTIC
OCEAN
2

3
• Initial post-war emergency response in water sector provided critical
relief, but was ad-hoc, uncoordinated, not comprehensive
• Access to safe drinking water in rural Liberia was still only 51% (2010-
JMP)
• Objective was on-scale, targeted investment led by government
More funds available after HIPC debt-relief in 2010
Precondition: A baseline map of existing improved waterpoints

Lack of water infrastructure data was a critical constraint
MoPW led waterpointmapping with supportfrom WSP & UNICEF
• Over 10,000 waterpoints mapped
• Detailed information for each point
• Allows detailed needs analysis
Implementers now have accurate data for mobilization of funds

Detailed water quality testing carried out in Monrovia
• Sample of wells selected from map
• Detailed biological and chemical analysis
• Significant E. Coli contamination found
• Training of local staff for future testing

• Mapped a total of approx. 7400 waterpoints
• Information on:
o Type of waterpoint
o Functionality & Reasons for breakdown
o Construction date & agency
o Perceived quality & quantity
o Existence of local water committees
• Thus we have detailed information such as:
Mean construction year very recent: 2005-2006
Committees common, but not universal: 57% of points
Most popular safe waterpoint-type: Handpump (95%)
Most popular handpump: Afridev (83%)
60 % (~4,400) technically functional
11% (~800) functional but problems
29% (~ 2150) broken down
USING FLOW WE COULD CAPTURE THE
FOLLOWING KEY ATTRIBUTES OF THE
WATER POINTS

The Akvo FLOW platform
Handheld Data Collection• Measure what
works• Custom adaptive
surveys• Multiple languages• Captures all
assets: GPS, images, barcodes, data
Web-based dashboard• Create custom
surveys• Manage and clean
data• Analyse data
Visual map-based reporting tools• Google
Maps/Google Earth
• Data available immediately

INCREASE IN CONSTRUCTION ACTIVITY
8

A
NEED FOR UPDAING
THE CURRENT DATA BASE
9

10

A NEW MONITORING TEMPLATE HAS BEEN ENDORSED FOR MONITORING ALL WASH ACTIVITIES
11
DYNAMIC MONITORING:
ALL NGO’S REGISTERED ON LINE PLUS ALL THEIR PROJECTS
MONTHLYUPDATES
ALL NGO’S HAVE FLOW APP ON THEIR PHONE WITH DIGITIZED STANDARD QUESTIONAIRES
PILOTING CONTINOUS MONITORING IN EARLY MAY!
TOOL IS CURRENTLY JOINTLY BEING DEVELOPED BY AKVO FOR WSP, UNICEF AND THE LIBERIAN GOVERNMENT.
FIELD PILOTS IN MAY
LOCAL CAPACITY DEVELOPD IN THE USE OF FLOW AND FLOW DASH BOARDS
Handheld Data Collection
Web-based dashboard
Visual map-based

A QUARTERLY REPORT ON ACCESS AND COVERAGE NOW PRODUCED THROUGH A SIMPLE TEMPLATE
FILLED IN BY NGO’S AND GOVERNMENT PARTNERS CAPTURING NEW CONSTRUCTIONS AND REHABILITATION WORKS
12

ADAPTING TO NEW TECHNOLOGIES AND SYSTEMS IS ON TRACK BUT RATHER SLOW .
13
CAPACITY
REMAINS AN ISSUE
AT SUBNATIONAL
LEVEL …….

INCOPORATING LOCAL GOVERNMENT STRUCTURES AND NGO’S HAS PROVEN VERY USEFUL UNLIKE PREVIOUS SYSTEMS
LACK OF INCENTIVES FOR SUB NATIONAL STAFF HAD LED TO SYSTEMS FAILURES IN THE PAST
BUILDING LOCAL CAPACITY IN THE USE OF NEW TOOLS CAN BE A DRIVER OF SUSTAINABILITY
14

15