Monitoring the Quality of Hospital Care - USAID ASSIST · Step 2: Form a Quality Team ... QAP team...
64
QUALITY PROJECT ASSURANCE HEALTH MANAGER’S GUIDE Monitoring the Quality of Hospital Care Center for Human Services • 7200 Wisconsin Avenue, Suite 600 • Bethesda, MD 20814-4811 • USA • www.qaproject.org
Transcript of Monitoring the Quality of Hospital Care - USAID ASSIST · Step 2: Form a Quality Team ... QAP team...
Q U A L I T Y
P R O J E C T
A S S U R A N C E
H E A L T H M A N A G E R ’ S G U I D E
Monitoring the Quality of Hospital Care
Center for Human Services • 7200 Wisconsin Avenue, Suite 600 • Bethesda, MD 20814-4811 • USA • www.qaproject.org
Contents Abstract
The Hospital as a System
Quality Monitoring Framework
Introduction to Quality Monitoring
The Quick Start
Example 1 Example 1 Example 1 Example 1 Example 2 Example 2 Example 2 Example 2
Preparing for a Successful Monitoring System
Monitoring Key Processes
Medication Errors
Medication Errors
(First 24 Hours)
References
Resources
............................................................................ 1
............................................ 1
................................... 3
........................... 4 Criteria ............................................................................... 4 Standards .......................................................................... 4 Multidisciplinary Quality Teams ..................................... 5 Selecting the Outcome or Process for Monitoring ..... 5 Indicators .......................................................................... 6 External and Internal Monitoring ................................... 6 Ongoing Monitoring versus Spot Checks ..................... 7 An Incremental Approach ............................................... 7 Two Approaches for Monitoring Quality ....................... 7
............................................................... 7 Step 1: Identify a Quality Coordinator .......................... 7 Step 2: Form a Quality Team .......................................... 7
Step 3: Measure Infection Control Rates . 8 Step 4: Compile the Data ............................ 9 Step 5: Analyze the Da ta ........................... 10 Step 6: Report the Data ............................. 11 Step 3: Measure Mortality Rates ............. 12 Step 4: Compile the Data .......................... 13 Step 5: Analyze the Da ta ........................... 13 Step 6: Report the Data ............................. 15
Step 7: Expand the Program ........................................ 15
... 16 Step 1: Obtain Support/Commitment .......................... 16 Step 2: Organize a Monitoring System ...................... 16
......................................... 23 Step 1: Identify Key Processes .................................... 23 Steo 2: Prioritize Processes to Monitor ..................... 23 Step 3: Establish an Annual Monitoring Plan ............ 24 Step 4. Develop Flowcharts ......................................... 25 Step 5: Determine the Scope of Monitoring. ............. 26 Step 6: Develop Performance Indica tors ................... 26 Step 7: Develop Monitoring Strategies ...................... 27 Step 8: Compile and Analyze the Data ....................... 31 Step 9: Initiate Quality Improvement .......................... 32
Appendix 1: Use of Specific Standard Formats ... 34
Appendix 2: Infection Control Administrative Policies ................................................... 37
Appendix 3: Pharmacy Department: ................................ 40
Appendix 4: Standard Operating Procedure: ................................ 42
Appendix 5: Five Processes of Care that Affect the Risk of Surgical-Site Infection .. 43
Appendix 6: Routine Hand Washing Procedure ... 45
Appendix 7: Post-operative Care Protocol .................................... 46
Appendix 8: Clinical Pathway: Postoperative Patients ....................... 47
Appendix 9: Algorithm ............................................... 49
Glossary .......................................................................... 50
..................................................................... 51
....................................................................... 52
The Quality Assurance Project (QAP) is funded by the U.S.
Agency for International Development (USAID), under Contract
Number HRN-C-00-96-90013. QAP serves countries eligible for
USAID assistance, USAID Missions and Bureaus, and other agencies
and nongovernmental organizations that cooperate with USAID. The
QAP team consists of prime contractor Center for Human Services
(CHS), Joint Commission Resources, Inc. (JCR), Johns Hopkins
University School of Hygiene and Public Health (JHSPH), Johns
Hopkins Center for Communication Programs (JHU/CCP), and the
Johns Hopkins Program for International Education in Reproductive
Health (JHPIEGO). It provides comprehensive, leading-edge
technical expertise in the design, management, and implementation
of quality assurance programs in developing countries. CHS, the
nonprofit affiliate of University Research Co., LLC (URC), provides
technical assistance and research for the design, management,
improvement, and monitoring of healthcare systems and service
delivery in over 30 countries.
Acknowledgements
This guide represents the collaborative effort of many people. The
author wishes to acknowledge the colleagues who contributed to its
development. Bruno Bouchet and Lynne Miller-Franco provided
invaluable technical contributions. David Nicholas, Diana Silimperi,
Paul vanOstenberg, Karen Hoffner, and Jolee Reinke provided their
expertise in the technical review. Shawnee Mission Medical Center,
Merriam, Kansas and Washington Adventist Hospital, Takoma Park,
Maryland provided reference materials.
This document was written by Joanne Ashton, Senior QA Advisor,
Quality Assurance Project, and was edited by Morrie O’Neil.
This document does not necessarily represent the views or opinions
of USAID. It may be reproduced if credit is given to the Quality ©Assurance Project.
Quality Assurance Project
7200 Wisconsin Avenue, Suite 600
Bethesda, MD 20814-4811
301-941-8550
www.qaproject.org
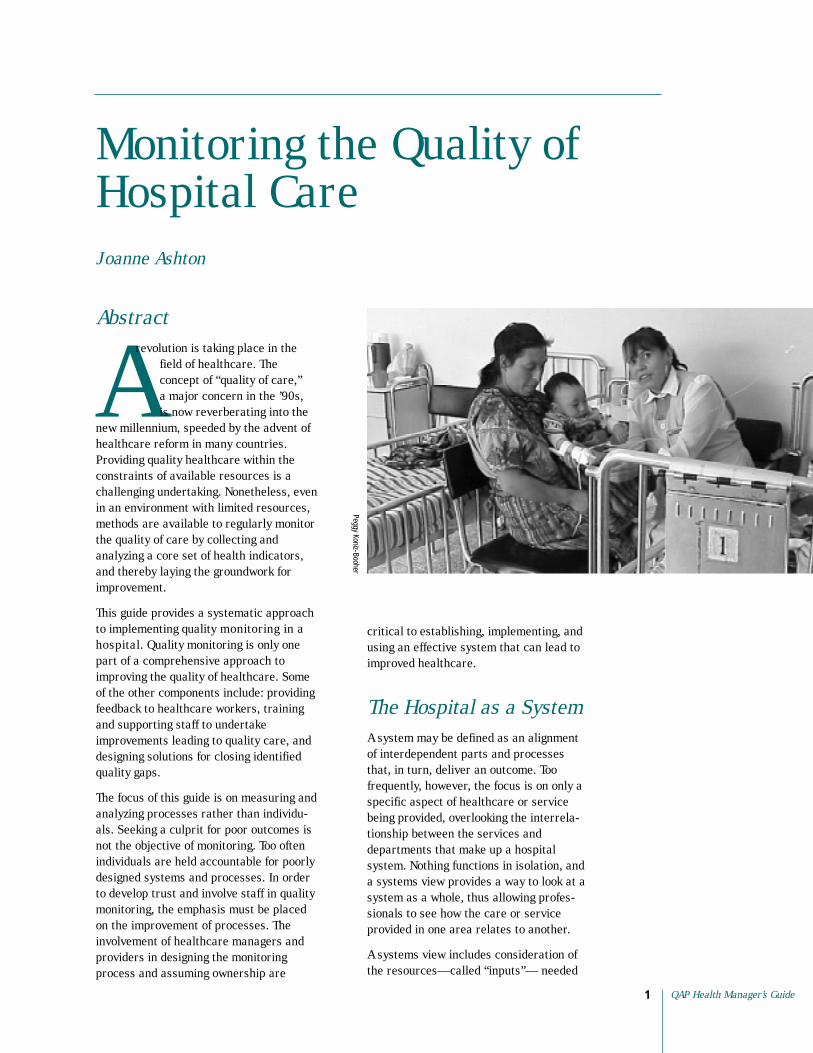
Monitoring the Quality of Hospital Care Joanne Ashton
Abstract
Arevolution is taking place in the
field of healthcare. The concept of “quality of care,” a major concern in the ’90s, is now reverberating into the
new millennium, speeded by the advent of healthcare reform in many countries. Providing quality healthcare within the constraints of available resources is a challenging undertaking. Nonetheless, even in an environment with limited resources, methods are available to regularly monitor the quality of care by collecting and analyzing a core set of health indicators, and thereby laying the groundwork for improvement.
This guide provides a systematic approach to implementing quality monitoring in a hospital. Quality monitoring is only one part of a comprehensive approach to improving the quality of healthcare. Some of the other components include: providing feedback to healthcare workers, training and supporting staff to undertake improvements leading to quality care, and designing solutions for closing identified quality gaps.
The focus of this guide is on measuring and analyzing processes rather than individuals. Seeking a culprit for poor outcomes is not the objective of monitoring. Too often individuals are held accountable for poorly designed systems and processes. In order to develop trust and involve staff in quality monitoring, the emphasis must be placed on the improvement of processes. The involvement of healthcare managers and providers in designing the monitoring process and assuming ownership are
Peggy Koniz-Booher
critical to establishing, implementing, and using an effective system that can lead to improved healthcare.
The Hospital as a System A system may be defined as an alignment of interdependent parts and processes that, in turn, deliver an outcome. Too frequently, however, the focus is on only a specific aspect of healthcare or service being provided, overlooking the interrelationship between the services and departments that make up a hospital system. Nothing functions in isolation, and a systems view provides a way to look at a system as a whole, thus allowing professionals to see how the care or service provided in one area relates to another.
A systems view includes consideration of the resources—called “inputs”— needed
QAP Health Manager’s Guide 1

Monitoring the Quality ofHospital Care
2
to provide healthcare. Equally important are the activities, or processes, involved in providing care and services. These inputs and processes result in an outcome. Table 1 presents a systems view of some hospital services.
Hospitals are complex systems. Many services, such as rendering emergency care and providing meals, not only must be kept in operation over two or more shifts, but also must be implemented across departments. A systems view, for example, can reveal the process involved in transporting a patient treated in the emergency department to another part of the hospital
for surgery. What is the process for letting the operating staff know the kind of care that was provided in the emergency department and the expected outcome of that care? When one part of the system fails, how does the failure affect the other parts? For example, if a gurney is not available, it will be difficult to quickly deliver the patient to the operating room. If there is not a process to inform other caregivers about the patient’s medical history, the surgical staff may not receive the information they need to select the most appropriate kind of anesthesia and do so as quickly as possible.
Aspect of Care Management Inputs
■ Hospital staff ■
■
■
■
diarrhea
■
■ Pharmacist ■ Nurse ■
■ New mothers ■ Physicians ■ Nurses ■
■ Midwives ■
■ All healthcare workers ■ Cleaning staff ■
■ Sterile equipment ■ Sterilizer ■
changes
Processes
■ Use of the protocol ■
■
■
■ Health education
Outcomes
■ Diarrhea is resolved ■ Dehydration is resolved ■
measures ■
■
■ Medications are delivered to the unit/ department in a timely manner
Monitoring the Quality of Hospital Care
2
■
■ Medication distribution
■
providers ■ Education of patient and
planning
■ Hand washing ■
■
■ Cleaning procedures
■
■ The patient/family has home instructions
■
hospitalized Infection control
cesarean section)
Table 1. Systems View of Hospital Services
Management of diarrhea Medications Rehydration preparations Laboratory tests Protocol for management of
Medications
Medication storage cart
Family
Teaching materials
Soap
Materials for sterile dressing
Medication administration Rehydration administration Testing procedures
Patient/family can describe preventative
Patient/family can describe when to seek further treatment
Medications are available in the pharmacy
Notes: a. Inputs are the resources needed to provide a service. b. Processes are the activities that use these inputs. c. Outcomes are the results of the processes.
Medication availability Stock management
Communication between care
family
Normal delivery/discharge
Sterilization of equipment Wound care
Midwife has information regarding the mother’s condition and follow-up care
Patients do not acquire infections while (postoperative
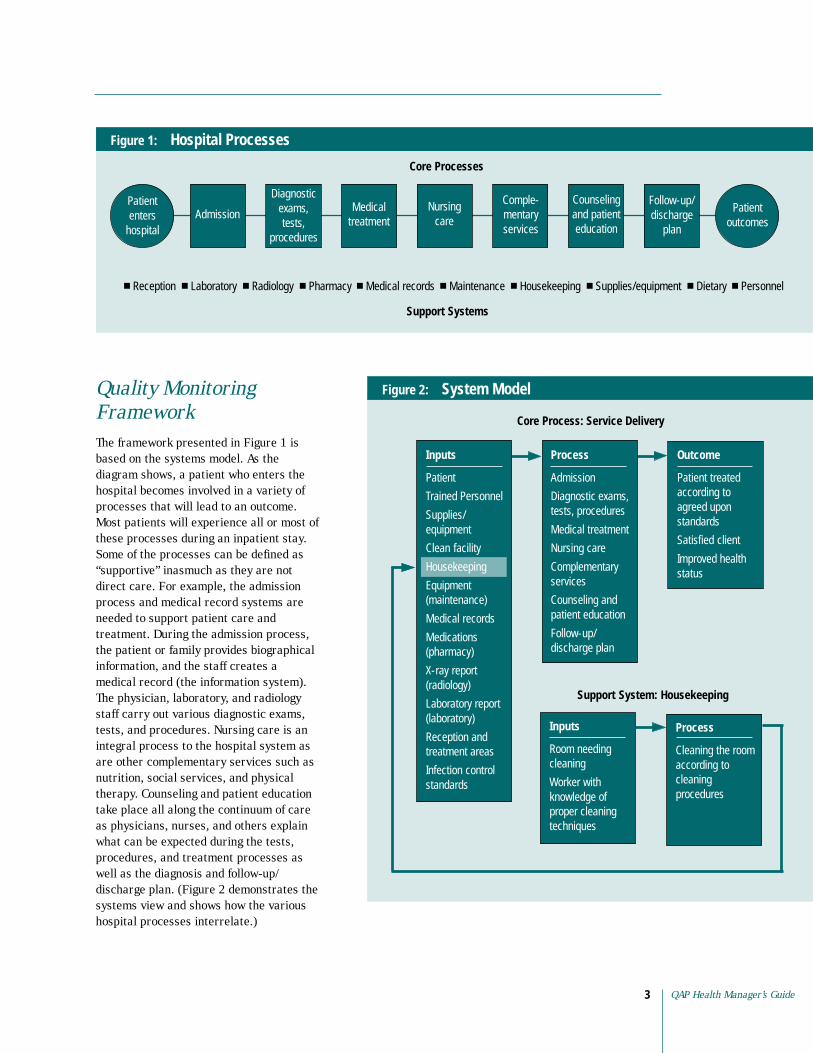
Figure 1: Hospital Processes
Core Processes
enters hospital
outcomes
Diagnostic exams, tests,
procedures
Admission Medical
treatment Nursing
care
Comple Counseling Follow-up/ discharge
plan
Support Systems
■ Reception ■ ■ ■ Pharmacy ■ Medical records ■ Maintenance ■ Housekeeping ■ Supplies/equipment ■ Dietary ■ Personnel
Patient Patient mentary services
and patient education
Laboratory Radiology
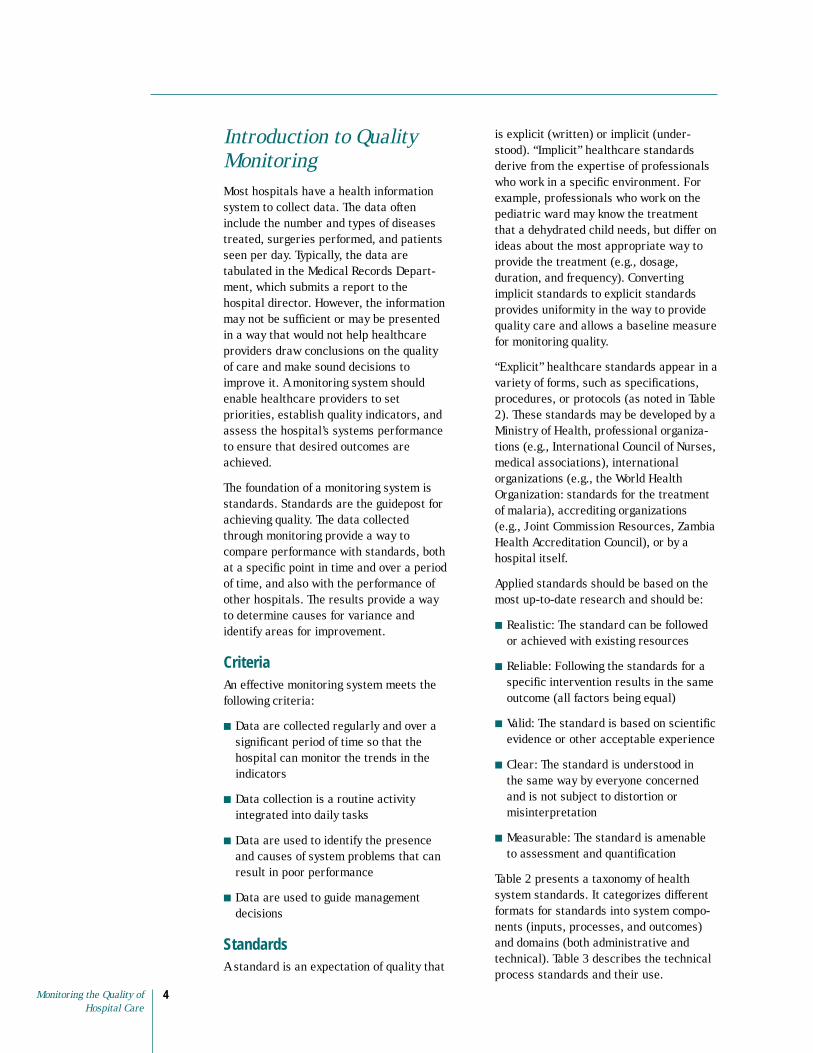
Quality Monitoring Framework The framework presented in Figure 1 is based on the systems model. As the diagram shows, a patient who enters the hospital becomes involved in a variety of processes that will lead to an outcome. Most patients will experience all or most of these processes during an inpatient stay. Some of the processes can be defined as “supportive” inasmuch as they are not direct care. For example, the admission process and medical record systems are needed to support patient care and treatment. During the admission process, the patient or family provides biographical information, and the staff creates a medical record (the information system). The physician, laboratory, and radiology staff carry out various diagnostic exams, tests, and procedures. Nursing care is an integral process to the hospital system as are other complementary services such as nutrition, social services, and physical therapy. Counseling and patient education take place all along the continuum of care as physicians, nurses, and others explain what can be expected during the tests, procedures, and treatment processes as well as the diagnosis and follow-up/ discharge plan. (Figure 2 demonstrates the systems view and shows how the various hospital processes interrelate.)
Figure 2: System Model
Outcome
according to
standards
Improved health
Process
Cleaning the room according to cleaning procedures
Inputs
Room needing cleaning
knowledge of proper cleaning techniques
Support System: Housekeeping
Process
Admission
Diagnostic exams, tests, procedures
Nursing care
Counseling and
Follow-up/ discharge plan
Inputs
Supplies/ equipment
Clean facility
Housekeeping
Equipment (maintenance)
Medical records
(pharmacy)
(radiology)
Reception and
Infection control standards
Patient treated
agreed upon
Satisfied client
status
Worker with
Core Process: Service Delivery
Medical treatment
Complementary services
patient education
Patient
Trained Personnel
Medications
X-ray report
Laboratory report (laboratory)
treatment areas
QAP Health Manager’s Guide 3
Introduction to Quality Monitoring Most hospitals have a health information system to collect data. The data often include the number and types of diseases treated, surgeries performed, and patients seen per day. Typically, the data are tabulated in the Medical Records Department, which submits a report to the hospital director. However, the information may not be sufficient or may be presented in a way that would not help healthcare providers draw conclusions on the quality of care and make sound decisions to improve it. A monitoring system should enable healthcare providers to set priorities, establish quality indicators, and assess the hospital’s systems performance to ensure that desired outcomes are achieved.
The foundation of a monitoring system is standards. Standards are the guidepost for achieving quality. The data collected through monitoring provide a way to compare performance with standards, both at a specific point in time and over a period of time, and also with the performance of other hospitals. The results provide a way to determine causes for variance and identify areas for improvement.
Criteria An effective monitoring system meets the following criteria:
■ Data are collected regularly and over a significant period of time so that the hospital can monitor the trends in the indicators
■ Data collection is a routine activity integrated into daily tasks
■ Data are used to identify the presence and causes of system problems that can result in poor performance
■ Data are used to guide management decisions
Standards A standard is an expectation of quality that
is explicit (written) or implicit (understood). “Implicit” healthcare standards derive from the expertise of professionals who work in a specific environment. For example, professionals who work on the pediatric ward may know the treatment that a dehydrated child needs, but differ on ideas about the most appropriate way to provide the treatment (e.g., dosage, duration, and frequency). Converting implicit standards to explicit standards provides uniformity in the way to provide quality care and allows a baseline measure for monitoring quality.
“Explicit” healthcare standards appear in a variety of forms, such as specifications, procedures, or protocols (as noted in Table 2). These standards may be developed by a Ministry of Health, professional organizations (e.g., International Council of Nurses, medical associations), international organizations (e.g., the World Health Organization: standards for the treatment of malaria), accrediting organizations (e.g., Joint Commission Resources, Zambia Health Accreditation Council), or by a hospital itself.
Applied standards should be based on the most up-to-date research and should be:
■ Realistic: The standard can be followed or achieved with existing resources
■ Reliable: Following the standards for a specific intervention results in the same outcome (all factors being equal)
■ Valid: The standard is based on scientific evidence or other acceptable experience
■ Clear: The standard is understood in the same way by everyone concerned and is not subject to distortion or misinterpretation
■ Measurable: The standard is amenable to assessment and quantification
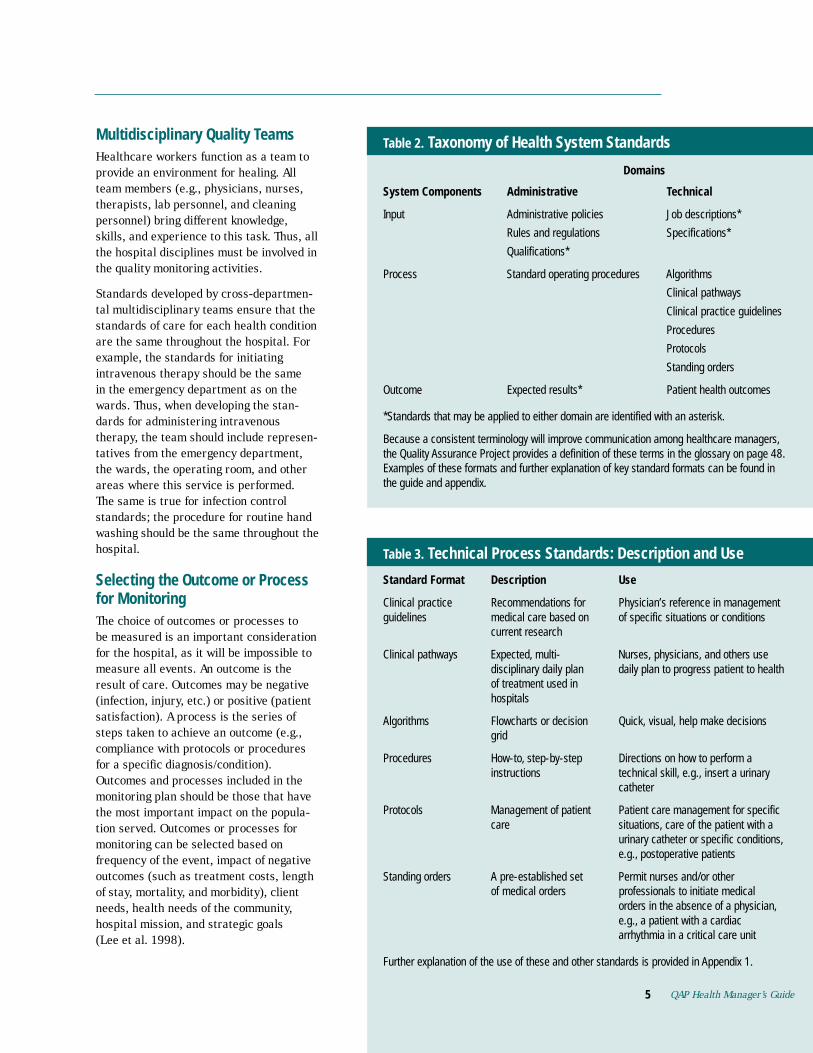
Table 2 presents a taxonomy of health system standards. It categorizes different formats for standards into system components (inputs, processes, and outcomes) and domains (both administrative and technical). Table 3 describes the technical process standards and their use.
Monitoring the Quality of 4 Hospital Care
QAP Health Manager’s Guide5
Multidisciplinary Quality Teams Healthcare workers function as a team to provide an environment for healing. All team members (e.g., physicians, nurses, therapists, lab personnel, and cleaning personnel) bring different knowledge, skills, and experience to this task. Thus, all the hospital disciplines must be involved in the quality monitoring activities.
Standards developed by cross-departmen-tal multidisciplinary teams ensure that the standards of care for each health condition are the same throughout the hospital. For example, the standards for initiating intravenous therapy should be the same in the emergency department as on the wards. Thus, when developing the standards for administering intravenous therapy, the team should include representatives from the emergency department, the wards, the operating room, and other areas where this service is performed. The same is true for infection control standards; the procedure for routine hand washing should be the same throughout the hospital.
Selecting the Outcome or Process for Monitoring The choice of outcomes or processes to be measured is an important consideration for the hospital, as it will be impossible to measure all events. An outcome is the result of care. Outcomes may be negative (infection, injury, etc.) or positive (patient satisfaction). A process is the series of steps taken to achieve an outcome (e.g., compliance with protocols or procedures for a specific diagnosis/condition). Outcomes and processes included in the monitoring plan should be those that have the most important impact on the population served. Outcomes or processes for monitoring can be selected based on frequency of the event, impact of negative outcomes (such as treatment costs, length of stay, mortality, and morbidity), client needs, health needs of the community, hospital mission, and strategic goals (Lee et al. 1998).
System Components Administrative
Input
Rules and regulations Specifications*
Process Standard operating procedures Algorithms
Clinical practice guidelines
Procedures
Protocols
Standing orders
Outcome Expected results*
the guide and appendix.
Domains
Standard Format Description Use
Recommendations for guidelines
current research
Nurses, physicians, and others use
hospitals
Algorithms Quick, visual, help make decisions grid
Procedures instructions
Protocols care
Permit nurses and/or other of medical orders
orders in the absence of a physician,
arrhythmia in a critical care unit
5
Table 2. Taxonomy of Health System Standards
Technical
Administrative policies Job descriptions*
Qualifications*
Clinical pathways
Patient health outcomes
*Standards that may be applied to either domain are identified with an asterisk.
Because a consistent terminology will improve communication among healthcare managers, the Quality Assurance Project provides a definition of these terms in the glossary on page 48. Examples of these formats and further explanation of key standard formats can be found in
Table 3. Technical Process Standards: Description and Use
Clinical practice Physician’s reference in management medical care based on of specific situations or conditions
Clinical pathways Expected, multi-disciplinary daily plan daily plan to progress patient to health of treatment used in
Flowcharts or decision
How-to, step-by-step Directions on how to perform a technical skill, e.g., insert a urinary catheter
Management of patient Patient care management for specific situations, care of the patient with a urinary catheter or specific conditions, e.g., postoperative patients
Standing orders A pre-established set professionals to initiate medical
e.g., a patient with a cardiac
Further explanation of the use of these and other standards is provided in Appendix 1.
QAP Health Manager’s Guide

Indicators An indicator of quality is a measure that is used to determine the degree of adherence to a standard. Indicators translate a qualitative statement (as expressed by a standard) into a quantitative one. For example, “the proportion of healthcare providers who greet their patients by name” measures the extent to which the standard for a quality reception is being met. Indicators can be expressed as a number (a count), an average, or a ratio (a proportion or rate). An indicator presented as a ratio consists of a numerator (the number of times an event occurs) and a denominator (the total number of times the event should have occurred). An example of a ratio is the proportion of post-surgical patients whose temperature was taken by the healthcare worker according to protocol.
It is useful to select indicators that measure inputs, processes, and outcomes. The basis for selecting an indicator is its importance or potential impact on the quality of care. Be aware that outcome indicators measure the level of achievement of the intervention and, therefore, can serve as indirect measures of the
Pegg
y Ko
niz-
Booh
er
quality of care and services. However, a good outcome does not necessarily mean that the process was managed correctly; neither does a poor outcome mean that the process was managed incorrectly. Therefore, the measurement of input, process, and outcome indicators is warranted.
Some quality experts believe that organizations should strive for zero defects. They suggest that setting a level of expected quality limits the highest level of quality that might otherwise be achieved. The belief is that once the quality level—e.g., targeted infection control rates—is attained, the staff will be satisfied with this level rather than continuing to strive to decrease infection control rates to zero infections. Keeping this view in mind, establishing indicators remains an established means of setting the bar at a reasonable level of achievement and the bar can (and should be) raised/lowered as the targets are achieved.
External and Internal Monitoring “External monitoring” is monitoring conducted by someone from outside the hospital. The monitor may be a representative of the Ministry of Health, a neighborhood health committee, or an agency contracted to measure compliance with specific standards; these standards are often established by the external entity doing the measuring. Accreditation of the hospital, as conducted by Joint Commission International and Council for Health Service Accreditation of Southern Africa (COHSASA), is an example of an external monitoring system. A discussion of external monitoring is not within the scope of this guide.
“Internal monitoring” is a system set up by the hospital staff who adopt standards written by another credible group (e.g., the World Health Organization) or by the hospital itself; the hospital can conduct a self-assessment to measure the degree of compliance. An approach to developing an internal monitoring system follows.
Monitoring the Quality of 6 Hospital Care

Ongoing Monitoring versus Spot Checks Ongoing monitoring involves regularly measuring quality indicators. Some indicators may be important enough (e.g., maternal mortality or infection rates) to measure frequently and regularly (e.g., monthly): This concept is often referred to as “trending.” However, because it is not feasible to measure the hundreds of standards that are in existence, spot checks may be conducted to measure specific standards during a specific period of time. A spot check may be done on a one-time basis, or, as an example, the quality team may decide to monitor the effectiveness of a new patient education program for six months.
An Incremental Approach To avoid becoming overwhelmed with quality monitoring, it is important to initially limit the scope by selecting a few key indicators that are of the highest priority. High-volume, high-risk, and problem-prone processes are frequently given highest priority. High volume refers to the number of cases seen, e.g., number of maternity patients admitted each year. High-risk processes have a potential of resulting in harm to the patient or staff. Problem-prone processes are those that have been recognized by the authorities or staff as having poor outcomes. Many hospitals monitor medication errors because medication administration has been identified as a problem-prone process and also could be considered a high-risk process. Once a quality monitoring system is in place, the process can be expanded to include additional indicators.
Two Approaches for Monitoring Quality In this guide, two approaches are proposed:
1. The Quick Start—monitoring aminimum number of key indicators
2. Implementing a Monitoring System—planning and organizing a monitoring system and monitoring key processes
If there is no monitoring system in place, the Quick Start is the place to begin. However, if there are standards already established and the monitoring of a few key indicators is working, the team may proceed to implementing a monitoring system. Organizations that have a functioning monitoring system could skip the section on organizing a monitoring system, and use the approach of monitoring key processes.
The Quick Start The Quick Start encompasses the standards, indicators, minimum mandatory measures, and data collection methods to be employed. As soon as a quality coordinator is selected and a quality team is established, the team can begin the monitoring process. Monitoring one or two of the indicators is a good way to begin.
Two indicators of quality of care were selected to exemplify the tools and methods in this Health Manager’s Guide: surgical infection and mortality rates. These indicators not only relate to every hospitalized patient, but also yield grave outcomes if standards are not met.
Step 1: Identify a Quality Coordinator Hospital management will want to select someone to coordinate the monitoring effort. This individual should have an interest in quality monitoring, have the respect of staff, have an ability to facilitate teamwork, and be allotted time to devote to this activity.
Step 2: Form a Quality Team A team of six to eight staff members should be organized to implement the monitoring. Because the two indicators that will be monitored in this Guide are surgical infection rates and mortality rates, the team should include staff who are involved in processes that could result in infection or mortality, e.g., staff from surgery, obstetrical services, hospital wards, and other departments, such as equipment/
QAP Health Manager’s Guide 7

supply management. Team members are selected based on their knowledge and experience in the area and their willingness to participate. The coordinator will orient the team to the rationale for quality monitoring and the process.
Note: In this document, we use example 1 (monitoring infections) to show how steps 3–6 are implemented and then move on to example 2 (monitoring mortality) to show again how those same steps are done.
who underwent clean surgeries in the operating room in the prior calendar month
Data Data Source for Source for Responsible for
Indicator Formula Numerator Denominator Collecting Data
Number of patients infection tool or medical
records (or a log may assigned by a while hospitalized in the need to be prior calendar month developed to
record surgeries)
Indicator for Surgical Infection Rates
Total number of patients
Person
Surgical Data collection Surgical Nursing supervisor developing infections register (or a person
rates in clean surgical wounds supervisor)
Table 4.
Monitoring Surgical Infection RatesTable 5.
Identify the ward and the date of data collection
List each surgical patient by medical record number
Identify the type of surgery
Based on the infection criteria, observe the surgical incision and determine whether an infection exists. Indicate Y (yes) or N (no) in the column
Indicate the physician who performed the surgery (some hospitals identify physicians by a numerical code)
Ward: Surgical 2 South Date: August 5, 2000
Surgical Patient Type of Surgery Infection (Y or N) Physician
# 4589 Cholecystecotomy N Gomez
# 8756 Appendectomy Y Lorenzo
Instructions:
■
■
■
■
■
Example 1 Step 3: Measure Infection Control Rates Nosocomial (hospital-acquired) infections Hospital infection is one of the most common adverse outcomes of hospitalization, occurring among 6 to 17 percent of patients (Huskins et al. 1998). Although the hospital can and should monitor overall infection rates, it may initially be easier to work with a less inclusive population. Surgical infection rates can provide a starting point. Table 4 is an example of the information needed to develop an indicator for monitoring surgical infection rates.
Monitoring strategies The most effective means of determining infection rates is direct patient observation by nurses or physicians. When direct observation is not feasible, the monitoring team can examine operative records to identify patients who have had surgical procedures, noting which patients have developed wound infections while in the hospital.
Data collection Develop the data collection tool and train personnel in data collection methods. Table 5 is a sample tool for monitoring surgical infection rates. Data must be collected for a minimum of one calendar month (U.S. Department of Health and Human Services 1998). It is best to use the same persons to collect data and conduct the observations, preferably at the same time each day. The criteria for determining the presence of an infection are included in Table 6. The data derived provide the information necessary to arrive at the infection rates. Table 7 demonstrates how to calculate the infection rate.
Threshold The outcome standard for surgical infections should be 0 percent, that is, none of the patients undergoing major surgery develops a surgical wound
Monitoring the Quality of 8 Hospital Care
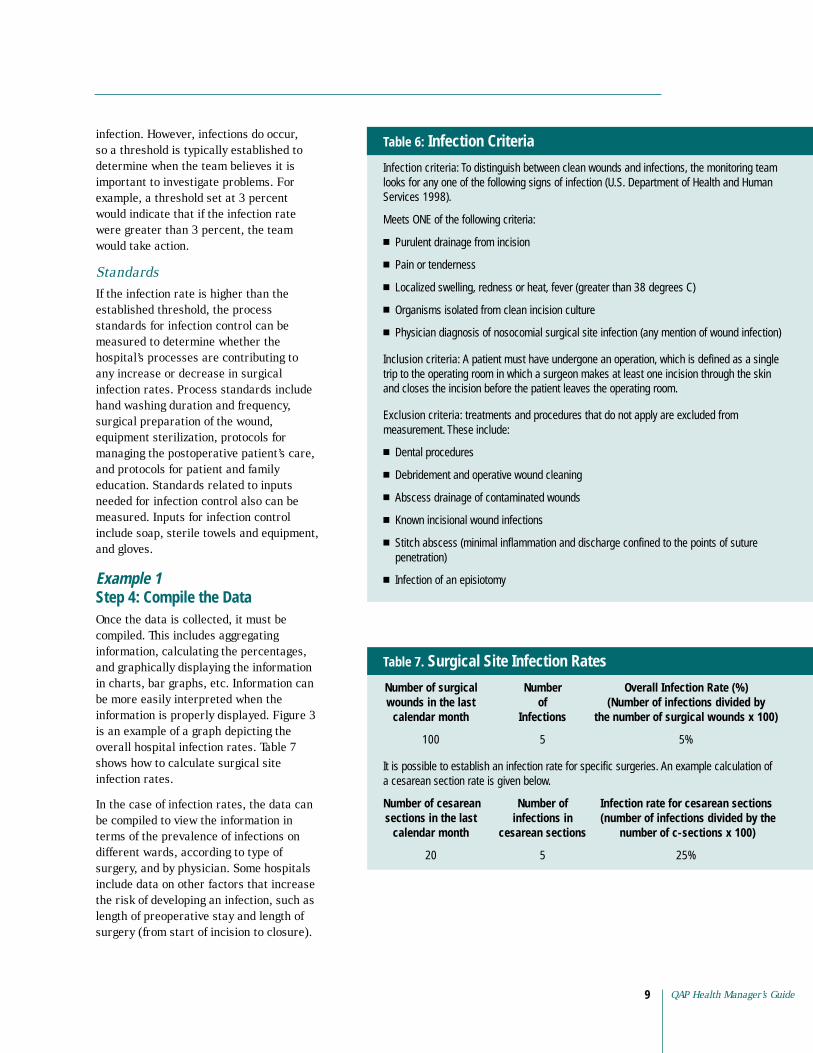
infection. However, infections do occur, so a threshold is typically established to determine when the team believes it is important to investigate problems. For example, a threshold set at 3 percent would indicate that if the infection rate were greater than 3 percent, the team would take action.
Standards If the infection rate is higher than the established threshold, the process standards for infection control can be measured to determine whether the
Infection Criteria
Infection criteria
Meets ONE of the following criteria:
■
■ Pain or tenderness
■
■ Organisms isolated from clean incision culture
■
trip to the operating room in which a surgeon makes at least one incision through the skin and closes the incision before the patient leaves the operating room.
treatments and procedures that do not apply are excluded from
■ Dental procedures
■ Debridement and operative wound cleaning
■ Abscess drainage of contaminated wounds
■ Known incisional wound infections
■
■ Infection of an episiotomy
Table 6:
: To distinguish between clean wounds and infections, the monitoring team looks for any one of the following signs of infection (U.S. Department of Health and Human Services 1998).
Purulent drainage from incision
Localized swelling, redness or heat, fever (greater than 38 degrees C)
Physician diagnosis of nosocomial surgical site infection (any mention of wound infection)
Inclusion criteria: A patient must have undergone an operation, which is defined as a single
Exclusion criteria: measurement. These include:
Stitch abscess (minimal inflammation and discharge confined to the points of suture penetration)
hospital’s processes are contributing to any increase or decrease in surgical infection rates. Process standards include hand washing duration and frequency, surgical preparation of the wound, equipment sterilization, protocols for managing the postoperative patient’s care, and protocols for patient and family education. Standards related to inputs needed for infection control also can be measured. Inputs for infection control include soap, sterile towels and equipment, and gloves.
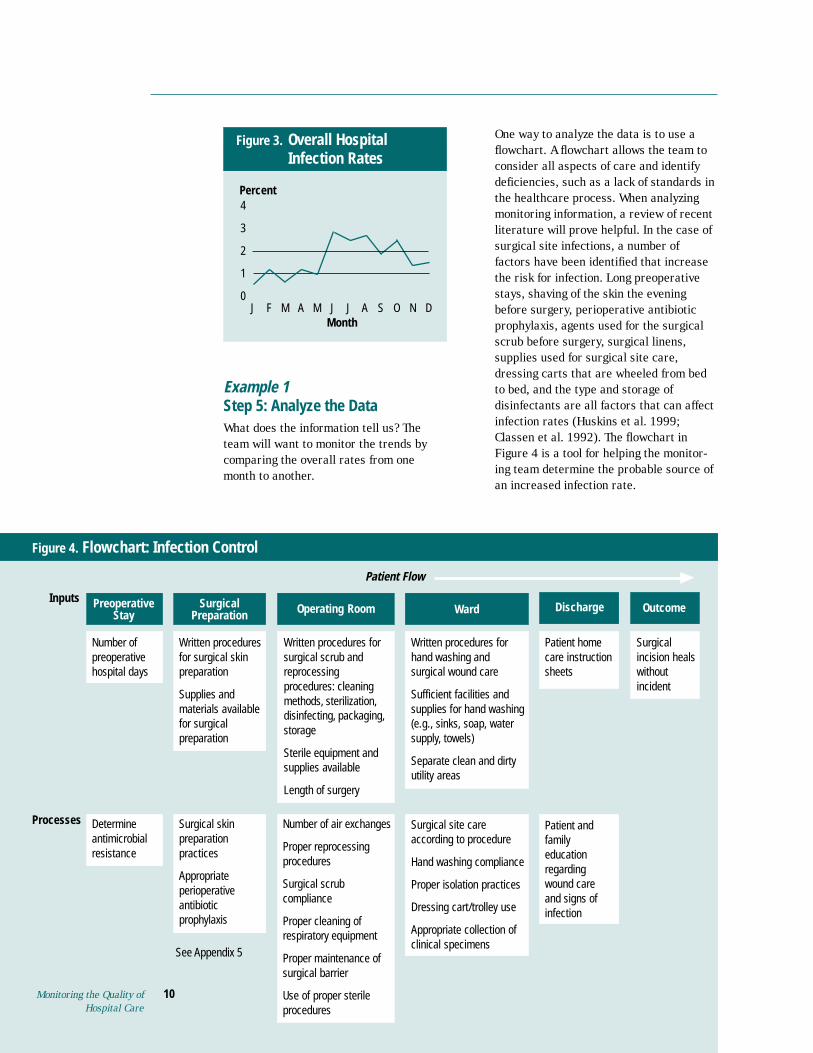
Example 1 Step 4: Compile the Data Once the data is collected, it must be compiled. This includes aggregating information, calculating the percentages, and graphically displaying the information in charts, bar graphs, etc. Information can be more easily interpreted when the information is properly displayed. Figure 3 is an example of a graph depicting the overall hospital infection rates. Table 7 shows how to calculate surgical site infection rates.
different wards, according to type of surgery, and by physician. Some hospitals include data on other factors that increase the risk of developing an infection, such as length of preoperative stay and length of surgery (from start of incision to closure).
Number Overall Infection Rate (%) (Number of infections divided by
Infections the number of surgical wounds x 100)
100 5
Infection rate for cesarean sections (number of infections divided by the
cesarean sections number of c-sections x 100)
5 25%
Number of surgical wounds in the last of
calendar month
5%
It is possible to establish an infection rate for specific surgeries. An example calculation of a cesarean section rate is given below.
Number of cesarean Number of sections in the last infections in
calendar month
20
QAP Health Manager’s Guide 9
Surgical Site Infection RatesTable 7.
In the case of infection rates, the data can be compiled to view the information in terms of the prevalence of infections on
Monitoring the Quality ofHospital Care
10
Figure 3. Overall Hospital Infection Rates
J F M A M J J A S O N D Month
4
3
2
1
0
Percent
Example 1 Step 5: Analyze the Data What does the information tell us? The team will want to monitor the trends by comparing the overall rates from one month to another.
One way to analyze the data is to use a flowchart. A flowchart allows the team to consider all aspects of care and identify deficiencies, such as a lack of standards in the healthcare process. When analyzing monitoring information, a review of recent literature will prove helpful. In the case of surgical site infections, a number of factors have been identified that increase the risk for infection. Long preoperative stays, shaving of the skin the evening before surgery, perioperative antibiotic prophylaxis, agents used for the surgical scrub before surgery, surgical linens, supplies used for surgical site care, dressing carts that are wheeled from bed to bed, and the type and storage of disinfectants are all factors that can affect infection rates (Huskins et al. 1999; Classen et al. 1992). The flowchart in Figure 4 is a tool for helping the monitoring team determine the probable source of an increased infection rate.
Figure 4. Flowchart: Infection Control
Processes
Inputs Preoperative Stay
Surgical Preparation Operating Room Discharge Outcome
Number of Written procedures
Supplies and
for surgical
Written procedures for
reprocessing procedures: cleaning
Sterile equipment and
Length of surgery
Written procedures for hand washing and
Sufficient facilities and
Separate clean and dirty utility areas
care instruction sheets
Surgical incision heals without incident
Number of air exchanges
Proper reprocessing procedures
compliance
Proper cleaning of respiratory equipment
Proper maintenance of
Use of proper sterile procedures
practices
antibiotic prophylaxis
Determine antimicrobial resistance
according to procedure
Hand washing compliance
Proper isolation practices
Dressing cart/trolley use
Appropriate collection of clinical specimens
regarding wound care and signs of infection
Monitoring the Quality of Hospital Care
10
Patient Flow
Ward
preoperative hospital days
for surgical skin preparation
materials available
preparation
surgical scrub and
methods, sterilization, disinfecting, packaging, storage
supplies available
surgical wound care
supplies for hand washing (e.g., sinks, soap, water supply, towels)
Patient home
Surgical scrub
surgical barrier
Surgical skin preparation
Appropriate perioperative
Surgical site care Patient and family education
See Appendix 5
intubation/mechanical
immobilization
nebulizers, humidifiers, bronchoscope
smoker
depressed sensorium
obesity
extremes of age (over 70)
severe underlying disease
low resistance/immunosuppression
cardio-pulmonary disease
anesthesia equipment
leakage around endotracheal cuff
contaminated hands
poor suctioning technique
repositioning
improper positioning resulting in aspiration
Figure 5. Fishbone Diagram: Nosocomial Pneumonia
Nosocomial Pneumonia
Equipment
ventilation
thoracic-abdominal surgery
contaminated respiratory therapy equipment,
contaminated
inadequate post-operative care, e.g., deep breathing,
poor intubation technique
Interventions Patients
Healthcare Workers
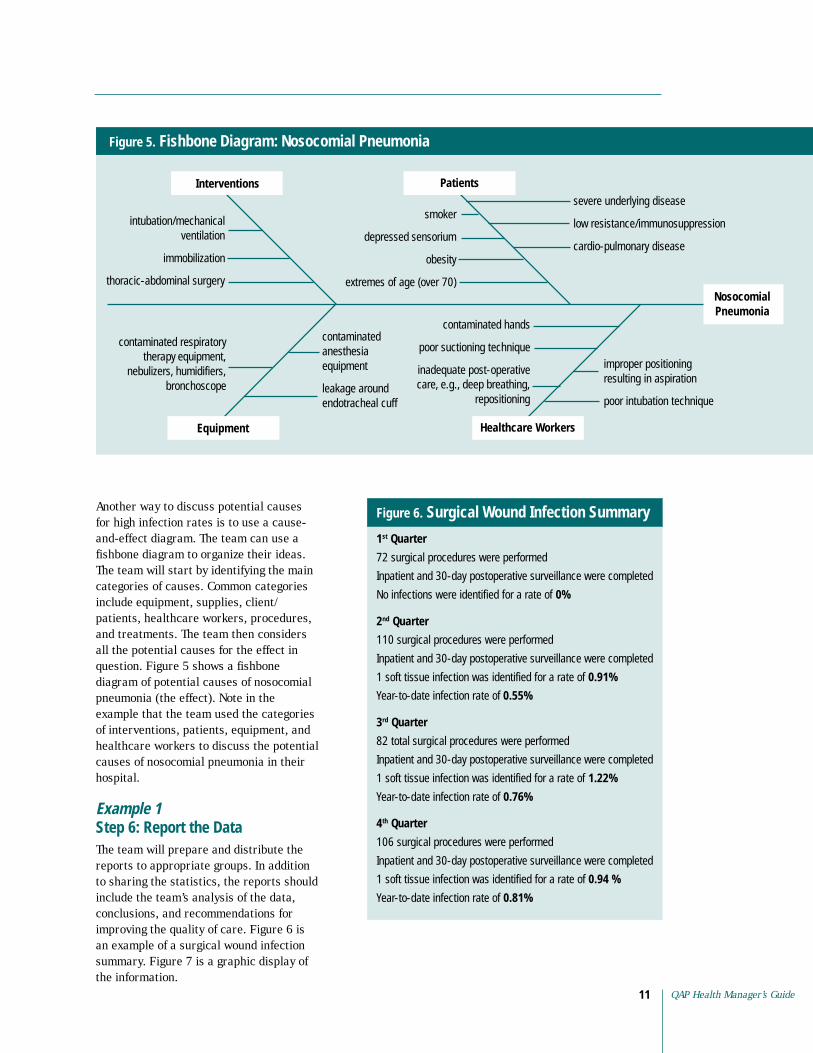
Another way to discuss potential causes for high infection rates is to use a cause-and-effect diagram. The team can use a fishbone diagram to organize their ideas. The team will start by identifying the main categories of causes. Common categories include equipment, supplies, client/ patients, healthcare workers, procedures, and treatments. The team then considers all the potential causes for the effect in question. Figure 5 shows a fishbone diagram of potential causes of nosocomial pneumonia (the effect). Note in the example that the team used the categories of interventions, patients, equipment, and healthcare workers to discuss the potential causes of nosocomial pneumonia in their hospital.
Example 1 Step 6: Report the Data The team will prepare and distribute the reports to appropriate groups. In addition to sharing the statistics, the reports should include the team’s analysis of the data, conclusions, and recommendations for improving the quality of care. Figure 6 is an example of a surgical wound infection summary. Figure 7 is a graphic display of the information.
Figure 6.
1st Quarter
No infections were identified for a rate of 0%
2nd Quarter
0.91%
0.55%
3rd Quarter
1.22%
0.76%
4th Quarter
1 soft tissue infection was identified for a rate of 0.94 %
0.81%
Surgical Wound Infection Summary
72 surgical procedures were performed
Inpatient and 30-day postoperative surveillance were completed
110 surgical procedures were performed
Inpatient and 30-day postoperative surveillance were completed
1 soft tissue infection was identified for a rate of
Year-to-date infection rate of
82 total surgical procedures were performed
Inpatient and 30-day postoperative surveillance were completed
1 soft tissue infection was identified for a rate of
Year-to-date infection rate of
106 surgical procedures were performed
Inpatient and 30-day postoperative surveillance were completed
Year-to-date infection rate of
QAP Health Manager’s Guide 11

Monitoring the Quality ofHospital Care
12
Figure 7. Surgical Incision Infection Rates Graph
Hospital X Surgical Incision Infection Rates
1994–1999
3.0
2.5
2.0
1.5
1.0
0.5
0 NNIS 1994 1995 1996 1997 1998 1999
1.42
1.81
1.65
2.49
1.81
0.56
0.81
Monitoring the Quality of Hospital Care
12
Prior Calendar Month Prior Calendar Month
4 South 300 1 0
100 1 1
Pediatrics 100 1 1
500 3 2
# admissions x 100 = 0.6% = 0.4%
Data Data Source for Source for Responsible for
Indicator Formula Numerator Denominator Collecting Data
Overall Death register Discharge (or a log can
mortality patient is identified as “deceased” in prior calendar month
Indicator for Inpatient Mortality Rates
during the prior calendar month
The first rate listed refers to the national rate, which should be included when available.
Percent
Aggregate Rate, 6/99
Table 9. Monitoring Tool for Inpatient Mortality Rates
Total Admissions in Total Deaths in Number of Ward Unexpected Deaths
Maternity
Totals:
Mortality rate # deaths divided by 3 divided by 500 x 100 2 divided by 500 x 100
Person
Total number of Medical record inpatient inpatient deaths where register staff
be developed) rate
Table 8.
Total number of inpatient admissions
Example 2 Step 3: Measure Mortality Rates Although overall hospital death rates do not reveal the severity of illness or the risk factors involved in treating an illness, they do provide the means for monitoring progress over time. Often mortality rates are viewed as the key indicator for quality of care provided by a hospital. Here again, the ideal outcome is that no hospitalized patients die from inadequate or negligent care.
Monitoring strategies Trending of mortality rates is the most common monitoring practice. Typically, there are figures at a national, regional, and local level. Infant and maternal mortality rates are of particular concern as an indicator of a country’s overall healthcare. Information regarding deaths is gleaned from patient records and reported to the state. The information is stratified according to ages, gender, and causes. Deaths also may be classified as a sentinel event. A sentinel event, as defined by the Joint Commission on Accreditation of Healthcare Organizations, is an unexpected occurrence involving death or serious physical or psychological injury. These events are called “sentinel” because they signal the need for immediate investigation and response. Perinatal and maternal deaths, infection-related deaths, returns to the operating room, and cardiac or respiratory arrests are examples of sentinel events. Table 8 is a sample indicator for inpatient mortality rates.
Data collection Table 9 displays the way to list the data on ward-by-ward deaths and compare these data with the number of total admissions. Some hospitals prefer to list the total number of deaths and use a separate column to list the number of unexpected deaths. The rationale is that some patients are admitted to the hospital and are expected to die (e.g., patients dying from AIDS or cancer). In this way, the team can differentiate between expected deaths and those deaths that may be a result of negligent or inadequate care.
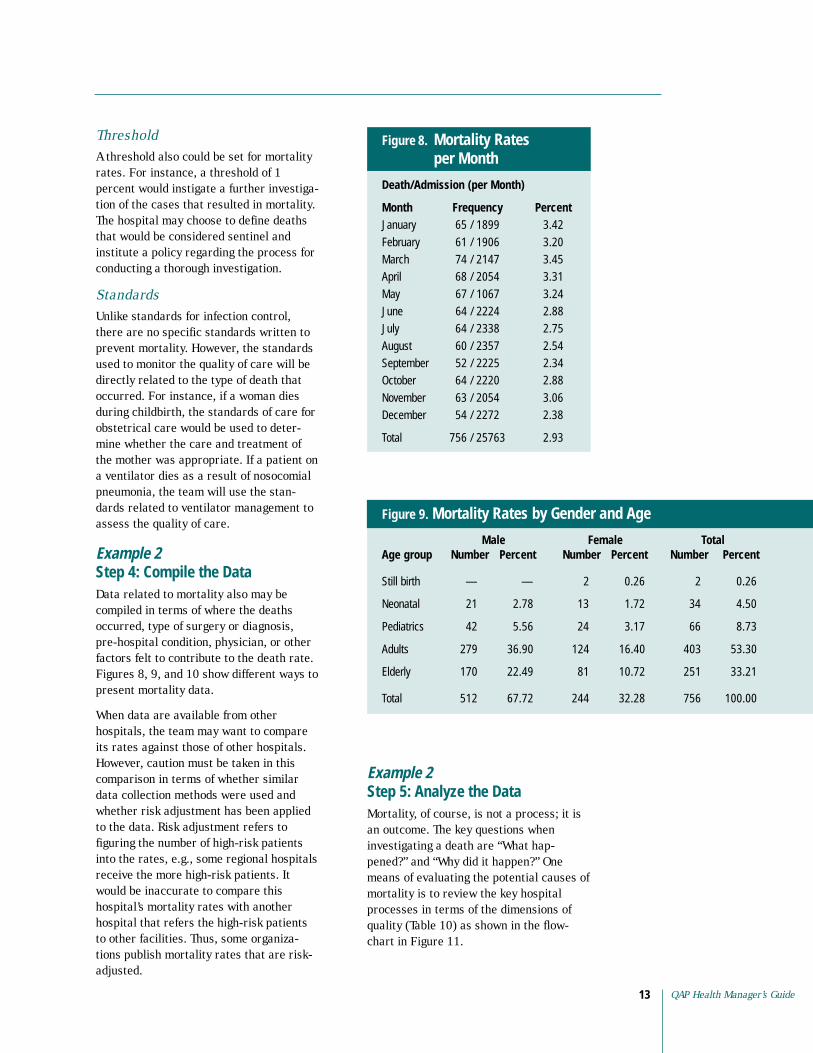
Threshold A threshold also could be set for mortality rates. For instance, a threshold of 1 percent would instigate a further investigation of the cases that resulted in mortality. The hospital may choose to define deaths that would be considered sentinel and institute a policy regarding the process for conducting a thorough investigation.
Standards Unlike standards for infection control, there are no specific standards written to prevent mortality. However, the standards used to monitor the quality of care will be directly related to the type of death that occurred. For instance, if a woman dies during childbirth, the standards of care for obstetrical care would be used to determine whether the care and treatment of the mother was appropriate. If a patient on a ventilator dies as a result of nosocomial pneumonia, the team will use the standards related to ventilator management to assess the quality of care.
Example 2 Step 4: Compile the Data Data related to mortality also may be compiled in terms of where the deaths occurred, type of surgery or diagnosis, pre-hospital condition, physician, or other factors felt to contribute to the death rate. Figures 8, 9, and 10 show different ways to present mortality data.
When data are available from other hospitals, the team may want to compare its rates against those of other hospitals. However, caution must be taken in this comparison in terms of whether similar data collection methods were used and whether risk adjustment has been applied to the data. Risk adjustment refers to figuring the number of high-risk patients into the rates, e.g., some regional hospitals receive the more high-risk patients. It would be inaccurate to compare this hospital’s mortality rates with another hospital that refers the high-risk patients to other facilities. Thus, some organizations publish mortality rates that are risk-adjusted.
Figure 8. Mortality Rates per Month
Death/Admission (per Month)
Month 65 / 1899 3.42
61 / 1906 3.20
March 74 / 2147 3.45
April 68 / 2054 3.31
May 67 / 1067 3.24
June 64 / 2224 2.88
64 / 2338 2.75
August 60 / 2357 2.54
September 52 / 2225 2.34
October 64 / 2220 2.88
November 63 / 2054 3.06
December 54 / 2272 2.38
756 / 25763 2.93
Frequency Percent January
February
July
Total
Example 2 Step 5: Analyze the Data Mortality, of course, is not a process; it is an outcome. The key questions when investigating a death are “What happened?” and “Why did it happen?” One means of evaluating the potential causes of mortality is to review the key hospital processes in terms of the dimensions of quality (Table 10) as shown in the flowchart in Figure 11.
Figure 9. Mortality Rates by Gender and Age
Male Age group Number Number Number
Still birth — — 2 0.26 2 0.26
2.78 1.72 4.50
5.56 3.17 8.73
Adults 279 36.90 124 16.40 403 53.30
170 22.49 10.72 251 33.21
512 67.72 244 32.28 756 100.00
Female Total Percent Percent Percent
Neonatal 21 13 34
Pediatrics 42 24 66
Elderly 81
Total
QAP Health Manager’s Guide 13

Monitoring the Quality ofHospital Care
14
Figure 10: Mortality Rates by Body System and Age
Neonatal Adults Elderly System
Cardiovascular system 1.45 4.50 154 20.37 117 15.48 316 41.80
5 0.66 2.38 12.83 6.48 169 22.35
Renal system 1.45 8 1.06 9.66 6.88 144 19.04
3 0.40 1.32 11.11 7.01 150 19.84
Gastrointestinal system 2 0.26 9 1.19 77 10.18 38 5.03 126 16.66
Cancer 1 0.13 5 0.66 8.99 7.01 127 16.79
Blood 2 0.26 2 0.26 4.76 1.85 7.13
Orthopedics — — 2 0.26 8 1.06 1.59 2.91
Miscellaneous 3 0.40 6 0.79 2.65 9 1.19 5.03
General 8 1.06 1.32 108 14.29 8.33 189 25.00
1.45 — — — — — — 1.45
— — 1 0.13 4.16 7.28 12.17
— — — — 1 0.13 — — 1 0.13
Still birth 2 0.26 — — — — — — 2 0.26
Pediatrics Total Number Percent Number Percent Number Percent Number Percent Number Percent
11 34
Central nervous system 18 97 49
11 73 52
Urinary-genital system 10 84 53
68 53
36 14 54
12 22
20 38
10 63
Pre-maturity 11 11
Diabetes 36 55 92
Opthamology
Dimensions of Quality of Care
Dimension Explanation
The degree to which the tasks carried out by health workers and facilities meet expectations of technical
Effectiveness of care The degree to which desired results (outcomes) of care are achieved
Safety
linguistic barriers
Interpersonal relations between providers and clients
Choice
Monitoring the Quality of Hospital Care
14
Table 10.
Technical performance quality (i.e., comply with standards)
Efficiency of service The ratio of the outputs of services to the associated costs of producing those delivery services
The degree to which the risks of injury, infection, or other harmful side effects are minimized
Access to services The degree to which healthcare services are unrestricted by geographic, economic, social, organizational, or
Trust, respect, confidentiality, courtesy, responsiveness, empathy, effective listening, and communication
Continuity of services Delivery of care by the same healthcare provider throughout the course of care (when appropriate) and appropriate and timely referral and communication between providers
Physical infrastructure and comfort The appearance of the facility, cleanliness, comfort, privacy, and other aspects that are important to clients
When appropriate, client choice of provider, insurance plan, or treatment

Figure 11. Flowchart: Hospital Stay Resulting in Mortality
Processes
Inputs Hospital
Admission to Hospital OutcomeDiagnosis
patient?
when needed?
supplies and materials available?
the tests/proce-dures?
patient?
expired
procedures performed according to hospital protocol?
communicated to the
admitted to the
and thorough assessment made according to protocol?
(e.g., hospital
access to emergency room)?
tion available?
referral made?
contribute to the death?
Did the physical environment contribute to the death?
Is staff properly qualified and
responsibilities?
piece of equipment?
condition?
Delivery to Tests/Procedures Treatment/Care
Patient Flow
Was competent staff available to admit the
Was necessary information available
Were the necessary
Was qualified staff available to conduct
Was a physician available to diagnosis the
Patient
Were tests and
Were results
physician rapidly?
Was the patient attended to quickly?
Was the patient
appropriate service?
Did staff attend to the patient’s needs immediately?
Was a complete
Was the appropriate diagnosis made?
Was the hospital readily accessible
gates open,
Was transporta
Was an appropriate and timely
Did the level of staffing
currently competent for their
Were the deaths related to a specific service or use of a
Was the care/treatment appropriate for the patient’s
Did the care or treatment contribute to the death?
Example 2 Step 6: Report the Data The team will prepare and distribute the reports to appropriate groups. In addition to sharing the statistics, the reports should include the team’s analysis of the data, conclusions, and recommendations for improving the quality of care.
Step 7: Expand the Program The quality team will act as a pilot for the monitoring program. After the team has functioned long enough to work out the “bugs” that crop up when monitoring the Quick Start indicators, the team can address other processes and services. The Quick Start method was limited to the hospital; however, monitoring programs can be designed to measure the effective
ness of services across the continuum of care. In this model, the quality team would include members representing the hospital, health center, and community caregivers (e.g., midwives). This integrated approach would provide a better view of the true incidence of hospital-acquired infections, since surgical infections can develop up to 30 days after the operative procedure, long after discharge from the hospital. Maternal mortality is also not specifically a hospital issue. It is a community problem for which an integrated team could investigate patient education, referral practices, transportation, and cultural issues that impact maternal mortality. This broader view will ultimately be necessary to optimize continuity of care. Figure 12 reviews the steps of the Quick Start approach.
QAP Health Manager’s Guide 15

Figure 12. The Quick Start
Process Steps
Identify a quality coordinator Form a quality team
Measure infection control and mortality rates
Use the
Report the results
Get organized
Collect data
Compile data information Analyze the data and results
Initiate quality improvement
Preparing for a Successful Monitoring System To implement a new system, it is important to take into account the time, personnel, and financial resources needed to sustain the system. Quality programs may be initiated at the direction of management or through the interest and enthusiasm of staff members. Regardless of who initiates the program, the following steps provide a way to build the foundation for a quality monitoring system.
Step 1: Obtain Support/ Commitment Elicit management support If the staff initiate the idea to implement a quality monitoring system, they will want to meet with key management leaders. Management, after all, provides direction and allocates resources. The agenda for this meeting might include: (a) the purpose of the meeting, (b) an explanation of a quality monitoring system, (c) the value of a monitoring system for the hospital, and (d) the type of management supportneeded.
Identify stakeholders Stakeholders are individuals or groups with vested interests in the successful outcome of the activity. Stakeholders can include physicians, Ministry of Health staff,
hospital staff, people from the community or formal community groups, and international agencies. It is important to identify the stakeholders at the outset by talking with staff members and meeting with key groups. In each case, discussing the purpose of the program and gaining support is critical. Learning the stakeholders’ expectations will help you develop the monitoring system.
Build ownership and involvement Finding ways to inform and involve staff is also key to success, since monitoring quality is not the work of a single individual. The output of quality monitoring may prove useless if staff do not “buy into” the need for quality measurement. The need to keep all stakeholders informed cannot be over-emphasized (see the section “Developing and Implementing a Communication Plan”).
Step 2: Organize a Monitoring System Identify a leader for the quality monitoring system Once the decision has been made to develop a quality monitoring system, a program coordinator must be appointed. The hospital will need someone to organize a steering committee and coordinate the quality monitoring system. Some organizations create a position for a quality assurance director who is responsible for coordinating activities. The program coordinator should have an interest in quality monitoring, the ability to organize and coordinate activities, the ability to facilitate groups, the respect of colleagues, and, optimally, some experience with monitoring.
Organize the steering committee Committee members should be selected to represent key stakeholders. Some hospitals use a management-level steering committee; others assemble members of staff. This choice may be based on several considerations: What is the time frame for initiating the new program? Does the staff currently have the knowledge and experi-
Monitoring the Quality of 16 Hospital Care
QAP Health Manager’s Guide17
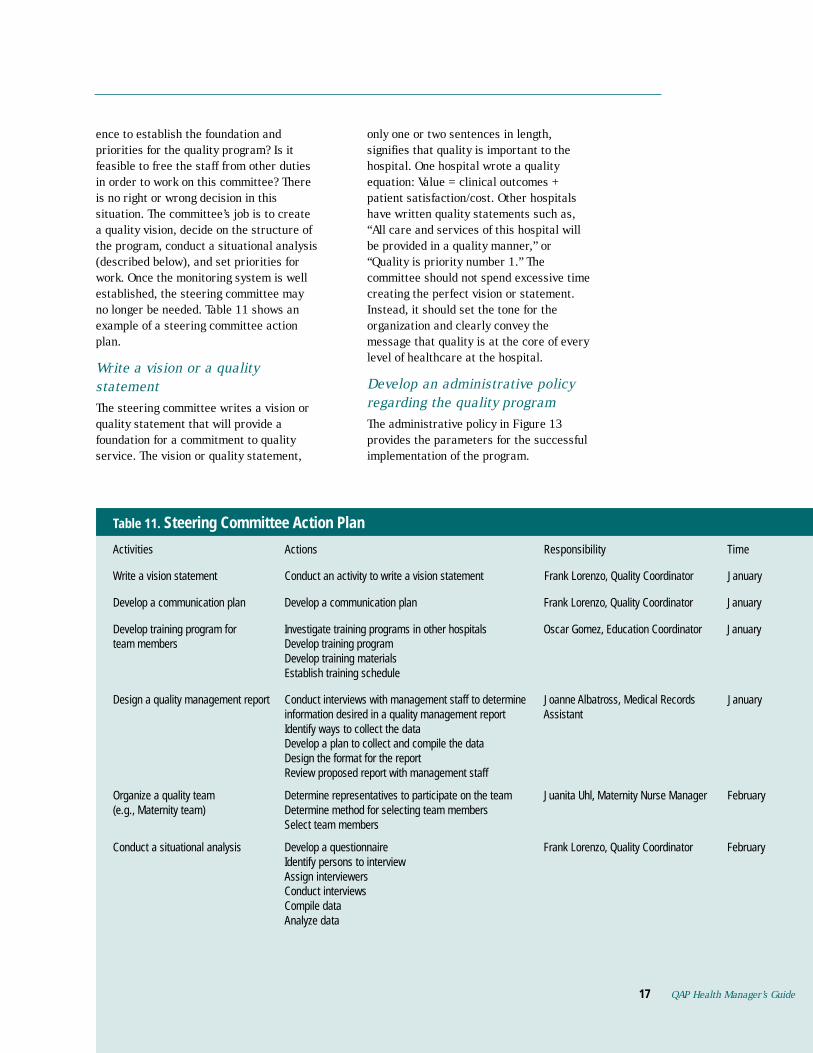
ence to establish the foundation and priorities for the quality program? Is it feasible to free the staff from other duties in order to work on this committee? There is no right or wrong decision in this situation. The committee’s job is to create a quality vision, decide on the structure of the program, conduct a situational analysis (described below), and set priorities for work. Once the monitoring system is well established, the steering committee may no longer be needed. Table 11 shows an example of a steering committee action plan.
Write a vision or a quality statement The steering committee writes a vision or quality statement that will provide a foundation for a commitment to quality service. The vision or quality statement,
only one or two sentences in length, signifies that quality is important to the hospital. One hospital wrote a quality equation: Value = clinical outcomes + patient satisfaction/cost. Other hospitals have written quality statements such as, “All care and services of this hospital will be provided in a quality manner,” or “Quality is priority number 1.” The committee should not spend excessive time creating the perfect vision or statement. Instead, it should set the tone for the organization and clearly convey the message that quality is at the core of every level of healthcare at the hospital.
Develop an administrative policy regarding the quality program The administrative policy in Figure 13 provides the parameters for the successful implementation of the program.
Steering Committee Action Plan
Activities Actions Responsibility
Develop a communication plan Develop a communication plan January
Develop training program for Investigate training programs in other hospitals January
information desired in a quality management report Assistant
Organize a quality team Determine method for selecting team members Select team members
Assign interviewers Conduct interviews
17
Table 11.
Time
Write a vision statement Conduct an activity to write a vision statement Frank Lorenzo, Quality Coordinator January
Frank Lorenzo, Quality Coordinator
Oscar Gomez, Education Coordinator team members Develop training program
Develop training materials Establish training schedule
Design a quality management report Conduct interviews with management staff to determine Joanne Albatross, Medical Records January
Identify ways to collect the data Develop a plan to collect and compile the data Design the format for the report Review proposed report with management staff
Determine representatives to participate on the team Juanita Uhl, Maternity Nurse Manager February (e.g., Maternity team)
Conduct a situational analysis Develop a questionnaire Frank Lorenzo, Quality Coordinator February Identify persons to interview
Compile data Analyze data
QAP Health Manager’s Guide

Monitoring the Quality ofHospital Care
18
Figure 13.
Hospital X Atlantis, Oceana
2000 I. Vision
II.
AIDS care
Roles and Responsibilities
Provides direction (quality planning) Provides supportive management
Provides resources (personnel,
Oversees quality monitoring program Coordinates team meetings and activities Provides expertise in quality monitoring
Facilitates quality team processes
Facilitates quality improvement activities
Steering Committee Provides support and guidance to the quality team Conducts a situational analysis
Assists with quality training activities Evaluates quality program Assists in change management plans and activities Assists with communication plan and implementation
Attends and actively participates in team meetings Participates in quality monitoring and improvement activities
Approval Process
Monthly reports of quality team activities will be submitted to the hospital director on the 10th of each month
Hospital Director
Steering Committee
Quality Manager
Quality AIDS
Quality
Childhood Illness Quality
Monitoring the Quality of Hospital Care
18
Administrative Policy, Quality Monitoring Plan
Hospital X is dedicated to improving the quality of care and services to its community. Quality is achieved through meeting the needs and expectations of our clients. Quality is realized through the work of multidisciplinary teams that establish scientifically based standards, continuously monitor their application, and use the results of the monitoring to improve care and services.
Primary Services: The priority services for quality monitoring system are:
A. Maternity care B. Diarrhea management C.
III. Program Organizational Structure
IV.
A. Hospital Director 1.
2. actions (participation)
3. training, and materials)
B. Quality Manager 1. 2. 3. 4. Trains teams and others in quality methodology 5. 6. Analyzes effectiveness of quality monitoring 7. 8. Facilitates communication and change processes
C. 1. 2. 3. Establishes services for monitoring 4. Establishes reporting formats and mechanisms 5. 6. 7. 8.
D. Quality Team Members 1. 2.
V.
A. The quality team comes to consensus and drafts the standards
B. The proposed standards are submitted to the department director for approval
C. Final approval is obtained from the hospital director
VI. Quality Reports
Maternity
Team Team Team
Key items addressed in the policy are:
■ Priority Services. It is important to understand the populations of interest. What types of patients do we serve? What are the most common diagnoses? What are our most frequently performed surgical procedures? In order to prioritize patient care services for quality monitoring, a list of the top five to ten most frequent admission diagnoses can be obtained. This is a good way to identify the high-volume services. These diagnoses can be listed across the top of the matrix as shown in Table 12. Other factors to consider when prioritizing are whether the service is high-risk or problem-prone. High-risk would indicate health conditions or services that have the potential for complications, injury, or death. Problem-prone services are identified through patient complaints, lack of compliance to standards, etc. The team can use a score of 1, 2, or 3 to identify the significance of the criteria in relation to the diagnosis/ service.
Example: Provincial Hospital is a 330bed tertiary care hospital offering a wide range of inpatient and outpatient services in an urban setting. The open-heart program is the only one in the country. There is a large maternity care program and a large population of patients with AIDS. Records show that the hospital receives all the multiple trauma cases in the region, which are primarily vehicular accidents. Diarrhea and subsequent dehydration is the primary cause of pediatric admissions under the age of five. The hospital used the prioritization matrix in Table 12 to prioritize their monitoring activities. The team rated each category in terms of high-volume, high-risk, and problem-prone. The totals allowed the team to determine priorities. Based on the scores in the matrix, the team identified three priority service areas: AIDS, maternity care, and diarrhea management. Within these three areas, the largest numbers of patients admitted to the hospital were diagnosed with AIDS.
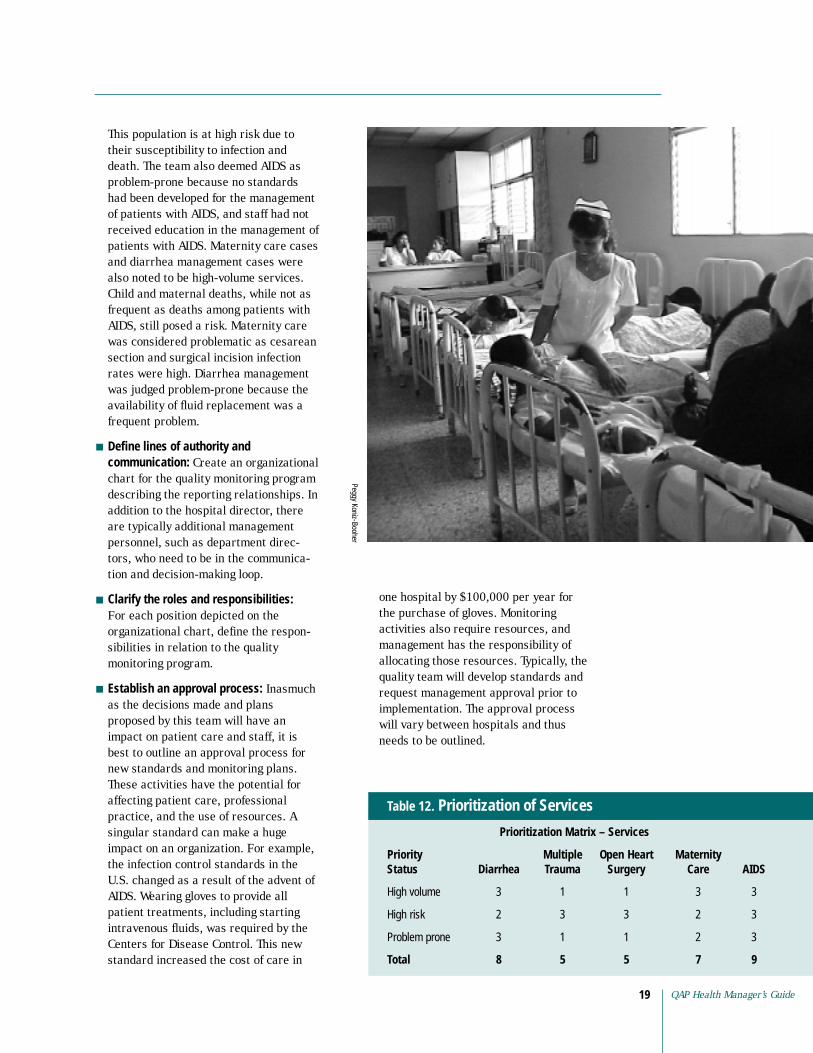
This population is at high risk due to their susceptibility to infection and death. The team also deemed AIDS as problem-prone because no standards had been developed for the management of patients with AIDS, and staff had not received education in the management of patients with AIDS. Maternity care cases and diarrhea management cases were also noted to be high-volume services. Child and maternal deaths, while not as frequent as deaths among patients with AIDS, still posed a risk. Maternity care was considered problematic as cesarean section and surgical incision infection rates were high. Diarrhea management was judged problem-prone because the availability of fluid replacement was a frequent problem.
■ Define lines of authority and communication: Create an organizational chart for the quality monitoring program describing the reporting relationships. In addition to the hospital director, there are typically additional management personnel, such as department directors, who need to be in the communication and decision-making loop.
■ Clarify the roles and responsibilities: For each position depicted on the organizational chart, define the responsibilities in relation to the quality monitoring program.
■ Establish an approval process: Inasmuch as the decisions made and plans proposed by this team will have an impact on patient care and staff, it is best to outline an approval process for new standards and monitoring plans. These activities have the potential for affecting patient care, professional practice, and the use of resources. A singular standard can make a huge
Peggy Koniz-Booher
one hospital by $100,000 per year for the purchase of gloves. Monitoring activities also require resources, and management has the responsibility of allocating those resources. Typically, the quality team will develop standards and request management approval prior to implementation. The approval process will vary between hospitals and thus needs to be outlined.
Priority Multiple Open Heart Maternity Status Diarrhea Care AIDS
High volume 3 1 1 3 3
High risk 2 3 3 2 3
Problem prone 3 1 1 2 3
8 5 5 7 9
Table 12. Prioritization of Services
Prioritization Matrix – Services
Trauma Surgery
Total
impact on an organization. For example, the infection control standards in the U.S. changed as a result of the advent ofAIDS. Wearing gloves to provide all patient treatments, including starting intravenous fluids, was required by the Centers for Disease Control. This new standard increased the cost of care in
QAP Health Manager’s Guide 19
Develop and implement a communication plan A communication plan is an essential element for implementing any new program. Planning for communication is an ongoing process. After each meeting of the monitoring team, the leader should ask, “Do we need to communicate any information resulting from this meeting?” If so, the monitoring team should develop an immediate plan. Communication is important when initiating the program, and it is equally important to plan for the distribution of monitoring information. Monitoring results should be reported to those healthcare providers who are most able to impact on and improve patient care. Reporting should be done on a systematic, ongoing basis to ensure that information sharing is timely. The following actions provide a structure for communication planning:
■ Identify target populations. The target populations include the groups, both internal and external, that will be affected by the new program or the results of the monitoring. Internal target populations include staff and physicians. External targets include the Ministry of Health, district supervisors, and other healthcare organizations that are involved in some capacity with the hospital. The public also has the right to know about the quality of care provided in a particular institution.
■ Determine the message. Most people will want to know how the program or findings will affect them. For instance, physicians will want to know whether the new program requires additional documentation. To gain support, the team should explain the advantages of additional documentation to the physicians (e.g., the data will help them improve patient care). The monitoring findings will prove important to all staff in addressing problem areas and finding ways to improve care.
■ Establish the means for delivering the message. The monitoring team should take advantage of established lines of communication (e.g., monthly staff meetings). However, although the monitoring team can deliver some messages in meetings and memos, at times one-to-one communication may yield more positive results. When reviewing the findings of monitoring, visual displays using graphs, charts, or tables will be useful. The idea is to report monitoring information in a manner that improves the process or outcome being measured.
■ Identify the person responsible for delivering the message. Unless the monitoring team assigns a specific person to deliver the message, the message might not be received. Ideally, the team should make one person responsible for sending the message (even if other members of the team will also be involved). The individual selected for the task must be suitable for the individual or group that is being addressed. For instance, if monitoring findings will be reported to a group of physicians, an appropriate person to deliver the message would be a respected member of the medical staff.
■ Establish a time frame for delivering the message. No plan can be created without a schedule for communicating information. The time frame should be reasonable and take into account the time considerations of the target populations. For example, if the monitoring team needs to communicate information to the staff working on the night shift, a team member needs to meet with the staff when they are on duty, rather than attempting to meet with them during their off hours.
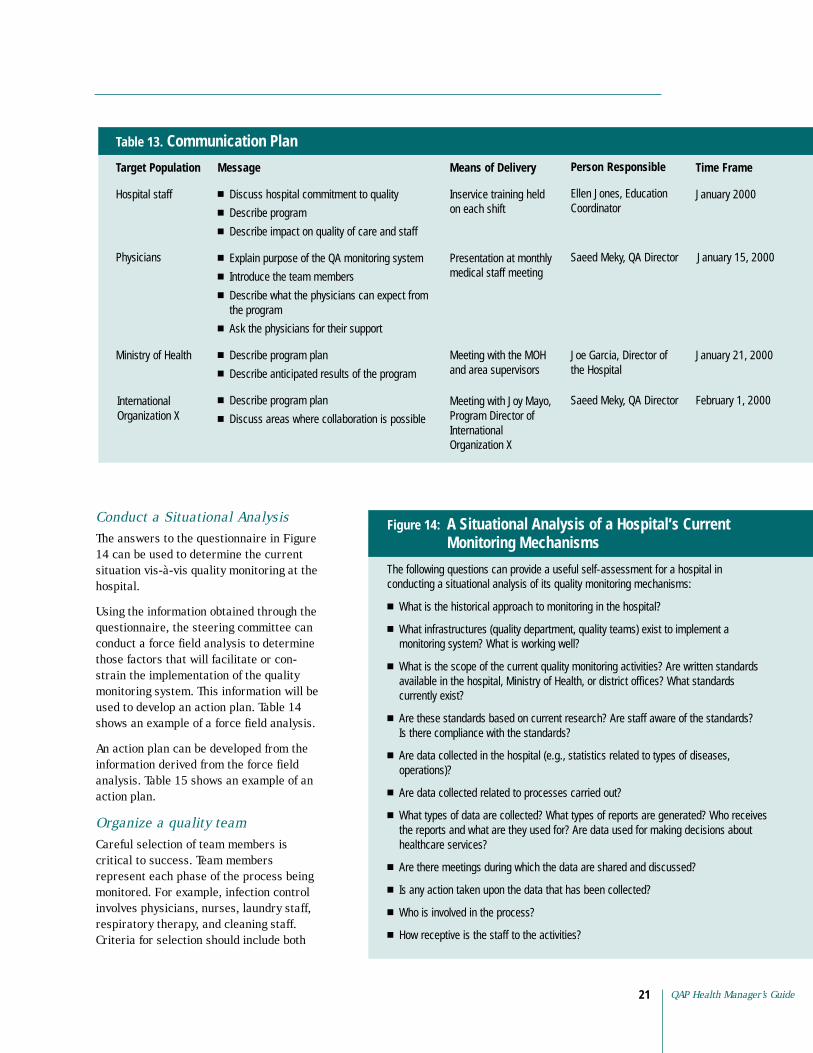
Table 13 is a sample communication plan to inform targeted populations about the quality monitoring system and the monitoring team.
Monitoring the Quality of 20 Hospital Care
Communication Plan
Hospital staff
Message
■ Discuss hospital commitment to quality
■ Describe program
■ Describe impact on quality of care and staff
■ Explain purpose of the QA monitoring system
■ Introduce the team members
■
■
■
■ Describe anticipated results of the program
■
■
Means of Delivery
Inservice training held on each shift Coordinator
Physicians Presentation at monthly
Meeting with the MOH and area supervisors
Joe Garcia, Director of the Hospital
Meeting with Joy Mayo,
International
International
Table 13.
Target Population
Describe what the physicians can expect from the program
Ask the physicians for their support
Describe program plan
Describe program plan
Discuss areas where collaboration is possible
Person Responsible
Ellen Jones, Education
Time Frame
January 2000
Ministry of Health
medical staff meeting Saeed Meky, QA Director
Saeed Meky, QA Director
January 15, 2000
January 21, 2000
February 1, 2000 Program Director of
Organization X
Organization X
Conduct a Situational Analysis The answers to the questionnaire in Figure 14 can be used to determine the current situation vis-à-vis quality monitoring at the hospital.
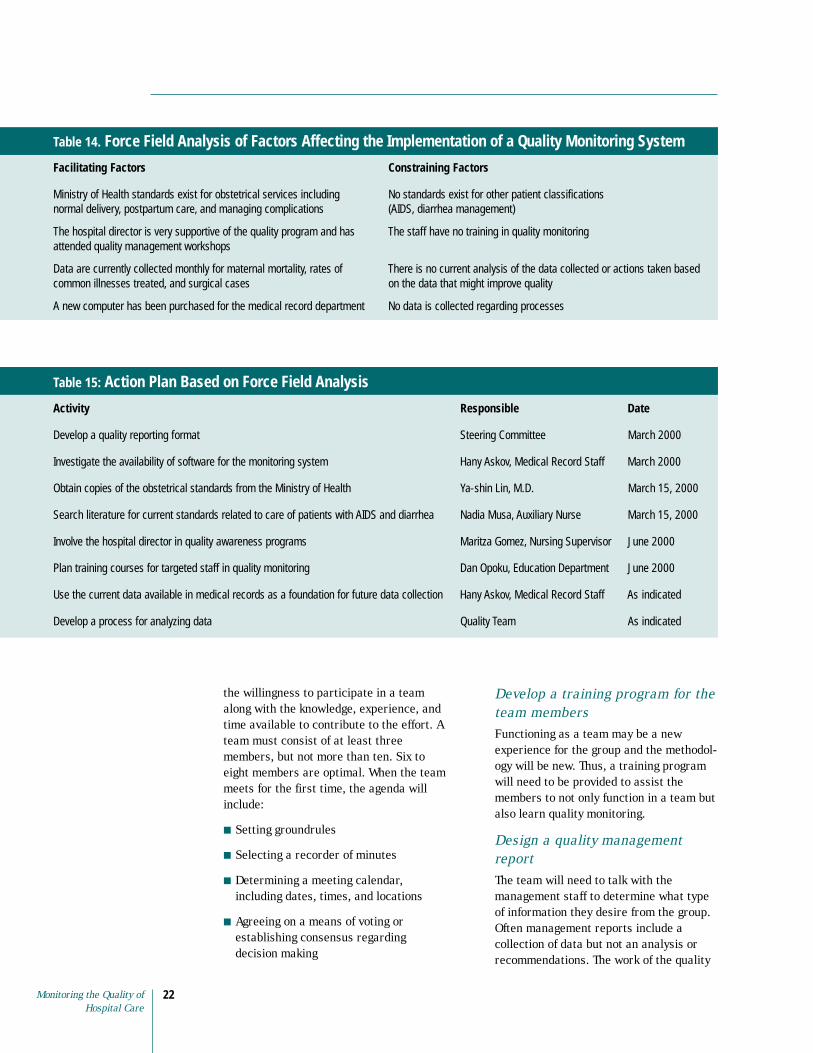
Using the information obtained through the questionnaire, the steering committee can conduct a force field analysis to determine those factors that will facilitate or constrain the implementation of the quality monitoring system. This information will be used to develop an action plan. Table 14 shows an example of a force field analysis.
An action plan can be developed from the information derived from the force field analysis. Table 15 shows an example of an action plan.
Organize a quality team Careful selection of team members is critical to success. Team members represent each phase of the process being monitored. For example, infection control involves physicians, nurses, laundry staff, respiratory therapy, and cleaning staff. Criteria for selection should include both
Figure 14: Monitoring Mechanisms
conducting a situational analysis of its quality monitoring mechanisms:
■ What is the historical approach to monitoring in the hospital?
■
■
currently exist?
■
Is there compliance with the standards?
■
operations)?
■ Are data collected related to processes carried out?
■
■ Are there meetings during which the data are shared and discussed?
■ Is any action taken upon the data that has been collected?
■ Who is involved in the process?
■ How receptive is the staff to the activities?
A Situational Analysis of a Hospital’s Current
The following questions can provide a useful self-assessment for a hospital in
What infrastructures (quality department, quality teams) exist to implement a monitoring system? What is working well?
What is the scope of the current quality monitoring activities? Are written standards available in the hospital, Ministry of Health, or district offices? What standards
Are these standards based on current research? Are staff aware of the standards?
Are data collected in the hospital (e.g., statistics related to types of diseases,
What types of data are collected? What types of reports are generated? Who receives the reports and what are they used for? Are data used for making decisions about healthcare services?
QAP Health Manager’s Guide 21
A new computer has been purchased for the medical record department
Table 14. Force Field Analysis of Factors Affecting the Implementation of a Quality Monitoring System
Facilitating Factors Constraining Factors
Ministry of Health standards exist for obstetrical services including No standards exist for other patient classifications normal delivery, postpartum care, and managing complications (AIDS, diarrhea management)
The hospital director is very supportive of the quality program and has The staff have no training in quality monitoring attended quality management workshops
Data are currently collected monthly for maternal mortality, rates of There is no current analysis of the data collected or actions taken based common illnesses treated, and surgical cases on the data that might improve quality
No data is collected regarding processes
Action Plan Based on Force Field Analysis
Activity Responsible Date
Steering Committee March 2000
March 2000
June 2000
Plan training courses for targeted staff in quality monitoring June 2000
Table 15:
Develop a quality reporting format
Investigate the availability of software for the monitoring system Hany Askov, Medical Record Staff
Obtain copies of the obstetrical standards from the Ministry of Health Ya-shin Lin, M.D. March 15, 2000
Search literature for current standards related to care of patients with AIDS and diarrhea Nadia Musa, Auxiliary Nurse March 15, 2000
Involve the hospital director in quality awareness programs Maritza Gomez, Nursing Supervisor
Dan Opoku, Education Department
Use the current data available in medical records as a foundation for future data collection Hany Askov, Medical Record Staff As indicated
Develop a process for analyzing data Quality Team As indicated
the willingness to participate in a team along with the knowledge, experience, and time available to contribute to the effort. A team must consist of at least three members, but not more than ten. Six to eight members are optimal. When the team meets for the first time, the agenda will include:
■ Setting groundrules
■ Selecting a recorder of minutes
■ Determining a meeting calendar, including dates, times, and locations
■ Agreeing on a means of voting or establishing consensus regarding decision making
Develop a training program for the team members Functioning as a team may be a new experience for the group and the methodology will be new. Thus, a training program will need to be provided to assist the members to not only function in a team but also learn quality monitoring.
Design a quality management report The team will need to talk with the management staff to determine what type of information they desire from the group. Often management reports include a collection of data but not an analysis or recommendations. The work of the quality
Monitoring the Quality of 22 Hospital Care

teams will be to collect, analyze, and recommend improvements in quality. The format of the management report should reflect this approach.
Monitoring Key Processes Rather than develop new standards, a monitoring team can identify existing standards. The team can either accept these standards as written or revise them.
Step 1: Identify Key Processes As pointed out in the framework in Figure 1, key processes may refer to hospital activities (e.g., admission) and specific processes used to manage patient care (e.g., diagnostic tests and treatment). Most patients admitted to a hospital undergo all of these processes. The team will discuss each process in relation to the particular service under consideration. For instance, the quality team considered the various inputs and processes involved within the maternity department:
■ Admission: Were qualified staff available to receive and treat the patient? What are the experiences of women in labor when being admitted to the hospital? How are emergency admissions handled?
■ Medication administration: Are there adequate medications to meet patient needs? Are protocols being followed for managing labor-inducing drugs? How is pain managed?
■ Diagnostic procedures: What types of diagnostic procedures are conducted in the maternity department? Is the equipment available and functional? Are there competent people to perform the tests? Are the results available in a timely manner?
■ Treatments and procedures: What are the typical treatments and procedures performed in maternity? Normal deliveries? Cesarean sections? What are the experiences of mothers in postpartum? Are the needs and expectations of the mothers and families being met?
■ Nursing care: Is nursing care provided according to established protocols and procedures? Are there concerns related to the assessment, planning, implementation, or evaluation of patient care?
■ Patient and family education and counseling: Are patients and families receiving education and counseling regarding home management? Are the education materials appropriate for the populations served?
■ Medical records: How well is information documented in the medical record? How much time does staff spend to document patient care? Are previous medical records brought to the ward rapidly?
■ Infection control: What are the infection control rates for cesarean sections? Are there other infection control issues?
Step 2: Prioritize Processes to Monitor Each quality team will prioritize processes to monitor. For instance, the maternity monitoring team prioritized the processes to monitor as those that are high-volume, high-risk, or problem-prone. The monitoring team listed the processes in a matrix similar to the one shown in Table 16. High-volume processes are the most frequently occurring processes. To identify high-risk processes, the team rated the processes with the most potential for harming the patient. Next, the team identified problem-prone processes based on patient complaints received and other problems for which the team had knowledge. The monitoring team rated each process with a score of 1, 2, or 3—with 3 signifying the highest priority. The total scores identify the processes most in need of monitoring. Using the ratings in the sample matrix, the hospital can begin to monitor medication administration and infection control standards.
QAP Health Manager’s Guide 23
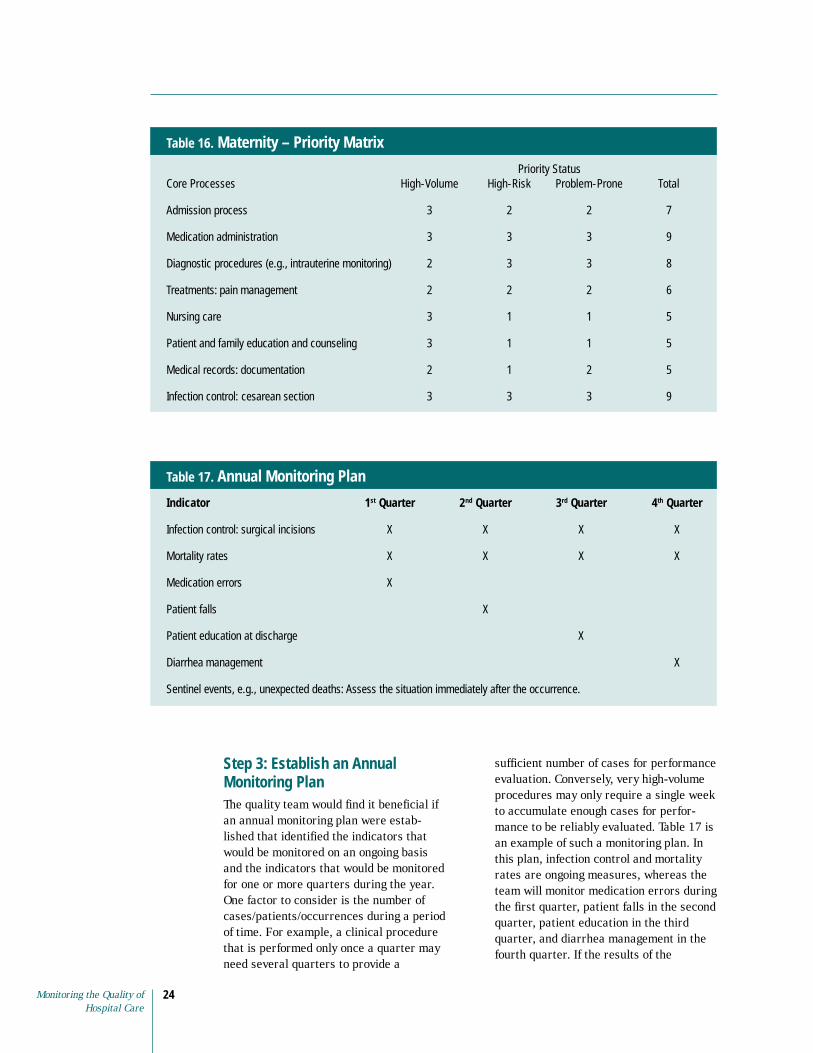
Maternity – Priority Matrix
Priority Status Core Processes High-Volume High-Risk Problem-Prone
Admission process 3 2 2 7
3 3 3 9
2 3 3 8
2 2 2 6
Nursing care 3 1 1 5
3 1 1 5
2 1 2 5
Infection control: cesarean section 3 3 3 9
Table 16.
Total
Medication administration
Diagnostic procedures (e.g., intrauterine monitoring)
Treatments: pain management
Patient and family education and counseling
Medical records: documentation
Annual Monitoring Plan
Indicator 1st Quarter 2nd Quarter 3rd Quarter 4th Quarter
X X X X
X X X X
Medication errors X
X
X
Diarrhea management X
Table 17.
Infection control: surgical incisions
Mortality rates
Patient falls
Patient education at discharge
Sentinel events, e.g., unexpected deaths: Assess the situation immediately after the occurrence.
Step 3: Establish an Annual Monitoring Plan The quality team would find it beneficial if an annual monitoring plan were established that identified the indicators that would be monitored on an ongoing basis and the indicators that would be monitored for one or more quarters during the year. One factor to consider is the number of cases/patients/occurrences during a period of time. For example, a clinical procedure that is performed only once a quarter may need several quarters to provide a
sufficient number of cases for performance evaluation. Conversely, very high-volume procedures may only require a single week to accumulate enough cases for performance to be reliably evaluated. Table 17 is an example of such a monitoring plan. In this plan, infection control and mortality rates are ongoing measures, whereas the team will monitor medication errors during the first quarter, patient falls in the second quarter, patient education in the third quarter, and diarrhea management in the fourth quarter. If the results of the
Monitoring the Quality of 24 Hospital Care

QAP Health Manager’s Guide25
monitoring indicate that standards are being met, no further action will be taken. If standards are not being met, the team will make decisions regarding actions to take and decide when to remonitor in order to evaluate whether an improvement has been made. Occasionally, an event (often referred to as a sentinel event) may occur that has such a significant consequence on patient safety and healthcare that it requires immediate evaluation and follow-up. Unexpected patient deaths are an example of a sentinel event.
Step 4: Develop Flowcharts A flowchart describes the steps and selected outcomes of the processes chosen for quality monitoring. In the example for the Quick Start, the monitoring team’s data indicate a high infection rate among patients with cesarean sections. Since cesarean sections are high-volume processes that present a moderate risk to a patient and put the patient at risk of infection, the team should start monitoring
postoperative cesarean section patients using the flowchart as depicted in Figure 4. Flowcharts can be developed through brainstorming and written standards can also provide information regarding the expected process. The flowchart in Figure 15 depicts a process for administering medications. If the team decides to monitor medication administration, it would start by developing the process flowchart. The team might then brainstorm the various factors that impact on the quality of administering medications. Next, the team would determine whether standards exist for medication administration, e.g., policies and procedures for handling medications. (For examples see Appendix 6, Pharmacy Department: Errors: Medication; and Appendix 7, Procedure: Medication Errors.) If standards do not currently exist within the country, the team would seek out standards written in other countries, through a literature review, Internet search, or phone calls to colleagues or organizations. Standards that are located
Figure 15. Medication Administration Flowchart
Physician Order for Medication
Medication Delivered Follow-up
Nurse Administers Medication
medication ordered for the condition?
sent to the pharmacy?
within the expiration
pharmacy?
delivered to the ward
stored properly when delivered?
medication administered?
given?
the correct time?
given to the correct patient?
given by the correct route, e.g., oral?
documented according to standards?
to the drug?
receive medication teaching?
25
Pharmacy Fills Order to Ward
Patient Flow
Was the physician’s order legible?
Was the correct
Was the correct order
Was the medication
date?
Was the medication available in the
Was the order filled correctly?
Was the medication
promptly?
Was the medication
Was the correct
Was the correct dose
Was the dose given at
Was the medication
Was the medication
Was the medication
Was the patient assessed for response
Were reactions recognized and treated appropriately?
Did the patient/family
Cousins, D.D. 1998. Medication use: A systems approach to reducing errors. Joint Commission on Accreditation of Healthcare Organizations.
QAP Health Manager’s Guide
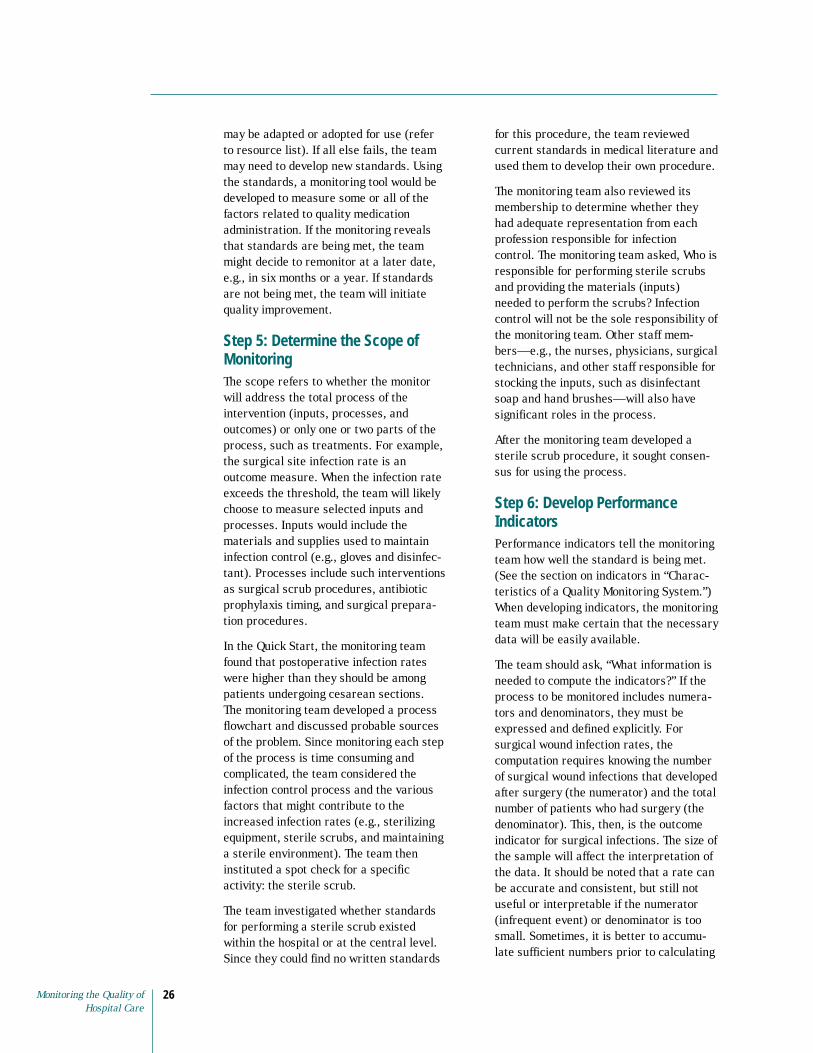
may be adapted or adopted for use (refer to resource list). If all else fails, the team may need to develop new standards. Using the standards, a monitoring tool would be developed to measure some or all of the factors related to quality medication administration. If the monitoring reveals that standards are being met, the team might decide to remonitor at a later date, e.g., in six months or a year. If standards are not being met, the team will initiate quality improvement.
Step 5: Determine the Scope of Monitoring The scope refers to whether the monitor will address the total process of the intervention (inputs, processes, and outcomes) or only one or two parts of the process, such as treatments. For example, the surgical site infection rate is an outcome measure. When the infection rate exceeds the threshold, the team will likely choose to measure selected inputs and processes. Inputs would include the materials and supplies used to maintain infection control (e.g., gloves and disinfectant). Processes include such interventions as surgical scrub procedures, antibiotic prophylaxis timing, and surgical preparation procedures.
In the Quick Start, the monitoring team found that postoperative infection rates were higher than they should be among patients undergoing cesarean sections. The monitoring team developed a process flowchart and discussed probable sources of the problem. Since monitoring each step of the process is time consuming and complicated, the team considered the infection control process and the various factors that might contribute to the increased infection rates (e.g., sterilizing equipment, sterile scrubs, and maintaining a sterile environment). The team then instituted a spot check for a specific activity: the sterile scrub.
The team investigated whether standards for performing a sterile scrub existed within the hospital or at the central level. Since they could find no written standards
for this procedure, the team reviewed current standards in medical literature and used them to develop their own procedure.
The monitoring team also reviewed its membership to determine whether they had adequate representation from each profession responsible for infection control. The monitoring team asked, Who is responsible for performing sterile scrubs and providing the materials (inputs) needed to perform the scrubs? Infection control will not be the sole responsibility of the monitoring team. Other staff mem-bers—e.g., the nurses, physicians, surgical technicians, and other staff responsible for stocking the inputs, such as disinfectant soap and hand brushes—will also have significant roles in the process.
After the monitoring team developed a sterile scrub procedure, it sought consensus for using the process.
Step 6: Develop Performance Indicators Performance indicators tell the monitoring team how well the standard is being met. (See the section on indicators in “Characteristics of a Quality Monitoring System.”) When developing indicators, the monitoring team must make certain that the necessary data will be easily available.
The team should ask, “What information is needed to compute the indicators?” If the process to be monitored includes numerators and denominators, they must be expressed and defined explicitly. For surgical wound infection rates, the computation requires knowing the number of surgical wound infections that developed after surgery (the numerator) and the total number of patients who had surgery (the denominator). This, then, is the outcome indicator for surgical infections. The size of the sample will affect the interpretation of the data. It should be noted that a rate can be accurate and consistent, but still not useful or interpretable if the numerator (infrequent event) or denominator is too small. Sometimes, it is better to accumulate sufficient numbers prior to calculating
Monitoring the Quality of 26 Hospital Care

rates. Generally, 30 or more procedures are considered a sufficient number of procedures for determining a rate. High-volume procedures (more than 50 per month) can be reported monthly, but quarterly or biannual reporting is more appropriate for less commonly performed procedures.
Sample surgical infection indicators for inputs and processes are shown in Table 18. For example, the proportion of surgicalstaff who had disinfectant soap available (the input) provides information about the materials available to control infections. The proportion of surgical staff who scrubs their hands according to standards before surgery (the process) provides information on how well the staff carries out this procedure. The proportion of patients who develop surgical wound infections (the outcome) provides information on the effectiveness of infection control measures.
Step 7: Develop Monitoring Strategies Another question the team should ask is “What are the sources of information?” Various strategies can be used to collect data. Concurrent data collection (collecting data at the time of occurrence) can be very effective, although it is often not possible. Some hospitals choose this method to evaluate activities that would be difficult to evaluate from reviewing records such as emergency responses. In these cases, someone may be assigned to observe the emergency intervention and provide immediate feedback to the team. Daily observations of wound infections are another example of concurrent monitoring. Prospective (after the fact) data collection is one of the most frequently used means of collecting information. In this method, data is collected over a specified period of time (e.g., one to three months) and is often gleaned from the medical record or hospital logs. A point prevalence survey (a
Indicator for Surgical Scrub Infection Rates
Data Data Source for Source for Responsible for
Indicator Formula Numerator Denominator Collecting Data
scrub procedure
completed the surgical scrub according to the procedure
who should have
scrub
Number of times the inputs (disinfectant
and clean towels) were
data collection tool
Martha Jackson and Ralph Maize, QA team members
data collection tool
scrub inputs
data collection tool
data collection tool
Martha Jackson and Ralph Maize, QA team members
Table 18.
Person
Surgical Number of staff who
Total number of staff
completed a surgical
soap, hand brushes,
available for the surgical scrub
Total number of observations made
Surgical scrub Surgical scrub
Surgical Surgical scrub Surgical scrub
Instructions: Make observations between 6 a.m. and 7 a.m. every morning, Monday through Friday, for the first two weeks of July. Complete the surgical scrub collection tool for every staff member who should perform a surgical scrub.
QAP Health Manager’s Guide 27
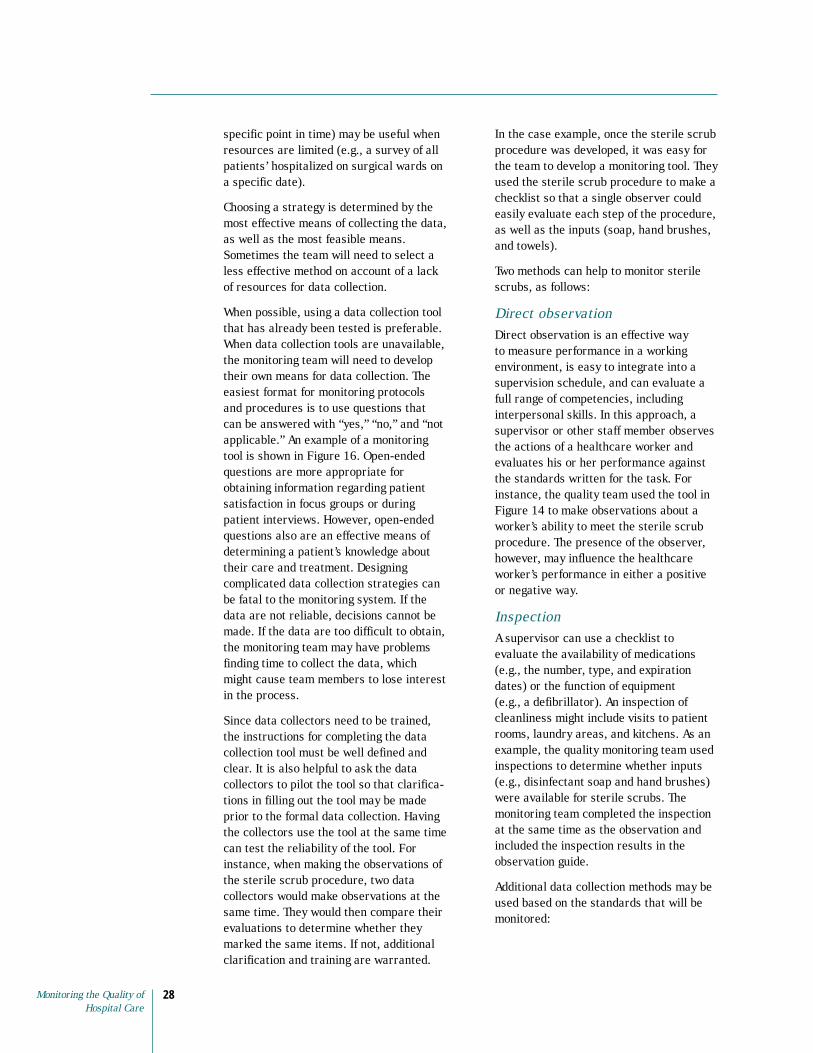
specific point in time) may be useful when resources are limited (e.g., a survey of all patients’ hospitalized on surgical wards on a specific date).
Choosing a strategy is determined by the most effective means of collecting the data, as well as the most feasible means. Sometimes the team will need to select a less effective method on account of a lack of resources for data collection.
When possible, using a data collection tool that has already been tested is preferable. When data collection tools are unavailable, the monitoring team will need to develop their own means for data collection. The easiest format for monitoring protocols and procedures is to use questions that can be answered with “yes,” “no,” and “not applicable.” An example of a monitoring tool is shown in Figure 16. Open-ended questions are more appropriate for obtaining information regarding patient satisfaction in focus groups or during patient interviews. However, open-ended questions also are an effective means of determining a patient’s knowledge about their care and treatment. Designing complicated data collection strategies can be fatal to the monitoring system. If the data are not reliable, decisions cannot be made. If the data are too difficult to obtain, the monitoring team may have problems finding time to collect the data, which might cause team members to lose interest in the process.
Since data collectors need to be trained, the instructions for completing the data collection tool must be well defined and clear. It is also helpful to ask the data collectors to pilot the tool so that clarifications in filling out the tool may be made prior to the formal data collection. Having the collectors use the tool at the same time can test the reliability of the tool. For instance, when making the observations of the sterile scrub procedure, two data collectors would make observations at the same time. They would then compare their evaluations to determine whether they marked the same items. If not, additional clarification and training are warranted.
In the case example, once the sterile scrub procedure was developed, it was easy for the team to develop a monitoring tool. They used the sterile scrub procedure to make a checklist so that a single observer could easily evaluate each step of the procedure, as well as the inputs (soap, hand brushes, and towels).
Two methods can help to monitor sterile scrubs, as follows:
Direct observation Direct observation is an effective way to measure performance in a working environment, is easy to integrate into a supervision schedule, and can evaluate a full range of competencies, including interpersonal skills. In this approach, a supervisor or other staff member observes the actions of a healthcare worker and evaluates his or her performance against the standards written for the task. For instance, the quality team used the tool in Figure 14 to make observations about a worker’s ability to meet the sterile scrub procedure. The presence of the observer, however, may influence the healthcare worker’s performance in either a positive or negative way.
Inspection A supervisor can use a checklist to evaluate the availability of medications (e.g., the number, type, and expiration dates) or the function of equipment (e.g., a defibrillator). An inspection of cleanliness might include visits to patient rooms, laundry areas, and kitchens. As an example, the quality monitoring team used inspections to determine whether inputs (e.g., disinfectant soap and hand brushes) were available for sterile scrubs. The monitoring team completed the inspection at the same time as the observation and included the inspection results in the observation guide.
Additional data collection methods may be used based on the standards that will be monitored:
Monitoring the Quality of 28 Hospital Care
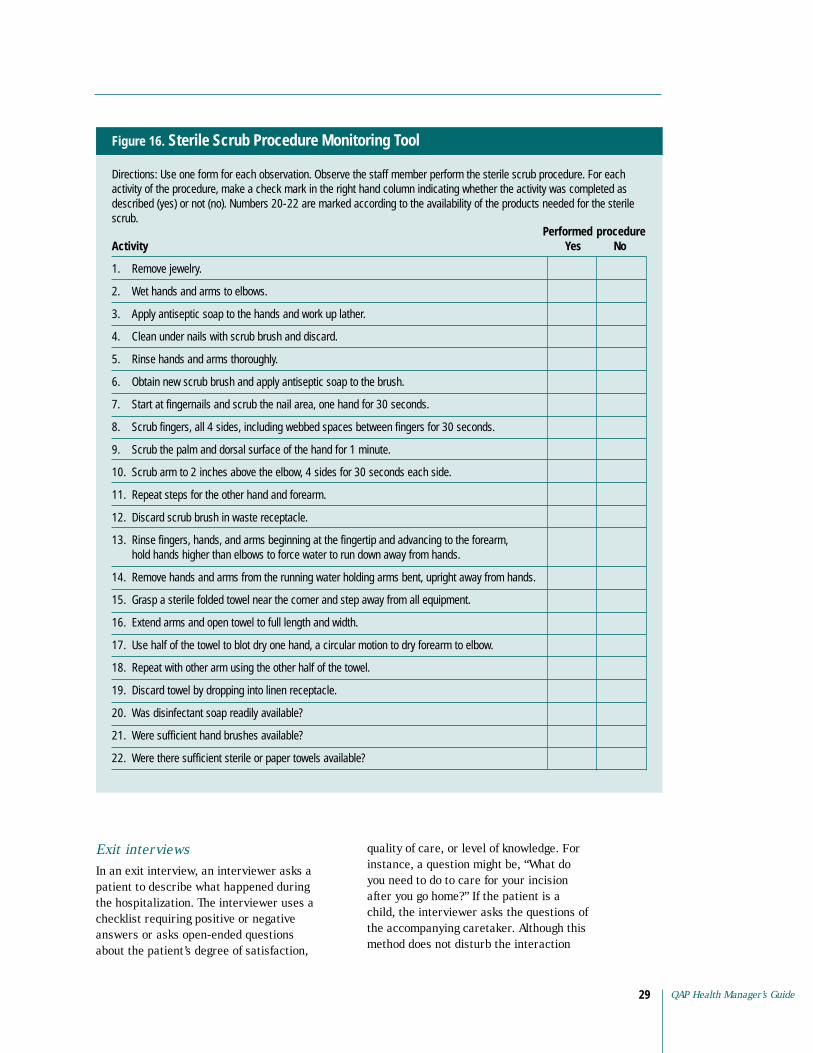
Figure 16. Sterile Scrub Procedure Monitoring Tool
Directions: Use one form for each observation. Observe the staff member perform the sterile scrub procedure. For each activity of the procedure, make a check mark in the right hand column indicating whether the activity was completed as described (yes) or not (no). Numbers 20-22 are marked according to the availability of the products needed for the sterile scrub.
Performed procedure Activity Yes No
1. Remove jewelry.
2. Wet hands and arms to elbows.
3. Apply antiseptic soap to the hands and work up lather.
4. Clean under nails with scrub brush and discard.
5. Rinse hands and arms thoroughly.
6. Obtain new scrub brush and apply antiseptic soap to the brush.
7. Start at fingernails and scrub the nail area, one hand for 30 seconds.
8. Scrub fingers, all 4 sides, including webbed spaces between fingers for 30 seconds.
9. Scrub the palm and dorsal surface of the hand for 1 minute.
10. Scrub arm to 2 inches above the elbow, 4 sides for 30 seconds each side.
11. Repeat steps for the other hand and forearm.
12. Discard scrub brush in waste receptacle.
13. Rinse fingers, hands, and arms beginning at the fingertip and advancing to the forearm, hold hands higher than elbows to force water to run down away from hands.
14. Remove hands and arms from the running water holding arms bent, upright away from hands.
15. Grasp a sterile folded towel near the corner and step away from all equipment.
16. Extend arms and open towel to full length and width.
17. Use half of the towel to blot dry one hand, a circular motion to dry forearm to elbow.
18. Repeat with other arm using the other half of the towel.
19. Discard towel by dropping into linen receptacle.
20. Was disinfectant soap readily available?
21. Were sufficient hand brushes available?
22. Were there sufficient sterile or paper towels available?
Exit interviews In an exit interview, an interviewer asks a patient to describe what happened during the hospitalization. The interviewer uses a checklist requiring positive or negative answers or asks open-ended questions about the patient’s degree of satisfaction,
quality of care, or level of knowledge. For instance, a question might be, “What do you need to do to care for your incision after you go home?” If the patient is a child, the interviewer asks the questions of the accompanying caretaker. Although this method does not disturb the interaction
QAP Health Manager’s Guide 29
between the patient and healthcare provider, it may subsequently influence the provider’s performance.
The quality of the information may be limited by the patient’s observation ability, understanding of the situation, and memory of the hospitalization. The reliability of the information may be decreased because many patients consider expressions of dissatisfaction to be discourteous. Some studies show a difference between the information that patients provide in an interview before discharge and the information they provide during focus group discussions. The monitoring team may choose to use a questionnaire as an alternative to interviewing patients. In developing countries, however, a questionnaire may have limited value if the clients are illiterate or speak another language—or if there is unreliable mail service.
Review of records Information about compliance with standards might be available in medical records, reporting forms for the health information system, logbooks, or any document containing information on patients’ health problems. For example, if the monitoring team needed to assess compliance with the protocol for care of a
Pegg
y Ko
niz-
Booh
er
patient with a postpartum hemorrhage, the team could review charts to determine whether the staff documented the steps of the protocol in the patient’s record. A supervisor can conduct the chart review, but because healthcare staff are more directly aware of problems, they should be actively involved with the problem-solving activities of the review.
This method, however, has serious limitations. The information found in medical records in developing countries is usually limited to symptoms, diagnosis, treatment, and, at times, is poorly documented. Unless medical records are well designed, sufficiently detailed, and accurate, they will not permit an assessment of the process of care. In these cases, direct observation may be the most effective way to obtain the information.
Mystery patients The monitoring team may also obtain information unobtrusively by using a mystery patient (a person asked to visit the hospital anonymously, experience a process, and provide an account of the experience). This is a good method to evaluate admissions procedures. For example, the monitoring team could ask the mystery patient to notice how he or she was greeted upon entering the hospital and what happened during registration and initial interviews. However, this method may be time-consuming, expensive, impractical, or culturally unacceptable.
Focus group discussions A focus group is another excellent means of soliciting information about the client’s needs and expectations. The monitoring team can convene a homogeneous group (e.g., former patients, family members, physicians, or other healthcare workers) to discuss healthcare issues. Skilled interviewers may not be available. A practical option would be to have the monitoring team conduct the focus group interview with some assistance in developing questions and guidance in interviewing techniques.
Monitoring the Quality of 30 Hospital Care
Each method has advantages and disadvantages; no single method is adequate for all situations. The monitoring team might find a combination of methods to be more reliable. The selection of the most effective methods will depend on resources available (e.g., time), the data collector’s familiarity with the method, and the information that the monitoring team is seeking. The monitoring team should identify the most feasible data collection tools for each indicator.
Step 8: Compile and Analyze the Data As described in the Quick Start method, the data must be compiled and analyzed. The manner in which the data is compiled will depend on the data collection method. Questionnaires with yes and no responses are easier to tabulate than information obtained through a focus group. Data must be organized in a way that it is easily interpreted. Visual displays such as charts, graphs, and tables help the staff interpret results of the monitoring. Showing results from previous data collections, and noting the threshold on the graphs, provides a comparison from which to draw conclusions. Figure 16 shows the results of the sterile scrub procedure monitoring.
When calculating the results based on the indicators, the first indicator was measuring compliance to the surgical scrub. Because there are various steps to the procedure and varying degrees of compliance, the overall compliance rate is based on the steps involved in the scrub (steps 1–19). In order to calculate the overall compliance rate, the team added up the score in the “yes” column for steps one through 19 (1,725 “yes” observations) and divided that number by the total number of observations for each step (125 observations multiplied by 19 steps equals 2,375 total observations). Thus, the compliance rate was 1,725 “yes” observations divided by 2,375 total observations multiplied by 100 to equate to a 73 percent rate of compliance. It is possible to calculate
compliance to each of the steps as demonstrated in Figure 16. Knowing the rates of compliance for each step permitted the team to focus on specific areas that needed improvement. The second indicator was the number of times the inputs (disinfectant soap, hand brushes, and clean towels) were available for the surgical scrub divided by the total number of observations made. In this case, there were three inputs (questions 20, 21, and 22) that also can be calculated separately as shown in the last 3 rows of Figure 16.
What conclusions can be drawn from the tabulation of the data from the sterile scrub monitoring activity? First, the areas most deficient are related to the use of sterile towels. Staff completed this activity only 20 percent of the time. With the additional information that sterile towels were only available 20 percent of the time, the team concluded that the problem was insufficient availability of sterile towels. Other problems were noted including the removal of jewelry, cleaning under nails, the hand and forearm scrub procedure, and proper disposal of the towel. This monitoring tool provided sufficient information to specifically pinpoint areas for improvement. The team was able to move to developing an action plan for quality improvement. After implementing the improvement plan, which would likely include reviewing the surgical scrub procedure with staff and providing sufficient towels, the team will re-measure compliance with the procedure to determine whether improvements have resulted from the interventions. In addition, the team will continue to monitor the surgical infection rates. They may find that the improvement in compliance to the surgical scrub procedure reduces the infection rates. If not, additional monitoring will need to be conducted in relation to other aspects of the infection control process to determine other potential sources for the increased infection rates.
QAP Health Manager’s Guide 31
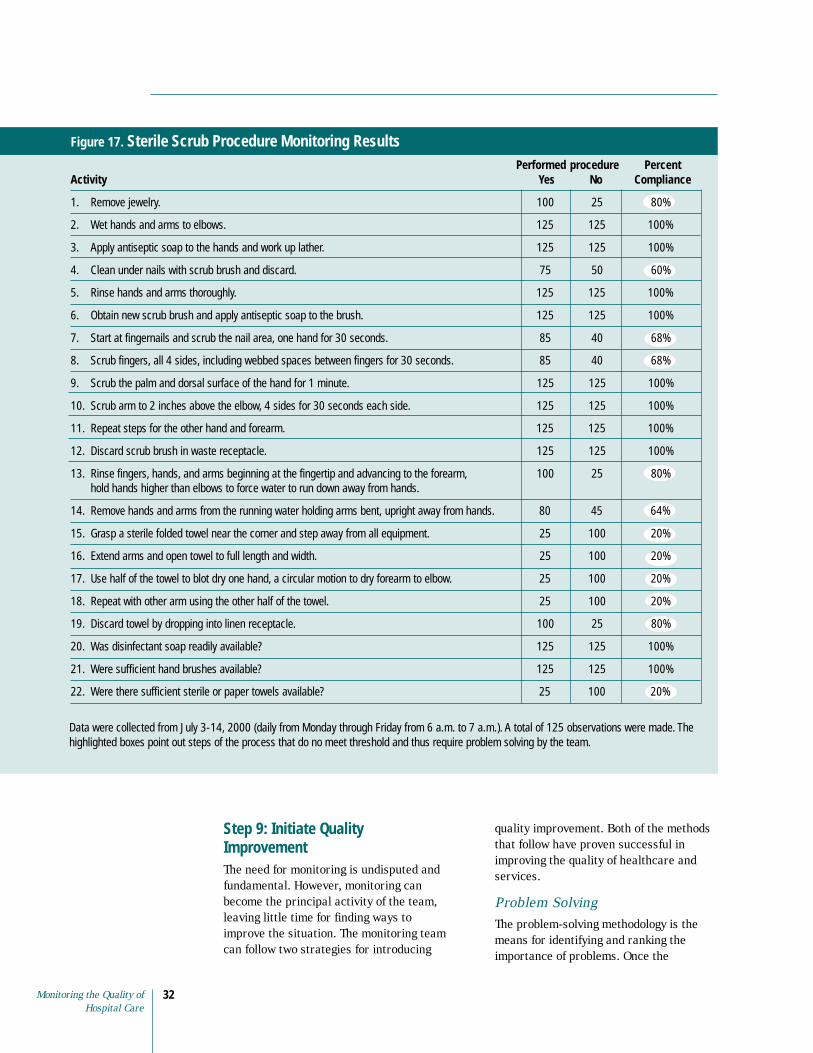
Figure 17. Sterile Scrub Procedure Monitoring Results Performed procedure Percent
Activity Yes No Compliance
1. Remove jewelry. 100 25 80%
2. Wet hands and arms to elbows. 125 125 100%
3. Apply antiseptic soap to the hands and work up lather. 125 125 100%
4. Clean under nails with scrub brush and discard. 75 50 60%
5. Rinse hands and arms thoroughly. 125 125 100%
6. Obtain new scrub brush and apply antiseptic soap to the brush. 125 125 100%
7. Start at fingernails and scrub the nail area, one hand for 30 seconds. 85 40 68%
8. Scrub fingers, all 4 sides, including webbed spaces between fingers for 30 seconds. 85 40 68%
9. Scrub the palm and dorsal surface of the hand for 1 minute. 125 125 100%
10. Scrub arm to 2 inches above the elbow, 4 sides for 30 seconds each side. 125 125 100%
11. Repeat steps for the other hand and forearm. 125 125 100%
12. Discard scrub brush in waste receptacle. 125 125 100%
13. Rinse fingers, hands, and arms beginning at the fingertip and advancing to the forearm, hold hands higher than elbows to force water to run down away from hands.
100 25 80%
14. Remove hands and arms from the running water holding arms bent, upright away from hands. 80 45 64%
15. Grasp a sterile folded towel near the corner and step away from all equipment. 25 100 20%
16. Extend arms and open towel to full length and width. 25 100 20%
17. Use half of the towel to blot dry one hand, a circular motion to dry forearm to elbow. 25 100 20%
18. Repeat with other arm using the other half of the towel. 25 100 20%
19. Discard towel by dropping into linen receptacle. 100 25 80%
20. Was disinfectant soap readily available? 125 125 100%
21. Were sufficient hand brushes available? 125 125 100%
22. Were there sufficient sterile or paper towels available? 25 100 20%
Data were collected from July 3-14, 2000 (daily from Monday through Friday from 6 a.m. to 7 a.m.). A total of 125 observations were made. The highlighted boxes point out steps of the process that do no meet threshold and thus require problem solving by the team.
Step 9: Initiate Quality Improvement The need for monitoring is undisputed and fundamental. However, monitoring can become the principal activity of the team, leaving little time for finding ways to improve the situation. The monitoring team can follow two strategies for introducing
quality improvement. Both of the methods that follow have proven successful in improving the quality of healthcare and services.
Problem Solving The problem-solving methodology is the means for identifying and ranking the importance of problems. Once the
Monitoring the Quality of 32 Hospital Care

1
2
3
4
5
6
7
8
9
monitoring team selects a problem for resolution, the team goes on to investigate the causes of the problem, so that the solution eventually selected will offer the greatest chance of resolving the problem.
Process Improvement The monitoring team should use process improvement when the problem is significant and the team believes that a more in-depth review of the whole process is warranted. Thus, instead of solving singular problems, the whole process is reconsidered for improvement.
The key steps in the monitoring processes are reviewed in Figure 18.
Figure 18. Key Steps in Monitoring Processes
.
. Prioritize processes to monitor
.
. Develop flowcharts
. Determine scope of monitoring
.
. Develop monitoring strategies
.
.
Identify key processes
Establish an annual monitoring plan
Develop performance indicators
Compile and analyze the data
Initiate quality improvement
QAP Health Manager’s Guide 33

Appendix 1: Use of Specific Standard Formats
Description and Use of Healthcare Standards The taxonomy described various formats for writing standards. Facilities typically use a variety of these formats based on the user and the application. Thus, it is not a matter of selecting a single format for developing standards. For instance, clinical practice guidelines have been developed primarily by physicians to guide their practice, while protocols and procedures have been designed for more general use by healthcare professionals. Clinical pathways is a multidisciplinary approach to writing and implementing standards that were originally designed for use in hospitals but are now being applied to other settings. The group designated to develop standards will want to consider who will be using the standards, in what setting, and for what purpose. Some organizations have identified their key population—as well as common procedures—in order to prioritize and plan their process for standard development. For example (see insert marked “Example” on page 35), one hospital focused on the high volume of patients undergoing cesarean sections.
Administrative policies Administrative policies are written at both an organizational and departmental level. For instance, organizational administrative policies often include the following elements:
■ Description of organizational setting: location, type of facility
■ Purpose of organization
■ Mission statement
■ Objectives of organization
■ Organizational chart
■ Hours of operation
■ Healthcare services available
■ Staff: types (physicians, nurses, technicians), utilization, medical staff body, management job descriptions
■ Ethical/legal issues: employee drug abuse policies, professional licensure requirements, and scope of practice
■ Patient safety: infection control, visitor policies, and disaster/fire policies
Organizational policies are written to cover issues that effect the whole organization and staff. In contrast, each department (pharmacy, nursing, and laboratory) will have department-specific policies. The elements included in these policies might be:
■ Description of department
■ Organizational chart
■ Hours of operation
■ Services available
■ Staff: types, utilization, staff job descriptions
■ Specific department policies, e.g., medication administration
Department policies complement the organizational policies and may be more specific. For instance, the visitor policy for the hospital may be between 8 a.m. and 8 p.m., however, the visitors’ policy in the critical care unit may be more restrictive or additional standards may be outlined for family members visiting the maternity ward.
Algorithms Algorithms are written in the format of a flowchart or decision tree. This format provides a quick visual reference for responding to a situation. For instance, algorithms are effective in emergency departments and critical care units. When staff are faced with an emergency, such as a patient hemorrhaging, they can treat the patient rapidly by following the algorithm.
Monitoring the Quality of 34 Hospital Care

QAP Health Manager’s Guide35
Clinical pathways Clinical pathways provide the details of daily care for a specific diagnosis. The unique feature of clinical pathways is that they provide a day by day standardized plan of care. These plans are most often multidisciplinary so that care or treatment carried out by physicians, nurses, and therapists are all on the same form. The advantage of this format is that the patient’s progress is monitored daily according to the expected standards. When the patient does not progress according to plan, an assessment can be made immediately and the “variance” reviewed. The patient may not be progressing due to problems in the system; e.g. the medication was not delivered. Or it may be, as a result of a problem such as the patient did not tolerate the medication. Regardless of the cause, the healthcare providers can intervene.
Clinical practice guidelines Clinical practice guidelines are typically physician-generated recommendations to assist practitioners in providing appropriate healthcare. The guidelines are evidence-based (based on current research) and unlike other types of formats that provide a step-wise approach to care and treatment, the guidelines provide information regarding the most effective treatments. Physicians use this information along with their experience and knowledge of the patient to determine the appropriate plan of care.
Procedures Procedures are step-by-step instructions on how to perform a technical skill. This format often involves the use of equipment, medication, or treatment. Examples of procedures include how to administer blood, insert tubes (nasogastric, urinary catheters), medication administration (oral, rectal, intravenous), administration of tube feedings, suctioning, and wound care.
The following explanation is an example of the kinds of decisions that need to be made in developing standards:
Administrative policies might address the following:
■ Who can perform a cesarean section? The administrative officers will need to decide the qualifications for performing the procedure, e.g., can all physicians perform the procedure or only obstetricians?
■ Where can cesarean sections be performed? Decisions need to be made regarding the use of general surgical suites for this purpose or
■ Is this service available to all women requiring a cesarean section? This decision would be based on the level of service available at the
resources (trained personnel and equipment) are available to manage high-risk cases.
physicians credentialled in surgical procedures, both general surgeons and obstetricians. An operating room within the general surgery will be designated and equipped for the management of cesarean sections. Patients who require invasive monitoring or intensive care management will be referred and transported immediately to X Regional Hospital and accompanied by a physician.”
The team in this example obtained clinical practice guidelines (wwwregarding “Practice guidelines for obstetrical anesthesia”; “Prevention, diagnosis, and treatment of failure to progress in obstetric labor”; and “Elective repeat cesarean section.” The guidelines were communicated with the medical staff and used to guide medical practice.
The medical staff also developed a set of standing orders regarding the emergency management of pre-eclampsia, eclampsia, and fetal distress. The orders included such items as interventions for treating convulsions.
A multidisciplinary team discussed the need for standards regarding the normal postoperative care and management as well as management of complications. They discussed the idea of implementing clinical pathways. They decided to develop a clinical pathway for the normal postoperative care and management. They further decided to develop algorithms for the emergency management of pre-eclampsia, eclampsia, and fetal distress. The algorithms provided a quick visual diagram of how to treat the patient based on the presenting signs and symptoms. These algorithms were posted on the walls of the consultation rooms.
The team decided to develop protocols for prevention and management of phlebitis and a protocol for patient and family education. In addition, various procedures were deemed important including intravenous catheter insertion, urinary catheter insertion, and fetal monitoring.
team will want to review their needs and the options before deciding which format best serves their needs.
E X A M P L E
35
whether there will be a dedicated obstetrical surgery.
facility. The administrative officers will determine whether the
A sample might look like: “Cesarean sections may be performed by
.guidelines.gov) from the National Guideline Clearinghouse
Consequently, there is no single “best” way to develop standards; the
QAP Health Manager’s Guide

Protocols Protocols define patient care management for specific situations or conditions. Protocols may be written for the care of patients who have indwelling tubes (nasogastric, urinary catheter). Thus, the procedure would describe how to insert the tube and the protocol would describe how to care for the patient with a tube in place.
Pegg
y Ko
niz-
Booh
er
Standards might include how often to assess the patient, what to assess, and what types of treatments are needed. Protocols may also be written for patient categories, e.g., maternity care. Protocols would outline prenatal care, postpartum care, as well as emergency care such as pre-eclampsia or premature labor.
Standing orders Standing orders are a set of physician orders pre-established and approved to allow nurses or other professionals to initiate medical treatment in the absence of the physician. These orders may be specific to a singular physician or may be orders approved by the hospital medical staff. In the critical care unit; for instance, a physician may develop a set of “standing orders” for postoperative open-heart surgery patients. In this way, the physician does not need to rewrite the orders for each patient. This set of orders then can be modified to meet each patient’s specific needs. On the other hand, standing orders approved by the medical staff for the critical care unit is a list of orders to manage emergency situations. Usually the orders include drugs or treatment (e.g., defibrillation) to be administered under circumstances such as cardiac arrhythmia.
Monitoring the Quality of 36 Hospital Care

Appendix 2: Infection Control Administrative Policies
Patient care, supply, and Personnel illness equipment
■ Employee health services are available
Patient care considerations for personnel who become ill or are injured while on duty.
Hand washing (1) Most services at the employee
■ Good hand washing is essential to health clinic substation are
safe, effective, nursing care rendered free of charge to the
(see “Hand washing Procedures, Routine employee.
and Scrub’’). (a) The substation provides primary
■ Hand washing facilities (sink, soap and dispensers, and disposable towels) are available in each patient room and/or patient care area.
healthcare for work-related illnesses and injuries to working employees requiring first aid or health counseling.
■ Each patient care unit has a specific (b) Illness or injury of a severe
written hand washing routine. nature is treated by the hospital emergency department.
Housekeeping (2) Admission to the employee health
■ Housekeeping services are available in clinic substation requires that an
each patient care area. employee present a pr operly signed (by supervisor or department head)
■ Floors are vacuumed/mopped daily with referral slip to the receptionist in a germacidal solution (quaternary the lobby of the hospital substation. ammonium cpd).
■ Employees exposed to or contracting an ■ All patient rooms are damp-dusted daily infectious disease are referred to
using a germicidal solution. employee health services.
■ Spills are cleaned up immediately. ■ In high-risk patient areas, special
■ Medication carts and storage areas are cleaned as needed with a germicidal detergent.
precautions are taken to protect both patients and personnel when an infectious condition exists (see unit policy and procedures).
■ Nursing shares the responsibility for maintaining a clean, safe, patient (1) Patients with communicable
environment. diseases are placed on appropriate isolation precautions (see isolation
Visitors procedure manual).
■ To promote the comfort and well being of patients, visitors should keep visits short; a limit of two visitors per patient
(2) Isolation rooms (one per unit) are available in some areas.
(3) Isolation supply carts are availableshould be imposed. from Materials Management to
■ Visitors must be at least 12 years old, with exceptions for acute-care areas and psychiatric units (see specific unit
facilitate patient care. Isolation supplies are available through the computer system.
policy). (4) The patient’s physician is respon
■ Visitors showing obvious signs of illness sible for ordering isolation
are asked not to visit.
QAP Health Manager’s Guide 37
precautions, but it is a nursing responsibility to inform the physician when an infection is suspected.
(5) If the physician does not initiate isolation precautions when indicated, the nursing supervisor should be notified.
(6) It is the responsibility of the nurse manager or his or her designee to ensure that all personnel follow appropriate procedures and that patients and visitors are properly instructed.
(7) Infectious patients transported from their rooms to another department should follow proper protective precautions.
(8) Red labels indicating “blood/body fluid precautions designate infectious patients” and the top line of the addressograph information indicates “B/BF PREC.”
Supply and equipment considerations
Use of Transport Stretchers and Wheelchairs
■ Use clean linen for each patient.
■ When stretchers/wheelchairs become contaminated (e.g., with drainage), clean the area thoroughly with detergent germicide before replacing clean linen.
■ Schedule routine cleaning of wheelchairs and stretchers with the appropriate department (Environmental Services, carpenter shop for caster change and oiling).
Use of Sterile Irrigation Solutions (Solutions for External Use)
■ When a sterile irrigation solution container is opened, note the time and date on the container. Never assume sterility of an opened container.
■ Single patient use is recommended.
■ If the irrigation solution is used for multiple patients, do not take the container into a patient’s room. Sterile solution bowls are used to transfer solutions from the container to the patient’s bedside. Use extreme caution in transferring solutions to avoid cross-contamination.
■ At no time is it acceptable to withdraw sterile irrigating solutions straight from the container to the patient’s bedside. This results in contamination of the entire solution and encourages the growth of organisms.
■ Use open sterile solutions within an eight- to twelve-hour shift. Discard any remaining solutions.
■ Change sterile solutions used for tracheotomy care each shift.
■ Cover sterile solution bowls remaining at the bedside adequately to prevent possible contamination during a shift. If there is a question of sterility, discard the entire contents and replace with a sterile bowl and solution.
■ Dextrose solutions support the growth of organisms; therefore, change these solutions every 24 hours.
Preparation of Equipment from Isolation Rooms
■ Portable, reusable equipment (hypothermia units, suction regulators, etc.) that has been used in a patient’s room and needs to be returned to Sterile Process-ing/Materials Management should be inspected by the nursing staff. If the equipment is visibly contaminated with blood, sputum, or other body fluids, it should be wiped off with a disinfectant solution by the nursing staff before being sent for repairs or reprocessing.
■ Portable, reusable equipment that has been used in the room of a patient who has been on isolation for an infectious disease should be handled similarly; i.e., the equipment should be wiped off with an appropriate disinfectant solution by the nursing staff if it is visibly contaminated.
Monitoring the Quality of 38 Hospital Care

(1) In addition, equipment from isolation rooms should be bagged in the “contaminated items” bags before being sent for reprocessing.
(2) Items too large to be bagged may simply be covered as much as possible by a “contaminated items” bag after inspection and/or cleaning has been performed by the nursing staff.
■ By removing body fluid contamination before the equipment is removed from a patient’s room, the chance for spreading pathogenic organisms throughout the hospital environment will be reduced. Also, by bagging equipment from isolation rooms, the staff in sterile processing will be alerted to the use of the equipment in isolation areas and will institute proper cleaning protocols.
Note: This policy does not apply to equipment used for invasive procedures on patients (endoscopes, biopsy needles, etc.).
Reusable Patient Care Items/Equipment
■ Wipe all multiple reusable patient care items (stethoscopes, otoscopes, reflex hammers, etc.) clean after each patient use with alcohol or detergent germicide.
■ Empty suction bottles every eight hours unless ordered otherwise, and clean the bottles with detergent germicide every 24 hours. Return suction canisters and regulators to Materials Management for resterilization between patients only when they are contaminated or the patient is on isolation.
■ Clean medication carts as necessary with detergent germicide.
■ Remove all medications from unit storage shelves at least every three months and clean the compartments with detergent germicide.
Linen
■ Store clean linen in a clean, enclosed storage area and keep it separate from soiled linen.
■ Once linen is taken into a patient’s room, do not return it to the clean linen closet.
■ Discard in the soiled linen hamper clean linen that is dropped on the floor.
■ Do not take soiled linen hampers into a patient’s room.
■ Carry soiled linen away from the body to avoid personnel- and cross-contamination.
■ Change linen after each patient use.
■ Fold linen inward as it is removed from the bed.
■ Cover pillows with antibacterial and waterproof covering and clean the covering with germicidal solution between each patient.
Needles and Syringes
■ Deposit used needles in appropriate containers.
■ Discard syringes in appropriate containers.
■ When the syringe and needle disposal container is full, place it in the soiled holding/utility room. The plastic containers will be picked up by waste management personnel for disposal.
Disposal of Supplies from Isolation Rooms
■ All supplies that are wrapped are not considered a source of contamination and should not be discarded.
■ All open disposable supplies that are used for direct patient care and all supplies that have been unwrapped should be discarded routinely.
■ Only the necessary supplies should be stocked in isolation rooms.
■ Follow nursing procedures for disinfection or sterilization of patient care equipment.
QAP Health Manager’s Guide 39

Appendix 3: Pharmacy Department: Medication Errors
Administrative Policy Pharmacy Department
Errors: Medication
Effective date: 5/1995 Policy No: E-06 Review date: 5/1997, 6/1999, 5/2000 Page 1 of 2 Revised: 5/2000
Purpose To define a system for identifying, reporting, classifying, reviewing, and preventing medication errors (i.e., errors of prescribing, interpreting, dispensing, and administration).
Policy It is the responsibility of all healthcare providers in the clinical setting to detect and to report medication errors for review by the pharmacy committee.
Definitions A medication error is any preventable event that may cause or lead to inappropriate medication use or patient harm while the medication is in the control of the healthcare professional, patient, or consumer. Such events may be related to professional practice, healthcare products, procedures, and systems, including prescribing: order communication; product labeling, packaging, and nomenclature; compounding; dispensing; distribution; administration; and education monitoring or use.
Specific types of medication errors are classified as: 1. Prescribing error: inappropriate drug
selection (based on indications, contraindications, known allergies, existing drug therapy, and other factors) dose, dosage form, quantity, route, concentration, rate of administration, or instructions for use of a drug product ordered by a authorized prescriber.
2. Omission: the failure to administer an ordered dose to a patient. Excluded would be (1) a patient’s refusal to take the medication, or (2) a decision not to administer the dose because of recognized contraindications.
3. Wrong time: the failure to administer a medication dose within a pre-defined interval (i.e., one hour) from its scheduled administration time, unless the patient is undergoing a treatment or procedure that alters the administration time.
4. Unauthorized drug/wrong drug: the administration of a dose of medication not authorized to be given to the patient. For example, a patient received IV Lidocaine instead of a 5 percent dextrose solution. Instances of “brand or therapeutic interchange” are not counted as unauthorized drug errors except where prohibited by institutional policy.
5. Wrong dose: administration of a dose that is greater than or less than the amount ordered by the prescriber or administration of duplicate doses to the patient, i.e., one or more dosage units in addition to those that were ordered.
6. Wrong dosage form: administration of a drug product in a different dosage form than was ordered by the prescriber. An example is the administration of the intramuscular formulation of an injectable agent (by the intramuscular
Monitoring the Quality of 40 Hospital Care
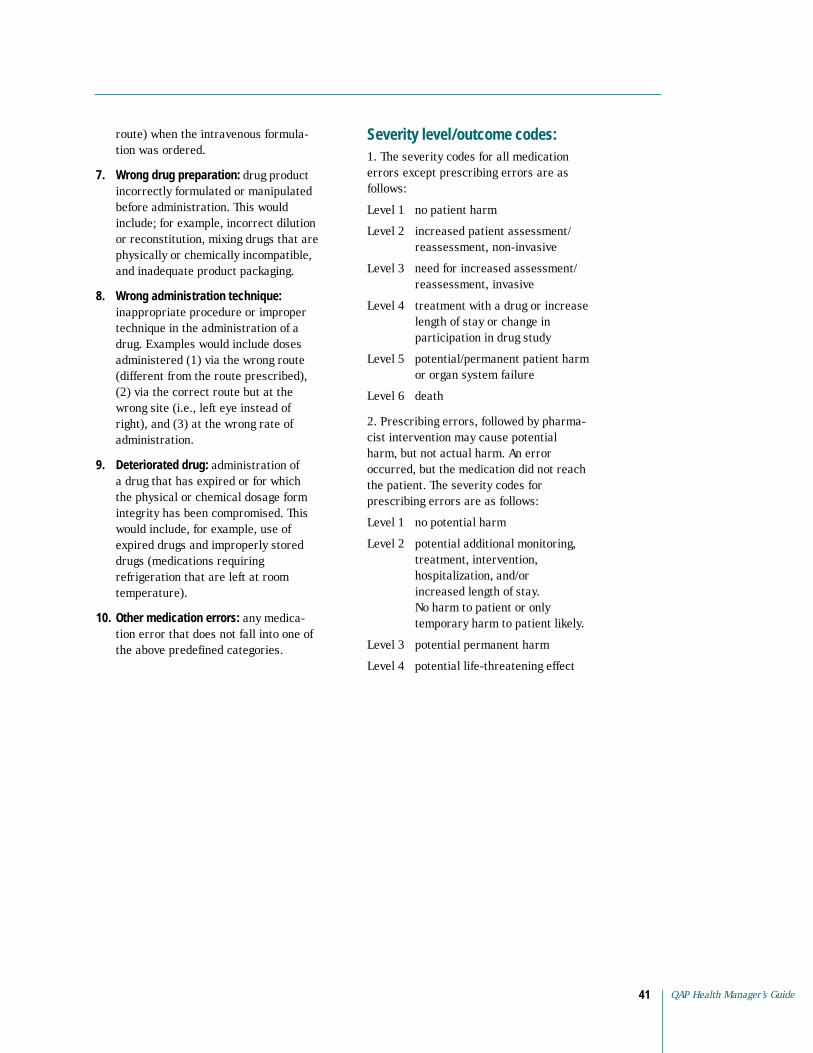
route) when the intravenous formulation was ordered.
7. Wrong drug preparation: drug product incorrectly formulated or manipulated before administration. This would include; for example, incorrect dilution or reconstitution, mixing drugs that are physically or chemically incompatible, and inadequate product packaging.
8. Wrong administration technique: inappropriate procedure or improper technique in the administration of a drug. Examples would include doses administered (1) via the wrong route (different from the route prescribed), (2) via the correct route but at thewrong site (i.e., left eye instead of right), and (3) at the wrong rate of administration.
9. Deteriorated drug: administration of a drug that has expired or for which the physical or chemical dosage form integrity has been compromised. This would include, for example, use of expired drugs and improperly stored drugs (medications requiring refrigeration that are left at room temperature).
10. Other medication errors: any medication error that does not fall into one of the above predefined categories.
Severity level/outcome codes: 1. The severity codes for all medicationerrors except prescribing errors are as follows:
Level 1 no patient harm
Level 2 increased patient assessment/ reassessment, non-invasive
Level 3 need for increased assessment/ reassessment, invasive
Level 4 treatment with a drug or increase length of stay or change in participation in drug study
Level 5 potential/permanent patient harm or organ system failure
Level 6 death
2. Prescribing errors, followed by pharma-cist intervention may cause potential harm, but not actual harm. An error occurred, but the medication did not reach the patient. The severity codes for prescribing errors are as follows:
Level 1 no potential harm
Level 2 potential additional monitoring, treatment, intervention, hospitalization, and/or increased length of stay. No harm to patient or only temporary harm to patient likely.
Level 3 potential permanent harm
Level 4 potential life-threatening effect
QAP Health Manager’s Guide 41

Appendix 4: Standing Operating Procedure: Medication Errors
Pharmacy Department Standing Operating Procedure: Medication Errors
1. When a medication error occurs, the person discovering the error will:
a) Notify the prescribing physician immediately
b) Complete a medication occurrence report
c) Have the unit manager and director sign the report
d) Document in the patient’s chart all medications given to the patient
e) If an explanation for an omission is apparent (e.g., patient was away from the nursing unit for tests) that reason should be documented in the record
f ) Notify the pharmacist if the error involves the pharmacy
2. All medication errors and potential errors are trended and reported to the pharmacy committee quarterly. All reported serious medication errors (by definition) will be summarized and reviewed by the pharmacy committee. The report will include the severity level/outcome classifications.
3. The manager of the area where the medication error occurred will determine the appropriate follow-up actions required based on the seriousness of the errors and document the action plan. (The intent of the action plan is for education rather than punishment.)
4. In case of a serious prescribing error, the chairman of the pharmacy committee will consult with the chairman of the medical department of the physician involved.
Monitoring the Quality of 42 Hospital Care
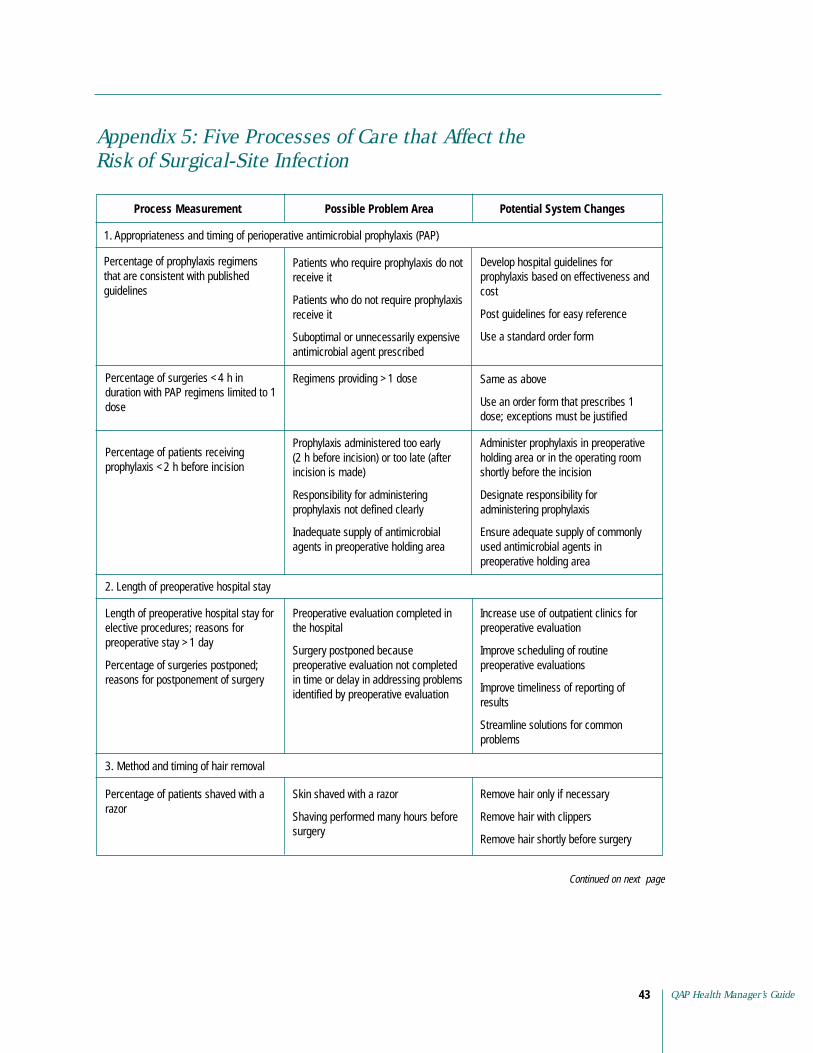
Appendix 5: Five Processes of Care that Affect the Risk of Surgical-Site Infection
Process Measurement Possible Problem Area Potential System Changes
1. Appropriateness and timing of perioperative antimicrobial prophylaxis (PAP)
Percentage of prophylaxis regimens that are consistent with published guidelines
Patients who require prophylaxis do not receive it
Patients who do not require prophylaxis receive it
Develop hospital guidelines for prophylaxis based on effectiveness and cost
Post guidelines for easy reference
Suboptimal or unnecessarily expensive Use a standard order form antimicrobial agent prescribed
Percentage of surgeries <4 h in duration with PAP regimens limited to 1 dose
Regimens providing >1 dose Same as above
Use an order form that prescribes 1 dose; exceptions must be justified
Percentage of patients receiving prophylaxis <2 h before incision
Prophylaxis administered too early (2 h before incision) or too late (after incision is made)
Responsibility for administering prophylaxis not defined clearly
Inadequate supply of antimicrobial agents in preoperative holding area
Administer prophylaxis in preoperative holding area or in the operating room shortly before the incision
Designate responsibility for administering prophylaxis
Ensure adequate supply of commonly used antimicrobial agents in preoperative holding area
2. Length of preoperative hospital stay
Length of preoperative hospital stay for elective procedures; reasons for preoperative stay >1 day
Percentage of surgeries postponed; reasons for postponement of surgery
Preoperative evaluation completed in the hospital
Surgery postponed because preoperative evaluation not completed in time or delay in addressing problems identified by preoperative evaluation
Increase use of outpatient clinics for preoperative evaluation
Improve scheduling of routine preoperative evaluations
Improve timeliness of reporting of results
Streamline solutions for common problems
3. Method and timing of hair removal
Percentage of patients shaved with a Skin shaved with a razor Remove hair only if necessary razor
Shaving performed many hours before Remove hair with clippers surgery
Remove hair shortly before surgery
Continued on next page
QAP Health Manager’s Guide 43
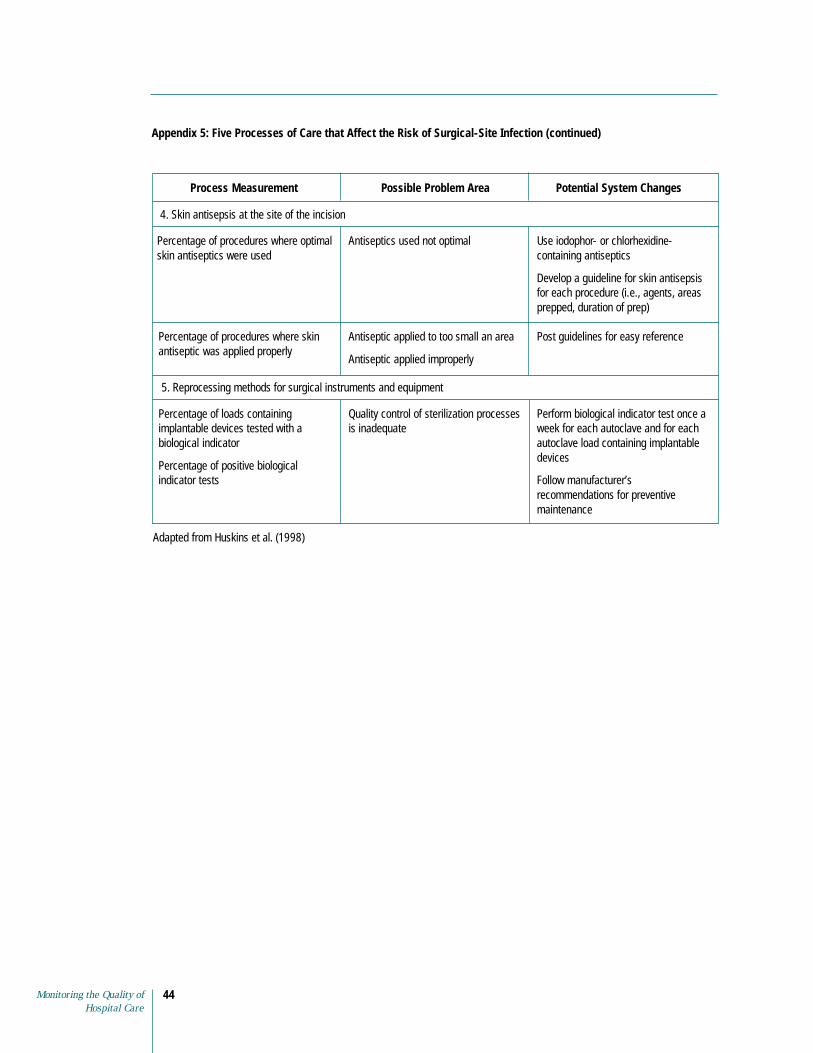
Appendix 5: Five Processes of Care that Affect the Risk of Surgical-Site Infection (continued)
Process Measurement Possible Problem Area Potential System Changes
4. Skin antisepsis at the site of the incision
Percentage of procedures where optimal skin antiseptics were used
Antiseptics used not optimal Use iodophor- or chlorhexidinecontaining antiseptics
Develop a guideline for skin antisepsis for each procedure (i.e., agents, areas prepped, duration of prep)
Percentage of procedures where skin antiseptic was applied properly
Antiseptic applied to too small an area
Antiseptic applied improperly
Post guidelines for easy reference
5. Reprocessing methods for surgical instruments and equipment
Percentage of loads containing implantable devices tested with a biological indicator
Percentage of positive biological indicator tests
Quality control of sterilization processes is inadequate
Perform biological indicator test once a week for each autoclave and for each autoclave load containing implantable devices
Follow manufacturer’s recommendations for preventive maintenance
Adapted from Huskins et al. (1998)
Monitoring the Quality of 44 Hospital Care

Appendix 6: Routine Hand Washing Procedure
Purpose: To prevent the spread of communicable, potentially pathogenic, organisms within the hospital environment.
General Information: ■ Wash hands before and after any direct and indirect patient contact
■ Wash hands before and after performing any personal body functions for self or patient (includes eating, blowing or wiping nose, using the bathroom, and combing hair)
■ Wash hands before preparing or serving food or medications
■ Wash hands after handling waste material, secretions, drainage, or other body fluids
■ Wash hands after arrival at the hospital and before going home
Procedure
Action Key Points
1. Turn on the faucet and adjust the flow of the Warm water will not dry out skin water temperature as hot water does
2. Wet hands to the wrists
3. Apply soap to hands
4. Rub hands together, using friction
5. Wash between fingers and around nails
6. Rinse hands thoroughly under running water
7. Turn off the faucet, using the towel Avoid recontamination
8. Discard the towel. Do not use soiled towel. If paper towels or individual towels are not available, allow the hands to air dry
QAP Health Manager’s Guide 45
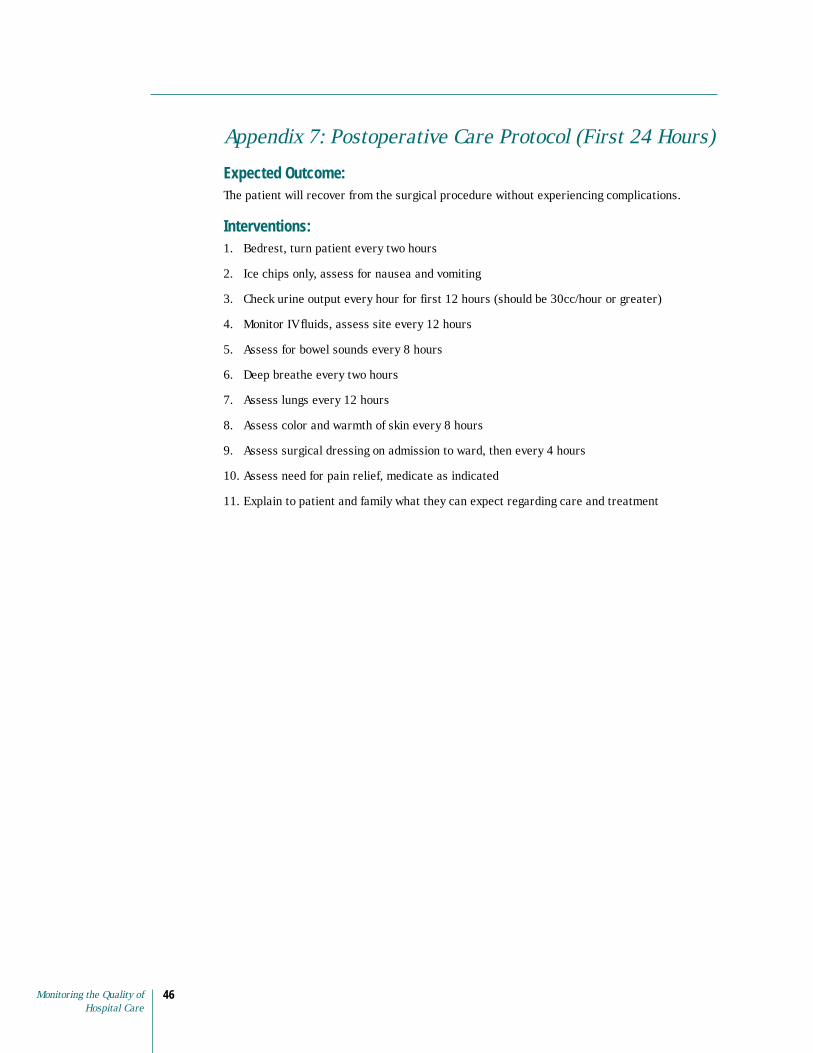
Appendix 7: Postoperative Care Protocol (First 24 Hours)
Expected Outcome: The patient will recover from the surgical procedure without experiencing complications.
Interventions: 1. Bedrest, turn patient every two hours
2. Ice chips only, assess for nausea and vomiting
3. Check urine output every hour for first 12 hours (should be 30cc/hour or greater)
4. Monitor IV fluids, assess site every 12 hours
5. Assess for bowel sounds every 8 hours
6. Deep breathe every two hours
7. Assess lungs every 12 hours
8. Assess color and warmth of skin every 8 hours
9. Assess surgical dressing on admission to ward, then every 4 hours
10. Assess need for pain relief, medicate as indicated
11. Explain to patient and family what they can expect regarding care and treatment
Monitoring the Quality of 46 Hospital Care
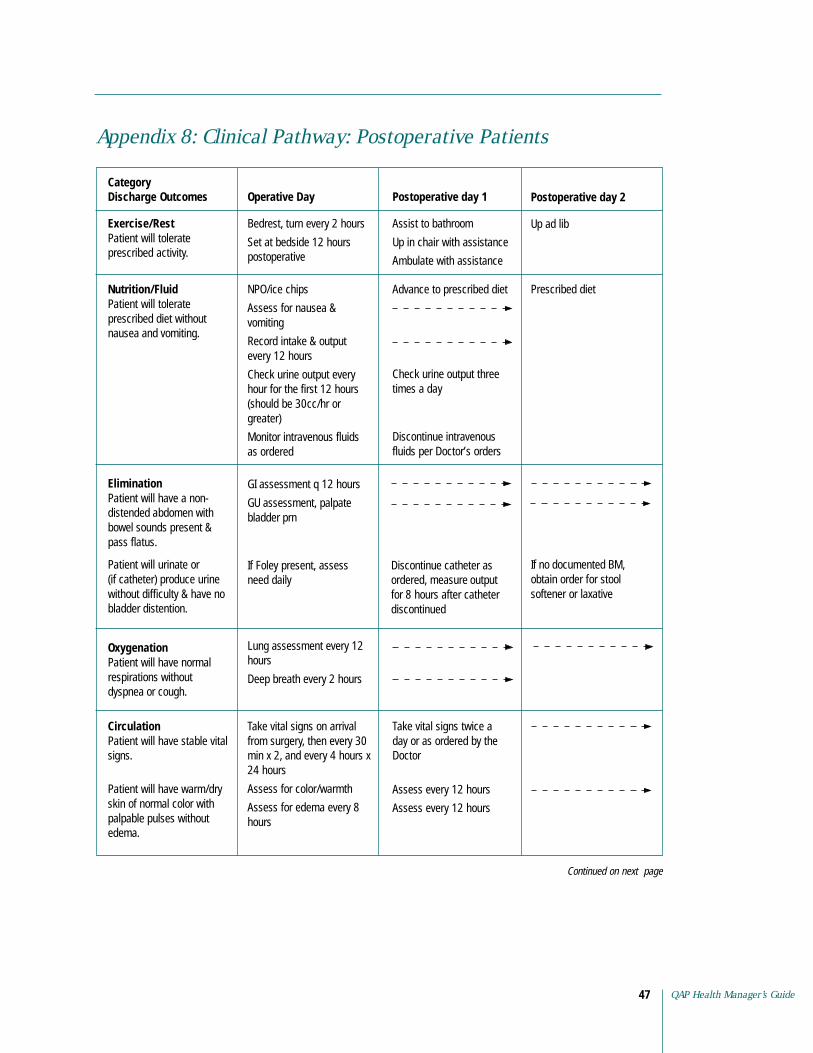
Appendix 8: Clinical Pathway: Postoperative Patients
Category Discharge Outcomes Operative Day Postoperative day 1 Postoperative day 2
Exercise/Rest Patient will tolerate prescribed activity.
Bedrest, turn every 2 hours
Set at bedside 12 hours postoperative
Assist to bathroom
Up in chair with assistance
Ambulate with assistance
Up ad lib
Nutrition/Fluid Patient will tolerate prescribed diet without nausea and vomiting.
NPO/ice chips
Assess for nausea & vomiting
Record intake & output
Advance to prescribed diet Prescribed diet
every 12 hours
Check urine output every Check urine output three hour for the first 12 hours times a day (should be 30cc/hr or greater)
Monitor intravenous fluids Discontinue intravenous as ordered fluids per Doctor’s orders
Elimination Patient will have a non-distended abdomen with bowel sounds present &
GI assessment q 12 hours
GU assessment, palpate bladder prn
pass flatus.
Patient will urinate or If Foley present, assess Discontinue catheter as If no documented BM, (if catheter) produce urine need daily ordered, measure output obtain order for stool without difficulty & have no for 8 hours after catheter softener or laxative bladder distention. discontinued
Oxygenation Lung assessment every 12 Patient will have normal hours respirations without Deep breath every 2 hours dyspnea or cough.
Circulation Take vital signs on arrival Take vital signs twice a Patient will have stable vital from surgery, then every 30 day or as ordered by the signs. min x 2, and every 4 hours x Doctor
24 hours
Patient will have warm/dry skin of normal color with palpable pulses without edema.
Assess for color/warmth
Assess for edema every 8 hours
Assess every 12 hours
Assess every 12 hours
Continued on next page
QAP Health Manager’s Guide 47

Appendix 8: Clinical Pathway: Postoperative Patients (continued)
Category Discharge Outcomes Operative Day Postoperative day 1 Postoperative day 2
Skin Integrity/ Assess surgical dressing on Assess incision every 12 Remove staples as ordered Infection Control admission to the ward from hours Patient’s incision site(s) will be well approximated without redness, pain,
surgery then, every 4 hours x 2, then prn Remove dressings as
ordered by Doctor
drainage & swelling.
Patient’s skin will have no breakdown.
Patient’s intravenous sites are free of redness, hematoma, pain, drainage, or swelling.
Assess skin integrity
Pressure ulcer prevention protocol as indicated
Assess intravenous site every 12 hrs and prn
Discontinue intravenous fluids as ordered by Doctor
Pain Management Assess need for analgesia Patient will verbalize/ indicate comfort.
Discharge Plan/ Inform patient and family Instruct patient and family Give patient and family Education about what they can expect on plan of care including: written instructions if Patient/family will demonstrate understanding and mutually agree with plan of care and discharge instructions.
regarding care and treatment
Management of pain
Management of wound
Signs of infection
Medications
appropriate
Provide patient/family with any additional follow-up care instructions
When to seek additional care or treatment
Each healthcare worker who makes an assessment or provides care needs to date and sign this form on the appropriate day.
Date Time Signature
Date Time
Date Time Signature
Date Time
Date Time Signature
Date Time
Signature
Date Time Signature
Signature
Date Time Signature
Signature
Date Time Signature
Note: This clinical pathway to be used to help guide care and may change by physician orders and/or nursing judgment.
Monitoring the Quality of 48 Hospital Care
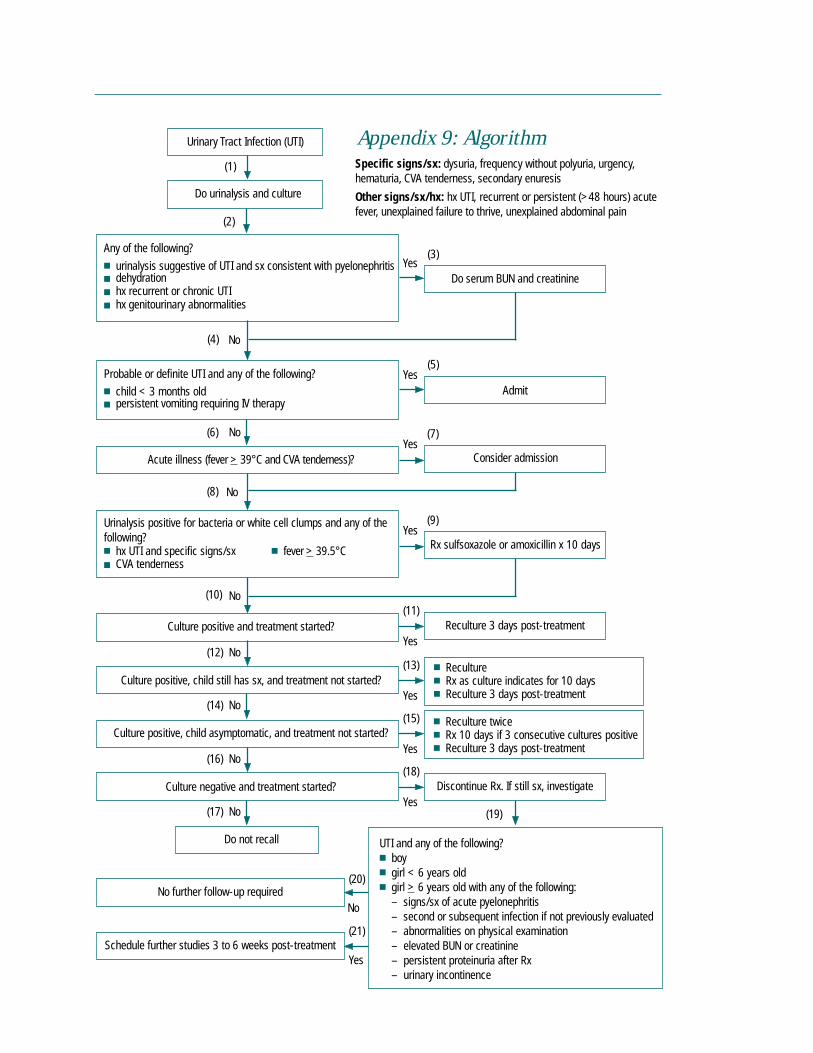
QAP Health Manager’s Guide49
Urinary Tract Infection (UTI) Appendix 9: Algorithm Specific signs/sx: dysuria, frequency without polyuria, urgency,
Do urinalysis and culture hematuria, CVA tenderness, secondary enuresis
Other signs/sx/hx: hx UTI, recurrent or persistent (>48 hours) acute fever, unexplained failure to thrive, unexplained abdominal pain
(1)
■
■
■ hx recurrent or chronic UTI ■
(2)
(3)Any of the following?
urinalysis suggestive of UTI and sx consistent with pyelonephritis dehydration
hx genitourinary abnormalities
Yes Do serum BUN and creatinine
(4) No
■ child < 3 months old ■
(5)
Admit Probable or definite UTI and any of the following?
persistent vomiting requiring IV therapy
Yes
(6) (7)
Consider admission
No
Acute illness (fever > 39°C and CVA tenderness)? Yes
(8) No
following? ■ hx UTI and specific signs/sx ■ fever > 39.5°C ■
(9)Urinalysis positive for bacteria or white cell clumps and any of the
CVA tenderness
Yes Rx sulfsoxazole or amoxicillin x 10 days
(10) No (11)
Culture positive and treatment started? Reculture 3 days post-treatment Yes
(12) No (13)
Yes
Culture negative and treatment started?
■ Reculture ■
■
■ Reculture twice ■ Rx 10 days if 3 consecutive cultures positive ■
Rx as culture indicates for 10 days Reculture 3 days post-treatment
Reculture 3 days post-treatment
Discontinue Rx. If still sx, investigate
Culture positive, child still has sx, and treatment not started?
(14) No (15)
Yes Culture positive, child asymptomatic, and treatment not started?
(16) No (18)
Yes
Do not recall
■ boy ■ girl < 6 years old ■ girl
– – second or subsequent infection if not previously evaluated – – elevated BUN or creatinine – persistent proteinuria after Rx –
(19)
(20)
No
(21)
(17) No
UTI and any of the following?
> 6 years old with any of the following: signs/sx of acute pyelonephritis
abnormalities on physical examination
urinary incontinence Yes
No further follow-up required
Schedule further studies 3 to 6 weeks post-treatment

Glossary Administrative policy: A statement of expectation written by the management of institutions designed to influence and determine decisions and actions.
Algorithm: Recommended patient management strategies designed to direct decision-making such as a structured flowchart, decision tree, or decision grid. Often algorithms are used in areas in which rapid decision-making is required, e.g., emergency department.
Clinical pathways: Patient care management tools that organize, sequence, and time the major interventions of nursing staff, physicians, and other departments for a particular case type (e.g, normal delivery), subset (e.g., hysterectomy), or condition (e.g., failure to wean) (Zander 1997). Synonyms: critical path, care map.
Clinical practice guidelines: A set of systematically developed statements, usually based on scientific evidence, to assist practitioners and patient decision-making about appropriate healthcare for specific clinical circumstances (Field and Lohr 1992) Synonyms: practice guidelines, guidelines, practice parameters.
Inputs: The resources required by an organization to provide a service. Inputs required in healthcare are usually financial, physical structures such as buildings, supplies and equipment, personnel, and more importantly, clients. Synonym: structure standards.
Job description: A document outlining the roles and responsibilities of a particular position. The purpose of the position and the qualifications required are typically included.
Norms: A term used in some countries as a synonym for standards.
Outcome: Results of a process including outputs, effects and impacts.
Health outcomes: The effect from performance (or nonperformance) of one or more processes or activities carried out by healthcare providers. For instance, the effect of the healthcare process on community health status such as nutritional status, patient satisfaction, and mortality rates.
Procedure: Step-by-step instructions on how to perform a task based on technical and theoretical knowledge (Marker 1988).
Process: A series of related activities and tasks that transform the inputs (resources) to produce a desired product or outcome.
Protocol: A plan, or set of steps, to be followed in a study, an investigation, or an intervention, as in the management of a specific patient condition (e.g., care of a patient with diarrhea).
Qualifications: Characteristics—such as education, background, and experience—that a person brings to a specific position or task.
Rules and regulations: A set of one or more statements or directions that specify decisions and actions that must always be followed, and if not followed, a penalty for failure to observe often is enacted.
Specifications: An explicit statement of the required characteristics for an input used in the healthcare system. The requirements are usually related to supplies, equipment, and physical structures used in the delivery of health services.
Standard: A statement of expected quality.
Standing operating procedures: Management processes that describe chronological steps to follow and decisions to make in carrying out a task or function. Synonym: management procedure.
Standing orders: Physician orders pre-established and approved for use by nurses and other professionals under specific conditions in the absence of a physician.
Monitoring the Quality of 50 Hospital Care
References Classen, D.C., R.S. Evans, S.I. Pestotnik, S. D. Horn, R.L. Menlove, and J.P. Burke. 1992. The
timing of prophylactic administration of antibiotics and the risk of surgical-wound infections. New England Journal of Medicine (326)5:281–86.
Cousins, D.D. 1998. Medication use: A systems approach to reducing errors. Joint Commission on Accreditation of Healthcare Organizations.
Field, M.J., and K.N. Lohr. 1992. Clinical practice guidelines: Directions for a new program. Washington, DC: National Academy Press.
Huskins, W.C., B.M. Soule, C. O’Boyle, L. Gulácsi, E.J. O’Rourke, and D.A. Goldmann. 1998. Hospital infection prevention and control: A model of improving the quality of hospital care in low- and middle-income countries. Infection Control and Hospital Epidemiology (19):125–35.
Huskins, W.C., E.J. O’Rourke, E. Rhinehart, and D.A. Goldmann. 1999. Infection control in countries with limited resources. Hospital Epidemiology and Infection Control in Special Circumstances 1176–1200.
Kramer, J., and P. Shafer. 2000. Monitoring steam sterilization practices in primary care settings, Journal of Healthcare Quality (22):3:4–8.
Lee, T.B., O.G. Baker, J.T. Lee, W.E. Scheckler, L. Steele, and C.E. Laxton. 1998. Recommended practices for surveillance. American Journal of Infection Control (26):277–88.
Marker, C.S. 1988. The Marker model for standards development. Severna Park, MD: Marker Systems, Inc.
U.S. Department of Health and Human Services. 1998. National Nosocomial InfectionsSurveillance (NNIS) system report, data summary from October 1986 to April 1998. American Journal of Infection Control (26):522–33.
Zander, K. Use of variance from clinical pathways: Coming of age. Clinical Performance and Quality Health Care 5(1):20–30.
QAP Health Manager’s Guide 51
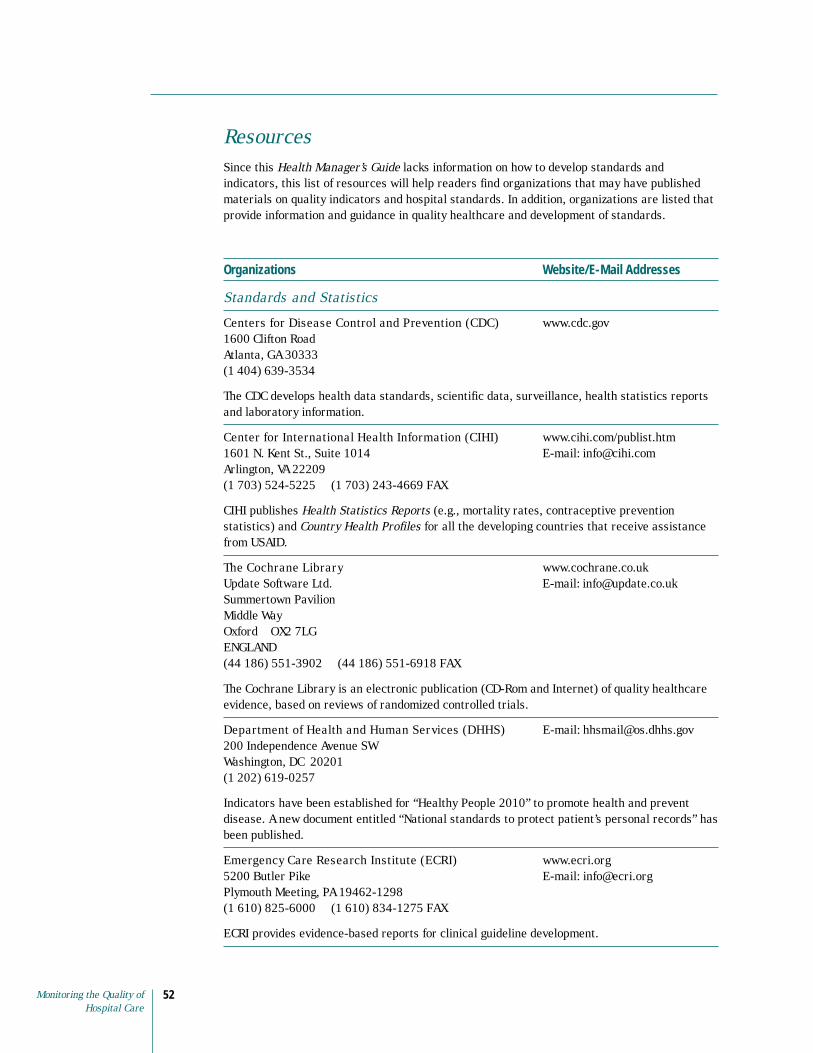
Resources Since this Health Manager’s Guide lacks information on how to develop standards and indicators, this list of resources will help readers find organizations that may have published materials on quality indicators and hospital standards. In addition, organizations are listed that provide information and guidance in quality healthcare and development of standards.
Organizations Website/E-Mail Addresses
Standards and Statistics
Centers for Disease Control and Prevention (CDC) www.cdc.gov 1600 Clifton Road Atlanta, GA 30333 (1 404) 639-3534
The CDC develops health data standards, scientific data, surveillance, health statistics reports and laboratory information.
Center for International Health Information (CIHI) www.cihi.com/publist.htm 1601 N. Kent St., Suite 1014 E-mail: [email protected] Arlington, VA 22209 (1 703) 524-5225 (1 703) 243-4669 FAX
CIHI publishes Health Statistics Reports (e.g., mortality rates, contraceptive prevention statistics) and Country Health Profiles for all the developing countries that receive assistance from USAID.
The Cochrane Library www.cochrane.co.uk Update Software Ltd. E-mail: [email protected] Summertown Pavilion Middle Way Oxford OX2 7LG ENGLAND (44 186) 551-3902 (44 186) 551-6918 FAX
The Cochrane Library is an electronic publication (CD-Rom and Internet) of quality healthcare evidence, based on reviews of randomized controlled trials.
Department of Health and Human Services (DHHS) E-mail: [email protected] 200 Independence Avenue SW Washington, DC 20201 (1 202) 619-0257
Indicators have been established for “Healthy People 2010” to promote health and prevent disease. A new document entitled “National standards to protect patient’s personal records” has been published.
Emergency Care Research Institute (ECRI) www.ecri.org 5200 Butler Pike E-mail: [email protected] Plymouth Meeting, PA 19462-1298 (1 610) 825-6000 (1 610) 834-1275 FAX
ECRI provides evidence-based reports for clinical guideline development.
Monitoring the Quality of 52 Hospital Care
Organizations Website/E-Mail Addresses
EngenderHealth www.engenderhealth.org 440 Ninth Avenue E-mail: [email protected] New York, NY 10001 (1 212) 561-8000 (1 212) 561-8067 FAX
EngenderHealth focuses on reproductive health and formulates medical and surgical guidelines related to contraception, pregnancy, infections, and diseases.
Family Health International (FHI) www.fhi.org P.O. Box 13950 E-mail: [email protected] Research Triangle Park, NC 27709 (1 919) 544-7040 (1 919) 544-7261 FAX
HIV/AIDS Department 2101 Wilson Boulevard, #700 Arlington, VA 22201 (1 703) 516-9779 (1 703) 516-9781
FHI focuses on research, education, and services in family planning, HIV/AIDs and sexually transmitted diseases prevention and care.
HIV/AIDS Treatment and Information Service www.hivatis.org P.O. Box 6303 E-mail: [email protected] Rockville, MD 20849-6303 (1 301) 519-0459 (1 301) 519-6616 FAX
The Treatment Guidelines Library includes federally approved guidelines regarding HIV and AIDS.
International Organization for Standardization www.iso.ch ISO Central Secretariat E-mail: [email protected] 1 rue de Varembre, Case postal 56 CH-1211 Geneva 20 SWITZERLAND (41 22) 749-0111 (41 22) 733-3430 FAX
The International Organization for Standardization promotes the development of standardization such as ISO 9000 international standards for quality management. A catalog of standards can be accessed through the website.
International Planned Parenthood Federation www.ippf.org Public Affairs Department E-mail: [email protected] Regent’s College, Inner Circle Regent’s Park, London NW1 4NS ENGLAND (44 207) 487-7900 (44 207) 487-7950 FAX
IPPF sets standards for contraceptive safety, program management, service provision, and gender equity.
QAP Health Manager’s Guide 53
Organizations Website/E-Mail Addresses
INTRAH www.intrah.org University of North Carolina at Chapel Hill E-mail: [email protected] School of Medicine 1700 Airport Road #300 Chapel Hill, NC 27599-8100 (1 919) 966-5636 (1 919) 962-7178 FAX
INTRAH has developed guidelines for clinical procedures in family planning.
JHPIEGO www.jhpiego.org 1615 Thames Street #200 E-mail: [email protected] Baltimore, MD 21231 (1 410) 955-8558 (1 410) 955-6199 FAX
JHPIEGO’s goal is to improve health of women and families through reproductive health services and essential obstetrical care. They develop and test treatment protocols and have an infection control course.
Johns Hopkins International www.jhintl.net 550 N. Broadway, #201 [email protected] Baltimore, MD 21205 (1 410) 614-9150
Johns Hopkins has policies regarding infection prevention and control, including surveillance protocols, case definitions, and forms used to collect data.
The Joint Commission on Accreditation www.jcaho.org of Healthcare Organizations (JCAHO) One Renaissance Boulevard Oakbrook Terrace, IL 60181 (1 630) 792-5000 (1 630) 792-5005 FAX
JCAHO evaluates and accredits healthcare organizations. They publish accreditation standards for healthcare systems, books on improving quality, the Journal on Quality Improvement and the National Library of Healthcare Indicators.
Management Sciences for Health (MSH) www.msh.org 165 Allandale Road E-mail: [email protected] Boston, MA 02130-3400 (1 617) 524-7799 (1 617) 524-0783 FAX
The Guide to Reproductive Health Indicators at the National and Local Levels presents examples of indicators for six areas of reproductive health, including family planning; maternal health; child health; adolescent health; and services for reproductive tract infections, sexually transmitted diseases, and HIV. The Electronic Resource Center (www.erc.msh.org) is a web-based center for education and training.
Marker Systems Inc. Post Office Box 309 Severna Park, MD 21146 USA (1 410) 544-0251 (1 410) 544-3544 FAX
The Marker Management System is focused on standards of care and practice in hospitals.
Monitoring the Quality of 54 Hospital Care

Organizations Website/E-Mail Addresses
Population Action International (PAI) www.populationaction.org 1300 19th Street NW, 2nd Floor E-mail: [email protected] Washington, DC 20036 (1 202) 557-3400 (1 202) 728-4177 FAX
PAI published “Reproductive Risk: A Worldwide Assessment of Women’s Sexual and Maternal Health” based on ten indicators that resulted in a Reproductive Risk Index.
The Pan American Health Organization (PAHO) www.paho.org (Organización Panamericana de la Salud/OPS) E-mail: [email protected] 525 23rd Street, NW Washington, DC 20037 (1 202) 974-3000 (1 202) 974-3663 FAX
PAHO publishes Hospital Accreditation for Latin America and the Caribbean (1991) and Health Statistics in the Americas.
United Nations www.un.org/Docs 2 UN Plaza, Room DC2-853 E-mail: [email protected] United Nations Publications, Dept. C001 New York, NY 10017 (1 800) 253-9646 (1 212) 963-3489 FAX
The United Nations offers publications about population, demography, administration of family planning activities, morbidity, mortality, and economic development. The Demographic Yearbook and the Compendium of Social Statistics and Indicators include demographic and population statistics that are country-specific.
World Health Organization (WHO) www.who.org Avenue Appia 20 E-mail: [email protected] 1211 Geneva 27 SWITZERLAND (41 22) 791-2111 (41 22) 791-3111 FAX
WHO provides information regarding international health policies, statistics, and systems. The Integrated Management of Childhood Illness (IMCI) is one of the initiatives in which WHO is involved. The library catalog can be located at www.who.int/hlt. Surveillance standards for various communicable diseases have been developed.
QAP Health Manager’s Guide 55

Organizations Website/E-Mail Addresses
Indicators
Acute Health Division www.dhs.vic.gov.au/ahs Department of Human Services E-mail: 555 Collins Street [email protected] Melbourne, Victoria, 3000 AUSTRALIA (61) 3 9616 7777 (61) 3 9616 8471 FAX
The Acute Health Division, Department of Human Services has written Acute Health Performance Indicators: Strategy for Victoria.
American Public Health Association www.apha.org 800 I Street, NW Washington, DC 20001 (1 202) 777-2742 (1 202) 777-2534 FAX
The American Public Health Association published a document entitled Monitoring Children’s Health: Key Indicators, 2nd Edition.
NHS Executive Trent www.nhsetrent.gov.uk Fulwood House E-mail: Old Fulwood Road [email protected] Sheffield 6103TH ENGLAND (44 114) 282-0441 (44 114) 282-0397 FAX
The NHS published “Quality and Performance” in the NHS: High Level Performance Indicators in June 1999.
The Quality Indicator Project (QI Project) www.qiproject.org The Association of Maryland Hospitals & Health Systems E-mail: Quality Indicator Project [email protected] 6820 Deerpath Road Elkridge, MD 21075-6234 (1 410) 379-6200 (1 410) 379-8239 FAX
The QI Project specializes in clinical performance measurement and national comparative databases for acute care hospitals, psychiatric care facilities, long-term care facilities, and home care agencies.
United States Agency for International Development www.info.usaid.gov (USAID) Ronald Reagan Building Washington, DC 20523-1000 (1 202) 712-4810 (1 202) 216-3524 FAX
USAID has a database, the Development Experience System (DEXS), of technical and program documents ([email protected]) from projects funded by USAID. Indicators are available such as Health and family planning indicators (www.info.usaid.gov/regions/afr/hhraa/indicators/ indicators1.htm) and Handbook of Indicators for HIV/AIDS/STI (www.synergyaids.com/ indicators.htm).
Monitoring the Quality of 56 Hospital Care
Organizations Website/E-Mail Addresses
Quality Organizations
Center for Quality of Care Research and Education www.hsph.harvard.edu/qcare (QCARE) E-mail: 677 Huntington Avenue [email protected] Boston, MA 02115 (1 617) 432-2027 (1 617) 432-3199 FAX
QCARE develops and disseminates methods for improving quality of medical care. QCARE research is focused on design, development and testing of clinical performance measures.
International Society for Quality in Health Care (ISQua) www.isqua.org.au Level 9, Aikenhead Centre E-mail: [email protected] St. Vincent’s Hospital, 41 Victoria Parade Fitzroy, Victoria 3065 AUSTRALIA (61) 3 9417 6971 (61) 3 9417 6851 FAX
ISQUA is an organization of healthcare leaders that has initiated the International Indicator Initiative to develop clinical indicators. The group is working on internationally agreed quality terminology and publishes the ISQua journal.
The National Association for Healthcare Quality (NAHQ) www.nahq.org 4700 W. Lake Avenue E-mail: [email protected] Glenview, IL 60025 (1 800) 966-9392 (1 847) 375-6320 FAX
NAHQ publishes the Journal for Healthcare Quality (JHQ).
Partnerships for Health Reform (PHR/HPSS) E-mail: ABT Associates Inc. [email protected] 4800 Montgomery Lane #600 Bethesda, MD 20814 (1 301) 913-0500 (1 301) 652-3916 FAX
PHR works to improve health policy and strengthen health systems. PHR has worked with international organizations to develop measures of quality under health sector reform.
Quality Assurance Project (QAP) www.qaproject.org 7200 Wisconsin Avenue, Suite #600 [email protected] Bethesda, MD 20814-4811 (1 301) 654-8338 (1 301) 941-8427 FAX
QAP works with lesser-developed countries to improve their quality and efficiency of health care through institutionalizing quality assurance. QAP provides expertise in the development and communication of health care standards as well as quality improvement methodologies.
QAP Health Manager’s Guide 57
Organizations Website/E-Mail Addresses
Quality Measurement Advisory Service (QMAS) www.qmas.org 705 Second Avenue, Suite 703 Seattle, WA 98104 (1 206) 682-2811, Ext. 16 (1 206) 682-3739 FAX
The report on Assessing Hospital Performance introduces a range of dimensions of hospital quality that can be measured.
University Research Corporation (URC) www.urc-chs.com Quality and Performance Institute 7200 Wisconsin Avenue, Suite #600 Bethesda, MD 20814-4811 (1 301) 654-8338 (1 301) 941-8650 FAX
URC’s Quality and Performance Institute (QPI) uses new technology and research findings to improve program management, operations, and outcomes. One of the QPI’s projects is the Quality Assurance Project.
Monitoring the Quality of 58 Hospital Care
Professional Organizations
Various professional organizations develop standards of practice for their particular specialties. Some of these organizations are listed below.
American Academy of Family Physicians www.aafp.org
American Academy of Pediatrics www.aap.org
American Association of Critical-Care Nurses www.aacn.org
American College of Obstetricians and Gynecologists www.acog.org
American College of Physicians www.acponline.org
American College of Surgeons www.facs.org
American Hospital Association www.aha.org
American Medical Association www.ama-assn.org
American Red Cross www.redcross.org
British Medical Association www.bma.org.uk
The Association of Women’s Health, Obstetric and www.awhonn.org Neonatal Nurses
Emergency Nurses Association www.ena.org
International Federation of Gynecology and Obstetrics www.figo.org
Oncology Nursing Society www.ons.org
Evidence-Based Medicine
National Guideline Clearinghouse is a public resource for evidence-based clinical practice guidelines; it can be accessed through www.guidelines.gov.
Evidence Based Medicine – F2000 is a discussion forum for medical professions on evidence-based medicine. www.egroups.com/group/ebm-f2000.
QAP Health Manager’s Guide 59


![QAP Summary [R]](https://static.fdocuments.us/doc/165x107/577cc1221a28aba7119253d1/qap-summary-r.jpg)