
Monitoring the incidence and causes of diseases ...
29
CDI Vol 36 No 3 2012 E213 OzFoodNet Annual reports Abstract This report summarises the incidence of diseases potentially transmitted by food in Australia and details outbreaks associated with food in 2010. OzFoodNet sites reported 30,035 notifications of 9 diseases or conditions that are commonly transmitted by food. The most frequently notified infections were Campylobacter (16,968 notifica- tions) and Salmonella (11,992 notifications). The most frequently notified Salmonella serotype was Salmonella Typhimurium, accounting for 44% of all Salmonella notifications. OzFoodNet sites also reported 1,640 outbreaks of gastrointestinal illness affecting 30,193 people and resulting in 722 people being hospitalised. There were 89 deaths associated with these outbreaks. The majority of outbreaks (81%, 1,330/1,640) were due to person-to-person spread, 9% (154/1,640) were suspected or confirmed to have been trans- mitted by contaminated food, 9% (155/1,640) had an unknown mode of transmission and 1 outbreak was due to transmission from animal to person. Foodborne and suspected foodborne outbreaks affected 2,146 persons and included 157 hospitalisations . Fifteen deaths were reported during these outbreaks . Salmonella was the most common aetiological agent identified in food- borne outbreaks and restaurants were the most frequently reported food preparation setting. A single food source was identified for 43 outbreaks, 21 of which were associated with the consump- tion of dishes containing raw or minimally cooked eggs; the majority (n=20) due to S. Typhimurium. These data assist agencies to document sources of foodborne disease, develop food safety policies, and prevent foodborne illness . Commun Dis Intell 2012;36(3):E213–E241. Keywords: foodborne disease, surveillance, disease outbreak Introduction In Australia, an estimated 5.4 million cases of food- borne disease occur annually, costing an estimated $1.2 billion per year. 1 Many of these illnesses are pre- ventable by appropriate interventions. Foodborne disease surveillance can be used to gather evidence to help inform appropriate control measures. 2 Health departments conduct surveillance for foodborne diseases and diseases potentially transmitted by food to monitor trends in illness, detect outbreaks, inform preventative measures and to evaluate the efficacy of interventions. 3,4 Most foodborne diseases manifest as mild self- limiting gastroenteritis, with around 20% of affected people seeking medical attention. Consequently, surveillance data collected by health departments underestimate the true burden of disease. In Australia, for every case of salmonellosis notified to a health department there are an estimated 7 infec- tions that occur in the community, while there are approximately 8 cases in the community for every notified case of campylobacteriosis and Shiga toxin- producing Escherichia coli (STEC). 5,6 Public Health authorities use surveillance data to detect outbreaks and clusters of disease. Trends in surveillance data also contribute to the assessment of the efficacy of public health interventions. 7 In Australia, state and territory health departments conduct surveillance for between 10 and 15 different diseases that may be transmitted through food. Most of these diseases are also transmitted by the faecal– oral route and as such may be transmitted by contact with infected animals or people. They may also be transmitted by contaminated food or surfaces, or through the consumption of contaminated water. In addition, health departments collect summary data on notified outbreaks of foodborne diseases, provid- ing robust information on contaminated foods caus- ing illness in Australia. The Australian Government established OzFoodNet—Australia’s enhanced foodborne disease surveillance system—in 2000 to improve national surveillance and conduct applied research into the causes of foodborne illness. 8 OzFoodNet aggregates and analyses national-level information on the incidence of diseases caused by pathogens Annual reports MONITORING THE INCIDENCE AND CAUSES OF DISEASES POTENTIALLY TRANSMITTED BY FOOD IN AUSTRALIA: ANNUAL REPORT OF THE OZFOODNET NETWORK, 2010 The OzFoodNet Working Group OzFoodNet
Transcript of Monitoring the incidence and causes of diseases ...
CDI Vol 36 No 3 2012 E213
OzFoodNet Annual reports
Abstract
This report summarises the incidence of diseases potentially transmitted by food in Australia and details outbreaks associated with food in 2010. OzFoodNet sites reported 30,035 notifications of 9 diseases or conditions that are commonly transmitted by food. The most frequently notified infections were Campylobacter (16,968 notifica-tions) and Salmonella (11,992 notifications). The most frequently notified Salmonella serotype was Salmonella Typhimurium, accounting for 44% of all Salmonella notifications. OzFoodNet sites also reported 1,640 outbreaks of gastrointestinal illness affecting 30,193 people and resulting in 722 people being hospitalised. There were 89 deaths associated with these outbreaks. The majority of outbreaks (81%, 1,330/1,640) were due to person-to-person spread, 9% (154/1,640) were suspected or confirmed to have been trans-mitted by contaminated food, 9% (155/1,640) had an unknown mode of transmission and 1 outbreak was due to transmission from animal to person. Foodborne and suspected foodborne outbreaks affected 2,146 persons and included 157 hospitalisations . Fifteen deaths were reported during these outbreaks . Salmonella was the most common aetiological agent identified in food-borne outbreaks and restaurants were the most frequently reported food preparation setting. A single food source was identified for 43 outbreaks, 21 of which were associated with the consump-tion of dishes containing raw or minimally cooked eggs; the majority (n=20) due to S. Typhimurium. These data assist agencies to document sources of foodborne disease, develop food safety policies, and prevent foodborne illness . Commun Dis Intell 2012;36(3):E213–E241.
Keywords: foodborne disease, surveillance, disease outbreak
Introduction
In Australia, an estimated 5.4 million cases of food-borne disease occur annually, costing an estimated
$1.2 billion per year. 1 Many of these illnesses are pre-ventable by appropriate interventions. Foodborne disease surveillance can be used to gather evidence to help inform appropriate control measures. 2 Health departments conduct surveillance for foodborne diseases and diseases potentially transmitted by food to monitor trends in illness, detect outbreaks, inform preventative measures and to evaluate the efficacy of interventions. 3,4
Most foodborne diseases manifest as mild self-limiting gastroenteritis, with around 20% of affected people seeking medical attention. Consequently, surveillance data collected by health departments underestimate the true burden of disease. In Australia, for every case of salmonellosis notified to a health department there are an estimated 7 infec-tions that occur in the community, while there are approximately 8 cases in the community for every notified case of campylobacteriosis and Shiga toxin-producing Escherichia coli (STEC). 5,6
Public Health authorities use surveillance data to detect outbreaks and clusters of disease. Trends in surveillance data also contribute to the assessment of the efficacy of public health interventions. 7 In Australia, state and territory health departments conduct surveillance for between 10 and 15 different diseases that may be transmitted through food. Most of these diseases are also transmitted by the faecal–oral route and as such may be transmitted by contact with infected animals or people. They may also be transmitted by contaminated food or surfaces, or through the consumption of contaminated water. In addition, health departments collect summary data on notified outbreaks of foodborne diseases, provid-ing robust information on contaminated foods caus-ing illness in Australia.
The Australian Government established OzFoodNet—Australia’s enhanced foodborne disease surveillance system—in 2000 to improve national surveillance and conduct applied research into the causes of foodborne illness. 8 OzFoodNet aggregates and analyses national-level information on the incidence of diseases caused by pathogens
Annual reports MONITORING THE INCIDENCE AND CAUSES OF DISEASES POTENTIALLY TRANSMITTED BY FOOD IN AUSTRALIA: ANNUAL REPORT OF THE OZFOODNET NETWORK, 2010 The OzFoodNet Working Group
OzFoodNet

E214 CDI Vol 36 No 3 2012
Annual reports OzFoodNet
commonly transmitted by food, as well as food-borne disease outbreaks. The OzFoodNet network includes collaborators from the Public Health Laboratory Network, Food Standards Australia New Zealand, the Department of Agriculture, Fisheries and Forestry and the National Centre for Epidemiology and Population Health at the Australian National University. OzFoodNet is a member of the Communicable Diseases Network Australia, which is Australia’s peak body for com-municable disease control. 9 This is the 10th annual report for the OzFoodNet network and summarises the 2010 surveillance data including a comparison with data from previous years.
Methods
Population under surveillance
In 2010, the network covered the whole of the Australian population, which was estimated to be 22,342,398 persons. 10
Data sources
Notifi ed infections
All Australian states and territories have public health legislation requiring doctors and pathology laboratories to notify cases of infectious diseases that are important to public health. State and territory health departments record details of notified cases on surveillance databases. These surveillance data-sets are aggregated into a national database—the National Notifiable Diseases Surveillance System (NNDSS)—under the auspices of the National Health Security Act 2007. 11 In 2010, OzFoodNet aggregated and analysed data from NNDSS and enhanced surveillance data from OzFoodNet sites on the following 9 diseases or conditions, which are commonly transmitted by food:
• non-typhoidal Salmonella infections;• Campylobacter infections (except in New South
Wales);• Listeria infections;• Shigella infections;• Salmonella Typhi (typhoid) infections;• hepatitis A infections;• botulism;• STEC infections; and• haemolytic uraemic syndrome (HUS).
There may be differences when comparing OzFoodNet enhanced data state totals and NNDSS derived notifications . This is due to amendments to notification totals by states and territories after the date of data extraction. Also, some jurisdictions report on notification date rather than onset date.
Data for this report were extracted from NNDSS in November 2011 and were analysed by the date of diagnosis within the reporting period 1 January to 31 December 2010. Date of diagnosis was derived for each case from the earliest date supplied by the jurisdiction, which could be the date of onset of the case’s illness, the date a specimen was collected or the date that a health department received the notifi-cation. Estimated resident populations for each state or territory as at June 2010 were used to calculate rates of notified infections . 12
Enhanced surveillance for listeriosis
Commencing in 2010, OzFoodNet collected enhanced surveillance data on all notified cases of listeriosis in Australia. This enhanced surveillance system adds to the routinely collected data within NNDSS. It is a centralised national database that includes detailed information regarding the char-acterisation of Listeria monocytogenes isolates by molecular subtyping methods, food histories and exposure data on all notified listeriosis cases in Australia. The overall aim of this enhanced surveil-lance is to enable timely detection of illness and subsequent public health response. Local public health unit staff interview all cases with a stand-ard national listeriosis questionnaire. Interviews are conducted as individual cases are reported to improve accurate recall of foods consumed during the incubation period. Data are collated nationally via an online open-source database using NetEpi Case Manager. This is a secure web-based report-ing system used by OzFoodNet epidemiologists for the enhanced surveillance of listeriosis and multi-jurisdictional outbreaks in Australia. NetEpi allows data to be entered from multiple sites and promotes nationally consistent data collection and analysis by OzFoodNet epidemiologists.
Supplementary surveillance
OzFoodNet sites collected supplementary data on infections commonly transmitted by food . Information on travel status was collected for cases of Salmonella Enteritidis, hepatitis A, Shigella and typhoid.
To examine the quality of surveillance data col-lected across Australia, OzFoodNet sites provided data on the completeness of notification databases for Salmonella notifications regarding serotype and phage type. Data from Western Australia were excluded from the analysis of phage type complete-ness, as pulsed-field gel electrophoresis (PFGE) is used for typing S . Typhimurium in that state, and isolates have not been sent routinely for phage typing since June 2007. To assess completeness, data were analysed using the date a notification was received by a health department.

CDI Vol 36 No 3 2012 E215
OzFoodNet Annual reports
Gastrointestinal and foodborne disease outbreaks
OzFoodNet sites collected summary information on gastrointestinal and foodborne disease outbreaks that occurred in Australia during 2010. An outbreak of foodborne disease was defined as an incident where two or more persons experience a similar illness after consuming a common food or meal and analytical epidemiological and/or microbiological evidence implicated the meal or food as the source of illness. A suspected foodborne outbreak was defined as an inci-dent where two or more persons experience illness after consuming a common meal or food and descrip-tive epidemiological evidence implicated the meal or food as the suspected source of illness, including out-breaks where food-to-person-to-food transmission is involved. A cluster was defined as an increase in infections that were epidemiologically related in time, place or person where there is no common setting and investigators were unable to implicate a vehicle or determine a mode of transmission.
Summary information for foodborne and suspected foodborne outbreaks has been combined for the anal-ysis. Information collected on each outbreak included the setting where the outbreak occurred, where the food was prepared, the month the outbreak occurred, the aetiological agent, the number of persons affected, the type of investigation conducted, the level of evi-dence obtained, and the food vehicle responsible for the outbreak. To summarise the data, outbreaks were categorised by aetiological agent, food vehicle and the setting where the implicated food was prepared. Data on outbreaks due to waterborne transmission and data from clusters investigated by jurisdictional health departments were also summarised. The number of outbreaks and documented causes reported here may vary from summaries previously published by indi-vidual jurisdictions as these can take time to finalise.
Data analysis
Microsoft Excel and Stata version 10.1 were used for all analyses.
Results
Rates of notifi ed infections
In 2010, OzFoodNet sites reported 30,035 notifica-tions of 9 diseases or conditions that are commonly transmitted by food (Table 1), which is an increase compared with the mean of 26,190 notifications per year for the previous 5 years (2005–2009).
Salmonella infections
In 2010, OzFoodNet sites reported 11,992 cases of Salmonella infection, a rate of 53.7 cases per 100,000. This was an increase compared with the mean rate for the previous 5 years (41.8 cases per 100,000).
Notification rates ranged from 40.6 cases per 100,000 in South Australia to 249.5 cases per 100,000 in the Northern Territory, which usually has the highest rate of salmonellosis. Approximately half (48.7%) of salmonellosis notifications were in males.
Nationally during 2010, the most commonly noti-fied Salmonella serotype was S. Typhimurium, which was responsible for approximately 44% (5,241/11,992) of all notified Salmonella infections (Table 2). The serotype with the largest percentage increase was S . Infantis with 2.2 times more notifi-cations nationally in 2010 than in 2009.
Completeness of Salmonella serotyping and phage typing
Overall, 97.2% (11,651/11,992) of Salmonella noti-fications contained information about serotype. OzFoodNet monitors the completeness of 6 serotypes that are routinely phage typed: Bovismorbificans; Enteritidis; Hadar; Heidelberg; Typhimurium; and Virchow, in those jurisdictions participating in this typing scheme. In 2010, phage typing was greater than 90% complete for only S. Enteritidis (Table 3), and across all 6 serotypes, completeness declined from 93.8% in 2009 to 86.3% in 2010.
Salmonella Enteritidis
S. Enteritidis is a globally important Salmonella serotype that can infect the internal contents of eggs, but is not endemic in Australian egg layer flocks. To monitor the emergence of this strain in Australia, OzFoodNet conducts enhanced surveil-lance of locally-acquired infections of S. Enteritidis in humans. The majority of cases in Australia are associated with overseas travel.
During 2010, OzFoodNet sites reported 835 cases of S. Enteritidis infection (Table 4). Travel histories were obtained for 94.9% of cases in 2010 (792/835), compared with 75% of cases in 2009 (443/591). Of those cases where travel status was reported, 92.9% (736/792) had travelled overseas and cases often reported visiting several countries. Western Australia reported the highest number of notified cases com-pared with other jurisdictions in 2010 and infection was mainly acquired overseas. Queensland reported the largest number of locally-acquired cases.
Of the cases that were known to have been acquired overseas, 84.9% (625/736) reported travel to South East Asia. Similarly to previous years, the most com-mon country of acquisition for overseas-acquired infections was Indonesia, with 64.3% (473/736) of cases reporting travel there. Malaysia was the second most common country of acquisition with 7.9% (58/736) of all notifications that were known to have been acquired overseas, followed by Thailand with 6.9% (51/736).
E216 CDI Vol 36 No 3 2012
Annual reports OzFoodNet
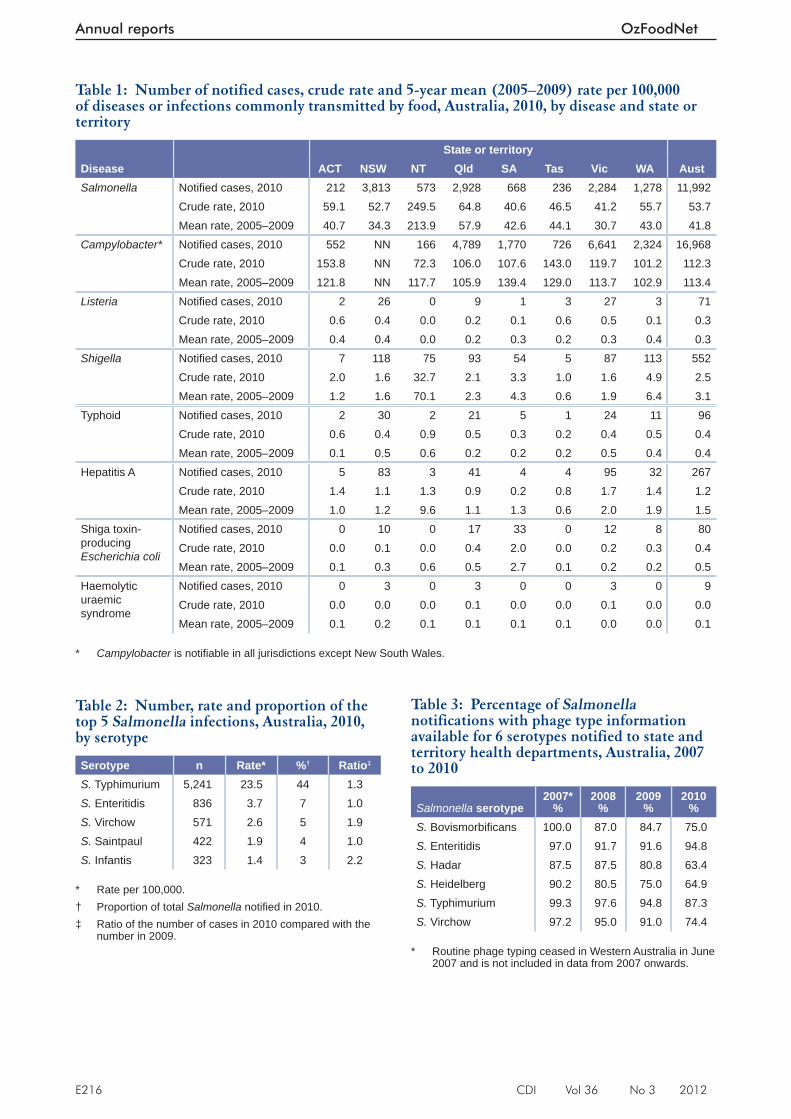
Table 1: Number of notified cases, crude rate and 5-year mean (2005–2009) rate per 100,000 of diseases or infections commonly transmitted by food, Australia, 2010, by disease and state or territory
Disease State or territory
ACT NSW NT Qld SA Tas Vic WA AustSalmonella Notifi ed cases, 2010 212 3,813 573 2,928 668 236 2,284 1,278 11,992
Crude rate, 2010 59.1 52.7 249.5 64.8 40.6 46.5 41.2 55.7 53.7Mean rate, 2005–2009 40.7 34.3 213.9 57.9 42.6 44.1 30.7 43.0 41.8
Campylobacter* Notifi ed cases, 2010 552 NN 166 4,789 1,770 726 6,641 2,324 16,968Crude rate, 2010 153.8 NN 72.3 106.0 107.6 143.0 119.7 101.2 112.3Mean rate, 2005–2009 121.8 NN 117.7 105.9 139.4 129.0 113.7 102.9 113.4
Listeria Notifi ed cases, 2010 2 26 0 9 1 3 27 3 71Crude rate, 2010 0.6 0.4 0.0 0.2 0.1 0.6 0.5 0.1 0.3Mean rate, 2005–2009 0.4 0.4 0.0 0.2 0.3 0.2 0.3 0.4 0.3
Shigella Notifi ed cases, 2010 7 118 75 93 54 5 87 113 552Crude rate, 2010 2.0 1.6 32.7 2.1 3.3 1.0 1.6 4.9 2.5Mean rate, 2005–2009 1.2 1.6 70.1 2.3 4.3 0.6 1.9 6.4 3.1
Typhoid Notifi ed cases, 2010 2 30 2 21 5 1 24 11 96Crude rate, 2010 0.6 0.4 0.9 0.5 0.3 0.2 0.4 0.5 0.4Mean rate, 2005–2009 0.1 0.5 0.6 0.2 0.2 0.2 0.5 0.4 0.4
Hepatitis A Notifi ed cases, 2010 5 83 3 41 4 4 95 32 267Crude rate, 2010 1.4 1.1 1.3 0.9 0.2 0.8 1.7 1.4 1.2Mean rate, 2005–2009 1.0 1.2 9.6 1.1 1.3 0.6 2.0 1.9 1.5
Shiga toxin-producing Escherichia coli
Notifi ed cases, 2010 0 10 0 17 33 0 12 8 80Crude rate, 2010 0.0 0.1 0.0 0.4 2.0 0.0 0.2 0.3 0.4Mean rate, 2005–2009 0.1 0.3 0.6 0.5 2.7 0.1 0.2 0.2 0.5
Haemolytic uraemic syndrome
Notifi ed cases, 2010 0 3 0 3 0 0 3 0 9Crude rate, 2010 0.0 0.0 0.0 0.1 0.0 0.0 0.1 0.0 0.0Mean rate, 2005–2009 0.1 0.2 0.1 0.1 0.1 0.1 0.0 0.0 0.1
* Campylobacter is notifi able in all jurisdictions except New South Wales.
Table 2: Number, rate and proportion of the top 5 Salmonella infections, Australia, 2010, by serotype
Serotype n Rate* %† Ratio‡
S. Typhimurium 5,241 23.5 44 1.3S. Enteritidis 836 3.7 7 1.0S. Virchow 571 2.6 5 1.9S. Saintpaul 422 1.9 4 1.0S. Infantis 323 1.4 3 2.2
* Rate per 100,000. † Proportion of total Salmonella notifi ed in 2010. ‡ Ratio of the number of cases in 2010 compared with the
number in 2009.
Table 3: Percentage of Salmonella notifications with phage type information available for 6 serotypes notified to state and territory health departments, Australia, 2007 to 2010
Salmonella serotype2007*
%2008
%2009
%2010
%S. Bovismorbifi cans 100.0 87.0 84.7 75.0S. Enteritidis 97.0 91.7 91.6 94.8S. Hadar 87.5 87.5 80.8 63.4S. Heidelberg 90.2 80.5 75.0 64.9S. Typhimurium 99.3 97.6 94.8 87.3S. Virchow 97.2 95.0 91.0 74.4
* Routine phage typing ceased in Western Australia in June
2007 and is not included in data from 2007 onwards.
CDI Vol 36 No 3 2012 E217
OzFoodNet Annual reports
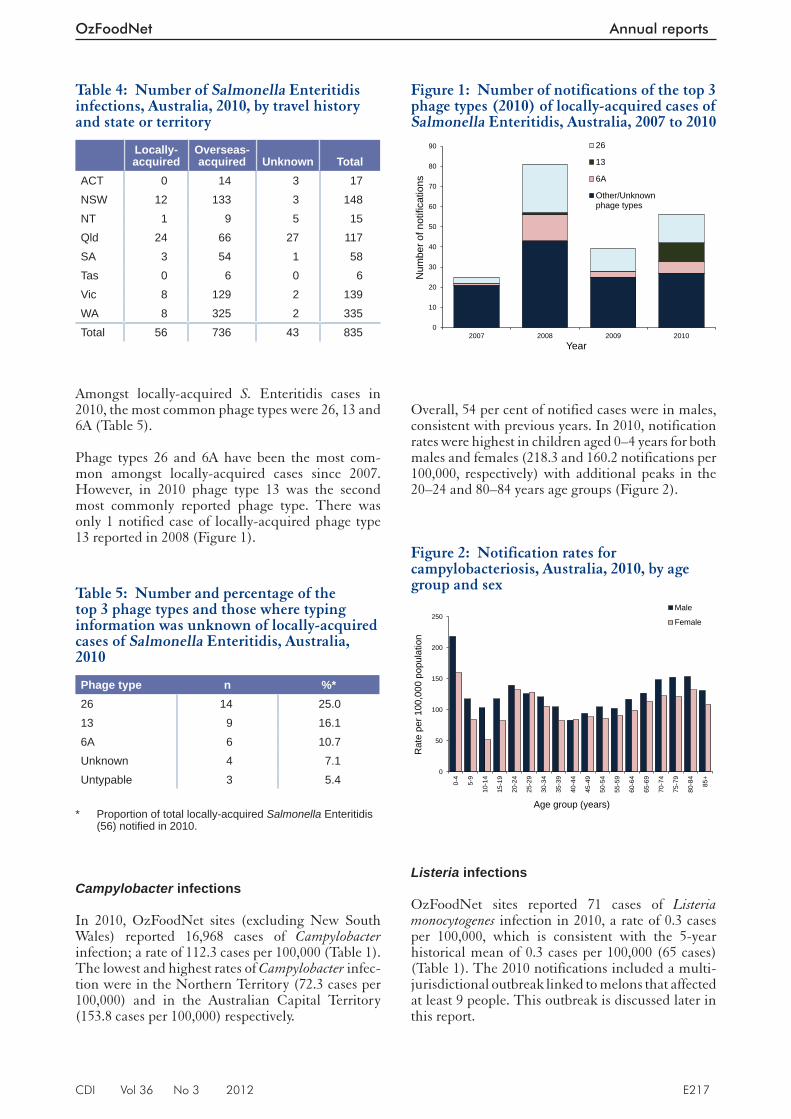
Amongst locally-acquired S. Enteritidis cases in 2010, the most common phage types were 26, 13 and 6A (Table 5).
Phage types 26 and 6A have been the most com-mon amongst locally-acquired cases since 2007. However, in 2010 phage type 13 was the second most commonly reported phage type. There was only 1 notified case of locally-acquired phage type 13 reported in 2008 (Figure 1).
Campylobacter infections
In 2010, OzFoodNet sites (excluding New South Wales) reported 16,968 cases of Campylobacter infection; a rate of 112.3 cases per 100,000 (Table 1). The lowest and highest rates of Campylobacter infec-tion were in the Northern Territory (72.3 cases per 100,000) and in the Australian Capital Territory (153.8 cases per 100,000) respectively.
Overall, 54 per cent of notified cases were in males, consistent with previous years. In 2010, notification rates were highest in children aged 0–4 years for both males and females (218.3 and 160.2 notifications per 100,000, respectively) with additional peaks in the 20–24 and 80–84 years age groups (Figure 2).
Listeria infections
OzFoodNet sites reported 71 cases of Listeria monocytogenes infection in 2010, a rate of 0.3 cases per 100,000, which is consistent with the 5-year historical mean of 0.3 cases per 100,000 (65 cases) (Table 1). The 2010 notifications included a multi-jurisdictional outbreak linked to melons that affected at least 9 people. This outbreak is discussed later in this report.
Table 4: Number of Salmonella Enteritidis infections, Australia, 2010, by travel history and state or territory
Locally-acquired
Overseas-acquired Unknown Total
ACT 0 14 3 17NSW 12 133 3 148NT 1 9 5 15Qld 24 66 27 117SA 3 54 1 58Tas 0 6 0 6Vic 8 129 2 139WA 8 325 2 335Total 56 736 43 835
Table 5: Number and percentage of the top 3 phage types and those where typing information was unknown of locally-acquired cases of Salmonella Enteritidis, Australia, 2010
Phage type n %*26 14 25.013 9 16.16A 6 10.7Unknown 4 7.1Untypable 3 5.4
* Proportion of total locally-acquired Salmonella Enteritidis
(56) notifi ed in 2010.
Figure 1: Number of notifications of the top 3 phage types (2010) of locally-acquired cases of Salmonella Enteritidis, Australia, 2007 to 2010
0
10
20
30
40
50
60
70
80
90
2007 2008 2009 2010
Num
ber o
f not
ifica
tions
Year
26
13
6A
Other/Unknownphage types
Figure 2: Notification rates for campylobacteriosis, Australia, 2010, by age group and sex
0
50
100
150
200
250
0-4
5-9
10-1
4
15-1
9
20-2
4
25-2
9
30-3
4
35-3
9
40-4
4
45-4
9
50-5
4
55-5
9
60-6
4
65-6
9
70-7
4
75-7
9
80-8
4
85+
Rat
e pe
r 100
,000
pop
ulat
ion
Age group (years)
Male
Female

E218 CDI Vol 36 No 3 2012
Annual reports OzFoodNet
As in previous years, the highest notification rate was in the Northern Territory, with 32.7 cases per 100,000 and a decline compared with an average of 70.1 cases per 100,000 between 2005 and 2009. One factor that may have influenced the decline in cases of shigellosis in the Northern Territory since 2008 (Figure 4) was the ‘No germs on me’ campaign, first implemented in October 2007. This social marketing campaign targeted remote communities and Indigenous people to raise awareness about the importance of hand washing. An urban campaign was implemented in October 2008, which primarily targeted the non-Indigenous population.
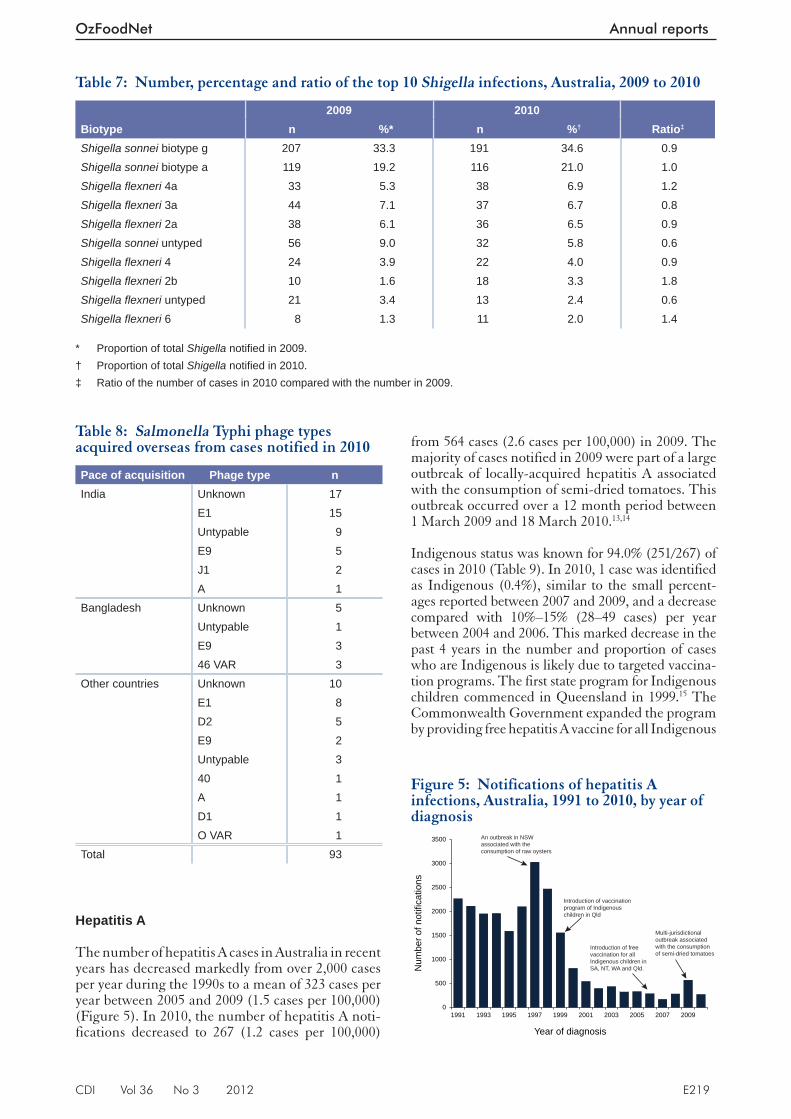
The most frequently reported Shigella biotype in 2010 was S. sonnei biotype g, followed by S. sonnei biotype a. Together these biotypes accounted for 55.6% of all Shigella infections reported in 2010 (Table 7).
Typhoid
In 2010, there were 96 cases of Salmonella Typhi infection (typhoid) in Australia, a rate of 0.4 cases per 100,000, the same as the 5 year mean between 2005 and 2009 (Table 1). In 2010, 42.7% (41/96) of cases were female and cases were reported from all Australian states and territories. Travel status was known for 99.0% (95/96) of cases, with 93 cases reporting infections likely to be acquired overseas .
India was the most frequently reported country of travel for overseas-acquired cases of typhoid in 2010, with 52.7% (49/93) of cases. E1 was the most common phage type for typhoid cases with a known travel status (Table 8).
Seventy-six per cent (54/71) of notifications in 2010 were in people aged 60 years or more and males accounted for 54% (38/71) of all notifications. Twenty-one per cent of cases died in 2010 (15/71). There was 1 materno-foetal case in 2010, which was not fatal.
The most commonly reported strain of Listeria monocytogenes was serotype 1/2b, 3b, 7 binary type 158 (24%, 17/71) (Table 6).
Shigella infections
There were 552 notifications of Shigella infection in Australia in 2010, a rate of 2.5 notifications per 100,000 compared with a mean of 655 cases (3.1 notifications per 100,000) per year between 2005 and 2009.
In 2010, notification rates for shigellosis were highest in males and females aged 0–4 years, with 7.5 and 8.3 notifications per 100,000 respectively (Figure 3). The overall rate for males decreased from 3.4 notifications per 100,000 in 2009 to 2.3 in 2010. This decrease was most prominent in the 0–4, and 20–44 year age groups.
Table 6: Top 4 listeriosis strains – molecular serotype and binary type, Australia , 2010
Serotype Binary type n1/2b, 3b, 7* 158* 174b, 4d, 4e 254 101/2a,3a 155 61/2b, 3b, 7 159 4
Source: OzFoodNet Enhanced National Listeriosis Surveillance System * This strain was associated with the Listeria outbreak
discussed later in this report.
Figure 3: Notification rates for shigellosis, Australia, 2010, by age and sex
0
2
4
6
8
10
12
0-4
5-9
10-1
4
15-1
9
20-2
4
25-2
9
30-3
4
35-3
9
40-4
4
45-4
9
50-5
4
55-5
9
60-6
4
65-6
9
70-7
4
75-7
9
80-8
4
85+
Rat
e pe
r 100
,000
pop
ulat
ion
Age group (years)
Male
Female
Figure 4: Notification rates for shigellosis, Northern Territory, 2007 to 2010, by Indigenous status
0
20
40
60
80
100
120
140
160
2007 2008 2009 2010
Rat
e pe
r 100
,000
pop
ulat
ion
Year
Indigenous
Non-Indigenous
CDI Vol 36 No 3 2012 E219
OzFoodNet Annual reports
Hepatitis A
The number of hepatitis A cases in Australia in recent years has decreased markedly from over 2,000 cases per year during the 1990s to a mean of 323 cases per year between 2005 and 2009 (1.5 cases per 100,000) (Figure 5). In 2010, the number of hepatitis A noti-fications decreased to 267 (1.2 cases per 100,000)
from 564 cases (2.6 cases per 100,000) in 2009. The majority of cases notified in 2009 were part of a large outbreak of locally-acquired hepatitis A associated with the consumption of semi-dried tomatoes. This outbreak occurred over a 12 month period between 1 March 2009 and 18 March 2010. 13,14
Indigenous status was known for 94.0% (251/267) of cases in 2010 (Table 9). In 2010, 1 case was identified as Indigenous (0.4%), similar to the small percent-ages reported between 2007 and 2009, and a decrease compared with 10%–15% (28–49 cases) per year between 2004 and 2006. This marked decrease in the past 4 years in the number and proportion of cases who are Indigenous is likely due to targeted vaccina-tion programs. The first state program for Indigenous children commenced in Queensland in 1999. 15 The Commonwealth Government expanded the program by providing free hepatitis A vaccine for all Indigenous
Table 7: Number, percentage and ratio of the top 10 Shigella infections, Australia, 2009 to 2010
2009 2010Ratio‡Biotype n %* n %†
Shigella sonnei biotype g 207 33.3 191 34.6 0.9Shigella sonnei biotype a 119 19.2 116 21.0 1.0Shigella fl exneri 4a 33 5.3 38 6.9 1.2Shigella fl exneri 3a 44 7.1 37 6.7 0.8Shigella fl exneri 2a 38 6.1 36 6.5 0.9Shigella sonnei untyped 56 9.0 32 5.8 0.6Shigella fl exneri 4 24 3.9 22 4.0 0.9Shigella fl exneri 2b 10 1.6 18 3.3 1.8Shigella fl exneri untyped 21 3.4 13 2.4 0.6Shigella fl exneri 6 8 1.3 11 2.0 1.4
* Proportion of total Shigella notifi ed in 2009. † Proportion of total Shigella notifi ed in 2010. ‡ Ratio of the number of cases in 2010 compared with the number in 2009.
Table 8: Salmonella Typhi phage types acquired overseas from cases notified in 2010
Pace of acquisition Phage type nIndia Unknown 17 E1 15 Untypable 9 E9 5 J1 2 A 1Bangladesh Unknown 5 Untypable 1 E9 3 46 VAR 3Other countries Unknown 10 E1 8 D2 5 E9 2 Untypable 3 40 1 A 1 D1 1 O VAR 1Total 93
Figure 5: Notifications of hepatitis A infections, Australia, 1991 to 2010, by year of diagnosis
0
500
1000
1500
2000
2500
3000
3500
1991 1993 1995 1997 1999 2001 2003 2005 2007 2009
Num
ber o
f not
ifica
tions
Year of diagnosis
An outbreak in NSWassociated with theconsumption of raw oysters
Introduction of vaccinationprogram of Indigenouschildren in Qld
Introduction of free vaccination for allIndigenous children inSA, NT, WA and Qld.
Multi-jurisdictionaloutbreak associated with the consumptionof semi-dried tomatoes
E220 CDI Vol 36 No 3 2012
Annual reports OzFoodNet
children aged up to 5 years living in Queensland, the Northern Territory, Western Australia and South Australia from 1 November 2005. 16
In 2010, the number of locally-acquired hepatitis A cases was similar to the numbers prior to the multi-jurisdiction outbreak of 2009, with 43.8% (117/267) of cases. The number of cases reported as overseas acquired in 2010 increased to 55.1% (147/267) of all cases being locally acquired (Table 10). Overseas-acquired cases most frequently reported travel to the South Asian and Polynesian regions. Fiji (22/147) and India (21/147) were the most frequently reported countries of travel .
Botulism
There were no cases of botulism reported in 2010. The most recent notified case was reported in 2009. 14
Shiga toxin-producing Escherichia coli infection
In 2010, there were 80 notifications of STEC in Australia, a rate of 0.4 cases per 100,000 compared with a mean of 0.5 cases per 100,000 between 2005 and 2009 (Table 1). These numbers include a case of HUS where an STEC organism was isolated. Under the Australian National Notifiable Disease Surveillance System surveillance case definitions, these are notified separately. 17 There were no cases of STEC in the Australian Capital Territory, the Northern Territory or Tasmania in 2010.
Notified cases of STEC infection are strongly influenced by jurisdictional practices regarding the screening of stool specimens . 18 In particular, South Australia routinely tests all bloody stools and use polymerase chain reaction (PCR) for genes coding for Shiga toxins for diagnosis, making rates for this State the highest in the country. In 2009, Queensland changed its screening procedures resulting in all stool specimens submitted for STEC testing being screened for the presence of Shiga toxins using an enzyme immunoassay (EIA – Premier EHEC, Meridian BioScience) method in conjunction with PCR. Cases identified through the EIA method do not meet the surveillance case definition, therefore these cases were classified as ‘probable’. These prob-able cases (EIA positive only; PCR and/or culture negative) are not notified to the NNDSS. 19
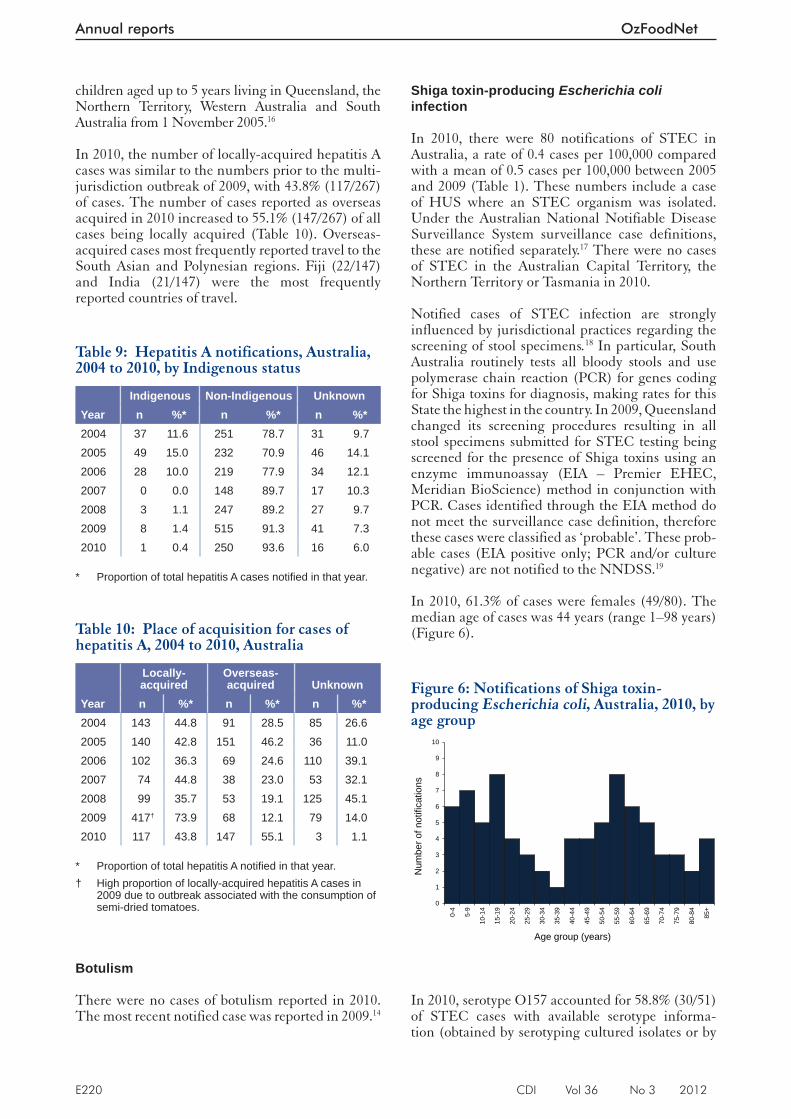
In 2010, 61.3% of cases were females (49/80). The median age of cases was 44 years (range 1–98 years) (Figure 6).
In 2010, serotype O157 accounted for 58.8% (30/51) of STEC cases with available serotype informa-tion (obtained by serotyping cultured isolates or by
Table 9: Hepatitis A notifications, Australia, 2004 to 2010, by Indigenous status
Indigenous Non-Indigenous UnknownYear n %* n %* n %*2004 37 11.6 251 78.7 31 9.72005 49 15.0 232 70.9 46 14.12006 28 10.0 219 77.9 34 12.12007 0 0.0 148 89.7 17 10.32008 3 1.1 247 89.2 27 9.72009 8 1.4 515 91.3 41 7.32010 1 0.4 250 93.6 16 6.0
* Proportion of total hepatitis A cases notifi ed in that year.
Table 10: Place of acquisition for cases of hepatitis A, 2004 to 2010, Australia
Locally-acquired
Overseas-acquired Unknown
Year n %* n %* n %*2004 143 44.8 91 28.5 85 26.62005 140 42.8 151 46.2 36 11.02006 102 36.3 69 24.6 110 39.12007 74 44.8 38 23.0 53 32.12008 99 35.7 53 19.1 125 45.12009 417† 73.9 68 12.1 79 14.02010 117 43.8 147 55.1 3 1.1
* Proportion of total hepatitis A notifi ed in that year. † High proportion of locally-acquired hepatitis A cases in
2009 due to outbreak associated with the consumption of semi-dried tomatoes.
Figure 6: Notifications of Shiga toxin-producing Escherichia coli , Australia, 2010, by age group
0
1
2
3
4
5
6
7
8
9
10
0-4
5-9
10-1
4
15-1
9
20-2
4
25-2
9
30-3
4
35-3
9
40-4
4
45-4
9
50-5
4
55-5
9
60-6
4
65-6
9
70-7
4
75-7
9
80-8
4
85+
Num
ber o
f not
ifica
tions
Age group (years)

CDI Vol 36 No 3 2012 E221
OzFoodNet Annual reports
PCR targeting serotype-specific genes), followed by O111 (5 cases, 9.8%). A serotype was not identified in 36% (29/80) of cases. This is consistent with the serogroups reported in 2009.
Haemolytic uraemic syndrome
In 2010, OzFoodNet sites reported 9 cases of HUS (Table 1), compared with a mean of 20 cases per year between 2005 and 2009. Similarly to previous years, the majority of notifications were in children, with 66.7% (6 cases) of cases aged 0–4 years.
Not all diagnoses of HUS are related to enteric pathogens (including those potentially transmitted by food), but in Australia, cases are commonly asso-ciated with STEC. In 2010 however, an antecedent STEC infection was reported in only 1 case. In 5 cases Streptococcus pneumoniae was detected and for the remaining 3 cases no organism was identified as the causative agent.
Outbreaks of gastrointestinal illness
In 2010, OzFoodNet sites reported 1,640 outbreaks of gastrointestinal illness (including foodborne disease), affecting 30,193 people, of whom 722 were hospitalised (Table 11). There were 89 deaths dur-ing these outbreaks. This compares with a 5 year mean of 1,483 outbreaks.
Person-to-person outbreaks
In 2010, 81% of reported outbreaks were transmitted from person-to-person. There were 26,661 illnesses associated with these outbreaks, 519 people were hospitalised and 71 people died. Outbreaks were most commonly reported from aged care facili-ties (57%, 752/1,330) or child-care centres (22%, 297/1,330). Outbreaks were most commonly due to norovirus (42%, 564/1,330) or were of unknown aetiology (36%, 485/1,330).
Animal-to-person outbreaks
One outbreak was reported to have been due to ani-mal-to-person transmission. The outbreak affected 10 children in a child-care centre following a visit to a farm, and was caused by Cryptosporidium sp.
Outbreaks with unknown mode of transmission
There were 155 outbreaks in which cases were clustered in time, place or person, but investigators were unable to determine the mode of transmis-sion (Table 11). These outbreaks affected 1,376 people, 45 of whom were hospitalised and three died. Outbreaks were most commonly reported from aged care facilities (50%, 78/155), the com-munity (11%, 17/155) and child-care centres (10%, 15/155). Salmonella was the aetiological agent in 15 of these outbreaks and norovirus in 15 outbreaks. In 118 outbreaks (76%), both the aetiology and the transmission mode remain unknown.
Foodborne outbreaks
In 2010, OzFoodNet sites reported 154 outbreaks of foodborne and suspected foodborne illness. These outbreaks affected 2,146 people, of whom 157 were hospitalised and 15 died (Table 11). This compares with a 5 year mean of 127 outbreaks. The overall rate of foodborne disease outbreaks in 2010 was 6.9 per million population (Table 12). The highest rates were in the Northern Territory (30.5 per million) and Tasmania (11.8 per million), although these jurisdictions reported only 7 and 6 outbreaks respec-tively. The largest number of outbreaks was reported from New South Wales (55 outbreaks).
Aetiologies
More than one-third of all foodborne and sus-pected outbreaks (34%, 53/154) were due to S. Typhimurium. Other frequently reported aetiolo-gies were Campylobacter and Clostridium perfringens
Table 11: Outbreaks of gastroenteritis reported to state and territory health departments, Australia, 2010
Transmission modeNumber of outbreaks Number ill
Number hospitalised Number died
Foodborne and suspected foodborne 154 2,146 157 15Person-to-person 1,330 26,661 519 71Animal-to-person 1 10 1 0Unknown mode (Salmonella cluster) 15 87 12 0Unknown mode (other pathogen) 22 251 15 0Unknown mode (unknown pathogen) 118 1,038 18 3Total 1,640 30,193 722 89

E222 CDI Vol 36 No 3 2012
Annual reports OzFoodNet
(6% each, 9/154) (Table 13). More than a third of all outbreaks were of unknown aetiology (36%, 55/154) compared with 27% (44/163) in 2009.
Food vehicles
Outbreaks were categorised as being attributable to one of 18 foods (17 described by Painter et al 20 with an additional category for lamb) if a single contami-
nated ingredient was identified or if all ingredients belonged to that food category. Outbreaks that could not be assigned to one of the 18 categories, or for which the report contained insufficient information for food category assignment were not attributed to any food category. 21
In 43 foodborne outbreaks (28%), investigators attributed the outbreak to a single food (Table 13),
Table 12: Outbreaks of foodborne disease, Australia, 2010, by OzFoodNet site
State or territoryNumber of outbreaks Number ill
Mean size (persons)
Number hospitalised
Outbreaks per million population
ACT 3 59 19.7 5 8.4 NSW 55 641 11.7 80 7.6 NT 7 121 17.3 4 30.5 Qld 23 184 8.0 13 5.1 SA 8 134 16.8 6 4.9 Tas 6 157 26.2 2 11.8 Vic 39 399 10.2 30 7.0 WA 11 128 11.6 9 4.8 Multi-jurisdictional 2 323 161.5 8 N/A Total 154 2,146 13.9 157 6.9
Table 13: Number of reported foodborne disease outbreaks and number affected, Australia, 2010, by aetiology and food category
Agent category
Total number of outbreaks
Total number ill
Attributed to a single food category
Attributed to >1 food category
Not attributed to a food category
Number of
outbreaks Number ill
Number of
outbreaks Number ill
Number of
outbreaks Number illSalmonella Typhimurium
53 746 23 416 10 169 20 161
Clostridium perfringens
10 134 1 4 0 0 9 130
Campylobacter 9 103 2 15 1 18 6 70Ciguatera fi sh poisoning
6 22 6 22 0 0 0 0
Norovirus 8 117 0 0 1 17 7 100Other Salmonella serotypes
5 47 2 31 1 7 2 9
Listeria monocytogenes
2 15 1 9 1 6 0 0
Staphylococcus aureus
2 9 2 9 0 0 0 0
Cyclospora sp. 1 314 0 0 0 0 1 314Bacillus cereus 1 24 1 24 0 0 0 0Scrombroid confi rmed
1 4 1 4 0 0 0 0
Other viral 1 19 0 0 0 0 1 19Unknown 55 592 4 21 9 88 42 483Total 154 2,146 43 555 23 305 88 1,286
CDI Vol 36 No 3 2012 E223
OzFoodNet Annual reports
in another 23 outbreaks (15%), the implicated dish contained a mix of ingredients, and no single ingre-dient was implicated. The majority of outbreaks (57%, 88/154) could not be attributed to a particular food due to a lack of evidence.
In outbreaks attributed to a single food (n=43), the foods most frequently implicated were eggs (49%, 21/43), fish (19%, 8/43), poultry (9%, 4/43) and fruits/nuts (7%, 3/43). In these outbreaks, 71% of those affected were in outbreaks involving eggs (394/555) whilst outbreaks involving poultry accounted for a further 8% (45/555) of cases.
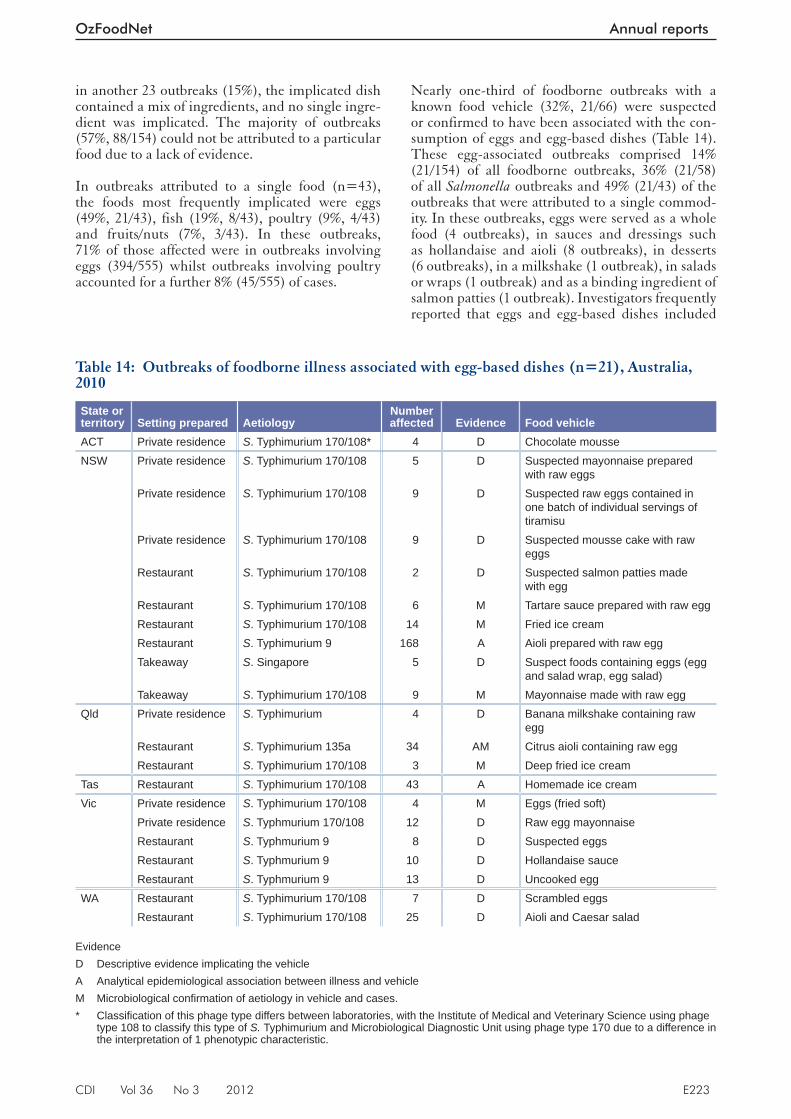
Nearly one-third of foodborne outbreaks with a known food vehicle (32%, 21/66) were suspected or confirmed to have been associated with the con-sumption of eggs and egg-based dishes (Table 14). These egg-associated outbreaks comprised 14% (21/154) of all foodborne outbreaks, 36% (21/58) of all Salmonella outbreaks and 49% (21/43) of the outbreaks that were attributed to a single commod-ity. In these outbreaks, eggs were served as a whole food (4 outbreaks), in sauces and dressings such as hollandaise and aioli (8 outbreaks), in desserts (6 outbreaks), in a milkshake (1 outbreak), in salads or wraps (1 outbreak) and as a binding ingredient of salmon patties (1 outbreak). Investigators frequently reported that eggs and egg-based dishes included
Table 14: Outbreaks of foodborne illness associated with egg-based dishes (n=21), Australia, 2010
State or territory Setting prepared Aetiology
Number affected Evidence Food vehicle
ACT Private residence S. Typhimurium 170/108* 4 D Chocolate mousseNSW Private residence S. Typhimurium 170/108 5 D Suspected mayonnaise prepared
with raw eggsPrivate residence S. Typhimurium 170/108 9 D Suspected raw eggs contained in
one batch of individual servings of tiramisu
Private residence S. Typhimurium 170/108 9 D Suspected mousse cake with raw eggs
Restaurant S. Typhimurium 170/108 2 D Suspected salmon patties made with egg
Restaurant S. Typhimurium 170/108 6 M Tartare sauce prepared with raw eggRestaurant S. Typhimurium 170/108 14 M Fried ice creamRestaurant S. Typhimurium 9 168 A Aioli prepared with raw eggTakeaway S. Singapore 5 D Suspect foods containing eggs (egg
and salad wrap, egg salad)Takeaway S. Typhimurium 170/108 9 M Mayonnaise made with raw egg
Qld Private residence S. Typhimurium 4 D Banana milkshake containing raw egg
Restaurant S. Typhimurium 135a 34 AM Citrus aioli containing raw eggRestaurant S. Typhimurium 170/108 3 M Deep fried ice cream
Tas Restaurant S. Typhimurium 170/108 43 A Homemade ice creamVic Private residence S. Typhimurium 170/108 4 M Eggs (fried soft)
Private residence S. Typhmurium 170/108 12 D Raw egg mayonnaiseRestaurant S. Typhmurium 9 8 D Suspected eggsRestaurant S. Typhmurium 9 10 D Hollandaise sauceRestaurant S. Typhmurium 9 13 D Uncooked egg
WA Restaurant S. Typhimurium 170/108 7 D Scrambled eggsRestaurant S. Typhimurium 170/108 25 D Aioli and Caesar salad
Evidence D Descriptive evidence implicating the vehicle A Analytical epidemiological association between illness and vehicle M Microbiological confi rmation of aetiology in vehicle and cases. * Classifi cation of this phage type differs between laboratories, with the Institute of Medical and Veterinary Science using phage
type 108 to classify this type of S. Typhimurium and Microbiological Diagnostic Unit using phage type 170 due to a difference in the interpretation of 1 phenotypic characteristic.
E224 CDI Vol 36 No 3 2012
Annual reports OzFoodNet
raw eggs and/or were insufficiently cooked (95%, 20/21). In 8 of these outbreaks, eggs were confirmed as the source of illness through microbiological or analytical evidence or both, whilst in the remaining 13 outbreaks, eggs were suspected as the food vehi-cle due to descriptive evidence collected during the course of the outbreak.
Settings
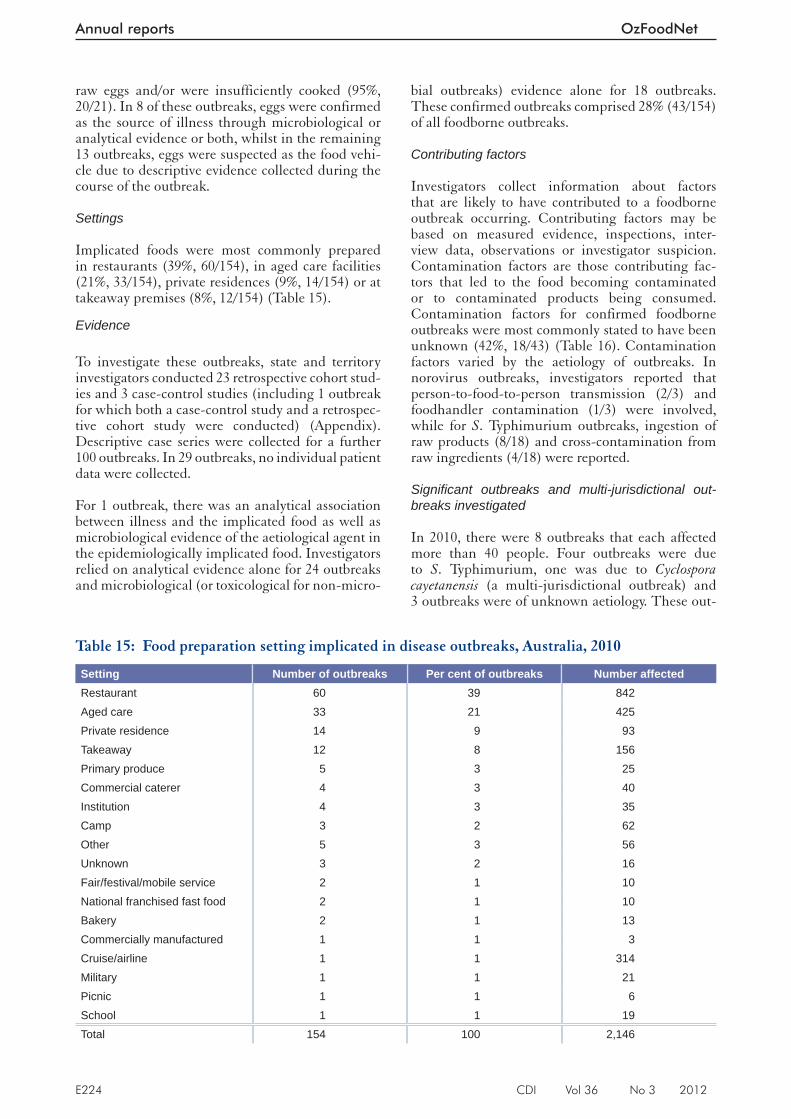
Implicated foods were most commonly prepared in restaurants (39%, 60/154), in aged care facilities (21%, 33/154), private residences (9%, 14/154) or at takeaway premises (8%, 12/154) (Table 15).
Evidence
To investigate these outbreaks, state and territory investigators conducted 23 retrospective cohort stud-ies and 3 case-control studies (including 1 outbreak for which both a case-control study and a retrospec-tive cohort study were conducted) (Appendix). Descriptive case series were collected for a further 100 outbreaks. In 29 outbreaks, no individual patient data were collected.
For 1 outbreak, there was an analytical association between illness and the implicated food as well as microbiological evidence of the aetiological agent in the epidemiologically implicated food. Investigators relied on analytical evidence alone for 24 outbreaks and microbiological (or toxicological for non-micro-
bial outbreaks) evidence alone for 18 outbreaks. These confirmed outbreaks comprised 28% (43/154) of all foodborne outbreaks.
Contributing factors
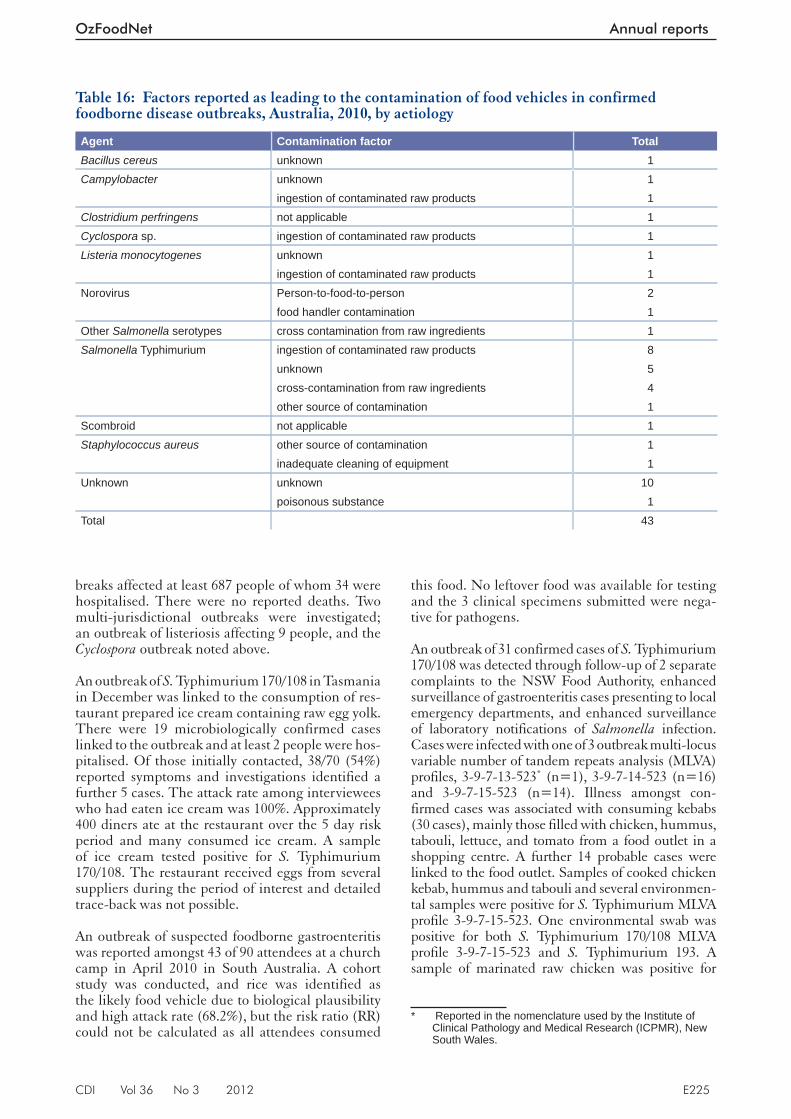
Investigators collect information about factors that are likely to have contributed to a foodborne outbreak occurring. Contributing factors may be based on measured evidence, inspections, inter-view data, observations or investigator suspicion. Contamination factors are those contributing fac-tors that led to the food becoming contaminated or to contaminated products being consumed. Contamination factors for confirmed foodborne outbreaks were most commonly stated to have been unknown (42%, 18/43) (Table 16). Contamination factors varied by the aetiology of outbreaks. In norovirus outbreaks, investigators reported that person-to-food-to-person transmission (2/3) and foodhandler contamination (1/3) were involved, while for S . Typhimurium outbreaks, ingestion of raw products (8/18) and cross-contamination from raw ingredients (4/18) were reported.
Signifi cant outbreaks and multi-jurisdictional out-breaks investigated
In 2010, there were 8 outbreaks that each affected more than 40 people. Four outbreaks were due to S . Typhimurium, one was due to Cyclospora cayetanensis (a multi-jurisdictional outbreak) and 3 outbreaks were of unknown aetiology. These out-
Table 15: Food preparation setting implicated in disease outbreaks, Australia, 2010
Setting Number of outbreaks Per cent of outbreaks Number affectedRestaurant 60 39 842Aged care 33 21 425Private residence 14 9 93Takeaway 12 8 156Primary produce 5 3 25Commercial caterer 4 3 40Institution 4 3 35Camp 3 2 62Other 5 3 56Unknown 3 2 16Fair/festival/mobile service 2 1 10National franchised fast food 2 1 10Bakery 2 1 13Commercially manufactured 1 1 3Cruise/airline 1 1 314Military 1 1 21Picnic 1 1 6School 1 1 19Total 154 100 2,146
CDI Vol 36 No 3 2012 E225
OzFoodNet Annual reports
breaks affected at least 687 people of whom 34 were hospitalised. There were no reported deaths. Two multi-jurisdictional outbreaks were investigated; an outbreak of listeriosis affecting 9 people, and the Cyclospora outbreak noted above.
An outbreak of S. Typhimurium 170/108 in Tasmania in December was linked to the consumption of res-taurant prepared ice cream containing raw egg yolk. There were 19 microbiologically confirmed cases linked to the outbreak and at least 2 people were hos-pitalised. Of those initially contacted, 38/70 (54%) reported symptoms and investigations identified a further 5 cases. The attack rate among interviewees who had eaten ice cream was 100%. Approximately 400 diners ate at the restaurant over the 5 day risk period and many consumed ice cream. A sample of ice cream tested positive for S. Typhimurium 170/108. The restaurant received eggs from several suppliers during the period of interest and detailed trace-back was not possible.
An outbreak of suspected foodborne gastroenteritis was reported amongst 43 of 90 attendees at a church camp in April 2010 in South Australia. A cohort study was conducted, and rice was identified as the likely food vehicle due to biological plausibility and high attack rate (68.2%), but the risk ratio (RR) could not be calculated as all attendees consumed
this food. No leftover food was available for testing and the 3 clinical specimens submitted were nega-tive for pathogens.
An outbreak of 31 confirmed cases of S. Typhimurium 170/108 was detected through follow-up of 2 separate complaints to the NSW Food Authority, enhanced surveillance of gastroenteritis cases presenting to local emergency departments, and enhanced surveillance of laboratory notifications of Salmonella infection. Cases were infected with one of 3 outbreak multi-locus variable number of tandem repeats analysis (MLVA) profiles, 3-9-7-13-523 * (n=1), 3-9-7-14-523 (n=16) and 3-9-7-15-523 (n=14). Illness amongst con-firmed cases was associated with consuming kebabs (30 cases), mainly those filled with chicken, hummus, tabouli, lettuce, and tomato from a food outlet in a shopping centre. A further 14 probable cases were linked to the food outlet. Samples of cooked chicken kebab, hummus and tabouli and several environmen-tal samples were positive for S. Typhimurium MLVA profile 3-9-7-15-523. One environmental swab was positive for both S. Typhimurium 170/108 MLVA profile 3-9-7-15-523 and S. Typhimurium 193. A sample of marinated raw chicken was positive for
* Reported in the nomenclature used by the Institute of Clinical Pathology and Medical Research (ICPMR), New South Wales.
Table 16: Factors reported as leading to the contamination of food vehicles in confirmed foodborne disease outbreaks, Australia, 2010, by aetiology
Agent Contamination factor TotalBacillus cereus unknown 1Campylobacter unknown 1
ingestion of contaminated raw products 1Clostridium perfringens not applicable 1Cyclospora sp. ingestion of contaminated raw products 1Listeria monocytogenes unknown 1
ingestion of contaminated raw products 1Norovirus Person-to-food-to-person 2
food handler contamination 1Other Salmonella serotypes cross contamination from raw ingredients 1Salmonella Typhimurium ingestion of contaminated raw products 8
unknown 5cross-contamination from raw ingredients 4other source of contamination 1
Scombroid not applicable 1Staphylococcus aureus other source of contamination 1
inadequate cleaning of equipment 1Unknown unknown 10
poisonous substance 1Total 43

E226 CDI Vol 36 No 3 2012
Annual reports OzFoodNet
Salmonella Infantis. The business temporarily closed and stopped preparing chicken kebab logs on site to reduce the risk of cross-contamination.
Public health staff in the Australian Capital Territory identified a link between cases and a local takeaway salad bar after investigating a higher than expected number of Salmonella infections, including hospi-talised cases. Investigators identified 47 outbreak cases, 41 of which were laboratory confirmed with S. Typhimurium 170/108 infection (MLVA 3-9-7-13-523* or MLVA 3-9-7-14-523). Cases reported eating a variety of salads purchased from the salad bar, includ-ing tandoori chicken, chicken and avocado, chicken pesto, roast pumpkin fetta and baby spinach, green beans and asparagus, and Caesar and Greek salads. Salmonella was isolated from 2 food samples; a chicken pesto salad and a Greek salad. Environmental swabs yielded Klebsiella oxytoca and Enterobacter cloacae and an environmental health inspection identified issues including inadequate cleaning and disinfection, and ready-to-eat foods being held at inappropriate tem-peratures. Cross-contamination of ready-to-eat foods from an unknown source was the suspected cause.
In July 2010, an outbreak of gastroenteritis was reported in an aged care facility in Tasmania with 49/221 (22%) residents and 21/96 (22%) staff becoming ill. Seven out of 11 stool samples collected tested positive for norovirus. No food samples were available for testing as leftover food was disposed of at the end of each day. Many cases suffered from dementia therefore detailed food histories could not be collected for the majority of residents. Food histories were only obtained from 4 residents; 3 cases and 1 non-case. The aged care facility also delivered meals to the community and 82% (36/44) of the meal recipients were interviewed by phone. Six recipients reported developing symptoms of gastro-enteritis. Those who became ill were more likely to have reported consuming pork sausages and gravy (4/7, attack rate 57%, crude relative risk: 3.71; 95% confidence interval: [CI] 0.95, 14.55), but numbers were small and it is unclear if this meal was also consumed by the residents who became ill.
An outbreak of S. Typhimurium 9 (MLVA 2-27-16-12-526) in regional New South Wales was associated with eating products containing aioli prepared with raw eggs from a takeaway burger business. Interviews were conducted with 189 people who ate at the outlet over a period of 6 days and 168 of these reported symp-toms of diarrhoea and/or vomiting, fever, abdominal pain, myalgia and bloody stools. Stool specimens for 104 of these people were laboratory confirmed S. Typhimurium 9 MLVA type 2-27-16-12-526. The outbreak strain was also isolated from aioli prepared with raw egg and from swabs of 2 chopping boards. The business was closed under a NSW Food Authority prohibition order and reopened after implementation
of revised cleaning and sanitising procedures and on the provision that they would cease the production of raw egg sauces. The egg farm that supplied the eggs used to prepare the aioli was inspected but no Salmonella was detected on the farm.
An outbreak of Cyclospora cayetanensis affected 314 people, the majority from Western Australia, but also from New South Wales (1 case), South Australia (1 case), Victoria (4 cases) and Queensland (2 cases). Cases were amongst passengers and crew of 2 suc-cessive cruises on the same ship that departed from and returned to Fremantle, Western Australia in May and June 2010, visiting south-east Asian des-tinations. 22 Follow-up of laboratory confirmed cases and passenger enquiries identified 34 ill passengers associated with the first cruise, with 26 of these being laboratory confirmed. From the second cruise 232 passengers and 48 crew members were reported to have been affected, with 46 passengers and 1 crew member laboratory confirmed. A case-control study conducted among crew members focused on fresh produce and water consumed on board, and on-shore visits. In a univariate analysis, lettuce was mostly strongly associated with illness (Odds Ratio [OR] = 4.7, 95% CI 1.7–14.1, P = 0.0005). Eating rockmelon, chives and lettuce were significantly associated with illness ( P < 0.05) in a multivariate analysis. It was concluded that illness was most likely related to eating fresh produce items taken on board in a south-east Asian port during the first cruise and also used during the second voyage. However, the case-control study did not provide enough evidence to definitively determine which fresh produce item was the likely cause of illness. Australia advised the International Health Regulations (IHR) National Focal Point of the relevant country as per Article 44 (Collaboration and Assistance) of the IHR (2005) to facilitate any local epidemiological investigations or follow-up.
An increase in a common strain of invasive L. mono-cytogenes (PCR serogroup 1/2b, 3b, 7, binary gene type 158 and PFGE 121:119:1 † ) infection was observed on the eastern seaboard of Australia, and a multi-jurisdictional outbreak investigation was commenced. Between January and August 2010, 9 cases of listeriosis met the case definition (cases occurring since January 2010 that were serogroup 1/2b, 3b, 7, binary gene type 158 and the Medical Diagnostic Unit designated PFGE 121:119:1 or serogroup not established, binary gene type 158 and Medical Diagnostic Unit designated PFGE 122:4N:1). A case–case analysis using non-outbreak cases as controls found that outbreak-associated
* Reported in the nomenclature used by the Institute of Clinical Pathology and Medical Research (ICPMR), New South Wales.
† Reported in the nomenclature used by the Microbiological Diagnostic Unit, University of Melbourne, Victoria.
CDI Vol 36 No 3 2012 E227
OzFoodNet Annual reports
cases were more likely to have consumed rockmel-ons (OR = 11.1, 95% CI 1.0–550.8, P = 0.02). As part of a separate investigation in one jurisdiction, 3 samples taken from a fruit salad manufacturer (honey dew melon washings, fruit rinse water and juice from mixed fruit waste) were positive for a combination of the multi-jurisdictional outbreak strains of L. monocytogenes . In addition, 2 samples of fruit salad sampled in May were also positive for the outbreak strains. These samples were taken by local government authorities from two separate food premises as part of their routine food sampling program. These 2 food premises reported that they purchased a combination of different whole fruits (including honey dew and rockmelon) to make the fruit salad at their retail food outlets. Trace-back of the melons used by the fruit salad manufacturer found that they were produced in a particular region of New South Wales, where melons are harvested between January and April each year. Following this outbreak, the NSW Food Authority assisted the New South Wales Department of Primary Industries to develop an information package for producers and packers increasing awareness of the outbreak and the risks of L. monocytogenes on melons as well as recommending effective mitigation strategies to prevent contamination.
Discussion
This report documents the incidence of gastroin-testinal diseases commonly transmitted by food in Australia during 2010. The OzFoodNet surveillance network concentrates its efforts on the surveillance and outbreak investigation of foodborne diseases. This is based on partnerships with a range of stakehold-ers, including state and territory health departments, food safety regulators, public health laboratories, and government departments of primary industries. These partnerships and the analysis of data on notified cases and outbreaks contribute to public health action, the prevention of disease and the assessment of food safety policies and campaigns . A national program of surveillance for foodborne diseases and outbreak investigation such as OzFoodNet has many benefits including identifying foods that cause human illness through investigation of outbreaks that occur across state and territory borders . Continuing to strengthen the quality of these data will ensure their use by agen-cies to develop food safety policy contributing to the prevention of foodborne illness . This aims to reduce the cost of foodborne illness to the community, such as healthcare costs and lost productivity, and those to industry such as product recalls and loss of reputation.
Campylobacter continues to be the most frequently notified enteric pathogen under surveillance of OzFoodNet despite not being notifiable in New South Wales. The number of annual notifications has fluctuated between 14,000 and 17,000 annually
over the past 10 years. However, Campylobacter was identified as the aetiological agent in only nine of 154 foodborne disease outbreaks reported by OzFoodNet during 2010. Three of these were attributed to foodborne transmission through con-taminated chicken. In the remaining 6 outbreaks, investigators were unable to identify a food vehicle or source of infection.
There is likely to be under-reporting of Campylobacter outbreaks in Australia due to the lack of an efficient standardised discriminatory typing scheme and the likely under-reporting of smaller household outbreaks by the public and/or treating medical practitioner to public health authorities. A more rapid and sustainable typing method would assist OzFoodNet’s activities given the large burden of Campylobacter infection in the community. 23–25 Evidence from these outbreak investigations would provide important risk factor information for public health action by food safety authorities to prevent further cases of disease.
In Australia, poultry is the primary source of Campylobacter infection. OzFoodNet estimates that about 75% of Campylobacter infections in the general population are acquired through foodborne transmission with approximately 30% of infec-tions attributed to eating chicken. 26 Other cases of foodborne infection are likely to occur through food vehicles other than chicken, including foods subject to cross-contamination from raw products, especially chicken. 27,28
The value of collaboration between public health authorities, food safety regulators and industry to reduce the incidence of foodborne Campylobacter infection has been recently demonstrated in New Zealand. 29 The notification rate of campylobacterio-sis in New Zealand declined from an average annual rate of 353.8 per 100,000 population for the period 2002–2006 to an annual rate of 161.5 per 100,000 in 2008. A similar decline was seen for hospitalisations. This reduction was attributed to the introduction of a range of voluntary and regulatory interventions implemented as part of the risk management strat-egy introduced by the New Zealand Food Safety Authority in late 2006. 30 Control of Campylobacter in poultry meat is a major challenge for food safety authorities, regulators, agencies and industry rep-resentatives. The Primary Production Standard for Poultry Meat was implemented in May 2012 to assist in reducing the incidence of campylobacteri-osis and salmonellosis in Australia. 31 The standard requires poultry growers to identify and control food safety hazards, verify the effectiveness of the control measures, and have the capacity to trace their prod-ucts. Public health strategies aimed at educating the consumer should also be included as one of the interventions in a combined approach to reduce the
E228 CDI Vol 36 No 3 2012
Annual reports OzFoodNet
disease burden from Campylobacter . Monitoring the incidence of notified campylobacteriosis to the NNDSS together with poultry consumption rates in the Australian population would assist in measuring the effectiveness of these interventions. Any decline in the incidence of campylobacteriosis attributed to public health or primary industry interventions in Australia would need to account for trends in poul-try consumption rates.
In 2010, OzFoodNet sites reported 154 foodborne or suspected foodborne outbreaks, including 2 multi-jurisdictional outbreak investigations. Salmonella continues to be the leading cause of reported out-breaks of foodborne illness in Australia, with 58 out-breaks due to this pathogen, the majority of them due to S. Typhimurium (n = 53).
Past OzFoodNet annual reports identified fish as the most common food vehicle for identified outbreaks in Australia 32 although they usually only affected small numbers of people. The most com-mon intoxications associated with fish were cigu-atera and histamine poisoning. It was encouraging to note that there were only 8 outbreaks, including six from ciguatera poisoning, associated with fish in 2010; a reduction from 16 in 2005. 32
OzFoodNet has identified a national increase since late 2008, in the number of Salmonella outbreaks associated with the consumption of raw or minimally cooked eggs. These outbreaks are usually associated with S. Typhimurium, most commonly phage type 170/108 and related MLVA types. In 2010, investi-gators identified 21 outbreaks associated with raw or minimally cooked egg dishes. S. Typhimurium 170/108 was identified in 13 of these outbreaks across a range of settings and food vehicles. Food vehicles included desserts commonly made with raw eggs, such as chocolate mousse and tiramisu, sauces (mayonnaise, aioli), milkshakes and cake mixture. Outbreaks were also associated with food items suspected to be cross-contaminated with eggs during their preparation.
These outbreak investigations highlight the continued importance of eggs as a source of sal-monellosis. A challenge in these outbreaks is to identify the factors that led to the outbreak. While the source of many of these outbreaks is likely to be from surface contamination of an egg, 33 the challenges are to determine if factors at time of food preparation were the main contributor to an outbreak. Authorities recognise that it is difficult to confidently identify the factors that lead to such outbreaks and continue to work towards a better understanding of the cause of contamination. 34 Further limitations of these investigations includes the difficulty in establishing a link between the outbreak setting or premises and egg suppliers,
as trace-back to producer or farm level was not always possible. Investigations are also limited, in some cases, by poor recall of food consumption. Associations between illness and the consumption of specific food items were sometimes difficult to establish, particularly because food items such as egg and chicken are commonly consumed in the community. In addition, eggs (especially raw eggs) as ingredients of food such as desserts and dressings are not always apparent to the consumers of these foods. To contribute to the prevention of further outbreaks, regulators could consider prohibiting the sale of raw or minimally cooked egg products in commercial settings or recommend the use of pasteurised egg products in dishes that are to be served raw or lightly cooked.
Food Standards Australia New Zealand has coordi-nated the development of the Primary Production and Processing Standard for Eggs and Egg Products, which will be implemented from 26 November 2012. 35 The work has involved a risk assessment of egg pro-duction and processing in Australia and extensive consultation with industry, scientists, government agencies and the public. The new Standard places legal obligations on egg producers and processors to introduce measures to reduce food safety hazards. It also includes traceability of individual eggs for sale or used to produce egg pulp. While the onus is on the food business to have systems in place that demonstrate compliance with the Standard, the egg industry must be encouraged to work even more closely with health departments and food safety regulators to achieve demonstrable decreases in the incidence of salmonellosis.
OzFoodNet has shown that use of raw or minimally cooked eggs is currently the single largest cause of foodborne Salmonella outbreaks and therefore likely to be a significant source of the national increase in ‘sporadic’ salmonellosis seen in recent years. Measures to address this burden of illness require the collaboration of industry, food safety regulators and health representatives.
Cases of hepatitis A continued to be associated with a sustained outbreak of 415 locally-acquired cases of hepatitis A that commenced in 2009 and lasted until March 2010. 14 Detailed investigations impli-cated semi-dried tomatoes as the likely source of this outbreak. 13,14 Issues associated with this outbreak will continue to provide challenges for public health agencies, laboratories, industry, and food regulators. The challenges include laboratory capacity to detect viruses in food and trace-back complexities associated with international food distribution. 13 Jurisdictions investigate locally-acquired cases of hepatitis A with the aim of identifying cases associated with foodborne transmission or other risk factors for illness, and to offer contacts post-exposure prophylaxis.

CDI Vol 36 No 3 2012 E229
OzFoodNet Annual reports
Notified cases of hepatitis A infection in Indigenous people decreased from 49 cases in 2005 to a single case in 2010. This decrease occurred following the targeted hepatitis A vaccination program, which was introduced at the end of 2005. We now see the near elimination of notified cases of locally-acquired hepatitis A from the Indigenous population in Australia. 36
In 2010, OzFoodNet continued to investigate a clus-ter of cases of thyroid dysfunction associated with a soy milk product that was fortified with seaweed and first reported in 2009. 14 Testing of product samples showed unusually high levels of iodine as a cause of thyroid dysfunction leading to a recall of these products. OzFoodNet coordinated the national col-lection of epidemiological and clinical data on cases (n=50). The response to this incident included the provision of advice to medical practitioners on hyper-thyroidism in infants, developed in consultation with endocrinologists and public health physicians. This advice was circulated through professional networks to physicians and general practitioners.
This report summarises 3 preventable infections more commonly associated with travel overseas; typhoid (97% of cases), hepatitis A (55% of cases) and S. Enteritidis (88% of cases). Travellers are encouraged to consider the information available on the Smartraveller travel health web site (www.smartraveller.gov.au) and to seek medical advice prior to travel. Smartraveller provides specific country information to travellers about health risks. This advice, including vaccination where available, can minimise or prevent the risk of these and other infections commonly associated with travel overseas.
OzFoodNet recognises some of the limitations of the data used in this report. Where there are small numbers of notifications, caution must be used in comparisons between jurisdictions and over time. Some of the most common enteric pathogens are not notifiable, particularly norovirus and Clostridium perfringens , which is why investigation of outbreaks is important. A further limitation relates to the outbreak data provided by OzFoodNet sites for this report and the potential for variation in categoris-ing features of outbreaks depending on investigator interpretation and circumstances. State and terri-tory representatives are involved in a continuous program aimed at harmonising the collection and recording of the outbreak data via the Outbreak Register Working Group.
In 2009, OzFoodNet began requesting molecular subtyping (including at least PCR serogroup and binary type) for all cases of listeriosis. National col-lation of subtyping information and interview data allow OzFoodNet epidemiologists to rapidly detect clusters and analyse exposure information for any
possible common source(s). The OzFoodNet plan for the National Surveillance of human Listeria monocytogenes infection was endorsed by the Public Health Laboratory Network on 21 September 2010. It is a flexible and stable system that is able to produce timely surveillance updates and analysis. Cooperation between OzFoodNet epidemiologists and public health laboratories will continue to be an important foundation of this system. The enhanced listeriosis surveillance system identified one out-break during 2010 with an epidemiological link to melons. Pre-cut melons and pre-made fruit salad may present higher risks of foodborne transmission of Listeria because once the bacterium is introduced into a food (from the surface or through processing equipment) it can proliferate under cold storage. People who may be at higher risk of infection (the elderly, pregnant women and other persons who are immunocompromised) should avoid these foods. While the scale of the outbreak investigated in 2010 was small, it was an excellent ‘proof of concept’ for the Listeria surveillance plan. During an outbreak, effective partnerships between OzFoodNet epide-miologists, public health laboratory staff and food regulatory personnel facilitated sharing of epide-miological and microbiological intelligence that enabled the early detection and characterisation of this outbreak leading to timely public health action.
Acknowledgements
We thank the many epidemiologists, Masters of Applied Epidemiology scholars, Department of Health and Ageing graduate trainees, project offic-ers, interviewers and research assistants at each of the OzFoodNet sites who contributed to this report. We acknowledge the work of various public health professionals and laboratory staff around Australia who interviewed patients, tested specimens, typed isolates and investigated outbreaks. We would par-ticularly like to thank jurisdictional laboratories, the Microbiological Diagnostic Unit Public Health Laboratory, the Australian Salmonella Reference Centre at the Institute of Medical and Veterinary Science, Queensland Health Scientific Services, PathWest and the National Enteric Pathogen Surveillance Scheme for their help with foodborne disease surveillance in 2010. The quality of their work was the foundation of this report. OzFoodNet is an initiative of the Australian Government.
In 2010, the OzFoodNet Working Group and additional contributors were (in alphabetical order): Kate Astridge (MAE), Robert Bell (Qld), Barbara Butow (FSANZ), Barry Combs (WA), Amalie Dyda (SA), Neil Franklin (NSW), Gerard Fitzsimmons (DoHA), Robyn Gibbs (WA), Debra Gradie (DoHA), Joy Gregory (Vic), Jenine Gunn (NT), Michelle Harlock (NT), Cherie Heilbronn (Hunter), Geoff Hogg (MDU), Katina Kardamanidas (NSW),
E230 CDI Vol 36 No 3 2012
Annual reports OzFoodNet
Martyn Kirk (DoHA), Katrina Knope (DoHA), Karin Lalor (Vic), Robyn Leader (DoHA), Lisa McCallum (SA), Charlotte McKercher (Tas), Megge Miller (SA), Cameron Moffatt (ACT), Sally Munnoch (HNE Health), Nevada Pingault (WA), Jane Raupach (SA), Craig Shadbolt (NSWFA), Timothy Sloan-Gardner (DoHA), Russell Stafford (Qld) and Nicola Stephens (Tas).
Author details Correspondence: Mr Gerard Fitzsimmons, Coordinating Epidemiologist, OzFoodNet, Office of Health Protection, Australian Government Department of Health and Ageing, GPO Box 9848, MDP 14, CANBERRA ACT 2601. Telephone: +61 2 6289 2748. Facsimile: +61 2 6289 2500. Email: [email protected]
References 1. Hall G, Kirk MD, Becker N, Gregory JE, Unicomb L,
Millard G, et al. Estimating foodborne gastroenteritis, Australia . Emerg Infect Dis 2005;11(8):1257–1264.
2. Centers for Disease Control and Prevention. Preliminary FoodNet data on the incidence of infection with pathogens transmitted commonly through food-10 States, 2008 . MMWR Morb Mortal Wkly Rep 2009;58(13):333–337.
3. Allos BM, Moore MR, Griffin PM, Tauxe RV. Surveillance for sporadic foodborne disease in the 21st century: the FoodNet perspective . Clin Infect Dis 2004;38:Suppl:S115–S120.
4. Hocking AD, editor. Foodborne microorganisms of public health significance . 6th edn: Australian Institute of Food Science and Technology Incorporated; 2003.
5. Majowicz S, Edge V, Fazil A, McNab W, Dore K, Sockett PN, et al. Estimating the under-reporting rate for infectious gastrointestinal illness in Ontario . Can J Public Health 2005;96(3):178–181.
6. Hall G, Raupach J, Yohannes K, Halliday L, Unicomb L, Kirk M. An estimate of the under-reporting of foodborne notifiable diseases: Salmonella , Campylobacter , Shiga-toxin producing Escherichia coli (STEC). Canberra: National Centre for Epidemiology and Population Health, Australian National University; 2006.
7. Rothman K, Greenland S. Modern epidemiology . Pennsylvania: Lippincott-Raven Publishers; 1998.
8. Kirk M, McKay I, Hall G, Dalton C, Stafford R, Unicomb L, et al. Food safety: foodborne disease in Australia: the OzFoodNet experience . Clin Infect Dis 2008;47(3):392–400.
9. Lindenmayer P. Networking for health protection: the Communicable Diseases Network Australia . Commun Dis Intell 2001;25(4):266–269.
10. Australian Bureau of Statistics. Population by Age and Sex, Regions of Australia, 2010. Canberra: Australian Bureau of Statistics; 2011. ABS Catalogue: 3235.0.
11. National Health Security Act 2007. Accessed on November 2009. Available from: http://www.comlaw.gov.au/Details/C2007A00174
12. Australian Bureau of Statistics. Population by Age and Sex, Australian States and Territories, Estimated Resident Population By Single Year of Age, Australia. Canberra: Australian Bureau of Statistics; 2010. ABS Catalogue: 3201.0.
13. Donnan EJ, Fielding JE, Gregory JE, Lalor K, Rowe S, Goldsmith P, et al. A multistate outbreak of hepatitis A associated with semidried tomatoes in Australia, 2009 . Clin Infect Dis 2012;54(6):775–781.
14. OzFoodNet Working Group. Monitoring the incidence and causes of diseases potentially transmitted by food in Australia: annual report of the OzFoodNet Network, 2009 . Commun Dis Intell 2010;34(4):396–426.
15. Hanna J, Hills S, Humpreys J. Impact of hepatitis A vaccina-tion on Indigenous children on notifications of hepatits A in north Queensland . Med J Aust 2004;181(9):482–485.
16. Minister for Health and Ageing. Media Release: Government provides free hepatitis A vaccine to Indigenous children. In: Australian Government Department of Health and Ageing, editor. Canberra; 2005.
17. Communicable Diseases Network Australia. Surveillance Case Definitions for the Australian National Notifiable Diseases Surveillance System. 2004. Accessed on 25 June 2012. Available from: http://www.health.gov.au/internet/main/publishing.nsf/Content/cdna-casedefi-nitions.htm/$File/casedef-V4.pdf
18. Combs B, Raupach J, Kirk M. Surveillance of Shiga toxigenic Escherichia coli in Australia. Commun Dis Intell 2005;29(4):366–369.
19. OzFoodNet Working Group. OzFoodNet quarterly report, 1 April to 30 June 2010 . Commun Dis Intell 2010;34(3):345–354.
20. Painter JA, Ayers T, Woodruff R, Blanton E, Perez N, Hoekstra RM, et al. Recipes for foodborne outbreaks: a scheme for categorizing and grouping implicated foods . Foodborne Pathog Dis 2009;6(10):1259–1264.
21. Centers for Disease Control and Prevention. Surveillance for Foodborne Disease Outbreaks—United States, 2008 . MMWR Morb Mortal Wkly Rep 2011;60(35):1197–1202.
22. Gibbs RA, Nanyonjo R, Pingault NM, Combs BG, Mazzucchelli T, Armstrong P, et al. An outbreak of Cyclospora infection on a cruise ship . Epidemiol Infect 2012:1–9.
23. Black AP, Kirk MD, Millard G. Campylobacter outbreak due to chicken consumption at an Australian Capital Territory restaurant . Commun Dis Intell 2006;30(3):373–377.
24. Unicomb LE, Fullerton KE, Kirk MD, Stafford RJ. Outbreaks of campylobacteriosis in Australia, 2001 to 2006 . Foodborne Pathog Dis 2009;6(10):1241–1250.
25. Gillespie IA, O’Brien SJ, Adak GK, Tam CC, Frost JA, Bolton FJ, et al. Point source outbreaks of Campylobacter jejuni infection—are they more common than we think and what might cause them? Epidemiol Infect 2003;130(3):367–375.
26. Stafford R, Schluter P, Wilson A, Kirk M, Hall G, Unicomb L, et al. Population-attributable risk estimates for risk fac-tors associated with Campylobacter infection, Australia . Emerg Infect Dis 2008;14(6):895–901.
27. Humphrey TJ, Martin KW, Slader J, Durham K. Campylobacter spp. in the kitchen: spread and persistence . Symp Ser Soc Appl Microbiol 2001(30):115S–120S.
29. Kusumaningrum HD, Riboldi G, Hazeleger WC, Beumer RR. Survival of foodborne pathogens on stain-less steel surfaces and cross-contamination to foods . Int J Food Microbiol 2003;85(3):227–236.
28. Sears A, Baker MG, Wilson N, Marshall J, Muellner P, Campbell DM, et al. Marked campylobacteriosis decline after interventions aimed at poultry, New Zealand . Emerg Infect Dis 2011;17(6):1007–1015.

CDI Vol 36 No 3 2012 E231
OzFoodNet Annual reports
30. New Zealand Food Safety Authority. Campylobacter risk management strategy, 2010–2013. 2010. Available from: http://www.foodsafety.govt.nz/elibrary/industry/Campylobacter_Risk-Comprehensive_Aimed.pdf
31. Food Standards Australia New Zealand. Standard 4.2.2 – Primary Production and Processing Standard for poultry meat. 2012. Accessed on 18 June 2012. Available from: http://www.health.gov.au/internet/main/publishing.nsf/Content/2329C0AF3BEE49F4CA2578D100007BD8/$File/1.%20Standard%20422%20Poultry%20meat.pdf
32. OzFoodNet Working Group. Burden and causes of foodborne disease in Australia: Annual report of the OzFoodNet network, 2005 . Commun Dis Intell 2006;30(3):278–300.
33. De Reu K, Grijspeerdt K, Messens W, Heyndrickx M, Uyttendaele M, Debevere J, et al. Eggshell factors influ-encing eggshell penetration and whole egg contamina-tion by different bacteria, including Salmonella enteritidis. Int J Food Microbiol 2006;112(3):253–260.
34. Daughtry B, Sumner J, Hooper G, Thomas C, Grimes T, Horn R, et al. National food safety risk profile of eggs and egg products: Australian Egg Corporation Limited; 2005.
35. Food Standards Australia New Zealand. Standard 4.2.5 – Primary Production and Processing Standard for Eggs and Egg Product. 2012. Accessed on 19 June 2012. Available from: http://www.health.gov.au/internet/main/publishing.nsf/Content/2329C0AF3BEE49F4CA2578D100007BD8/$File/1.%20Standard%20425%20Eggs.pdf
36. Markey P. Nearing elimination of hepatitis A in the Northern Territory following immunisation of Indigenous infants . Northern Territory Disease Control Bulletin 2010;17(3):1–6.
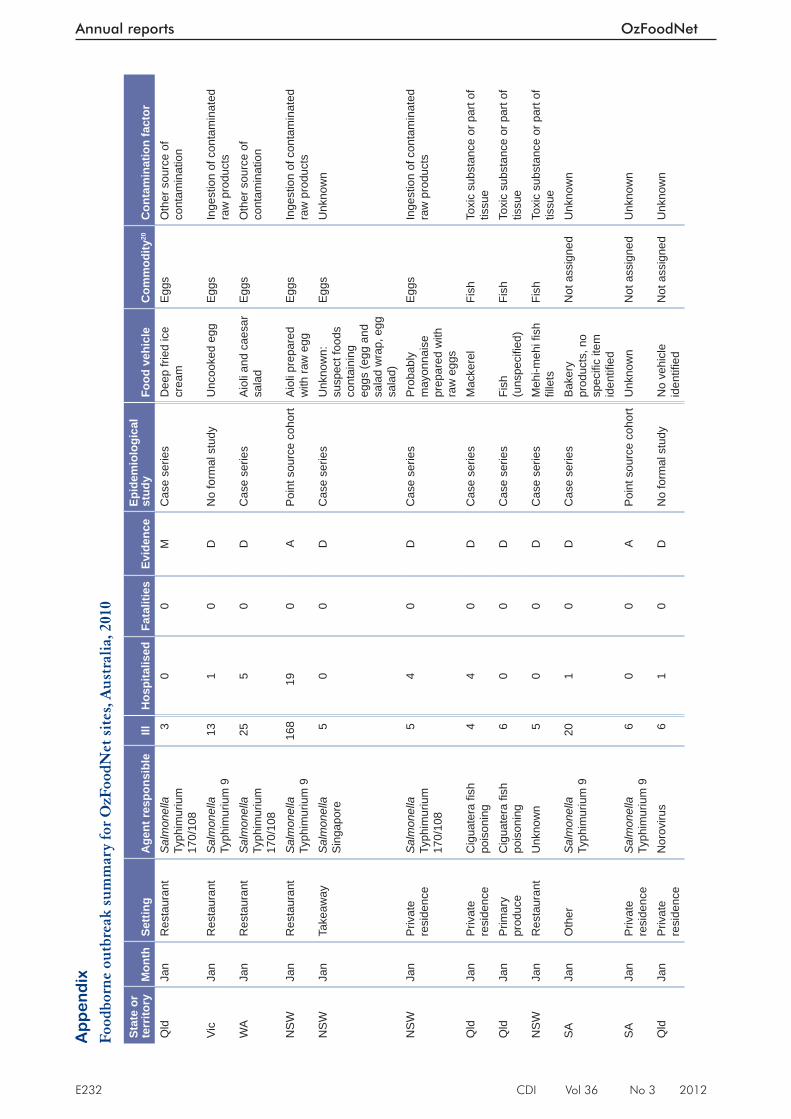
E232 CDI Vol 36 No 3 2012
Annual reports OzFoodNet
Ap
pe
nd
ix
Food
born
e ou
tbre
ak s
umm
ary
for O
zFoo
dNet
sit
es, A
ustr
alia
, 201
0
Stat
e or
te
rrito
ryM
onth
Setti
ngA
gent
resp
onsi
ble
IllH
ospi
talis
edFa
talit
ies
Evid
ence
Epid
emio
logi
cal
stud
yFo
od v
ehic
leC
omm
odity
20C
onta
min
atio
n fa
ctor
Qld
Jan
Res
taur
ant
Sal
mon
ella
Ty
phim
uriu
m
170/
108
30
0M
Cas
e se
ries
Dee
p fri
ed ic
e cr
eam
Egg
sO
ther
sou
rce
of
cont
amin
atio
n
Vic
Jan
Res
taur
ant
Sal
mon
ella
Ty
phim
uriu
m 9
131
0D
No
form
al s
tudy
Unc
ooke
d eg
gE
ggs
Inge
stio
n of
con
tam
inat
ed
raw
pro
duct
sW
AJa
nR
esta
uran
tS
alm
onel
la
Typh
imur
ium
17
0/10
8
255
0D
Cas
e se
ries
Aio
li an
d ca
esar
sa
lad
Egg
sO
ther
sou
rce
of
cont
amin
atio
n
NS
WJa
nR
esta
uran
tS
alm
onel
la
Typh
imur
ium
916
819
0A
Poi
nt s
ourc
e co
hort
Aio
li pr
epar
ed
with
raw
egg
Egg
sIn
gest
ion
of c
onta
min
ated
ra
w p
rodu
cts
NS
WJa
nTa
keaw
ayS
alm
onel
la
Sin
gapo
re
50
0D
Cas
e se
ries
Unk
now
n:
susp
ect f
oods
co
ntai
ning
eg
gs (e
gg a
nd
sala
d w
rap,
egg
sa
lad)
Egg
sU
nkno
wn
NS
WJa
nP
rivat
e re
side
nce
Sal
mon
ella
Ty
phim
uriu
m
170/
108
54
0D
Cas
e se
ries
Pro
babl
y m
ayon
nais
e pr
epar
ed w
ith
raw
egg
s
Egg
sIn
gest
ion
of c
onta
min
ated
ra
w p
rodu
cts
Qld
Jan
Priv
ate
resi
denc
eC
igua
tera
fi sh
po
ison
ing
44
0D
Cas
e se
ries
Mac
kere
lFi
shTo
xic
subs
tanc
e or
par
t of
tissu
eQ
ldJa
nP
rimar
y pr
oduc
eC
igua
tera
fi sh
po
ison
ing
60
0D
Cas
e se
ries
Fish
(u
nspe
cifi e
d)Fi
shTo
xic
subs
tanc
e or
par
t of
tissu
eN
SW
Jan
Res
taur
ant
Unk
now
n5
00
DC
ase
serie
sM
ehi-m
ehi fi
sh
fi lle
tsFi
shTo
xic
subs
tanc
e or
par
t of
tissu
eS
AJa
nO
ther
Sal
mon
ella
Ty
phim
uriu
m 9
201
0D
Cas
e se
ries
Bak
ery
prod
ucts
, no
spec
ifi c
item
id
entifi
ed
Not
ass
igne
dU
nkno
wn
SA
Jan
Priv
ate
resi
denc
eS
alm
onel
la
Typh
imur
ium
96
00
AP
oint
sou
rce
coho
rtU
nkno
wn
Not
ass
igne
dU
nkno
wn
Qld
Jan
Priv
ate
resi
denc
eN
orov
irus
61
0D
No
form
al s
tudy
No
vehi
cle
iden
tifi e
dN
ot a
ssig
ned
Unk
now
n

CDI Vol 36 No 3 2012 E233
OzFoodNet Annual reports
Stat
e or
te
rrito
ryM
onth
Setti
ngA
gent
resp
onsi
ble
IllH
ospi
talis
edFa
talit
ies
Evid
ence
Epid
emio
logi
cal
stud
yFo
od v
ehic
leC
omm
odity
20C
onta
min
atio
n fa
ctor
Qld
Jan
Res
taur
ant
Sal
mon
ella
Ty
phim
uriu
m
170/
108
61
0D
Cas
e se
ries
No
vehi
cle
iden
tifi e
dN
ot a
ssig
ned
Unk
now
n
Qld
Jan
Res
taur
ant
Unk
now
n4
00
DN
o fo
rmal
stu
dyU
nkno
wn
Not
ass
igne
dU
nkno
wn
Qld
Jan
Res
taur
ant
Sal
mon
ella
Ty
phim
uriu
m 8
94
00
MC
ase
serie
sN
o ve
hicl
e id
entifi
ed
Not
ass
igne
dU
nkno
wn
Vic
Jan
Priv
ate
resi
denc
eU
nkno
wn
190
0A
Poi
nt s
ourc
e co
hort
Unk
now
nN
ot a
ssig
ned
Unk
now
n
Vic
Jan
Age
d ca
reU
nkno
wn
90
0D
Cas
e se
ries
Unk
now
nN
ot a
ssig
ned
Unk
now
nVi
cJa
nP
rivat
e re
side
nce
Sal
mon
ella
Ty
phim
uriu
m 1
35a
50
0D
Cas
e se
ries
Unk
now
nN
ot a
ssig
ned
Unk
now
n
NS
WJa
nTa
keaw
ayU
nkno
wn
30
0D
Cas
e se
ries
Ass
orte
d pi
zzas
(b
eef,
chee
se,
chic
ken)
Not
ass
igne
dU
nkno
wn
NS
WJa
nR
esta
uran
tS
alm
onel
la
Typh
imur
ium
92
10
DC
ase
serie
sP
roba
bly
a po
rk
bun
Not
ass
igne
dIn
adeq
uate
cle
anin
g of
eq
uipm
ent
NS
WJa
nA
ged
care
Sal
mon
ella
Ty
phim
uriu
m
170/
108
20
0D
Cas
e se
ries
Unk
now
n pu
reed
food
Not
ass
igne
dU
nkno
wn
NS
WJa
nR
esta
uran
tU
nkno
wn
250
0D
Cas
e se
ries
Unk
now
nN
ot a
ssig
ned
Unk
now
nVi
cFe
bR
esta
uran
tS
alm
onel
la
Typh
imur
ium
98
10
DC
ase
serie
sS
uspe
ct e
ggs
Egg
sIn
gest
ion
of c
onta
min
ated
ra
w p
rodu
cts
MJO
IFe
bP
rimar
y pr
oduc
eLi
ster
ia
mon
ocyt
ogen
es9
82
MC
ase
serie
sM
elon
sFr
uits
/nut
sIn
gest
ion
of c
onta
min
ated
ra
w p
rodu
cts
Qld
Feb
Res
taur
ant
Sal
mon
ella
Ty
phim
uriu
m 1
35a
91
0D
Cas
e se
ries
Unk
now
nN
ot a
ssig
ned
Cro
ss c
onta
min
atio
n fro
m
raw
ingr
edie
nts
Vic
Feb
Com
mer
cial
ca
tere
rS
alm
onel
la
Typh
imur
ium
141
151
0A
Poi
nt s
ourc
e co
hort
Pas
ta s
alad
Not
ass
igne
dC
ross
con
tam
inat
ion
from
ra
w in
gred
ient
sVi
cFe
bA
ged
care
Clo
strid
ium
pe
rfrin
gens
90
0D
No
form
al s
tudy
Unk
now
nN
ot a
ssig
ned
Unk
now
n
Vic
Feb
Age
d ca
reC
ampy
loba
cter
5
00
DN
o fo
rmal
stu
dyU
nkno
wn
Not
ass
igne
dIn
gest
ion
of c
onta
min
ated
ra
w p
rodu
cts
Vic
Feb
Unk
now
nLi
ster
ia
mon
ocyt
ogen
es6
64
MC
ase
serie
sC
old
mea
tN
ot a
ssig
ned
Unk
now
n
App
endi
x co
ntin
ued:
Foo
dbor
ne o
utbr
eak
sum
mar
y fo
r OzF
oodN
et s
ites
, Aus
tral
ia, 2
010
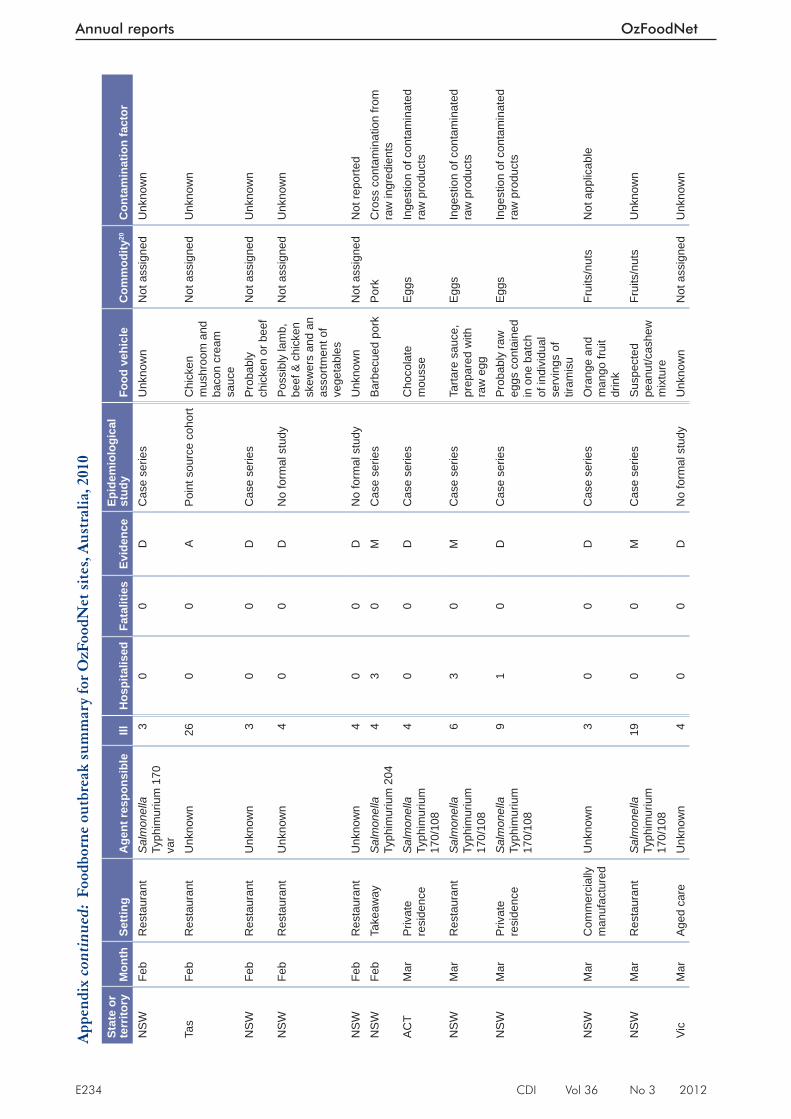
E234 CDI Vol 36 No 3 2012
Annual reports OzFoodNet
Stat
e or
te
rrito
ryM
onth
Setti
ngA
gent
resp
onsi
ble
IllH
ospi
talis
edFa
talit
ies
Evid
ence
Epid
emio
logi
cal
stud
yFo
od v
ehic
leC
omm
odity
20C
onta
min
atio
n fa
ctor
NS
WFe
bR
esta
uran
tS
alm
onel
la
Typh
imur
ium
170
va
r
30
0D
Cas
e se
ries
Unk
now
nN
ot a
ssig
ned
Unk
now
n
Tas
Feb
Res
taur
ant
Unk
now
n26
00
AP
oint
sou
rce
coho
rtC
hick
en
mus
hroo
m a
nd
baco
n cr
eam
sa
uce
Not
ass
igne
dU
nkno
wn
NS
WFe
bR
esta
uran
tU
nkno
wn
30
0D
Cas
e se
ries
Pro
babl
y ch
icke
n or
bee
fN
ot a
ssig
ned
Unk
now
n
NS
WFe
bR
esta
uran
tU
nkno
wn
40
0D
No
form
al s
tudy
Pos
sibl
y la
mb,
be
ef &
chi
cken
sk
ewer
s an
d an
as
sortm
ent o
f ve
geta
bles
Not
ass
igne
dU
nkno
wn
NS
WFe
bR
esta
uran
tU
nkno
wn
40
0D
No
form
al s
tudy
Unk
now
nN
ot a
ssig
ned
Not
repo
rted
NS
WFe
bTa
keaw
ayS
alm
onel
la
Typh
imur
ium
204
43
0M
Cas
e se
ries
Bar
becu
ed p
ork
Por
kC
ross
con
tam
inat
ion
from
ra
w in
gred
ient
sA
CT
Mar
Priv
ate
resi
denc
eS
alm
onel
la
Typh
imur
ium
17
0/10
8
40
0D
Cas
e se
ries
Cho
cola
te
mou
sse
Egg
sIn
gest
ion
of c
onta
min
ated
ra
w p
rodu
cts
NS
WM
arR
esta
uran
tS
alm
onel
la
Typh
imur
ium
17
0/10
8
63
0M
Cas
e se
ries
Tarta
re s
auce
, pr
epar
ed w
ith
raw
egg
Egg
sIn
gest
ion
of c
onta
min
ated
ra
w p
rodu
cts
NS
WM
arP
rivat
e re
side
nce
Sal
mon
ella
Ty
phim
uriu
m
170/
108
91
0D
Cas
e se
ries
Pro
babl
y ra
w
eggs
con
tain
ed
in o
ne b
atch
of
indi
vidu
al
serv
ings
of
tiram
isu
Egg
sIn
gest
ion
of c
onta
min
ated
ra
w p
rodu
cts
NS
WM
arC
omm
erci
ally
m
anuf
actu
red
Unk
now
n3
00
DC
ase
serie
sO
rang
e an
d m
ango
frui
t dr
ink
Frui
ts/n
uts
Not
app
licab
le
NS
WM
arR
esta
uran
tS
alm
onel
la
Typh
imur
ium
17
0/10
8
190
0M
Cas
e se
ries
Sus
pect
ed
pean
ut/c
ashe
w
mix
ture
Frui
ts/n
uts
Unk
now
n
Vic
Mar
Age
d ca
reU
nkno
wn
40
0D
No
form
al s
tudy
Unk
now
nN
ot a
ssig
ned
Unk
now
n
App
endi
x co
ntin
ued:
Foo
dbor
ne o
utbr
eak
sum
mar
y fo
r OzF
oodN
et s
ites
, Aus
tral
ia, 2
010
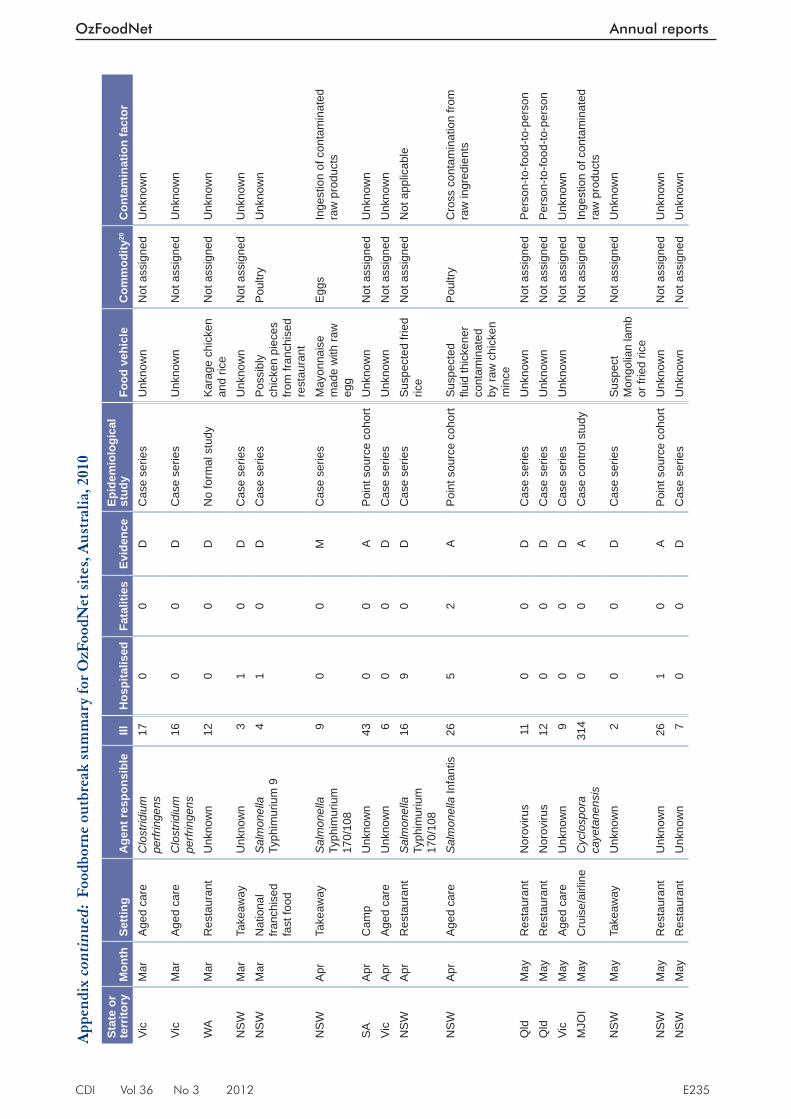
CDI Vol 36 No 3 2012 E235
OzFoodNet Annual reports
Stat
e or
te
rrito
ryM
onth
Setti
ngA
gent
resp
onsi
ble
IllH
ospi
talis
edFa
talit
ies
Evid
ence
Epid
emio
logi
cal
stud
yFo
od v
ehic
leC
omm
odity
20C
onta
min
atio
n fa
ctor
Vic
Mar
Age
d ca
reC
lost
ridiu
m
perfr
inge
ns17
00
DC
ase
serie
sU
nkno
wn
Not
ass
igne
dU
nkno
wn
Vic
Mar
Age
d ca
reC
lost
ridiu
m
perfr
inge
ns16
00
DC
ase
serie
sU
nkno
wn
Not
ass
igne
dU
nkno
wn
WA
Mar
Res
taur
ant
Unk
now
n12
00
DN
o fo
rmal
stu
dyK
arag
e ch
icke
n an
d ric
eN
ot a
ssig
ned
Unk
now
n
NS
WM
arTa
keaw
ayU
nkno
wn
31
0D
Cas
e se
ries
Unk
now
nN
ot a
ssig
ned
Unk
now
nN
SW
Mar
Nat
iona
l fra
nchi
sed
fast
food
Sal
mon
ella
Ty
phim
uriu
m 9
41
0D
Cas
e se
ries
Pos
sibl
y ch
icke
n pi
eces
fro
m fr
anch
ised
re
stau
rant
Pou
ltry
Unk
now
n
NS
WA
prTa
keaw
ayS
alm
onel
la
Typh
imur
ium
17
0/10
8
90
0M
Cas
e se
ries
May
onna
ise
mad
e w
ith ra
w
egg
Egg
sIn
gest
ion
of c
onta
min
ated
ra
w p
rodu
cts
SA
Apr
Cam
pU
nkno
wn
430
0A
Poi
nt s
ourc
e co
hort
Unk
now
nN
ot a
ssig
ned
Unk
now
nVi
cA
prA
ged
care
Unk
now
n6
00
DC
ase
serie
sU
nkno
wn
Not
ass
igne
dU
nkno
wn
NS
WA
prR
esta
uran
tS
alm
onel
la
Typh
imur
ium
17
0/10
8
169
0D
Cas
e se
ries
Sus
pect
ed fr
ied
rice
Not
ass
igne
dN
ot a
pplic
able
NS
WA
prA
ged
care
Sal
mon
ella
Infa
ntis
26
52
AP
oint
sou
rce
coho
rtS
uspe
cted
fl u
id th
icke
ner
cont
amin
ated
by
raw
chi
cken
m
ince
Pou
ltry
Cro
ss c
onta
min
atio
n fro
m
raw
ingr
edie
nts
Qld
May
Res
taur
ant
Nor
oviru
s 11
00
DC
ase
serie
sU
nkno
wn
Not
ass
igne
dP
erso
n-to
-food
-to-p
erso
nQ
ldM
ayR
esta
uran
tN
orov
irus
120
0D
Cas
e se
ries
Unk
now
nN
ot a
ssig
ned
Per
son-
to-fo
od-to
-per
son
Vic
May
Age
d ca
reU
nkno
wn
90
0D
Cas
e se
ries
Unk
now
nN
ot a
ssig
ned
Unk
now
nM
JOI
May
Cru
ise/
airli
neC
yclo
spor
a ca
yeta
nens
is31
40
0A
Cas
e co
ntro
l stu
dy
Not
ass
igne
dIn
gest
ion
of c
onta
min
ated
ra
w p
rodu
cts
NS
WM
ayTa
keaw
ayU
nkno
wn
20
0D
Cas
e se
ries
Sus
pect
M
ongo
lian
lam
b or
frie
d ric
e
Not
ass
igne
dU
nkno
wn
NS
WM
ayR
esta
uran
tU
nkno
wn
261
0A
Poi
nt s
ourc
e co
hort
Unk
now
nN
ot a
ssig
ned
Unk
now
nN
SW
May
Res
taur
ant
Unk
now
n7
00
DC
ase
serie
sU
nkno
wn
Not
ass
igne
dU
nkno
wn
App
endi
x co
ntin
ued:
Foo
dbor
ne o
utbr
eak
sum
mar
y fo
r OzF
oodN
et s
ites
, Aus
tral
ia, 2
010

E236 CDI Vol 36 No 3 2012
Annual reports OzFoodNet
Stat
e or
te
rrito
ryM
onth
Setti
ngA
gent
resp
onsi
ble
IllH
ospi
talis
edFa
talit
ies
Evid
ence
Epid
emio
logi
cal
stud
yFo
od v
ehic
leC
omm
odity
20C
onta
min
atio
n fa
ctor
NS
WM
ayFa
ir/fe
stiv
al/
mob
ile
serv
ice
Sal
mon
ella
S
aint
paul
7
30
DC
ase
serie
sS
uspe
cted
sa
lmon
&
cous
cous
dis
h
Not
ass
igne
dU
nkno
wn
NS
WM
ayR
esta
uran
tC
ampy
loba
cter
je
juni
100
0A
Poi
nt s
ourc
e co
hort
Raw
chi
cken
Pou
ltry
Inge
stio
n of
con
tam
inat
ed
raw
pro
duct
sQ
ldJu
nR
esta
uran
tS
alm
onel
la
Typh
imur
ium
135
a34
10
AM
Poi
nt s
ourc
e co
hort
Citr
us a
ioli
Egg
sIn
gest
ion
of c
onta
min
ated
ra
w p
rodu
cts
NS
WJu
nP
rivat
e re
side
nce
Sal
mon
ella
Ty
phim
uriu
m
170/
108
95
0D
Cas
e se
ries
Unk
now
n:
poss
ibly
m
ouss
e ca
ke
with
raw
egg
s
Egg
sU
nkno
wn
Qld
Jun
Res
taur
ant
Clo
strid
ium
pe
rfrin
gens
40
0M
Cas
e se
ries
Rot
ti cu
rry
lam
bLa
mb
Not
app
licab
le
SA
Jun
Oth
erU
nkno
wn
100
0O
ther
lab
evid
ence
No
form
al s
tudy
Milk
Milk
Poi
sono
us s
ubst
ance
NS
WJu
nR
esta
uran
tU
nkno
wn
30
0D
Cas
e se
ries
Sus
pect
ed
oyst
ers
Mol
lusc
sU
nkno
wn
Vic
Jun
Age
d ca
reC
ampy
loba
cter
15
10
DC
ase
serie
sU
nkno
wn
Not
ass
igne
dU
nkno
wn
Vic
Jun
Age
d ca
reU
nkno
wn
80
0D
Cas
e se
ries
Unk
now
nN
ot a
ssig
ned
Unk
now
nW
AJu
nA
ged
care
Clo
strid
ium
pe
rfrin
gens
100
0D
Cas
e se
ries
Unk
now
nN
ot a
ssig
ned
Not
app
licab
le
NT
Jun
Res
taur
ant
Nor
oviru
s 19
00
AP
oint
sou
rce
coho
rt
Not
ass
igne
dP
erso
n to
food
to p
erso
nN
SW
Jun
Res
taur
ant
Unk
now
n10
00
AP
oint
sou
rce
coho
rtU
nkno
wn
Not
ass
igne
dU
nkno
wn
NS
WJu
nTa
keaw
ayS
alm
onel
la
Typh
imur
ium
17
0/10
8
458
0M
Cas
e se
ries
Chi
cken
, ho
mm
us, t
abou
liN
ot a
ssig
ned
Cro
ss c
onta
min
atio
n fro
m
raw
ingr
edie
nts
NS
WJu
nR
esta
uran
tU
nkno
wn
152
0D
Cas
e se
ries
Unk
now
nN
ot a
ssig
ned
Not
app
licab
leN
SW
Jun
Res
taur
ant
Unk
now
n7
00
DC
ase
serie
sS
uspe
cted
ch
icke
n in
che
ese
sauc
e, m
ixed
ve
geta
bles
Not
ass
igne
dIn
gest
ion
of c
onta
min
ated
ra
w p
rodu
cts
NS
WJu
nR
esta
uran
tU
nkno
wn
120
0D
Cas
e se
ries
Unk
now
nN
ot a
ssig
ned
Not
repo
rted
NS
WJu
nR
esta
uran
tU
nkno
wn
40
0D
No
form
al s
tudy
Sus
pect
ed b
eef
pie
Not
ass
igne
dN
ot re
porte
d
App
endi
x co
ntin
ued:
Foo
dbor
ne o
utbr
eak
sum
mar
y fo
r OzF
oodN
et s
ites
, Aus
tral
ia, 2
010
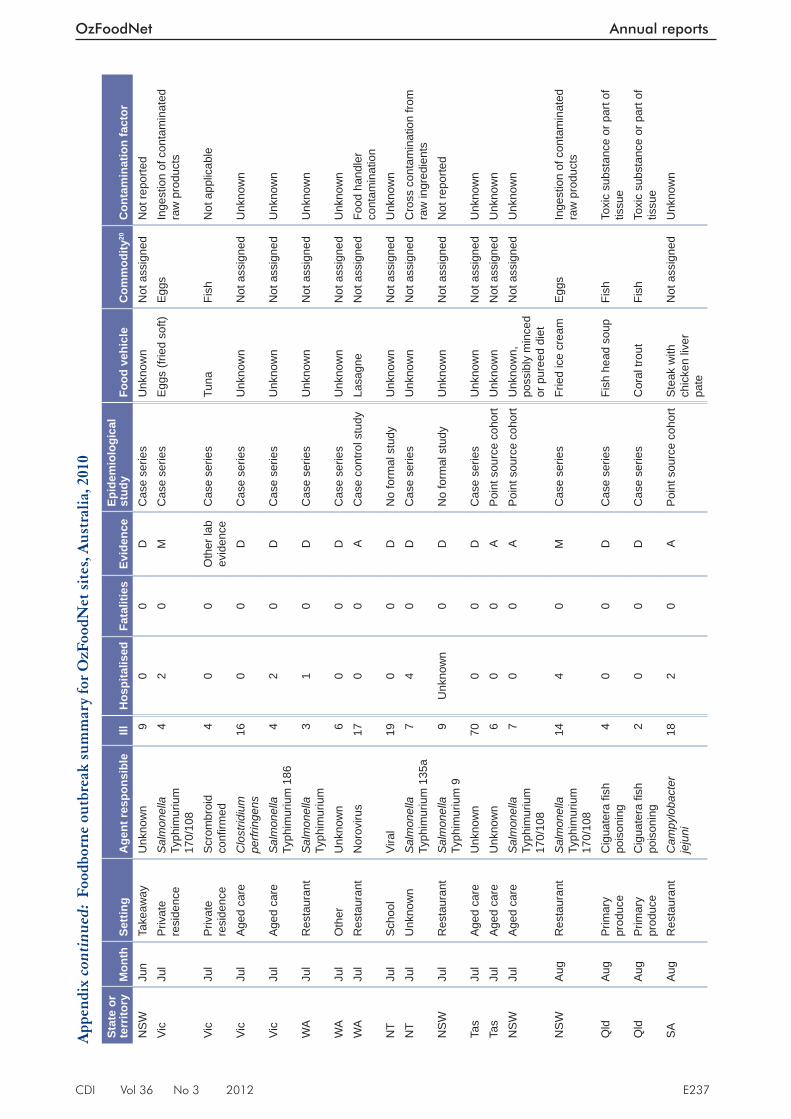
CDI Vol 36 No 3 2012 E237
OzFoodNet Annual reports
Stat
e or
te
rrito
ryM
onth
Setti
ngA
gent
resp
onsi
ble
IllH
ospi
talis
edFa
talit
ies
Evid
ence
Epid
emio
logi
cal
stud
yFo
od v
ehic
leC
omm
odity
20C
onta
min
atio
n fa
ctor
NS
WJu
nTa
keaw
ayU
nkno
wn
90
0D
Cas
e se
ries
Unk
now
nN
ot a
ssig
ned
Not
repo
rted
Vic
Jul
Priv
ate
resi
denc
eS
alm
onel
la
Typh
imur
ium
17
0/10
8
42
0M
Cas
e se
ries
Egg
s (fr
ied
soft)
Egg
sIn
gest
ion
of c
onta
min
ated
ra
w p
rodu
cts
Vic
Jul
Priv
ate
resi
denc
eS
crom
broi
d co
nfi rm
ed4
00
Oth
er la
b ev
iden
ceC
ase
serie
sTu
naFi
shN
ot a
pplic
able
Vic
Jul
Age
d ca
reC
lost
ridiu
m
perfr
inge
ns16
00
DC
ase
serie
sU
nkno
wn
Not
ass
igne
dU
nkno
wn
Vic
Jul
Age
d ca
reS
alm
onel
la
Typh
imur
ium
186
42
0D
Cas
e se
ries
Unk
now
nN
ot a
ssig
ned
Unk
now
n
WA
Jul
Res
taur
ant
Sal
mon
ella
Ty
phim
uriu
m
31
0D
Cas
e se
ries
Unk
now
nN
ot a
ssig
ned
Unk
now
n
WA
Jul
Oth
erU
nkno
wn
60
0D
Cas
e se
ries
Unk
now
nN
ot a
ssig
ned
Unk
now
nW
AJu
lR
esta
uran
tN
orov
irus
170
0A
Cas
e co
ntro
l stu
dyLa
sagn
eN
ot a
ssig
ned
Food
han
dler
co
ntam
inat
ion
NT
Jul
Sch
ool
Vira
l 19
00
DN
o fo
rmal
stu
dyU
nkno
wn
Not
ass
igne
dU
nkno
wn
NT
Jul
Unk
now
nS
alm
onel
la
Typh
imur
ium
135
a7
40
DC
ase
serie
sU
nkno
wn
Not
ass
igne
dC
ross
con
tam
inat
ion
from
ra
w in
gred
ient
sN
SW
Jul
Res
taur
ant
Sal
mon
ella
Ty
phim
uriu
m 9
9U
nkno
wn
0D
No
form
al s
tudy
Unk
now
nN
ot a
ssig
ned
Not
repo
rted
Tas
Jul
Age
d ca
reU
nkno
wn
700
0D
Cas
e se
ries
Unk
now
nN
ot a
ssig
ned
Unk
now
nTa
sJu
lA
ged
care
Unk
now
n6
00
AP
oint
sou
rce
coho
rtU
nkno
wn
Not
ass
igne
dU
nkno
wn
NS
WJu
lA
ged
care
Sal
mon
ella
Ty
phim
uriu
m
170/
108
70
0A
Poi
nt s
ourc
e co
hort
Unk
now
n,
poss
ibly
min
ced
or p
uree
d di
et
Not
ass
igne
dU
nkno
wn
NS
WA
ugR
esta
uran
tS
alm
onel
la
Typh
imur
ium
17
0/10
8
144
0M
Cas
e se
ries
Frie
d ic
e cr
eam
Egg
sIn
gest
ion
of c
onta
min
ated
ra
w p
rodu
cts
Qld
Aug
Prim
ary
prod
uce
Cig
uate
ra fi
sh
pois
onin
g 4
00
DC
ase
serie
sFi
sh h
ead
soup
Fish
Toxi
c su
bsta
nce
or p
art o
f tis
sue
Qld
Aug
Prim
ary
prod
uce
Cig
uate
ra fi
sh
pois
onin
g 2
00
DC
ase
serie
sC
oral
trou
tFi
shTo
xic
subs
tanc
e or
par
t of
tissu
eS
AA
ugR
esta
uran
tC
ampy
loba
cter
je
juni
182
0A
Poi
nt s
ourc
e co
hort
Ste
ak w
ith
chic
ken
liver
pa
te
Not
ass
igne
dU
nkno
wn
App
endi
x co
ntin
ued:
Foo
dbor
ne o
utbr
eak
sum
mar
y fo
r OzF
oodN
et s
ites
, Aus
tral
ia, 2
010
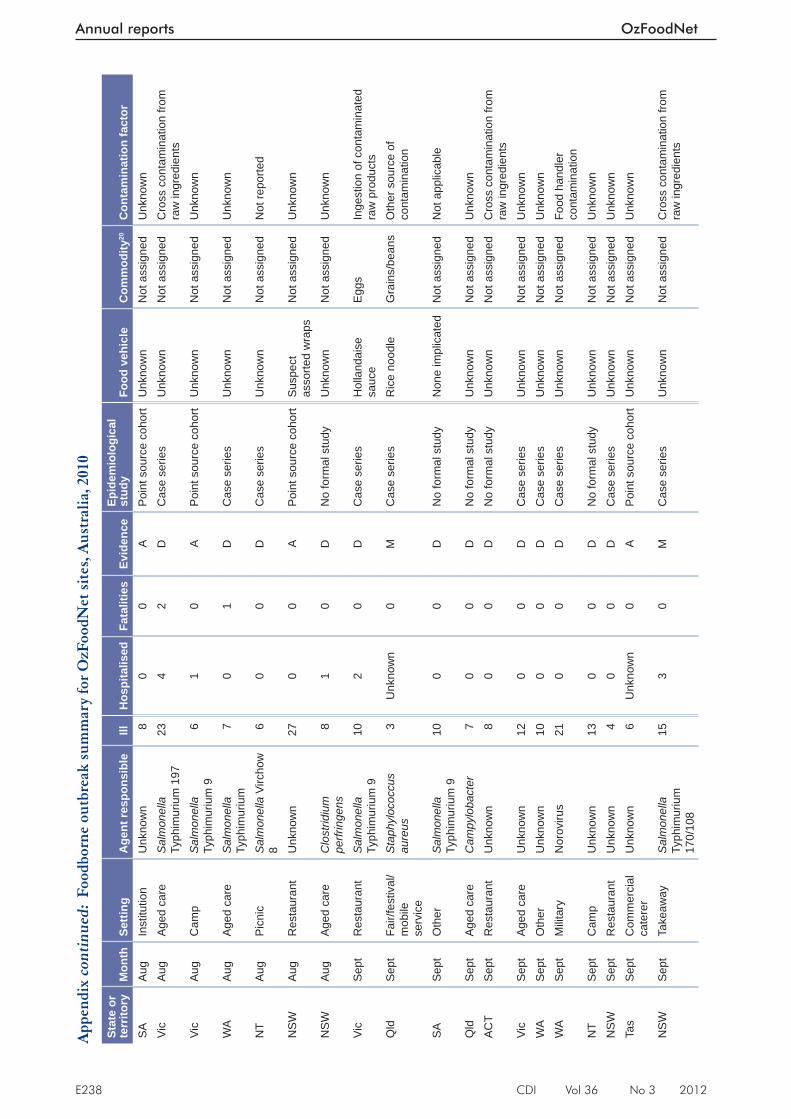
E238 CDI Vol 36 No 3 2012
Annual reports OzFoodNet
Stat
e or
te
rrito
ryM
onth
Setti
ngA
gent
resp
onsi
ble
IllH
ospi
talis
edFa
talit
ies
Evid
ence
Epid
emio
logi
cal
stud
yFo
od v
ehic
leC
omm
odity
20C
onta
min
atio
n fa
ctor
SA
Aug
Inst
itutio
nU
nkno
wn
80
0A
Poi
nt s
ourc
e co
hort
Unk
now
nN
ot a
ssig
ned
Unk
now
nVi
cA
ugA
ged
care
Sal
mon
ella
Ty
phim
uriu
m 1
9723
42
DC
ase
serie
sU
nkno
wn
Not
ass
igne
dC
ross
con
tam
inat
ion
from
ra
w in
gred
ient
sVi
cA
ugC
amp
Sal
mon
ella
Ty
phim
uriu
m 9
61
0A
Poi
nt s
ourc
e co
hort
Unk
now
nN
ot a
ssig
ned
Unk
now
n
WA
Aug
Age
d ca
reS
alm
onel
la
Typh
imur
ium
7
01
DC
ase
serie
sU
nkno
wn
Not
ass
igne
dU
nkno
wn
NT
Aug
Pic
nic
Sal
mon
ella
Virc
how
8
60
0D
Cas
e se
ries
Unk
now
nN
ot a
ssig
ned
Not
repo
rted
NS
WA
ugR
esta
uran
tU
nkno
wn
270
0A
Poi
nt s
ourc
e co
hort
Sus
pect
as
sorte
d w
raps
Not
ass
igne
dU
nkno
wn
NS
WA
ugA
ged
care
Clo
strid
ium
pe
rfrin
gens
81
0D
No
form
al s
tudy
Unk
now
nN
ot a
ssig
ned
Unk
now
n
Vic
Sep
tR
esta
uran
tS
alm
onel
la
Typh
imur
ium
910
20
DC
ase
serie
sH
olla
ndai
se
sauc
eE
ggs
Inge
stio
n of
con
tam
inat
ed
raw
pro
duct
sQ
ldS
ept
Fair/
fest
ival
/m
obile
se
rvic
e
Sta
phyl
ococ
cus
aure
us
3U
nkno
wn
0M
Cas
e se
ries
Ric
e no
odle
Gra
ins/
bean
sO
ther
sou
rce
of
cont
amin
atio
n
SA
Sep
tO
ther
Sal
mon
ella
Ty
phim
uriu
m 9
100
0D
No
form
al s
tudy
Non
e im
plic
ated
Not
ass
igne
dN
ot a
pplic
able
Qld
Sep
tA
ged
care
Cam
pylo
bact
er
70
0D
No
form
al s
tudy
Unk
now
nN
ot a
ssig
ned
Unk
now
nA
CT
Sep
tR
esta
uran
tU
nkno
wn
80
0D
No
form
al s
tudy
Unk
now
nN
ot a
ssig
ned
Cro
ss c
onta
min
atio
n fro
m
raw
ingr
edie
nts
Vic
Sep
tA
ged
care
Unk
now
n12
00
DC
ase
serie
sU
nkno
wn
Not
ass
igne
dU
nkno
wn
WA
Sep
tO
ther
Unk
now
n10
00
DC
ase
serie
sU
nkno
wn
Not
ass
igne
dU
nkno
wn
WA
Sep
tM
ilita
ryN
orov
irus
210
0D
Cas
e se
ries
Unk
now
nN
ot a
ssig
ned
Food
han
dler
co
ntam
inat
ion
NT
Sep
tC
amp
Unk
now
n13
00
DN
o fo
rmal
stu
dyU
nkno
wn
Not
ass
igne
dU
nkno
wn
NS
WS
ept
Res
taur
ant
Unk
now
n4
00
DC
ase
serie
sU
nkno
wn
Not
ass
igne
dU
nkno
wn
Tas
Sep
tC
omm
erci
al
cate
rer
Unk
now
n6
Unk
now
n0
AP
oint
sou
rce
coho
rtU
nkno
wn
Not
ass
igne
dU
nkno
wn
NS
WS
ept
Take
away
Sal
mon
ella
Ty
phim
uriu
m
170/
108
153
0M
Cas
e se
ries
Unk
now
nN
ot a
ssig
ned
Cro
ss c
onta
min
atio
n fro
m
raw
ingr
edie
nts
App
endi
x co
ntin
ued:
Foo
dbor
ne o
utbr
eak
sum
mar
y fo
r OzF
oodN
et s
ites
, Aus
tral
ia, 2
010
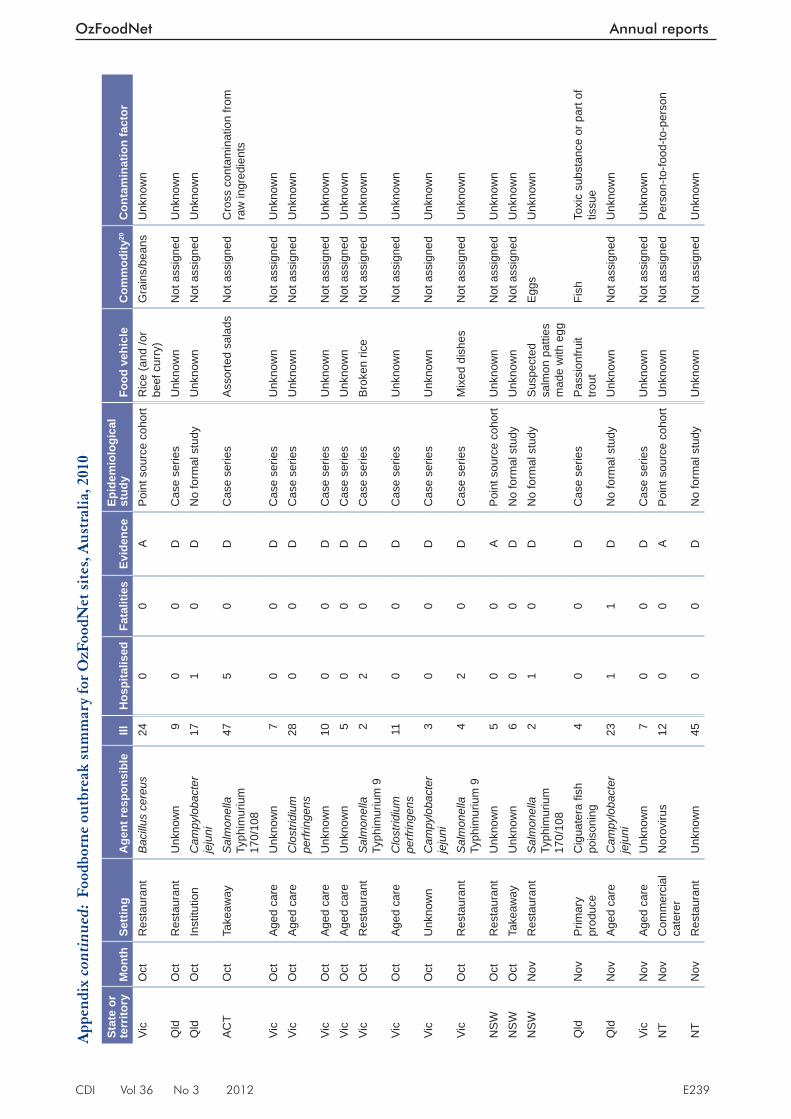
CDI Vol 36 No 3 2012 E239
OzFoodNet Annual reports
Stat
e or
te
rrito
ryM
onth
Setti
ngA
gent
resp
onsi
ble
IllH
ospi
talis
edFa
talit
ies
Evid
ence
Epid
emio
logi
cal
stud
yFo
od v
ehic
leC
omm
odity
20C
onta
min
atio
n fa
ctor
Vic
Oct
Res
taur
ant
Bac
illus
cer
eus
240
0A
Poi
nt s
ourc
e co
hort
Ric
e (a
nd /o
r be
ef c
urry
)G
rain
s/be
ans
Unk
now
n
Qld
Oct
Res
taur
ant
Unk
now
n9
00
DC
ase
serie
sU
nkno
wn
Not
ass
igne
dU
nkno
wn
Qld
Oct
Inst
itutio
nC
ampy
loba
cter
je
juni
171
0D
No
form
al s
tudy
Unk
now
nN
ot a
ssig
ned
Unk
now
n
AC
TO
ctTa
keaw
ayS
alm
onel
la
Typh
imur
ium
17
0/10
8
475
0D
Cas
e se
ries
Ass
orte
d sa
lads
Not
ass
igne
dC
ross
con
tam
inat
ion
from
ra
w in
gred
ient
s
Vic
Oct
Age
d ca
reU
nkno
wn
70
0D
Cas
e se
ries
Unk
now
nN
ot a
ssig
ned
Unk
now
nVi
cO
ctA
ged
care
Clo
strid
ium
pe
rfrin
gens
280
0D
Cas
e se
ries
Unk
now
nN
ot a
ssig
ned
Unk
now
n
Vic
Oct
Age
d ca
reU
nkno
wn
100
0D
Cas
e se
ries
Unk
now
nN
ot a
ssig
ned
Unk
now
nVi
cO
ctA
ged
care
Unk
now
n5
00
DC
ase
serie
sU
nkno
wn
Not
ass
igne
dU
nkno
wn
Vic
Oct
Res
taur
ant
Sal
mon
ella
Ty
phim
uriu
m 9
22
0D
Cas
e se
ries
Bro
ken
rice
Not
ass
igne
dU
nkno
wn
Vic
Oct
Age
d ca
reC
lost
ridiu
m
perfr
inge
ns11
00
DC
ase
serie
sU
nkno
wn
Not
ass
igne
dU
nkno
wn
Vic
Oct
Unk
now
nC
ampy
loba
cter
je
juni
30
0D
Cas
e se
ries
Unk
now
nN
ot a
ssig
ned
Unk
now
n
Vic
Oct
Res
taur
ant
Sal
mon
ella
Ty
phim
uriu
m 9
42
0D
Cas
e se
ries
Mix
ed d
ishe
sN
ot a
ssig
ned
Unk
now
n
NS
WO
ctR
esta
uran
tU
nkno
wn
50
0A
Poi
nt s
ourc
e co
hort
Unk
now
nN
ot a
ssig
ned
Unk
now
nN
SW
Oct
Take
away
Unk
now
n6
00
DN
o fo
rmal
stu
dyU
nkno
wn
Not
ass
igne
dU
nkno
wn
NS
WN
ovR
esta
uran
tS
alm
onel
la
Typh
imur
ium
17
0/10
8
21
0D
No
form
al s
tudy
Sus
pect
ed
salm
on p
attie
s m
ade
with
egg
Egg
sU
nkno
wn
Qld
Nov
Prim
ary
prod
uce
Cig
uate
ra fi
sh
pois
onin
g 4
00
DC
ase
serie
sP
assi
onfru
it tro
utFi
shTo
xic
subs
tanc
e or
par
t of
tissu
eQ
ldN
ovA
ged
care
Cam
pylo
bact
er
jeju
ni23
11
DN
o fo
rmal
stu
dyU
nkno
wn
Not
ass
igne
dU
nkno
wn
Vic
Nov
Age
d ca
reU
nkno
wn
70
0D
Cas
e se
ries
Unk
now
nN
ot a
ssig
ned
Unk
now
nN
TN
ovC
omm
erci
al
cate
rer
Nor
oviru
s 12
00
AP
oint
sou
rce
coho
rtU
nkno
wn
Not
ass
igne
dP
erso
n-to
-food
-to-p
erso
n
NT
Nov
Res
taur
ant
Unk
now
n45
00
DN
o fo
rmal
stu
dyU
nkno
wn
Not
ass
igne
dU
nkno
wn
App
endi
x co
ntin
ued:
Foo
dbor
ne o
utbr
eak
sum
mar
y fo
r OzF
oodN
et s
ites
, Aus
tral
ia, 2
010
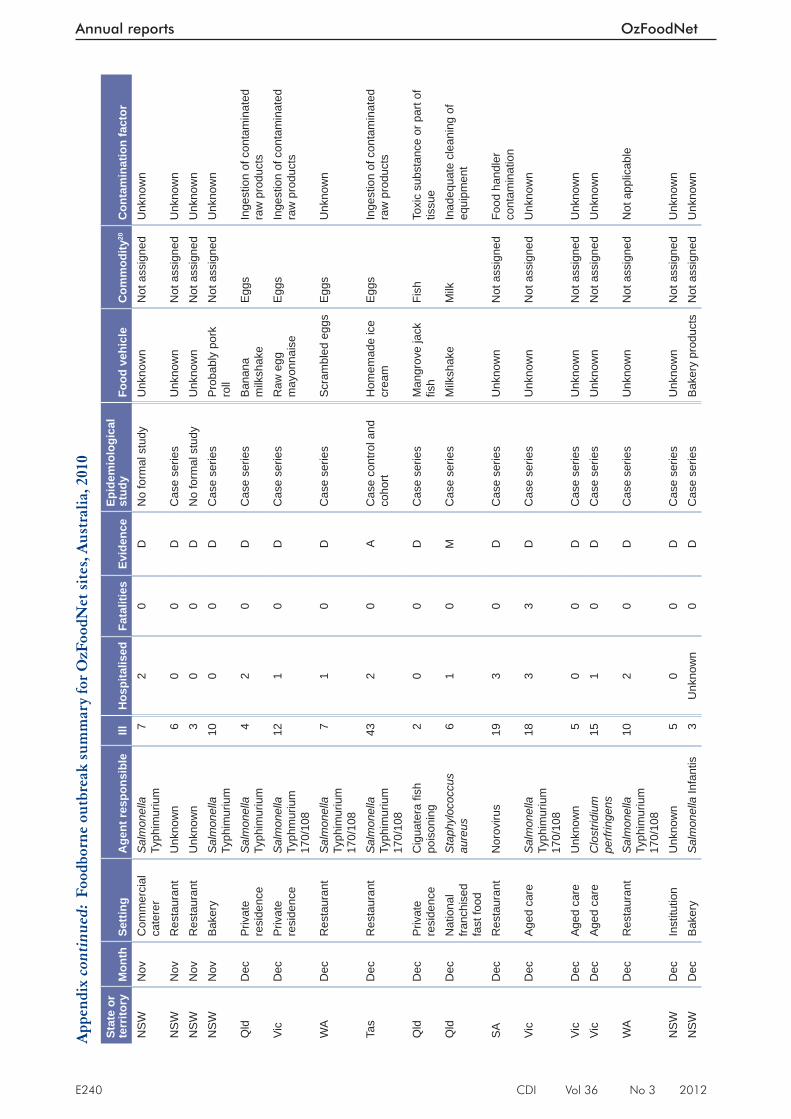
E240 CDI Vol 36 No 3 2012
Annual reports OzFoodNet
Stat
e or
te
rrito
ryM
onth
Setti
ngA
gent
resp
onsi
ble
IllH
ospi
talis
edFa
talit
ies
Evid
ence
Epid
emio
logi
cal
stud
yFo
od v
ehic
leC
omm
odity
20C
onta
min
atio
n fa
ctor
NS
WN
ovC
omm
erci
al
cate
rer
Sal
mon
ella
Ty
phim
uriu
m
72
0D
No
form
al s
tudy
Unk
now
nN
ot a
ssig
ned
Unk
now
n
NS
WN
ovR
esta
uran
tU
nkno
wn
60
0D
Cas
e se
ries
Unk
now
nN
ot a
ssig
ned
Unk
now
nN
SW
Nov
Res
taur
ant
Unk
now
n3
00
DN
o fo
rmal
stu
dyU
nkno
wn
Not
ass
igne
dU
nkno
wn
NS
WN
ovB
aker
yS
alm
onel
la
Typh
imur
ium
10
00
DC
ase
serie
sP
roba
bly
pork
ro
llN
ot a
ssig
ned
Unk
now
n
Qld
Dec
Priv
ate
resi
denc
eS
alm
onel
la
Typh
imur
ium
4
20
DC
ase
serie
sB
anan
a m
ilksh
ake
Egg
sIn
gest
ion
of c
onta
min
ated
ra
w p
rodu
cts
Vic
Dec
Priv
ate
resi
denc
eS
alm
onel
la
Typh
mur
ium
17
0/10
8
121
0D
Cas
e se
ries
Raw
egg
m
ayon
nais
eE
ggs
Inge
stio
n of
con
tam
inat
ed
raw
pro
duct
s
WA
Dec
Res
taur
ant
Sal
mon
ella
Ty
phim
uriu
m
170/
108
71
0D
Cas
e se
ries
Scr
ambl
ed e
ggs
Egg
sU
nkno
wn
Tas
Dec
Res
taur
ant
Sal
mon
ella
Ty
phim
uriu
m
170/
108
432
0A
Cas
e co
ntro
l and
co
hort
Hom
emad
e ic
e cr
eam
Egg
sIn
gest
ion
of c
onta
min
ated
ra
w p
rodu
cts
Qld
Dec
Priv
ate
resi
denc
eC
igua
tera
fi sh
po
ison
ing
20
0D
Cas
e se
ries
Man
grov
e ja
ck
fi sh
Fish
Toxi
c su
bsta
nce
or p
art o
f tis
sue
Qld
Dec
Nat
iona
l fra
nchi
sed
fast
food
Sta
phyl
ococ
cus
aure
us
61
0M
Cas
e se
ries
Milk
shak
eM
ilkIn
adeq
uate
cle
anin
g of
eq
uipm
ent
SA
Dec
Res
taur
ant
Nor
oviru
s 19
30
DC
ase
serie
sU
nkno
wn
Not
ass
igne
dFo
od h
andl
er
cont
amin
atio
nVi
cD
ecA
ged
care
Sal
mon
ella
Ty
phim
uriu
m
170/
108
183
3D
Cas
e se
ries
Unk
now
nN
ot a
ssig
ned
Unk
now
n
Vic
Dec
Age
d ca
reU
nkno
wn
50
0D
Cas
e se
ries
Unk
now
nN
ot a
ssig
ned
Unk
now
nVi
cD
ecA
ged
care
Clo
strid
ium
pe
rfrin
gens
151
0D
Cas
e se
ries
Unk
now
nN
ot a
ssig
ned
Unk
now
n
WA
Dec
Res
taur
ant
Sal
mon
ella
Ty
phim
uriu
m
170/
108
102
0D
Cas
e se
ries
Unk
now
nN
ot a
ssig
ned
Not
app
licab
le
NS
WD
ecIn
stitu
tion
Unk
now
n5
00
DC
ase
serie
sU
nkno
wn
Not
ass
igne
dU
nkno
wn
NS
WD
ecB
aker
yS
alm
onel
la In
fant
is3
Unk
now
n0
DC
ase
serie
sB
aker
y pr
oduc
tsN
ot a
ssig
ned
Unk
now
n
App
endi
x co
ntin
ued:
Foo
dbor
ne o
utbr
eak
sum
mar
y fo
r OzF
oodN
et s
ites
, Aus
tral
ia, 2
010

CDI Vol 36 No 3 2012 E241
OzFoodNet Annual reports
Stat
e or
te
rrito
ryM
onth
Setti
ngA
gent
resp
onsi
ble
IllH
ospi
talis
edFa
talit
ies
Evid
ence
Epid
emio
logi
cal
stud
yFo
od v
ehic
leC
omm
odity
20C
onta
min
atio
n fa
ctor
Tas
Dec
Res
taur
ant
Unk
now
n6
Unk
now
n0
DN
o fo
rmal
stu
dyU
nkno
wn
Not
ass
igne
dN
ot a
pplic
able
NS
WD
ecR
esta
uran
tU
nkno
wn
30
0D
No
form
al s
tudy
Unk
now
nN
ot a
ssig
ned
Unk
now
nN
SW
Dec
Res
taur
ant
Unk
now
n5
00
DN
o fo
rmal
stu
dyU
nkno
wn
Not
ass
igne
dU
nkno
wn
NS
WD
ecTa
keaw
ayS
alm
onel
la
Typh
imur
ium
17
0/10
8
83
0M
No
form
al s
tudy
Sus
pect
ed p
ork
rolls
Not
ass
igne
dIn
gest
ion
of c
onta
min
ated
ra
w p
rodu
cts
Vic
Dec
Inst
itutio
nC
ampy
loba
cter
je
juni
50
0D
Cas
e se
ries
Chi
cken
Pou
ltry
Inge
stio
n of
con
tam
inat
ed
raw
pro
duct
s
MJO
I M
ultij
uris
dict
iona
l out
brea
k in
vest
igat
ion.
Evi
denc
e D
D
escr
iptiv
e ev
iden
ce im
plic
atin
g th
e ve
hicl
e A
Ana
lytic
al e
pide
mio
logi
cal a
ssoc
iatio
n be
twee
n ill
ness
and
veh
icle
M
Mic
robi
olog
ical
con
fi rm
atio
n of
aet
iolo
gy in
veh
icle
and
cas
es.
Epi
dem
iolo
gica
l stu
dy N
In
divi
dual
pat
ient
dat
a no
t col
lect
ed.
App
endi
x co
ntin
ued:
Foo
dbor
ne o
utbr
eak
sum
mar
y fo
r OzF
oodN
et s
ites
, Aus
tral
ia, 2
010