Monitoring the effectiveness of biological products
27
Monitoring the effectiveness of biological products By Lisa Miller, Southern Farming Systems May 2017 Mark Farrell, CSIRO talking to a group of farmers at SFS regarding biological product trials
Transcript of Monitoring the effectiveness of biological products

Monitoring the effectiveness of biological products
By Lisa Miller, Southern Farming Systems
May 2017
Mark Farrell, CSIRO talking to a group of farmers at SFS regarding biological product trials
2
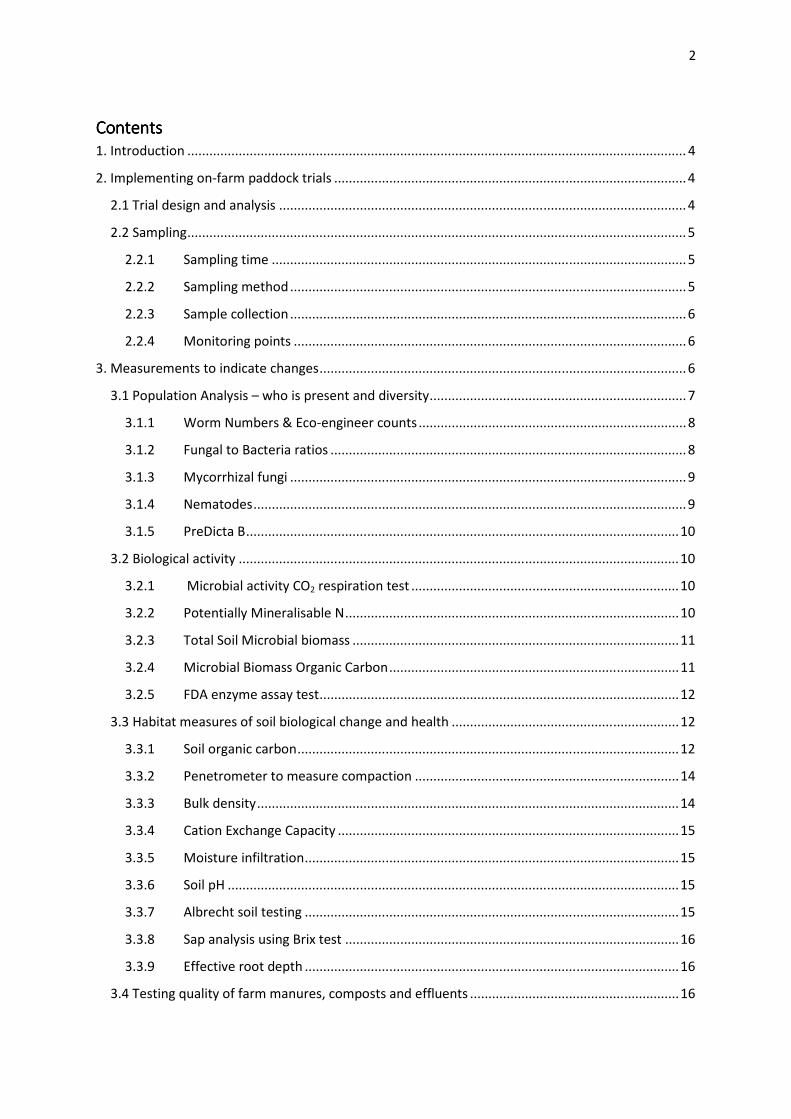
ContentsContentsContentsContents
1. Introduction ........................................................................................................................................ 4
2. Implementing on-farm paddock trials ................................................................................................ 4
2.1 Trial design and analysis ............................................................................................................... 4
2.2 Sampling ........................................................................................................................................ 5
2.2.1 Sampling time ................................................................................................................. 5
2.2.2 Sampling method ............................................................................................................ 5
2.2.3 Sample collection ............................................................................................................ 6
2.2.4 Monitoring points ........................................................................................................... 6
3. Measurements to indicate changes .................................................................................................... 6
3.1 Population Analysis – who is present and diversity ...................................................................... 7
3.1.1 Worm Numbers & Eco-engineer counts ......................................................................... 8
3.1.2 Fungal to Bacteria ratios ................................................................................................. 8
3.1.3 Mycorrhizal fungi ............................................................................................................ 9
3.1.4 Nematodes ...................................................................................................................... 9
3.1.5 PreDicta B ...................................................................................................................... 10
3.2 Biological activity ........................................................................................................................ 10
3.2.1 Microbial activity CO2 respiration test ......................................................................... 10
3.2.2 Potentially Mineralisable N ........................................................................................... 10
3.2.3 Total Soil Microbial biomass ......................................................................................... 11
3.2.4 Microbial Biomass Organic Carbon ............................................................................... 11
3.2.5 FDA enzyme assay test .................................................................................................. 12
3.3 Habitat measures of soil biological change and health .............................................................. 12
3.3.1 Soil organic carbon ........................................................................................................ 12
3.3.2 Penetrometer to measure compaction ........................................................................ 14
3.3.3 Bulk density ................................................................................................................... 14
3.3.4 Cation Exchange Capacity ............................................................................................. 15
3.3.5 Moisture infiltration ...................................................................................................... 15
3.3.6 Soil pH ........................................................................................................................... 15
3.3.7 Albrecht soil testing ...................................................................................................... 15
3.3.8 Sap analysis using Brix test ........................................................................................... 16
3.3.9 Effective root depth ...................................................................................................... 16
3.4 Testing quality of farm manures, composts and effluents ......................................................... 16

3
4. What biological product work has been done in the past ................................................................ 17
5. Types of biological products used in CCMA trials ............................................................................. 18
5.1 Composts .................................................................................................................................... 18
5.2 Biological stimulants ................................................................................................................... 18
5.3 Humates ...................................................................................................................................... 18
5.4 Animal Manures .......................................................................................................................... 19
5.5 Liquid alternative fertilisers ........................................................................................................ 19
6. Recommendations for monitoring within trials ................................................................................ 20
7. Acknowledgements .......................................................................................................................... 21
8. References ........................................................................................................................................ 21
Appendix 1 ............................................................................................................................................ 23
Appendix 2 ............................................................................................................................................ 27
4
1. 1. 1. 1. IntroductionIntroductionIntroductionIntroduction
There is great interest by farmers in improving their soil condition and health and it is likely that
biological products can play a part in helping them achieve their aims. Farmers test biological
products but can’t tell if they have worked or not. There is limited independent scientific evidence
available that farmers can tap into to help them make decisions on where and when to use them,
when they start to improve soil condition or increase plant production and what products can
reliably be used. One of the main issues producers and extension officers face is trying to establish
the benefits and if they are cost effective.
Corangamite Catchment Management Authority through the support of the Australian Government
funded numerous projects to evaluate biological products. Some of these include replicated trials
and others include paddock trials. All require monitoring of potential changes in soil properties and
understanding what is driving responses.
This paper focuses on reviewing what measurements can be taken to help evaluate biological
products in research and on farm trials. It also briefly discusses trial design and lists other relevant
biological product work locally and in southern Australia.
2222. . . . Implementing oImplementing oImplementing oImplementing onnnn----ffffarmarmarmarm paddockpaddockpaddockpaddock ttttrialrialrialrialssss
Farmers use paddock scale trialling as part of their decision making process to determine the
usefulness of biological products but it is generally ineffective. Even though they apply the product
they do not always include a control treatment to compare to, their monitoring is often limited to
visual assessment and there is no data analysis. If farmer testing is to be encouraged then it should
be made easy for them to carry out and analyse the results objectively. There will be claims made
about what the product will do. For example increase yield and improve soil structure. These claims
should drive what is measured within the trial and test if the product does what it says it will.
2222.1 .1 .1 .1 Trial design and analysisTrial design and analysisTrial design and analysisTrial design and analysis
It’s often suggested that when setting up your own field trials it is a good idea to replicate and
randomise the treatments and a minimum of three replicates of each treatment is needed to
determine statistical significance. Roger Lawes, 2010 identifies that randomised block designs with
three replicates within paddocks are not very practical to implement by farmers who want to use
their own equipment. He suggests side by side strip treatments, with 10-12 monitoring points
located in each treatment which are in close proximity and can be statistically analysed using paired
t tests. Farmers generally apply treatments in strips or to one half of the paddock but they need
assistance through case studies or calculators to show them how to analyse the results to enable
confidence in comparing products. This information which shows farmers how to conduct analysis is
currently not available.
Useful on farm trial design resources which are available:
• Designing your own experiments GRDC, 2006
5
• Doing successful on farm research, David Lawrence, Nick Christodouolou and Jeremy Whish,
QLD gov.
• Setting up PA experiments, 2008. Sam Trengrove
• Understanding trial results – Soil Health Knowledge bank, Australian Government
• Protocol for ‘Paired Paddocks’ in the DAFF project: ‘Farmers leading and learning about the
soil carbon frontier’ Harm Van Rees, Dec 2003
• Trial design and analysis using precision agriculture and farmer’s equipment, 2010. Roger
Lawes, CSIRO Sustainable Ecosystems, Centre for Environment and Life Sciences, Floreat, WA
• Chapter 6. “A practical guide to improving soil health and reducing losses from soil borne
disease’, In Soil health, soil biology, soilborne diseases and sustainable agriculture, 2016. By
Graeme Stirling, Helen Hayden, Tony Pattison, Marcelle Stirling, CSIRO publishing.
2222.2 .2 .2 .2 SampSampSampSampling ling ling ling
2.2.1 2.2.1 2.2.1 2.2.1 Sampling timeSampling timeSampling timeSampling time
If trying to monitor and identify changes in soil condition biological products have made then it is
important to sample and compare at the same times and under the same seasonal conditions each
year. Results can provide guides rather than absolute figures and be used to look at trends over
time.
Different tests will have optimum times as microbial populations vary greatly during the year and
will be affected by the presence of a crop and its management. Generally measurements should
always be taken at times when soil biology is likely to be relatively stable. Therefore sampling should
not be sampled in the height of summer, depth of winter or immediately after rain (Stirling et al,
2016).
2.2.2 2.2.2 2.2.2 2.2.2 Sampling methodSampling methodSampling methodSampling method
For researchers, the sampling method used can vary depending on what is being measured or the
research question. How many samples to take to get a fair representative sample of the paddock’s
biology or chemistry within treatments is different from researchers who want to know how much
spatial variation there is across a paddock.
Dr Helen Hayden, is a soil microbial ecologist with AgVic, Bundoora and part of Professor Pauline
Mele’s Department of Applied System Biology Research Scientist with AgVic. Hayden is generally
looking at responses to a treatment and will be comparing treatments across several paddocks. The
approach used is to minimise field variation due to spatial heterogeneity. For her biological testing
she collects 6 to 10 cores or more by walking in a W across a field and then bulks them into one
sample, then repeats by walking the W in the other direction to collect a second sample. Hayden will
ensure that her 6 to 10 samples from a paddock are made of homogenised cores to give a
representative sample of that paddock’s biology and matching soil chemistry. Collecting two bulk
samples for the same soil will give her “biological replicates” for the paddock but they are not true
technical replicates as every spoonful of soil may have a slightly different soil biology population.

6
Helen Hayden’s soil biology group uses approaches for some projects that are outlined in the journal
paper “Environmental and spatial characterisation of bacterial community composition in soil to
inform sampling strategies,” by Baker et al, 2009. This paper shows why their sampling approach is
effective given the spatial variability in biology that occurs within soils.
At other times the group have used a strict grid system to sample at set distances. The SCaRP project
also used a grid approach. They used 10 sampling points within a 25 by 25 metre area as a
representative sample of a given agriculture management on a particular soil type. By sampling from
a small area of each paddock, errors due to encountering a soil type that is not representative of the
targeted soil type were minimised (Sanderman et al, 2011).
2.2.3 2.2.3 2.2.3 2.2.3 Sample Sample Sample Sample collectioncollectioncollectioncollection
There are specific soil collection and storage protocols to be followed for biological analyses, which
are critical to sort out before collection. This is likely to involve keeping samples cool and send
samples by courier with ice-bricks in foam boxes.
2222....2.2.2.2.4444 Monitoring pointsMonitoring pointsMonitoring pointsMonitoring points
One of the issues with on farm trials is losing the monitoring points or trial edge corners. Stock or
equipment knock out markers. Taking GPS points can get you in the vicinity of one metre two but
are generally not accurate enough. Having trials located within 5 or 10 metres of a fence provides a
good landmark to measure from but may be unrepresentative of the rest of the paddock. Using
metal detectors to find buried corner markers (nothing sharp that could penetrate tyres) has been
used in crop lime trials eg metal rods and jar lids.
3333. . . . MMMMeasurementseasurementseasurementseasurements to indicate changes to indicate changes to indicate changes to indicate changes
Trials will generally involve monitoring of crop or pasture yield and quality and measurements within
soil or products to help understand the responses. There is a huge array of soil biology type tests
available and it is quite confusing to farmers and extension officers which ones are worthwhile using.
This is partly because soil biology as a term encompasses all living organisms in the soil, the bacteria,
archaea, fungi, micro-, macro- and meso-fauna. Not all measures cover all of the organisms present
within the soil.
The soil biology testing factsheet by NSW Agriculture points out there are three main types of soil
biology testing; population testing, biological activity and indirect indicators and describes tests
which can be used to measure them. There are also functional tests for soil microbes that are
generally only available to scientists. It’s noted that much of the available extension material
recommends tests but provides no details about where to get the tests done or potential costs
which also extends to soil chemistry. Lyn Abbott and Dan Murphy, University of WA also provide an
“overview of soil biology tests,” in Soil biology in Agriculture, 2004. DPI 2009 has a review of tools
and systems for assessing soil health which includes soil biology, chemistry and physical conditions.
This report is available from the CCMA Soil Health Knowledgebase or via VRO.

7
Kibblewhite et al 2008 points out that there are practical difficulties with assessment because soil
biology performance is multifunctional, variable and interactive with environmental factors, and
does not respond instantaneously to altered conditions. They propose that assessment should be
achieved using non living conditions or things that are indicative of their habitat (i.e. physical and
chemical conditions such as bulk density, aggregate stability, pH, cation exchange capacity), and the
levels of key energy and nutrient reservoirs (e.g. ratios of organic matter fractions and nutrient
balances); as well as measures, which describe the community composition and populations of key
functional groups of organisms (earthworms, N fixers, pest-control populations).
The Soil Quality website is no longer being updated but does contain soil biology benchmark tests
for different regions which included three sites within the Corangamite catchment. It contains
measures of microbial activity (mg CO2-C/kg, soil/day), total organic carbon, carbon stock (0-30 cm),
microbial biomass carbon, soil nitrogen content via potentially mineralisable N (PMN) and
numberous fungal and nematode pathogens from DNA testing. Dr Helen Hayden, suggested there is
an opportunity to add to these benchmarks via Prof Daniel Murphy runs the site at UWA. Most new
measures are undertaken by research groups who require financial support to be involved in
analyses.
3333.1 .1 .1 .1 Population Analysis Population Analysis Population Analysis Population Analysis –––– who is presentwho is presentwho is presentwho is present and diversityand diversityand diversityand diversity
Up to 6 billion microbes per cup of soil have been quoted which contain millions of different species.
To complicate this, populations can change throughout the seasons and with stage of the farming
practice.
Cam Nicholson, Nicon Consultant recalls testing soil biology in Woady Yaloak catchment trials. He
first sampled different treatments and the results back were vastly different. Cam then sampled soil
cores from within the same treatments side by side and sent them off for analysis. The lab tests back
showed again completely different results. He concluded that testing for soil biology species was not
helpful to determine product effects.
Dr Helen Hayden suggests Cam experienced the spatial variation that exists with soil biology which is
evident in Baker et al 2009 sampling strategies paper. Variability of bacterial community
composition was reduced within small 1 m2 sampling plots but not significantly different compared
with random pooled samples or between sampling plots. This paper also showed a dominant effect
of variable pH on bacterial community composition which had more effect than moisture content
and carbon.
Counting the numbers and types of protozoans, bacteria, nematode types, fungi and Actinomycetes
using microscopes or growing them on nutrient media is measured by some laboratories. NSW DPI
2005 stated the values of recommendations from such analysis at that time were yet to be proven.
This sentiment has been echoed by Professor Pauline Mele, microbiologist with Agriculture Victoria
and by NSW DPI (2002) who says that the absolute numbers of individual organisms are not
important but the variety of different soil organisms is. A healthy functioning soil contains a wide
8
diversity of soil organisms. Dr Helen Hayden further explains that for the counts of bacteria or fungi
they are based on the number of colonies that grow on an agar plate of culture medium. For
bacteria alone it is estimated that between 95-99% of bacterial species may not be culturable so
these counts are capturing only the very small number of species that can be grown in the
laboratory.
Specific tests are discussed below.
3333.1.1 .1.1 .1.1 .1.1 Worm Numbers & EcoWorm Numbers & EcoWorm Numbers & EcoWorm Numbers & Eco----engineer countsengineer countsengineer countsengineer counts
Ecosystem engineers are worms, dung beetles, springtails and are essential for breakdown of
organic matter. The best part about these assays/counts is anyone can do them and get results
quickly and for free. It’s noted that in many studies on the tillage and liming that worm counts are
often included as a measure of the impact on soil structure as they improve macroporosity and are
considered a general indicator of soil health, particularly soil structure and carbon levels.
Bacteria provide lots of soil functions and if one type of bacteria drops out its function can be
replaced by another species of bacteria but the role of ecosystem engineers cannot be replaced.
Visual soil assessment guides often say 6 worms per shovelful of soil are an indicator of good
activity. Helen Hayden advises the number of worms is a good baseline indicator, but to also
consider change over time in monitoring provided the measure is done at the same time each year.
The VRO site under biology tests says worm counts are not useful in areas where rainfall is below
600 mm as very little variation in count numbers observed between samples. Also, seasonality is a
factor as earthworms tend to be dormant (deep underground) in hot dry months and therefore it is
best to sample in wetter periods.
In Soil Health Guide, North Central Victoria, chp “Evidence of soil biological activity”, it recommends
count numbers of six different species evident within the topsoil is a good measure of biological
activity because it shows diversity within the soil biology.
3333.1..1..1..1.2222 Fungal to Bacteria ratiosFungal to Bacteria ratiosFungal to Bacteria ratiosFungal to Bacteria ratios
Dr Helen Hayden suggested the ratio of fungi to bacteria more important than absolute numbers.
Fungi are important because they contribute to decomposition of plant residues, and provide
additional soil functions in terms of structural stability and aeration by binding soil particles into
aggregates.
Some management practices can change the relative abundance of fungi and bacteria in the soil so
this ratio can be used as an indicator to assess the effects of management strategies and gives a
general indication of soil health. For example tillage induces shifts in the fungi:bacteria ratio which
influences the rate of organic matter decomposition and nutrient availability. Reduced tillage
systems support a fungal based system whereas conventional tillage systems support a bacterial
based system (NSW DPI, 2004). Reduced tillage systems could however be hostile to plant growth
and soil biology if compacted.
9
The VRO site on biology tests reports several ways to measure fungal:bacterial ratios:
1) direct count method - Fungi and bacteria can be directly assessed by plate counts and
the ratio of their abundance calculated.
2) Phospholipid fatty acid analysis (PLFA) -this method uses biochemical tests of fungi and
bacteria (fatty acid analysis) as a basis for estimating the proportion of fungi and
bacteria in soil.
3) substrate induced respiration (SIR) - this method assesses the ratio of fungi and bacteria
in soil based on response to addition of carbon substrates. It is based on inhibition of
fungi and bacteria in separate assays and inhibition of all biological activity as a control
which is difficult to achieve across different soils.
The VRO comments that Plate count method is straightforward which technicians could carry out
but the PLFA and SIR are more complex and all are time consuming to do but there are no
benchmarks which makes data quite difficult to interpret. Therefore the validity of this measure is
questionable.
Some commercial laboratories which may offer this test include Microbiology Laboratories
Australia, SWEP and AgVita analytical.
3.1.3.1.3.1.3.1.3333 Mycorrhizal fungi Mycorrhizal fungi Mycorrhizal fungi Mycorrhizal fungi
Mycorrhizal fungi form mutualistic associations with plant roots that aid nutrient uptake particularly
for phosphorus (P) and zinc (Zn). Arbuscular mycorrhizal (AM) fungi plays an important role in
providing glues such as glomalin which help maintain aggregate stability. Tillage and fungicides can
reduce AM colonisation of crops and so may be an indicator of the effects of these management
practices.
Helen Hayden commented nearly all crop plants can form AM associations. The exceptions are
lupins and brassicas such as canola. Crop sequences which involve mainly lupin or canola or have
long fallows which have extended periods without AM plants can reduce nutrient uptake and yield
of following host crops (personal communication Helen Hayden).
With mycorrhizae naturally occurring in soil with cereal crops there may be little need to apply it via
biological products. You can’t also always visually see it on plant roots without the use of a
microscope. The fact sheet for the Soil Quality website contains good information on arbuscular
mycorrhiza. http://www.soilquality.org.au/factsheets/arbuscular-mycorrhizas-s-a
3333.1.4 .1.4 .1.4 .1.4 NematodesNematodesNematodesNematodes
Dr Helen Hayden suggested nematodes were important to assess because as well as pathogenic
nematodes there are also beneficial nematodes that regulate the soil food web. Some nematodes
eat bacteria, some trap fungi, some eat other nematodes and thus they are important in regulation
of other organisms and the transfer of nutrients and energy within the soil food web.
The Soilquality organisation website contains a factsheet titled “A practical test to assess the
biological status of Australian grain-growing soils” that discusses using nematodes as a biological
10
indicator. It also discusses PreDicta B tests by SARDI for measuring Free Living Nematodes and also
parasitic nematodes. The costs of the tests are $95 each and are quantitative tests.
3333.1..1..1..1.5555 PrePrePrePreDDDDicta Bicta Bicta Bicta B
SARDI offer DNA tests for identifying specific microbes. These are namely ones that are pathogens or
pests which cause soil borne diseases.
Predicta B is important because it primarily measures soil plant pathogens and nematode pests for
grain production. It will give farmers a guide to the disease risk for forthcoming season. Samples
need to be collected by trained agronomists of which there are some in the Corangamite region.
Helen Hayden recommends it especially for farmers who may not be aware of diseases or those who
are and wish to monitor them before selecting the next season’s crops.
3333.2 .2 .2 .2 Biological activityBiological activityBiological activityBiological activity
Biological activity tests measure what soil organisms are doing at a point in time and so are useful in
comparing the effectiveness of soil amendment treatments. For example biological assays such as
CO2 respiration measure CO2 released into soil by soil biology and capture “activity” at that point.
These tests are different to the population studies which show “who is there” at a point in time.
3333.2.1.2.1.2.1.2.1 Microbial Microbial Microbial Microbial activity activity activity activity COCOCOCO2222 respiration testrespiration testrespiration testrespiration test
Microbial activity can be determined by soil respiration test. Carbon dioxide is respired by soil
microbes as they decompose organic matter and the rate of soil respiration is determined by
measuring the CO2 efflux over 7 days at 25oC. This is a basic test of soil biology and is offered by
some soil biology labs (e.g. Microbiology Laboratories Australia (www.microbelabs.com.au) and
Nutrient Advantage is exploring including this measure in their tests. CSBP does not offer it. Helen
Hayden describes this test as a useful baseline measure of soil biology. It is one of the measures
used in the Soil Quality website measuring microbial activity (mg CO2-C/kg, soil/day). Their website
contains a good description of soil respiration at http://soilquality.org/indicators/respiration.html#
3333.2.2 .2.2 .2.2 .2.2 Potentially Potentially Potentially Potentially MMMMineralisable Nineralisable Nineralisable Nineralisable N
As the active microbial biomass decomposes soil organic matter and plant residues, nitrogen can be
released into plant available mineral forms. Potentially mineralisable nitrogen (PMN) is an indicator
of the capacity of the soil microbial community to convert (mineralise) nitrogen tied up in complex
organic residues into the plant available form of ammonium.
Soil samples are incubated for 7 days and the amount of ammonium produced in that period reflects
the capacity for nitrogen mineralisation. The higher the number the more likely that soil will release
nitrogen. Soils with high levels of nitrogen-rich organic matter (e.g. soils where legumes are in
rotation) tend to have the highest populations of microbes involved in nitrogen mineralisation and
the highest PMN rates.

11
Nutrient Advantage can provide this test upon request and the UWA group led by Prof Daniel
Murphy's group. It was used in the soil biology benchmarking program and is featured within the Soil
Quality website as a test for Soil Nitrogen Supply.
Both Pauline Mele (AgVic) and Mark Farrell, CSIRO who leads the GRDC funded project,
“Understanding Biological input farming,” suggested this test as a good reliable measure of soil
biology. The advantage of this test is that it can be performed by commercial soil chemical testing
laboratories unlike microbial biomass which is explained below.
3333.2.3 .2.3 .2.3 .2.3 Total Soil Microbial biomass Total Soil Microbial biomass Total Soil Microbial biomass Total Soil Microbial biomass
Microbial biomass is important for many reasons:
• with fauna it’s part of the living component of soil organic matter which consists of 2 to 7%
of the organic carbon in soils.
• acts as the engine for organic matter turnover and nutrient release.
• a storehouse of plant essential nutrients. For example nitrogen levels in microbial biomass
range from 15 kg to 150 kg N/ha.
• nutrients held in microbial biomass are not prone to leaching and are released for plant
uptake as a result of their death through predation or soil drying.
• Its interaction with organic matter largely determines the fertility and overall soil quality.
Microbial biomass is a measure of the total living microbial weight (mass) of a soil). It measures all
bacteria and fungi present in the soil, including those which decompose crop residues and organic
matter in soil. It is measured by using a soil chloroform to kill microbes and the the soil biomass
carbon content is extracted and calculated based on the difference between the carbon content of
the treated versus untreated soil.
Microbial biomass is not equal to CO2 respiration through some laboratories try to make out they
are the same. Pauline Mele, AgVic, also suggests this is a good measure of soil biology which has
done in the past by the UWA group led by Prof Daniel Murphy's group as fee for service. It was used
as part of the soil biology benchmarking within the Soil Quality website, microbial biomass carbon.
However, it is not measure in most commercial labs because it uses chloroform which is dangerous,
labour intensive, and is not so easily made into a high throughput assay for them to use
commercially. Therefore it is a measure only scientific laboratories might be able to do and not
readily available to farmers.
The Soil Quality website states the best time to sample for microbial biomass is during the dry
summer months when soil is collected for chemical analysis by commercial laboratories. Microbial
biomass varies greatly during the year, however during summer it is more stable because both
organic carbon inputs and soil water are low. Single measurements of microbial biomass can be
difficult to interpret, but trends over time are a relatively simple way of assessing the effect of
management on soil microorganisms.
3333.2.4 .2.4 .2.4 .2.4 Microbial Microbial Microbial Microbial Biomass Organic CarbonBiomass Organic CarbonBiomass Organic CarbonBiomass Organic Carbon

12
Microbial biomass organic carbon (MBOC) uses a relatively simple microwave treatment to obtain a
measure of the carbon bound in microbes. This test is an indirect measure of microbial activity which
expresses mg Biomass Carbon/gram dry weight equivalent soil. Lisa Warn, formerly a consultant
with Mackinnon Project used this test performed by the NSW DPI, Woollongbar laboratory as part of
her study of poultry litter amendments 2012.
3333.2.5 .2.5 .2.5 .2.5 FDA enzyme aFDA enzyme aFDA enzyme aFDA enzyme assay testssay testssay testssay test
Specific microbial enzyme activities can be measured to give an indication of microbial processes
carried out in the soil. Various biochemical assays exist for a range of enzymes. Such assays can be
used as general indicators of soil microbial health or more likely may be used to address more
specific questions about microbial processes.
FDA assay (fluorescein diacetate) is a specific enzyme assay which includes phosphatase and urease,
enzymes involved in phosphorus and nitrogen transformations. It expresses values as ug sodium
fluorescein/gram dry soil/minute and relatively simple and is widely used to estimate general
microbial activity (Reid and Cox, 2005). This assay was also used by Lisa Warn, 2012.
3333.3 .3 .3 .3 HabitatHabitatHabitatHabitat measures of measures of measures of measures of soil biologsoil biologsoil biologsoil biological cical cical cical change and healthhange and healthhange and healthhange and health
Monitoring the soil environment which encourages favourable conditions for microbiology is an
indirect way of measuring soil biology or to help explain yield responses. Some biological products
may improve soil condition or lay claims to and so require assessment. Indirect ways soil condition
can impact on soil biology are:
• Soil organic carbon as a food source
• Porosity for air and water movement which can be measured through bulk density testing.
• Compaction the use of penetrometers for detection of compaction
• Soil temperature which can be measured directly or indirectly by groundcover percentage
for soil protection.
• Cation Exchange Capacity measured by laboratory testing reflects the nutrient holding
capacity of the soil and is influenced by carbon levels.
• Soil pH as a measure of soil acidity can affect microbiology composition, survival and
performance. Ideal pH for microbial activity is pH(Ca) 6.0 to 7.5 (Stirling et al, 2016).
Monitoring plant yield is an obvious measurement for evaluating biological products. Sap analysis
can be claimed by some laboratories to provide a useful indicator of biological performance.
Further measurements in soil condition and other indirect test options are discussed.
3333....3333.1 .1 .1 .1 Soil organic carSoil organic carSoil organic carSoil organic carbonbonbonbon
Organic carbon provides a broad measure of biology because soil organisms represent a portion of
the carbon in soil, and the more soil carbon there is the more biological activity and diversity there
will be.

13
There are concerns that it takes a long time to detect changes in organic carbon and that with soil
variability measuring soil carbon may not be a worthwhile measurement. However, in a crop residue
trial, differences in carbon (Leco measured) between treatments were identified in the 0-2.5 cm and
2.5 to 5cm (Chowdury et al, 2015). Most carbon sources are surface applied and so it makes sense
that they are more likely to affect the top few centimetres of soil. These depths would not usually be
examined in soil samples taken for chemistry analysis which may cover 0-10 cm and 10-20 cm in the
profile.
The VRO biology test site also states that research has shown that active carbon is a good “leading
indicator” of soil health response to changes in crop and soil management, usually responding to
management much sooner (often, years sooner) than total organic matter percent.
Measurement of soil organic carbon is also affected by variation caused by contamination of plant
material, dung and organic debris and so as much as possible should be avoided at sampling before
analysis (Conyers et al, 2011).
There are four commonly available organic carbon tests which include:
1. Labile Carbon or Active Carbon
Labile carbon is an indicator of the fraction of soil organic matter that is a readily available food
source (carbon) which all soil microbes depend on and thereby provides an indicator of
biological activity.
In the past labile carbon field test kits have been used by the Agriculture Victoria, soil health
team which use colour indicators of levels and may be a good tool for extension.
The soil is mixed with potassium permanganate (deep purple in colour) and as it oxidises the
active carbon the colour changes (becomes less purple), which can be observed visually, but is
very accurately measured with a spectrophotometer. Active carbon is positively correlated with
percent organic matter, aggregate stability, and with measures of biological activity such as soil
respiration rate.
Monitoring the changes in active carbon can be particularly useful to farmers who are changing
practices to try to build up soil organic matter (e.g., reducing tillage, using new cover crops,
adding new composts or manures).
Labile carbon test is offered by Nutrient Advantage.
2. Walkley- Black Wet Oxidation method
This method measures readily oxidisable Carbon. It’s reported by most laboratories and often
measuring total organic carbon (TOC) but underestimates soil organic carbon, detecting only
approximately 76% (Conyers et al, 2011).
3. Leco dry combustion method
It directly measures carbon by burning of soil and plant material and measuring carbon dioxide.
It was expensive but has come down in price (about $17 per sample).
14
Leco test measures total carbon which includes organic carbon but also inorganic carbon such as
calcium carbonate which can be common in calcarosol soils but is an accurate measure of the
total organic C in other soils. The Walkley Black test does not measure carbonates. The Leco test
can also be used to measure Nitrogen and gives cropping farmers an accurate reading on the
amount of nitrogen contained within their soil.
4. Mid-Infrared (MIR) spectroscopy
Mid Infrared spectroscopy measures light reflectance of soils and carbon amounts are then
calculated using accurate calibration curves developed from actual carbon data collected using
LECO tests. It is also used to measure the carbon fractions, which provides better information on
carbon stability. It is a cheaper measurement tool that has been under development. It is not
known if it is commercially available but it can be done through CSIRO, SA or AgVic, McCleod
laboratories.
3333....3333.2 .2 .2 .2 Penetrometer to measure compactionPenetrometer to measure compactionPenetrometer to measure compactionPenetrometer to measure compaction
The penetrometer gives an indication of penetration resistance/soil strength and is highly
dependent on soil moisture content. This can make comparisons between sites and days a bit
difficult to interpret without having some detailed measurement and recording of soil moisture
content. This can be complicated by different treatments using moisture differently.
The penetrometer is useful for field demos and demonstrating differences in compacted versus
uncompacted zones at the same site on the same day. According to Tim Johnson, former Agriculture
Victoria Soil Extension Officer Scientist they offer less value for research trials. However, its
attractiveness is its ease of measurements and the number of tests that can be taken. A
penetrometer costs approximately $500.
A cone penetrometer is the most suitable type of penetrometer for this type of use. The basic
penetrometers have a "speedo" type dial which you have to manually read and this can be tricky to
push the probe in and read at the same time, especially if you break through a less resistant layer.
Graeme Ward, former Agriculture Victoria, researcher with the dairy team says it takes a little bit of
time to use to using them. Graeme suggests a better but more expensive type is a recording
penetrometer that records the soil strength/resistance down the soil profile in increments and you
then download the data to a computer for analysis which overcomes the reading difficulty.
3333....3333.3 .3 .3 .3 Bulk density Bulk density Bulk density Bulk density
Bulk density is an indication of how compacted the soils are. It’s a measure of the weight of the soil
in a known volume. Light soils contain lots of air, but heavy soils have usually had the air squashed
out of them and pore spaces collapsed and so compacted soils will contain more carbon and
nutrients. Bulk densities above 1.5 g/cm3 are usually considered compacted.
Bulk density tests are less dependent on soil moisture but are difficult to take with each bulk density
test requiring cores of soils to be cut out without compacting them. For a 0-10cm bulk density core
its estimated to take about 10 minutes per core for sampling. However hydraulic soil corers can be
used to sample large soil cores (75 cm diameter) provided they don’t compact the soil at sampling
and are often used in field sampling. They do however need to be taken when soils contain moisture

15
so that the cores remain intact so that the exact soil volume is collected. Soil moisture content can
also be calculated using samples.
Graham Ward commented that bulk density remains a sound experimental technique, but given the
spatial variability amongst soils, that you have to take lots of cores. Bulk density can also be related
to porosity.
3333....3333....4 4 4 4 Cation Exchange CapacityCation Exchange CapacityCation Exchange CapacityCation Exchange Capacity
Cation exchange capacity (CEC) is a measure of the soil’s ability to hold positively charged ions. It is a
very important soil property influencing soil structure stability, nutrient availability, soil pH and the
soil’s reaction to fertilisers and other ameliorants. Bill Grant, Blue Environment consultant who
spoke at the SW Dairy Compost March 2016 seminars was confident that composts will increase
cation exchange of the soil.
3.3.5 3.3.5 3.3.5 3.3.5 Moisture infiltrationMoisture infiltrationMoisture infiltrationMoisture infiltration
McEwan et al (2009) describes two moisture related measurement tools that are relatively simple
tools that may be useful for determining changes in soil condition by amendments. Determination
of volumetric soil water content which involves measuring soil bulk density once for the horizon and
then measurements of soil water content.
Infiltration tests can be used as an indicator of compaction where a 200 mm PVC tube in inserted
into the ground and a known amount of water is applied to pre-wet soil or soil near field capacity.
The time taken for the water to infiltrate is recorded and the infiltration rate is calculated. DPI
reports the method as inexpensive and fairly rapid (30 minutes to 4 hours).
Soil moisture probes could also be useful. Web sites with a range of soil measuring devices are
shown in Appendix 2.
3333....3333....6666 Soil pHSoil pHSoil pHSoil pH
Most biological products won’t claim to increase soil pH. However, soil acidity levels are important
to measure as they can affect potential responses to products. For example the rate of organic
matter breakdown of composts can be slowed if acidity restricts microbial activity (pHCa less than
5.0). Composts can also slightly increase soil pH by providing alkalinity.
3.3.3.3.3333....7777 Albrecht soil testingAlbrecht soil testingAlbrecht soil testingAlbrecht soil testing
Some soil testing laboratories offer “Albrecht” concept soil testing and it can be a preferred soil
testing method by sellers of biological products. Its concept is based on a balanced soil concept
where optimal plant growth will only occur in soils with ideal cation ratios. However many
researchers and research organisations have disputed this concept in favour of using a sufficiency
level concept, where there are definable levels of individual nutrients in the soil below which crops
will respond to added fertilisers and above which they will probably not respond (Kopittke and
Menzies, 2007 and NSW Agriculture 2002). Examples of soil testing laboratories that offer this
testing are EAL and SWEP.

16
3.3.3.3.3.3.3.3.8888 Sap analysis Sap analysis Sap analysis Sap analysis usingusingusingusing Brix testBrix testBrix testBrix test
Some biological product sellers can recommend plant sap testing using “Brix”. "Brix" measures
primarily sugars and minerals in plant sap that cause refraction. A refractometer is the instrument
used to obtain a brix reading. Refractometers can be hand-held instruments or more sophisticated
instruments costing up to $600. EAL laboratory offers Brix sap testing.
It has mainly been used in wine making and the fruit and vegetable industry to measure quality and
has been adapted for use for farmers. The idea behind it is to test the leaf of the growing plant to
detect potential deficiencies before the crop matures. Supporters of the Brix method claim crops
with a leaf Brix of 12 or better leaf Brix will be of high nutritional value and disease and pest
resistant. A low rating means that your crop will not grow to its potential due to some external
limiting factor, such as: a dilution of its nutrients due to high nitrate content, a mineral imbalance in
the soil allowing weeds to flourish and take from your harvest, a low calcium content in the soil or a
low/steady boron reading indicating an issue with the translocation of sugars within the plant. A Brix
chart allows interpretation of results based on refractive index of different crop species.
3.3.3.3.3.3.3.3.9999 Effective root depth Effective root depth Effective root depth Effective root depth
Effective root depth methodology is described in Soil Analysis: An interpretation manual, Chp 4 pg
66. It involves visual observation and estimation of the presence of roots. It requires a soil pit face
and placing a wire frame of 100m2 and estimating the amount of visible roots which are < 2 mm in
diameter within the frame and classify as few < 10; common 10-200 and abundant > 200.
The method could possibly be adapted by using a hydraulic corer and extracting large soil cores and
splitting them lengthways to create a vertical face and estimating roots within 10 cm depth
increments whilst also visually recording horizons and compaction areas. More cores could be taken
to account for spatial variation.
3.3.3.3.4444 TestingTestingTestingTesting quality ofquality ofquality ofquality of farm manures, composts and effluentsfarm manures, composts and effluentsfarm manures, composts and effluentsfarm manures, composts and effluents
Bill Grant, Blue Environment consultant provided good independent advice on the purchase of
composts and what specifications they should meet at the SW Dairy Compost March 2016 seminars.
Bill’s specific advice was to ask composters for specifications for the product you are getting from
them which includes:
• Australian Standard 4454 2012 test results which sets minimum quality management and
product quality thresholds and not just for contamination,
• documented compost management systems and records showing pasteurisation, monitoring
and product testing.
• sampling and product analysis by a reputable laboratory.
• Analysis which contains information on carbon to nitrogen levels which can pose issues for
nitrogen draw down on crops or pastures.
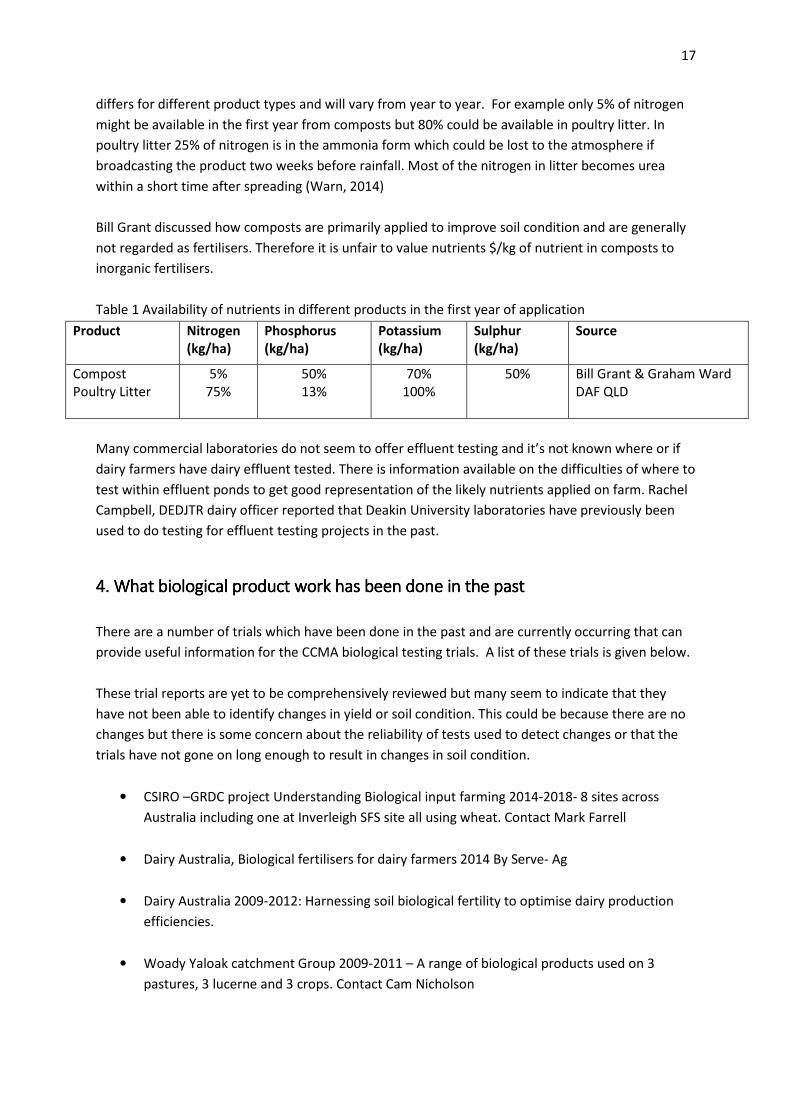
Many biological products like composts or manures contain nutrients but it’s important for farmers
and extension officers to realise that these may not be readily available to the plant and have to be
first converted into plant useable nutrients by soil biology. The amount of nutrients readily available
17
differs for different product types and will vary from year to year. For example only 5% of nitrogen
might be available in the first year from composts but 80% could be available in poultry litter. In
poultry litter 25% of nitrogen is in the ammonia form which could be lost to the atmosphere if
broadcasting the product two weeks before rainfall. Most of the nitrogen in litter becomes urea
within a short time after spreading (Warn, 2014)
Bill Grant discussed how composts are primarily applied to improve soil condition and are generally
not regarded as fertilisers. Therefore it is unfair to value nutrients $/kg of nutrient in composts to
inorganic fertilisers.
Table 1 Availability of nutrients in different products in the first year of application
Product Nitrogen
(kg/ha)
Phosphorus
(kg/ha)
Potassium
(kg/ha)
Sulphur
(kg/ha)
Source
Compost
Poultry Litter
5%
75%
50%
13%
70%
100%
50%
Bill Grant & Graham Ward
DAF QLD
Many commercial laboratories do not seem to offer effluent testing and it’s not known where or if
dairy farmers have dairy effluent tested. There is information available on the difficulties of where to
test within effluent ponds to get good representation of the likely nutrients applied on farm. Rachel
Campbell, DEDJTR dairy officer reported that Deakin University laboratories have previously been
used to do testing for effluent testing projects in the past.
4. 4. 4. 4. What What What What biological biological biological biological product product product product work hawork hawork hawork has been done in the past s been done in the past s been done in the past s been done in the past
There are a number of trials which have been done in the past and are currently occurring that can
provide useful information for the CCMA biological testing trials. A list of these trials is given below.
These trial reports are yet to be comprehensively reviewed but many seem to indicate that they
have not been able to identify changes in yield or soil condition. This could be because there are no
changes but there is some concern about the reliability of tests used to detect changes or that the
trials have not gone on long enough to result in changes in soil condition.
• CSIRO –GRDC project Understanding Biological input farming 2014-2018- 8 sites across
Australia including one at Inverleigh SFS site all using wheat. Contact Mark Farrell
• Dairy Australia, Biological fertilisers for dairy farmers 2014 By Serve- Ag
• Dairy Australia 2009-2012: Harnessing soil biological fertility to optimise dairy production
efficiencies.
• Woady Yaloak catchment Group 2009-2011 – A range of biological products used on 3
pastures, 3 lucerne and 3 crops. Contact Cam Nicholson
18
• Holbrook Landcare Network 2010-2012 – phalaris pasture on one high fertility site
• Binalong Landcare Group 2009-2011 – native pastures on three low fertility sites
• Mackinnon Project 2009-2012 – Use of poultry litter and humic acid applied to inorganic
fertiliser on two improved pastures on two high fertility soils. Contact Lisa Warn.
5. 5. 5. 5. Types of biological productsTypes of biological productsTypes of biological productsTypes of biological products used in CCMA trialsused in CCMA trialsused in CCMA trialsused in CCMA trials
Biological amendments can include microbes, composts, manures, biochars, biosolids and bio-
stimulants, as well as their value-added products. There are a wide range of products available in
each of these categories, and products may come in bulk, pelletised or liquid forms. Some biological
products remain within the soil for a short time (e.g. bio-stimulants, amino acids) and may require
multiple applications per season to be effective. Other products have slower rates of turnover,
remain in the soil for multiple seasons, and can impact soil function over a longer timeframe (e.g.
manures, biochars). While many of these biological farming inputs have been available for a long
time, their effectiveness and return on investment has not been consistently independently
assessed. Products used in the CCMA landhealth trials are discussed below.
5.1 5.1 5.1 5.1 CompostsCompostsCompostsComposts
There were two different types of commercial compost used, one based on animal manures and one
made from plant green waste. Analysis testing of these different composts has been done through
Nutrient Advantage.
Compost claims may include that they increase soil carbon by adding slower-degrading organic
carbon/humus to the soil, increase cation exchange, add nutrient, improve soil structure, improve
water and nutrient holding, boost soil biology and suppress diseases.
5.2 5.2 5.2 5.2 Biological stimulantsBiological stimulantsBiological stimulantsBiological stimulants
The biological stimulant used in the trials (TM) claims it allows for a reduction in the use of inorganic
fertilisers, creates disease resistance in plants and improves soil condition by promoting loose
aerated soil.
It requires application several times a year on pastures and on bare soil with crops. Manufacturers
say that it mimics plant exudates, which stimulates soil biology. There was some thought that it was
citric acid based which tapped into usually unavailable phosphorus, however manufacturers deny
this. The Woady Yaloak Catchment Group followed up testing of TM in 2012 after success in one of
three trial sites in their testing of alternative fertilisers in 2009 to 2010 which included Cape Clear
(crop) and Mannibadar (pasture). TM appeared to show responses on sites which contain nutrient
deficiencies.
5.3 5.3 5.3 5.3 HumatesHumatesHumatesHumates
19
Humates were applied at three soil biology trial sites and have been used in a SCIPN case study on
stubble digestion. They have also been trialled by Lisa Warn, Mackinnon Project to compare poultry
litter versus inorganic fertilisers plus humic acid.
Sellers of humates claim they can contain up to 60% humic acid. Humus is a relatively stable form of
organic carbon which is appealing. However, Roget and Gupta (2004)reports that humate products
are generally extracts from leonardite or lignite which are minerals similar to brown coal, and differ
from those extracted as humic acid from soil organic matter. They also say that improving soil
organic matter through application is unlikely given the amount needed to be applied. However,
they report there are many claims and some reports that adding humic acid products may stimulate
plant growth and increase yield, possibly due to mechanisms such as delaying precipitation of
phosphorus from mineral fertilisers in certain soil types. Humic acid type products are also used in
stubble digesters which are claimed to hasten stubble breakdown.
Humates are generally regarded to be a soil conditioner that increases cation exchange capacity and
the ability of the soil to retain nutrients, promote good soil structure and improve water holding
capacity. They are also claimed to stimulate beneficial microbial activity and root growth.
5.4 5.4 5.4 5.4 Animal ManuresAnimal ManuresAnimal ManuresAnimal Manures
Animal manures are frequently claimed to be a natural alternative fertiliser and soil conditioner
which improve soil structure and organic carbon content. Examples are poultry litter, pig manure
and dairy effluent. Lisa Warn, 2014 has done a comprehensive report on poultry litter.
5.5 5.5 5.5 5.5 Liquid Liquid Liquid Liquid alternative fertilisersalternative fertilisersalternative fertilisersalternative fertilisers
Liquid type products used in the Corangamite catchment trials have included Seasol, Powerfeed,
Nutrisol, Worm casting liquid and MCal.
Seasol is a seaweed plant conditioner that claims to promote vigorous plant growth by boosting
plant metabolism, stimulates root growth and enhances flowering, increases tolerance to heat,
drought and frost and stimulates beneficial soil microbial activity.
Powerfeed is a fish fertiliser (NPK: 14:1.4:8) that is blended with liquid humus to provide essential
nutrients which promotes vigorous growth, conditions soil, stimulates beneficial soil microbial
activity and increases plant nutrient uptake and reduces leaching.
Nutrisol is a concentrated liquid plant food produced from a vermiculture (worm recycling system).
It claims to enhance the natural growing mechanisms of the plant and soil through increasing
photosynthesis, feeding microbial communities and growing larger root systems. This allows plants
to cope better with changes in stress such as extreme climatic conditions and chemical use.
MCal is a calcium based product which claims to increase calcium in the plant and increases cell
strength.
20
Worm castings have been claimed to stimulate plant growth, enhance the ability of the soil to retain
water and inhibit root diseases such as root rot and provide humus.
6666. . . . Recommendations for monitoring within Recommendations for monitoring within Recommendations for monitoring within Recommendations for monitoring within trialstrialstrialstrials
Many of the treatments or biological products used within the Corangamite catchment landhealth
biological product trials claim to achieve greater microbial activity and improved physical properties.
Tests should be chosen that can evaluate those claims and are practical and cost effective to
implement. Some suggestions for testing are recommended in table 1. Ideally soil samples taken are
sent to the one laboratory where a range of tests can be undertaken rather than having to split
samples and send to multiple laboratories.
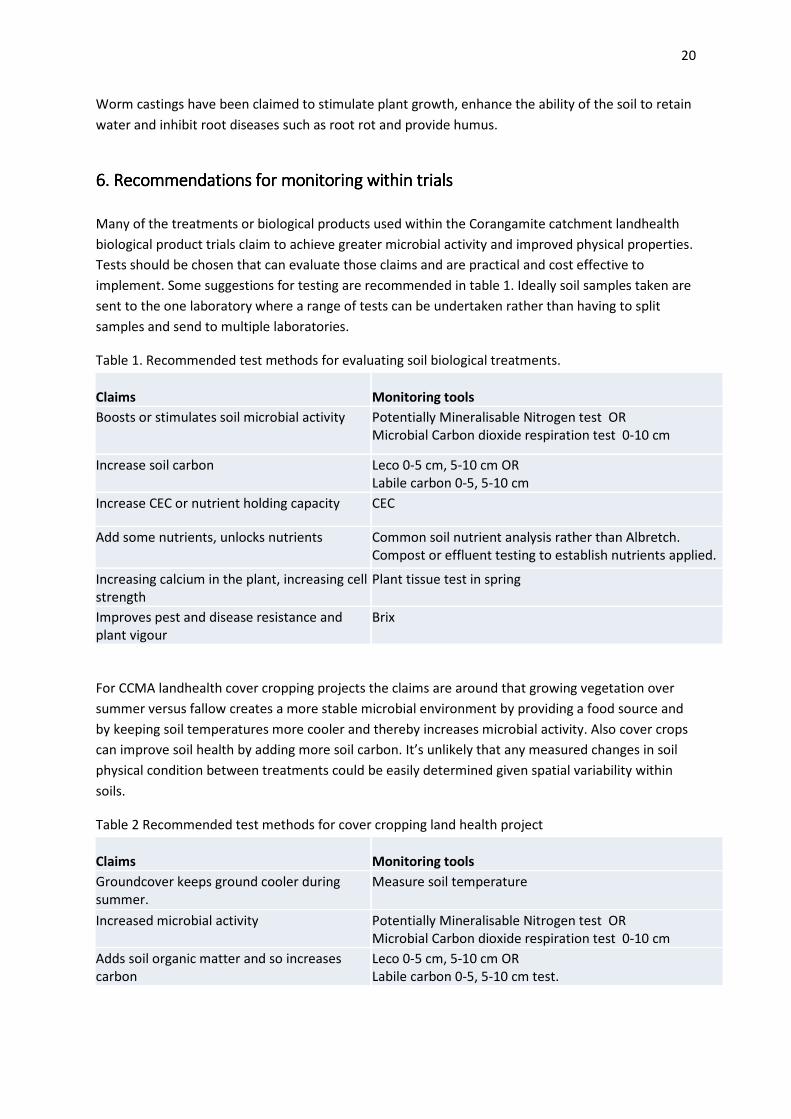
Table 1. Recommended test methods for evaluating soil biological treatments.
Claims Monitoring tools
Boosts or stimulates soil microbial activity Potentially Mineralisable Nitrogen test OR
Microbial Carbon dioxide respiration test 0-10 cm
Increase soil carbon Leco 0-5 cm, 5-10 cm OR
Labile carbon 0-5, 5-10 cm
Increase CEC or nutrient holding capacity CEC
Add some nutrients, unlocks nutrients Common soil nutrient analysis rather than Albretch.
Compost or effluent testing to establish nutrients applied.
Increasing calcium in the plant, increasing cell
strength
Plant tissue test in spring
Improves pest and disease resistance and
plant vigour
Brix
For CCMA landhealth cover cropping projects the claims are around that growing vegetation over
summer versus fallow creates a more stable microbial environment by providing a food source and
by keeping soil temperatures more cooler and thereby increases microbial activity. Also cover crops
can improve soil health by adding more soil carbon. It’s unlikely that any measured changes in soil
physical condition between treatments could be easily determined given spatial variability within
soils.
Table 2 Recommended test methods for cover cropping land health project
Claims Monitoring tools
Groundcover keeps ground cooler during
summer.
Measure soil temperature
Increased microbial activity Potentially Mineralisable Nitrogen test OR
Microbial Carbon dioxide respiration test 0-10 cm
Adds soil organic matter and so increases
carbon
Leco 0-5 cm, 5-10 cm OR
Labile carbon 0-5, 5-10 cm test.
21
7777. . . . AcknowledgementsAcknowledgementsAcknowledgementsAcknowledgements
This project is funded by Corangamite Catchment Management Authority through the support of the
Australian government.
8888.... ReferencesReferencesReferencesReferences
Abbot, L & Murphy, D (2004), Overview of Soil biology tests, In ‘Soil Biology in Agriculture’.
Proceedings of a workshop on current research into soil biology in agriculture. Ed Lines-Kelly R,
Department of Primary Industries Tamworth, NSW.
Baker K, Langenheder S, Nicol, G, Ricketts D, Killham K, Campbell CD and prosser J (2009)
Environmental and spatial characterisation of bacterial community composition in soil to inform soil
sampling strategies. Soil biology and biochemistry 41, 2292-2298.
Chowdhury S, Farrell M, Butler G and Nolan N (2015), Assessing the effect of crop residue removal
on soil organic carbon storage and microbial activity in a no-till cropping system. Soil use and
management 31, 450-460.
Conyers MK, Poile G J, Oates AA, Waters D and Chan KY (2011) Comparison of three carbon
determination methods on naturally occurring substrates and the implication for the quantification
of ‘soil carbon’. Soil Research, 49, 27-33.
DAF QLD (2012) Chicken Litter Factsheet. (Available on-line at http://www.daf.qld.gov.au/animal-
industries/dairy/feed-and-nutrition/chicken-litter (verified 3 March 2017).
Gupta VVSR and Ryder MH (2003) Soil biology in pasture systems: knowledge and opportunity audit.
Final Report BSC.007. Meat and Livestock Australia, North Sydney
Hannam R (2013) Soil biology review and project prioritisation for the feedbase investment plan.
Meat and Livestock Australia Final Report
Kibblewhite MG, Ritz Kand Swift MJ, 2008. Soil health in agricultural systems. Philosophical
Transactions of the Royal Society B, 363, 865-701
Kopittke PM, Menzies NW (2007) A Review of the Use of the Basic Cation Saturation Ratio and the
“Ideal” Soil, Soil Science Society Australia Journal, 71: Number 2, 259-265
MacEwan R, Bougoure D, Cann M, Crawford D, Heemskerk G, Imhof M, Johnston T, Noonan B, Pearl
D, Rab A. (2009) Tools and systems for assessing health, Department of Primary Industries, Bendigo,
Available on-line at
http://www.ccmaknowledgebase.vic.gov.au/soilhealth/soils_resource_details.php?resource_id=3310
(Verified April 6 2017)
Roget D and Gupta VVSR (2004) Impact of management practices on soil microbial functions in
alkaline Mallee soils. In ‘Soil Biology in Agriculture’. Proceedings of a workshop on current research
into soil biology in agriculture. Ed Lines-Kelly R, Department of Primary Industries Tamworth, NSW. P
37

22
Lawes R (2012) Trial design and analysis using precision agriculture and farmer’s equipment, Grains
Research and Development Corporation, Available on-line at
https://grdc.com.au/uploads/documents/Designing%20farm%20trials%20with%20PA%20equipment
.pdf (verified April 6, 2017)
Rural Directions (2013) Chicken Litter as fertiliser for broadacre grain crops: a user’s guide. Rural
Industries Research Development Corporation. Available on-line at
http://www.ruraldirections.com/media/Documents%202013/Chicken%20Litter%20Users%20Guide
%20V4.pdf (verified April 6 2017)
NSW Agriculture (2002) Interpreting soil tests for calcium, magnesium and Ca:Mg ratios. , Acid Soil
Action Leaf let 7, Published by NSW Agriculture,
North Central Victoria CMA (2016) Evidence of soil biological activity, In’ Soil Health Guide, North
Central Victoria’.
Reid G (2005) Soil biology basics Questions to ask about soil biology products, NSW Department of
Primary Industries. Available online at
http://www.dpi.nsw.gov.au/__data/assets/pdf_file/0004/41647/Questions.pdf (verified April 6
2017)
Reid G and Cox J (2005) Soil biology testing, NSW Department of Primary Industries. Available online
at http://www.dpi.nsw.gov.au/__data/assets/pdf_file/0018/41643/Soil_biology_testing.pdf (verified
April 6, 2017)
Sanderman, J, Baldon J, Hwake B, Macdonald L, Massis- Puccini A and Szarvas S (2011) National Soil
Carbon Research Programme: Field and Laboratory Methodologies, CSIRO, SA.
Stirling GR, Hayden H, Stirling M, Pattison T (2016) Soil Health, Soil Biology, Soilborne Diseases and
Sustainable Agriculture: A Guide. CSIRO Publishing.
Soil quality website fact sheets Available online at www.http://soilquality.org.au/au/vic
• Making sense of biological indicators
• Microbial biomass
• Microbial biomass carbon
• Microbial activity
• Soil biological fertility
• Labile carbon
• Arbuscular mycorrhizas
• A practical test to assess the biological status of Australian grain-growing soils
Warn L (2014) Chicken litter: alternative fertiliser for pastures and ways to increase soil organic
carbon. Publication No 14/067, Rural Industries Research and Development Corporation.

23
Appendix 1Appendix 1Appendix 1Appendix 1
Trial design and analysis using precision agriculture and farmer’s equipment
Roger Lawes
CSIRO Sustainable Ecosystems, Centre for Environment and Life Sciences, Floreat, WA 6913
Background
Farmers are often interested in trialling a new technology before adopting it across the farm. If
farmers have precision agriculture technology including yield monitors and variable rate controllers
they can use it to conduct an on farm trial. They can use one new technology to test another.
To date, quite complex designs have been developed to provide farmers with the information
necessary to run on farm trials (Bramley et al. 1999). Some of these approaches evolved from
techniques developed to analyse large agronomic or variety trials and unfortunately they can be
complex to implement, and analyse and interpret. In 2008 CSIRO and the Liebe Group attempted to
run some trials using these complex techniques with farmer’s machinery. Every trial failed; they are
simply not farmer friendly. Replicated and randomised block designs were not designed to be
planted with a 15 m seeder bar, managed with a 30 m spray boom and harvested with a 10 m front.
Paddock level experimentation differs from plot level experimentation in so far as the experiment is
conducted in a commercial field that must return a profit with commercial equipment. The farmer is
unlikely to allocate large areas to a treatment ‘control’ as this will generate sub optimal and
uneconomic yields. The entire cropping operations must take place in a continuous manner (i.e. split
plots are not allowed!) and be conducted in a manner that does not hinder conventional paddock
operations, such as seeding, spraying and post emergent applications of fertiliser. Trial management
should be integrated into normal paddock operations as farmers are too busy to deal with a complex
trial that requires their attention at critical periods during the crops life.
To overcome some of these practical problems faced by farmers we outline a methodology that was
successfully implemented by 4 farmers in the 2009 growing season using commercial seeding and
harvesting equipment.
Principles of on farm trials
1. Few rather than more treatments
The most important process in experimentation is to ask an appropriate question and test it.
Conventional experiments can be complex, where scientists may evaluate multiple rates of fertiliser
on multiple crop species. In on farm experiments, where treatments must fit in with a commercial
operation we recommend restricting the number of treatments to just one or two at most. The
remainder of the paddock should be thought of as a control. A simple trial that generates a definitive
outcome is better than a very complex and time consuming trial that confounds the issue.
When deciding on a treatment it is important to decide on a question that you want to ask and
these are usually prefaced with words such as ‘what, how, when or where’. For example:
• What effect does increased nitrogen have on grain yield?
• How will the crop respond to increased nitrogen?
• When will the crop yield more if nitrogen is increased (season)?
24
• Where will the crop yield more if nitrogen is increased (region)?
2. Go for large treatment differences
Once the question has been asked, it is important to make sure the treatment counts and is likely to
change the yield of the crop. It is important to remember that the objective of a trial is to learn
something about how the crop responds to inputs. To ensure this happens, the treatments must be
large enough to bring about a change in crop yield. Even though the treatment might be
uneconomic, it will provide insights into how the crop grows or how management should be
changed in different regions in the paddock. Examples of treatments that will have an impact on
crop yield if there is a deficiency or constraint might include:
• Increasing N by at least 20 kg/N/ha (ie ~ 50kg/ha of urea)
• Increasing P by at least 4 kg/P/ha
• Applying Gypsum at a rate of at least 2 t/ha
• Applying Lime at a rate of at least 2 t/ha.
3. Orientate the trial and treatments ‘up and back’
If farmers have a yield monitor they will be able to identify zones in the paddock that are high
yielding and zones that are low yielding. These areas may require different management strategies
and may respond differently to the same treatment.
To explore this, the trial should be orientated to traverse the high zone and the lower or average
yielding zone in the paddock, as indicated in Figure 1. It is also essential the sowing harvesting and
treatments are all orientated in the same up and back manner. This is vital, as it facilitates an
analysis known as a ‘pair wise comparison or t-test’ on the different zones within the paddock. This
challenges the conventional wisdom of trial design, where researchers’ would normally set the trial
up in blocks on the good zone and the poor zone. However this approach keeps the trial design
simple and ensures famers will be able to implement it with ordinary farm machinery.
The treatment should occupy at least two seeder bar widths (Figure 1). The location of the
treatment must be recorded using a GPS so it can be overlayed on a yield map. The treatment
should be located next to the control, which would often be the standard paddock management.
This minimises the amount of the paddock that is ‘experimental’ and ensures the costs associated
with running a trial are kept to a minimum. When the trial is harvested, it is important to keep the
comb within the confines of the treatment and keep the comb full through the centre of the
treatment, otherwise the yield information generated will be incorrect.

25
Figure 1. Orientation of strip trials across a paddock with high yielding and averaging yielding
zones.
4. Analyse the trial data with a paired t-test or by eye.
It is important that data from each strip (control and treatment) are not averaged and simply
compared. From the farmers perspective trial data can be analysed in formally or by eye. A paired t-
test should be employed to formally analyse the trial. There is a lot of spatial information collected
by the harvester and by pairing pixels adjacent to each other, it is possible to conduct a paired t-test
across the whole strip, and separately on the low performing zone and the high performing zone.
This is a powerful form of an analysis and is as statistically as robust as an analysis of variance.
The approach is demonstrated in figure 2 where each pair of pixels from the yield maps is treated as
an experimental unit. One of the pixels is a control, the other is the treatment. Each pair of pixel
provides a form of replication. Assuming a paddock is 500 m wide, and a yield is recorded every 10
m, there will be 50 pixels with control and treatment information. If this is split across high and low
performing zones there should still be approximately 20 pixels for each zone with trial data.
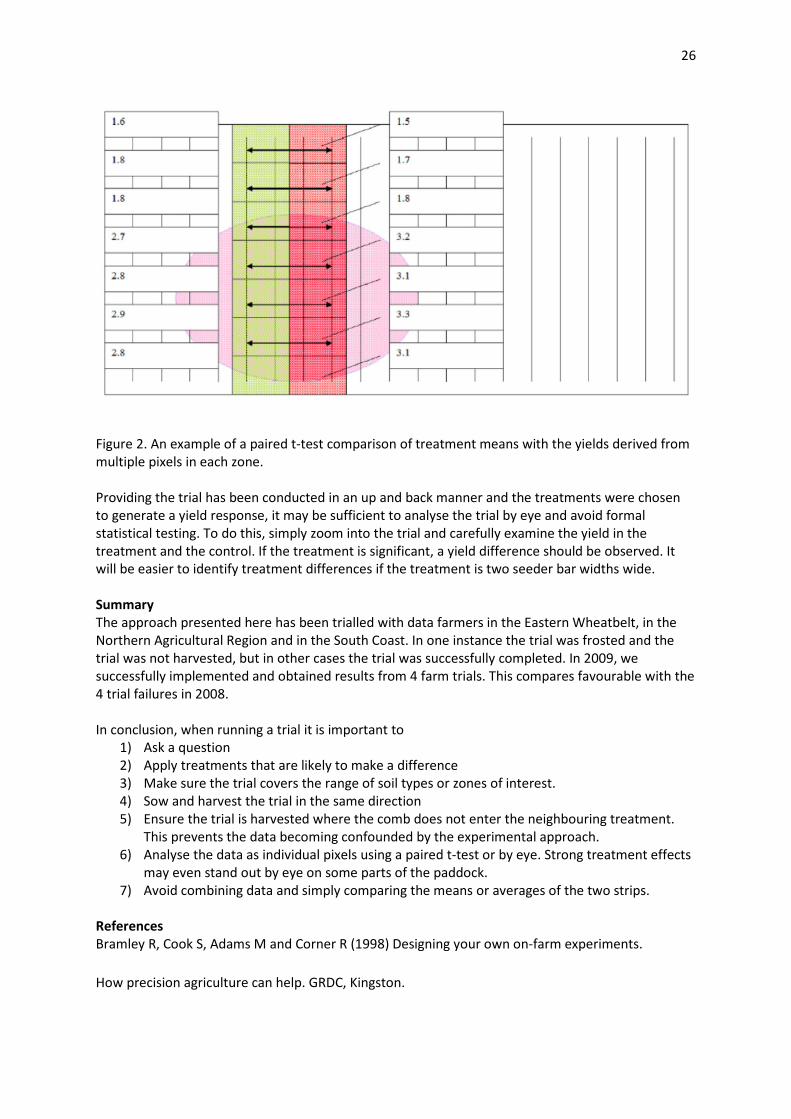
From figure 2, the average difference between the treatment and the control is just 0.18 t/ha and
using a paired t-test comparison, the difference is not significant (p = 0.09). When the low and zone
is analysed separately, the difference between the treatment and the control was just 0.06 t/ha and
not significant (p = 0.06). In contrast in the high zone the difference between the treatment and the
control was 0.375 t/ha and highly significant (p = 0.004). In this instance, it is worth applying the
treatment on the high zone.
26
Figure 2. An example of a paired t-test comparison of treatment means with the yields derived from
multiple pixels in each zone.
Providing the trial has been conducted in an up and back manner and the treatments were chosen
to generate a yield response, it may be sufficient to analyse the trial by eye and avoid formal
statistical testing. To do this, simply zoom into the trial and carefully examine the yield in the
treatment and the control. If the treatment is significant, a yield difference should be observed. It
will be easier to identify treatment differences if the treatment is two seeder bar widths wide.
Summary
The approach presented here has been trialled with data farmers in the Eastern Wheatbelt, in the
Northern Agricultural Region and in the South Coast. In one instance the trial was frosted and the
trial was not harvested, but in other cases the trial was successfully completed. In 2009, we
successfully implemented and obtained results from 4 farm trials. This compares favourable with the
4 trial failures in 2008.
In conclusion, when running a trial it is important to
1) Ask a question
2) Apply treatments that are likely to make a difference
3) Make sure the trial covers the range of soil types or zones of interest.
4) Sow and harvest the trial in the same direction
5) Ensure the trial is harvested where the comb does not enter the neighbouring treatment.
This prevents the data becoming confounded by the experimental approach.
6) Analyse the data as individual pixels using a paired t-test or by eye. Strong treatment effects
may even stand out by eye on some parts of the paddock.
7) Avoid combining data and simply comparing the means or averages of the two strips.
References
Bramley R, Cook S, Adams M and Corner R (1998) Designing your own on-farm experiments.
How precision agriculture can help. GRDC, Kingston.

27
Appendix 2Appendix 2Appendix 2Appendix 2
Websites which have a range of devices and sensors that are used to monitor soils and crops:
ICT http://au.ictinternational.com/
MEA http://mea.com.au/
Sentek http://www.sentek.com.au/
EnviroPro http://www.enviroprosoilprobes.com/


![Biological Monitoring two.ppt [Read-Only]](https://static.fdocuments.us/doc/165x107/61bd3e8561276e740b10cf81/biological-monitoring-twoppt-read-only.jpg)