Monitoring TCP-based Applications TCP-based Applications The NetScaler has a set of default monitors...
33
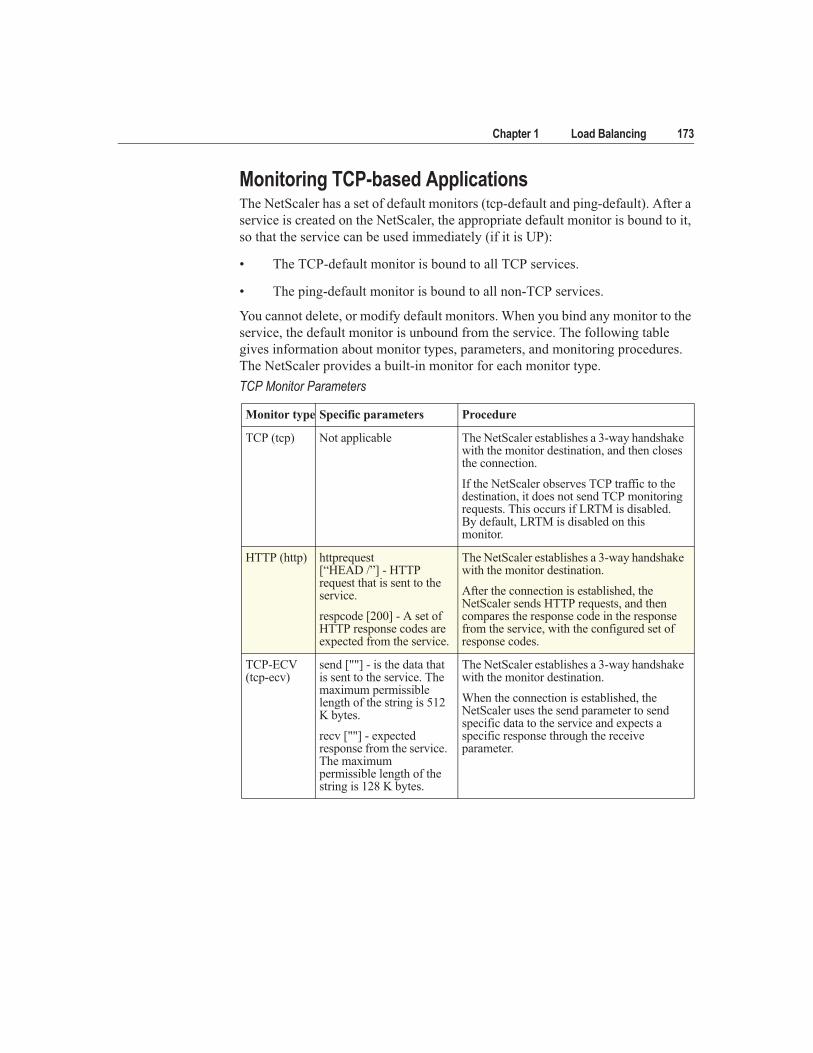
Chapter 1 Load Balancing 173 Monitoring TCP-based Applications The NetScaler has a set of default monitors (tcp-default and ping-default). After a service is created on the NetScaler, the appropriate default monitor is bound to it, so that the service can be used immediately (if it is UP): • The TCP-default monitor is bound to all TCP services. • The ping-default monitor is bound to all non-TCP services. You cannot delete, or modify default monitors. When you bind any monitor to the service, the default monitor is unbound from the service. The following table gives information about monitor types, parameters, and monitoring procedures. The NetScaler provides a built-in monitor for each monitor type. TCP Monitor Parameters Monitor type Specific parameters Procedure TCP (tcp) Not applicable The NetScaler establishes a 3-way handshake with the monitor destination, and then closes the connection. If the NetScaler observes TCP traffic to the destination, it does not send TCP monitoring requests. This occurs if LRTM is disabled. By default, LRTM is disabled on this monitor. HTTP (http) httprequest [“HEAD /”] - HTTP request that is sent to the service. respcode [200] - A set of HTTP response codes are expected from the service. The NetScaler establishes a 3-way handshake with the monitor destination. After the connection is established, the NetScaler sends HTTP requests, and then compares the response code in the response from the service, with the configured set of response codes. TCP-ECV (tcp-ecv) send [""] - is the data that is sent to the service. The maximum permissible length of the string is 512 K bytes. recv [""] - expected response from the service. The maximum permissible length of the string is 128 K bytes. The NetScaler establishes a 3-way handshake with the monitor destination. When the connection is established, the NetScaler uses the send parameter to send specific data to the service and expects a specific response through the receive parameter.
Transcript of Monitoring TCP-based Applications TCP-based Applications The NetScaler has a set of default monitors...
Chapter 1 Load Balancing 173
Monitoring TCP-based ApplicationsThe NetScaler has a set of default monitors (tcp-default and ping-default). After a
service is created on the NetScaler, the appropriate default monitor is bound to it,
so that the service can be used immediately (if it is UP):
• The TCP-default monitor is bound to all TCP services.
• The ping-default monitor is bound to all non-TCP services.
You cannot delete, or modify default monitors. When you bind any monitor to the
service, the default monitor is unbound from the service. The following table
gives information about monitor types, parameters, and monitoring procedures.
The NetScaler provides a built-in monitor for each monitor type.
TCP Monitor Parameters
Monitor type Specific parameters Procedure
TCP (tcp) Not applicable The NetScaler establishes a 3-way handshake with the monitor destination, and then closes the connection.
If the NetScaler observes TCP traffic to the destination, it does not send TCP monitoring requests. This occurs if LRTM is disabled. By default, LRTM is disabled on this monitor.
HTTP (http) httprequest [“HEAD /”] - HTTP request that is sent to the service.
respcode [200] - A set of HTTP response codes are expected from the service.
The NetScaler establishes a 3-way handshake with the monitor destination.
After the connection is established, the NetScaler sends HTTP requests, and then compares the response code in the response from the service, with the configured set of response codes.
TCP-ECV(tcp-ecv)
send [""] - is the data that is sent to the service. The maximum permissible length of the string is 512 K bytes.
recv [""] - expected response from the service. The maximum permissible length of the string is 128 K bytes.
The NetScaler establishes a 3-way handshake with the monitor destination.
When the connection is established, the NetScaler uses the send parameter to send specific data to the service and expects a specific response through the receive parameter.
174 Citrix NetScaler Traffic Management Guide
To configure built-in monitors for TCP-based applications, see “Configuring
Monitors in a Load Balancing Setup,” on page 162. To create a monitor, you must
provide values for the required parameters.
Monitoring SSL ServicesThe monitors periodically check the SSL servers. The NetScaler has four built-in
secure monitors: TCPS, HTTPS, TCPS-ENV, and HTTPS-ENV. You can use the
secure monitors to check the HTTP and non-HTTP traffic. The secure monitors
work as follows:
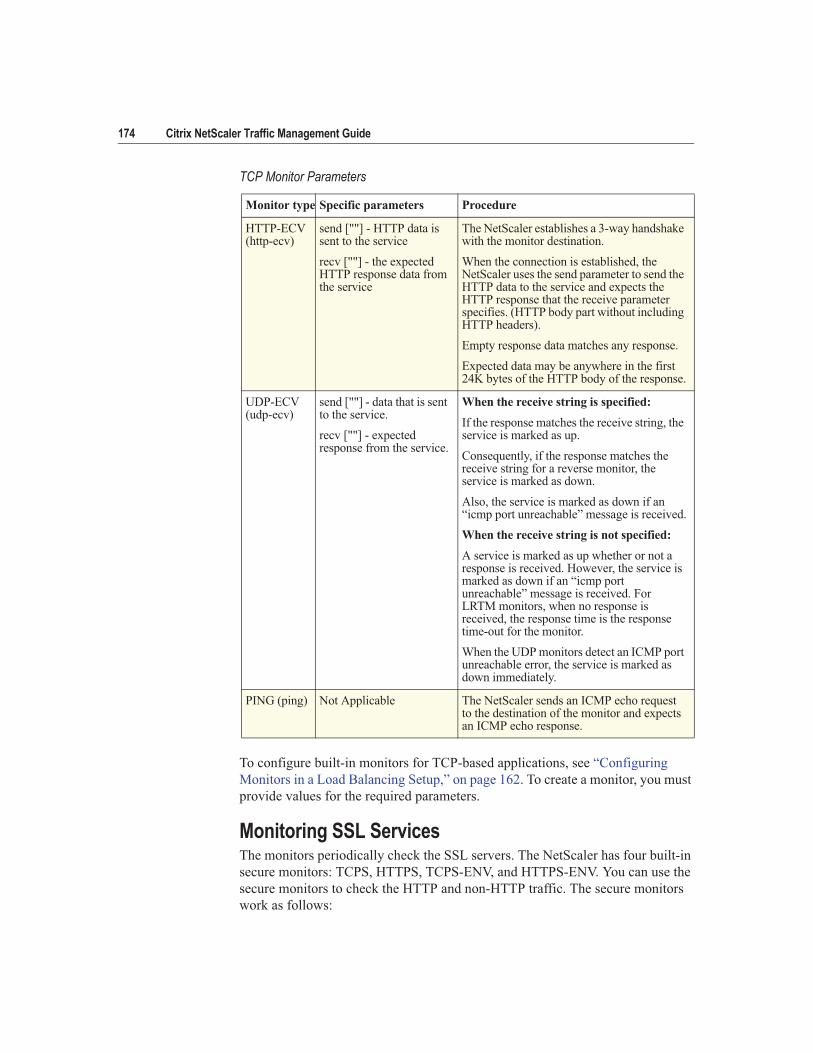
HTTP-ECV(http-ecv)
send [""] - HTTP data is sent to the service
recv [""] - the expected HTTP response data from the service
The NetScaler establishes a 3-way handshake with the monitor destination.
When the connection is established, the NetScaler uses the send parameter to send the HTTP data to the service and expects the HTTP response that the receive parameter specifies. (HTTP body part without including HTTP headers).
Empty response data matches any response.
Expected data may be anywhere in the first 24K bytes of the HTTP body of the response.
UDP-ECV (udp-ecv)
send [""] - data that is sent to the service.
recv [""] - expected response from the service.
When the receive string is specified:
If the response matches the receive string, the service is marked as up.
Consequently, if the response matches the receive string for a reverse monitor, the service is marked as down.
Also, the service is marked as down if an “icmp port unreachable” message is received.
When the receive string is not specified:
A service is marked as up whether or not a response is received. However, the service is marked as down if an “icmp port unreachable” message is received. For LRTM monitors, when no response is received, the response time is the response time-out for the monitor.
When the UDP monitors detect an ICMP port unreachable error, the service is marked as down immediately.
PING (ping) Not Applicable The NetScaler sends an ICMP echo request to the destination of the monitor and expects an ICMP echo response.
TCP Monitor Parameters
Monitor type Specific parameters Procedure
Chapter 1 Load Balancing 175
TCPS - the NetScaler establishes a TCP connection. After the connection is
established, the NetScaler performs an SSL handshake with the server. After the
handshake is over, the NetScaler closes the connection.
HTTPS - the NetScaler establishes a TCP connection. After the connection is
established, the NetScaler performs an SSL handshake with the server. When the
SSL connection is established, the NetScaler sends HTTP requests over the
encrypted channel and checks the response codes.
TCPS-ECV - the NetScaler establishes a TCP connection. After the connection
is established, the NetScaler performs SSL handshake with the server. When the
SSL connection is established, the NetScaler sends specific data using the send
parameter to the service on the encrypted channel and expects a specific
encrypted response. The response is decrypted, and the data is verified through
the receive parameter.
HTTPS-ECV - the NetScaler establishes a TCP connection. After the connection
is established, the NetScaler performs an SSL handshake. When the SSL
connection is established, the NetScaler sends the encrypted HTTP request
specified using the send parameter to the service and expects the encrypted HTTP
response (HTTP body part, not including HTTP headers). This response is
decrypted and compared with the expected response specified using the receive
parameter. The following table describes the monitor types for monitoring SSL
services.
To configure built-in monitors to check the state of SSL services, see
“Configuring Monitors in a Load Balancing Setup,” on page 162. You must
provide values for the required parameters to create monitors.
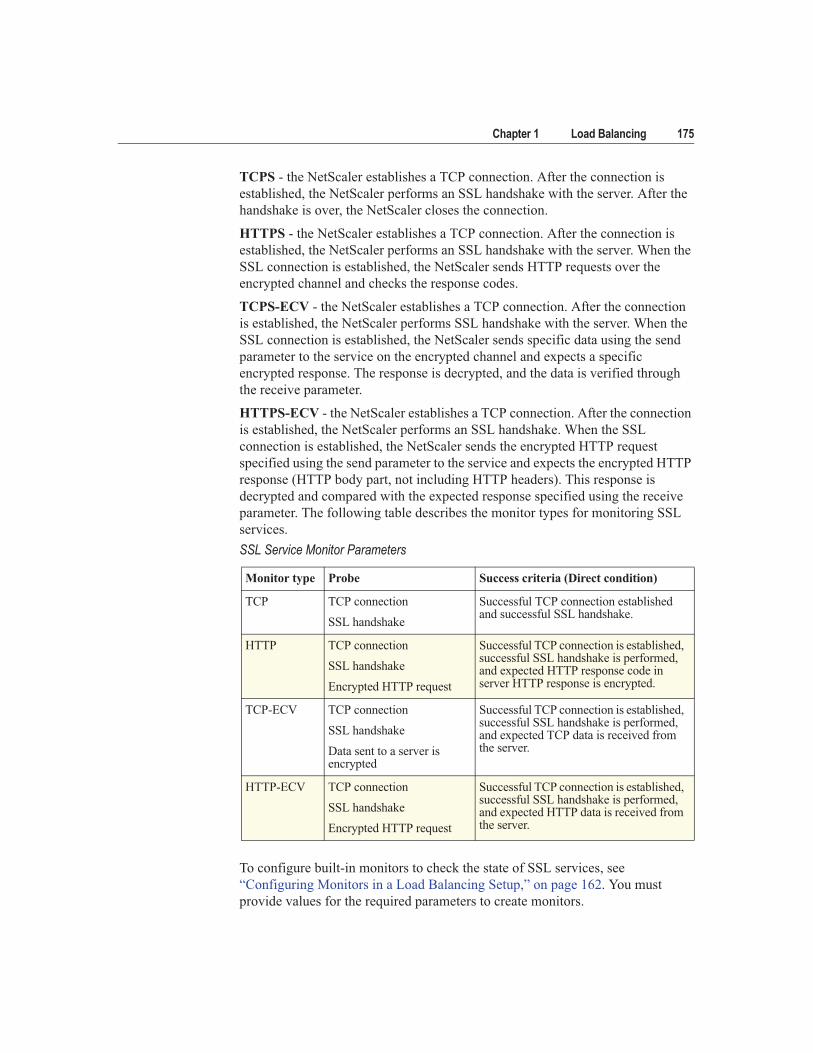
SSL Service Monitor Parameters
Monitor type Probe Success criteria (Direct condition)
TCP TCP connection
SSL handshake
Successful TCP connection established and successful SSL handshake.
HTTP TCP connection
SSL handshake
Encrypted HTTP request
Successful TCP connection is established, successful SSL handshake is performed, and expected HTTP response code in server HTTP response is encrypted.
TCP-ECV TCP connection
SSL handshake
Data sent to a server is encrypted
Successful TCP connection is established, successful SSL handshake is performed, and expected TCP data is received from the server.
HTTP-ECV TCP connection
SSL handshake
Encrypted HTTP request
Successful TCP connection is established, successful SSL handshake is performed, and expected HTTP data is received from the server.
176 Citrix NetScaler Traffic Management Guide
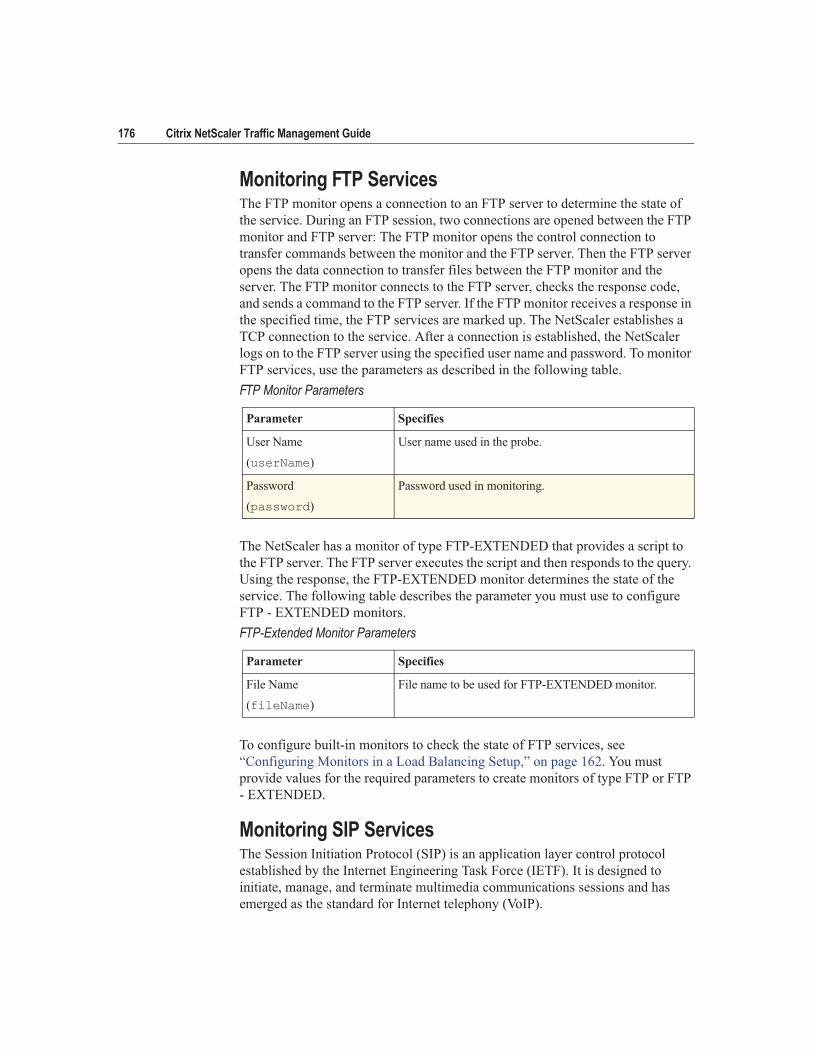
Monitoring FTP ServicesThe FTP monitor opens a connection to an FTP server to determine the state of
the service. During an FTP session, two connections are opened between the FTP
monitor and FTP server: The FTP monitor opens the control connection to
transfer commands between the monitor and the FTP server. Then the FTP server
opens the data connection to transfer files between the FTP monitor and the
server. The FTP monitor connects to the FTP server, checks the response code,
and sends a command to the FTP server. If the FTP monitor receives a response in
the specified time, the FTP services are marked up. The NetScaler establishes a
TCP connection to the service. After a connection is established, the NetScaler
logs on to the FTP server using the specified user name and password. To monitor
FTP services, use the parameters as described in the following table.
The NetScaler has a monitor of type FTP-EXTENDED that provides a script to
the FTP server. The FTP server executes the script and then responds to the query.
Using the response, the FTP-EXTENDED monitor determines the state of the
service. The following table describes the parameter you must use to configure
FTP - EXTENDED monitors.
To configure built-in monitors to check the state of FTP services, see
“Configuring Monitors in a Load Balancing Setup,” on page 162. You must
provide values for the required parameters to create monitors of type FTP or FTP
- EXTENDED.
Monitoring SIP ServicesThe Session Initiation Protocol (SIP) is an application layer control protocol
established by the Internet Engineering Task Force (IETF). It is designed to
initiate, manage, and terminate multimedia communications sessions and has
emerged as the standard for Internet telephony (VoIP).
FTP Monitor Parameters
Parameter Specifies
User Name
(userName)
User name used in the probe.
Password
(password)
Password used in monitoring.
FTP-Extended Monitor Parameters
Parameter Specifies
File Name
(fileName)
File name to be used for FTP-EXTENDED monitor.

Chapter 1 Load Balancing 177
SIP messages can be transmitted over TCP or UDP. SIP messages are of two
types: request messages and response messages. The following table summarizes
the formats of these messages.
The traffic in an SIP-based communication system is routed through dedicated
devices and applications (entities). In a multimedia communication session, these
entities exchange messages.
SIP Monitor Parameters
Message type Components Details
Request Method Invite, Ack, Options, Bye, Cancel, Register
Request URI Represents the subject, media type, or urgency of sessions initiated. The common format is: sip:user:password@host:port;uri-parameters?headers
SIP version The SIP version being used
Response SIP version The SIP version being used
Status code A 3-digit integer result code. The possible values are:
1xx: Information Responses. For example: 180, Ringing
2xx: Successful Responses. For example: 200, OK
3xx: Redirection Responses. For example: 302, Moved Temporarily
4xx: Request Failures Responses. For example: 403, Forbidden
5xx: Server Failure Responses. For example: 504, Gateway Time-out
6xx: Global Failure Responses. For example: 600, Busy Everywhere
Reason-phrase Textual description of the status code

178 Citrix NetScaler Traffic Management Guide
One of the most common scenarios for SIP is VoIP, where SIP is used to set up
the session. The usage scenario described in the following section illustrates the
role of the messages and entities in an SIP-based communication system.
SIP mechanism
User agent (UA) is the entity that initiates the call. The user agent can be an SIP
softphone (a PC-based application), or an SIP phone.
To initiate a call, the user agent sends an INVITE request to the previously
configured SIP proxy server. The INVITE request contains the details of the
destination, such as the destination uniform resource identifier (URI) and Call ID.
In the diagram, the Caller A (user agent) sends an INVITE request to Proxy A.
When the proxy server receives the INVITE request, it sends a 100 (Trying)
response to the user agent that initiated the Caller A. It also performs a DNS
lookup to locate the SIP proxy server of the destination domain. After the SIP
proxy server of the destination domain is located, the SIP proxy at the source
domain sends the INVITE request to it. Here, Proxy A sends a 100 (Trying)
response to Caller A and an INVITE request to Proxy B.
When the SIP proxy server of the destination domain receives the INVITE
request from the SIP proxy server of the source domain, it responds with a 100
(Trying) response. It then sends the INVITE request to the destination user agent.
In this case, Proxy B sends a 100 (Trying) response to Proxy A and an INVITE
request to Caller B.

Chapter 1 Load Balancing 179
When the destination user agent receives the INVITE request, it alerts Caller B
and responds with a 180 (ringing) response. This response is routed back to the
source user agent through the proxies.
When caller B accepts the call, the destination user agent responds with a 200
(OK) response. This signifies that caller B has answered the call. This response is
routed back to the source user agent through the proxies. After the call is set up,
the user agents communicate directly without the proxies.
The following table describes the entities of an SIP-based communication system
and their roles.
You can configure the NetScaler to load balance SIP requests to a group of SIP
proxy servers. To do this, you need to create an LB vserver with the LB method
set to Call-ID hash, and then bind to it the services representing the SIP proxies.
You must configure the SIP proxies so that they do not add private IP addresses or
private domains to the SIP header/payload. SIP proxies must add a domain name
to the SIP header that resolves to the IP address of the SIP vserver. Also, the SIP
proxies must communicate with a common database to share registration
information.
SIP System Entities
Entity Role
User Agent (UA) SIP user agents generate requests and respond to incoming requests. A user agent that generates requests is known as a User Agent Client (UAC). The user agent that responds to requests is known as the User Agent Server (UAS). In the preceding example, Caller A was the UAC and Caller B was the UAS.
Proxy Server Proxies receive and route SIP requests based on the URI. They can selectively rewrite parts of the request message before forwarding it. They also handle registrations, invitations to user agents, and apply call policies.
Redirect Server Redirect servers send routing information to the SIP proxy servers.
Registrar Server Registrar servers provide location information to user agentsand proxy servers.
Back-to-Back User Agent (B2BUA)
Back-to-Back User Agents (B2BUA) are combination of UAS and UAC.
180 Citrix NetScaler Traffic Management Guide
This section describes the role of the NetScaler when configured to perform SIP
load balancing in the two most commonly used topologies:
• One-arm DSR mode
• Inline DSR mode
For more information about DSR mode, see the section “Configuring Load
Balancing in Direct Server Return Mode,” on page 253.
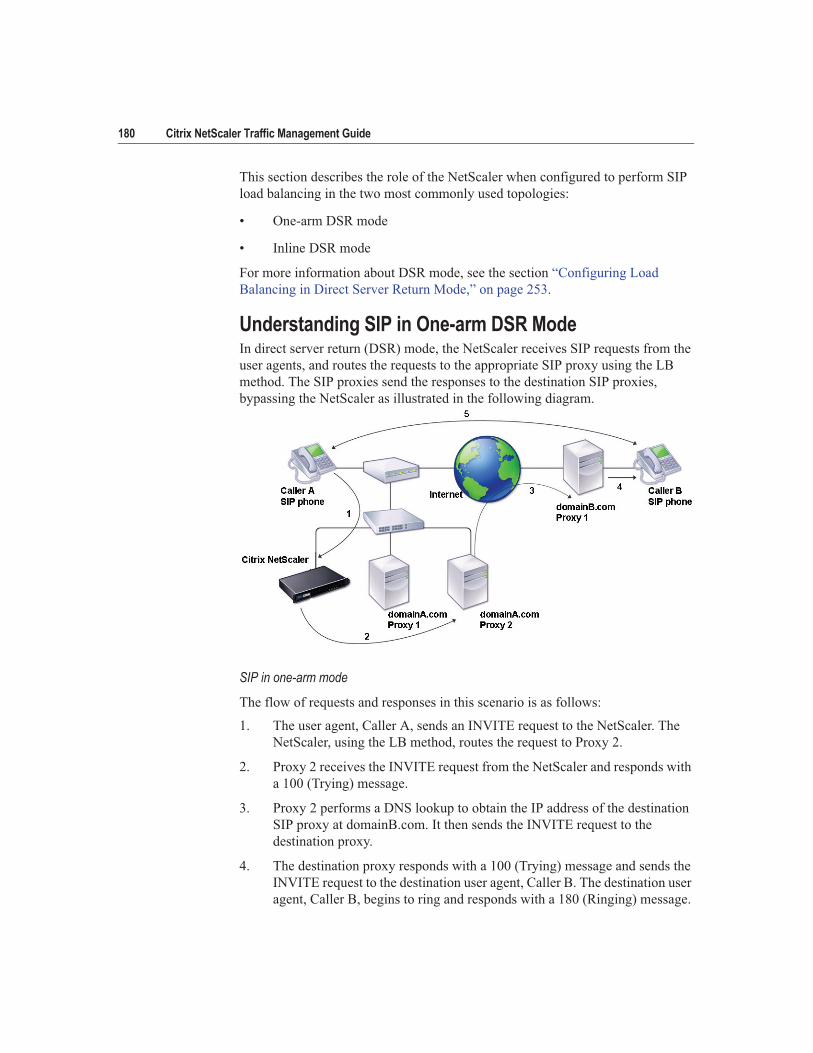
Understanding SIP in One-arm DSR ModeIn direct server return (DSR) mode, the NetScaler receives SIP requests from the
user agents, and routes the requests to the appropriate SIP proxy using the LB
method. The SIP proxies send the responses to the destination SIP proxies,
bypassing the NetScaler as illustrated in the following diagram.
SIP in one-arm mode
The flow of requests and responses in this scenario is as follows:
1. The user agent, Caller A, sends an INVITE request to the NetScaler. The
NetScaler, using the LB method, routes the request to Proxy 2.
2. Proxy 2 receives the INVITE request from the NetScaler and responds with
a 100 (Trying) message.
3. Proxy 2 performs a DNS lookup to obtain the IP address of the destination
SIP proxy at domainB.com. It then sends the INVITE request to the
destination proxy.
4. The destination proxy responds with a 100 (Trying) message and sends the
INVITE request to the destination user agent, Caller B. The destination user
agent, Caller B, begins to ring and responds with a 180 (Ringing) message.
Chapter 1 Load Balancing 181
This message is sent to Caller A through the NetScaler and the Proxy 2.
After the user accepts the call, Caller B responds with a 200 (OK) message
that is propagated to Caller A through the NetScaler and the Proxy 2.
5. After Caller B accepts the call, the user agents (Caller A and Caller B)
communicate independently.
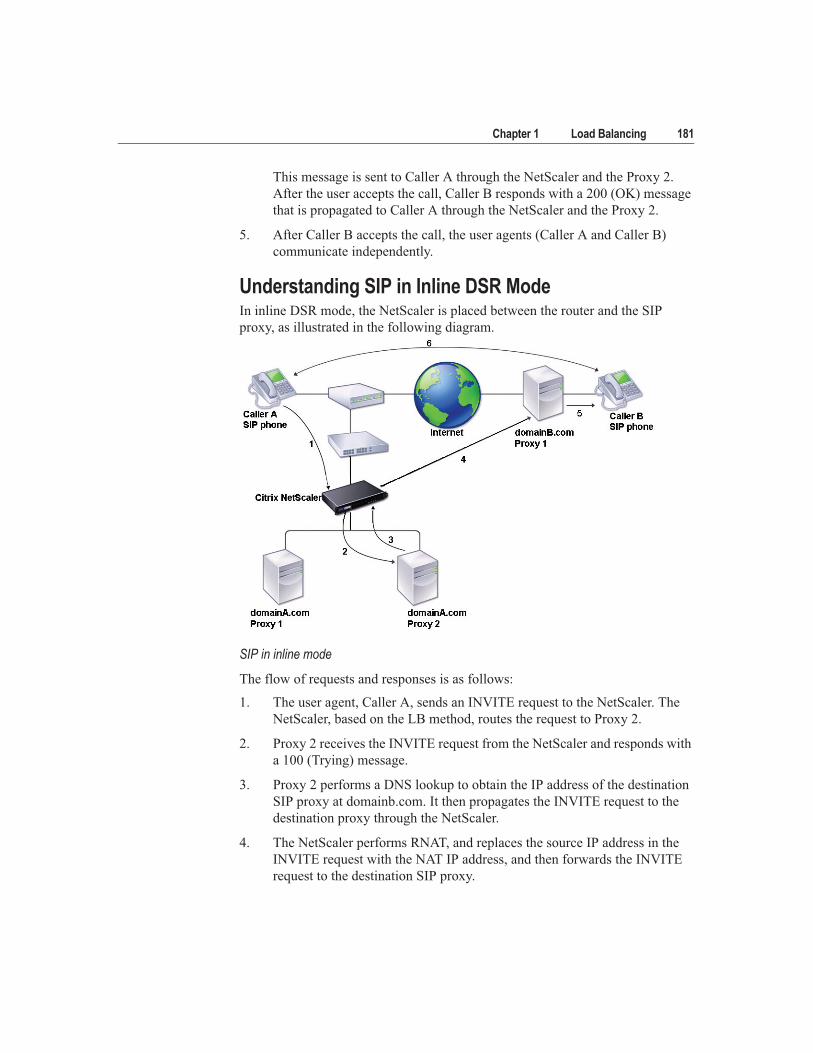
Understanding SIP in Inline DSR ModeIn inline DSR mode, the NetScaler is placed between the router and the SIP
proxy, as illustrated in the following diagram.
SIP in inline mode
The flow of requests and responses is as follows:
1. The user agent, Caller A, sends an INVITE request to the NetScaler. The
NetScaler, based on the LB method, routes the request to Proxy 2.
2. Proxy 2 receives the INVITE request from the NetScaler and responds with
a 100 (Trying) message.
3. Proxy 2 performs a DNS lookup to obtain the IP address of the destination
SIP proxy at domainb.com. It then propagates the INVITE request to the
destination proxy through the NetScaler.
4. The NetScaler performs RNAT, and replaces the source IP address in the
INVITE request with the NAT IP address, and then forwards the INVITE
request to the destination SIP proxy.

182 Citrix NetScaler Traffic Management Guide
5. The destination proxy responds with a 100 (Trying) message and sends the
INVITE request to the destination user agent, Caller B. Caller B, begins to
ring and responds with a 180 (Ringing) message. This message is sent to
Caller A through the NetScaler and the Proxy 2. After the user accepts the
call, Caller B responds with a 200 (OK) message that is propagated to
Caller A through the NetScaler and the Proxy 2.
6. After the user accepts the call, the user agents (Caller A and Caller B)
communicate independently.
To monitor SIP services, use the parameters as described in the following table.
To configure built-in monitors to check the state of SIP server, see “Configuring
Monitors in a Load Balancing Setup,” on page 162. You must provide values for
the required parameters to create a monitor of type SIP.
Monitoring RADIUS ServicesThe RADIUS monitor periodically checks the state of the RADIUS server using
the RADIUS protocol. The NetScaler sends the RADIUS packets to the RADIUS
server. The RADIUS server authenticates the RADIUS clients using the
authentication information in the RADIUS database. Based on the authentication,
the RADIUS server sends the response to the NetScaler. The following are the
expected responses from the RADIUS server:
• If the client and the server have a similar configuration, the server must
send an Access-Accept response. The response code for Access-Accept is
2. This is the default code that the NetScaler uses.
• If there is a mismatch in the user name, password, or secret key, the server
sends an Access-Reject response. The response code for Access-Reject is 3.
SIP Service Parameters
Parameter Specifies
Maximum Forwards
(maxForwards)
SIP packet max-forwards. Default value: 1 Minimum value: 0 Maximum value: 255.
SIP Method
(sipMethod)
SIP method to be used for the query. Possible values: OPTIONS, INVITE, REGISTER Default value: OPTIONS.
SIP URI
(sipURI)
SIP method string, sent to the server. For example “OPTIONS sip:sip.test.”
SIP Register URI
(sipregURI)
SIP user to be registered.
Chapter 1 Load Balancing 183
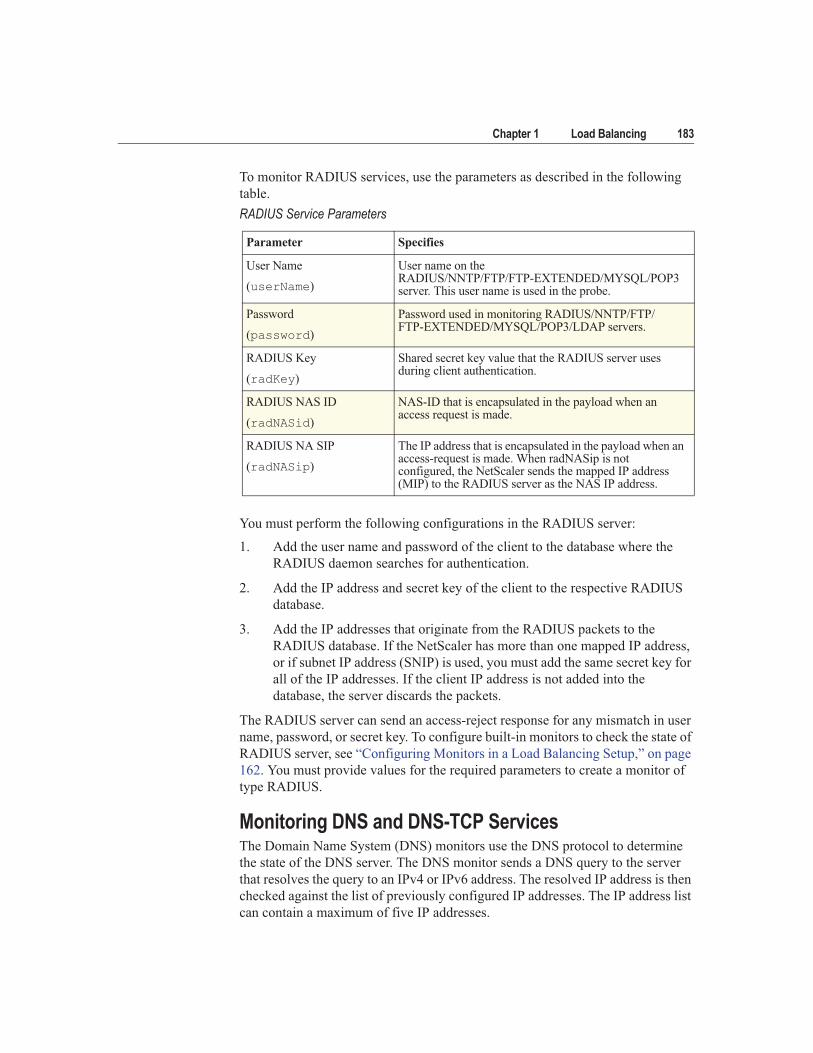
To monitor RADIUS services, use the parameters as described in the following
table.
You must perform the following configurations in the RADIUS server:
1. Add the user name and password of the client to the database where the
RADIUS daemon searches for authentication.
2. Add the IP address and secret key of the client to the respective RADIUS
database.
3. Add the IP addresses that originate from the RADIUS packets to the
RADIUS database. If the NetScaler has more than one mapped IP address,
or if subnet IP address (SNIP) is used, you must add the same secret key for
all of the IP addresses. If the client IP address is not added into the
database, the server discards the packets.
The RADIUS server can send an access-reject response for any mismatch in user
name, password, or secret key. To configure built-in monitors to check the state of
RADIUS server, see “Configuring Monitors in a Load Balancing Setup,” on page
162. You must provide values for the required parameters to create a monitor of
type RADIUS.
Monitoring DNS and DNS-TCP ServicesThe Domain Name System (DNS) monitors use the DNS protocol to determine
the state of the DNS server. The DNS monitor sends a DNS query to the server
that resolves the query to an IPv4 or IPv6 address. The resolved IP address is then
checked against the list of previously configured IP addresses. The IP address list
can contain a maximum of five IP addresses.
RADIUS Service Parameters
Parameter Specifies
User Name
(userName)
User name on the RADIUS/NNTP/FTP/FTP-EXTENDED/MYSQL/POP3 server. This user name is used in the probe.
Password
(password)
Password used in monitoring RADIUS/NNTP/FTP/FTP-EXTENDED/MYSQL/POP3/LDAP servers.
RADIUS Key
(radKey)
Shared secret key value that the RADIUS server uses during client authentication.
RADIUS NAS ID
(radNASid)
NAS-ID that is encapsulated in the payload when an access request is made.
RADIUS NA SIP
(radNASip)
The IP address that is encapsulated in the payload when an access-request is made. When radNASip is not configured, the NetScaler sends the mapped IP address (MIP) to the RADIUS server as the NAS IP address.
184 Citrix NetScaler Traffic Management Guide
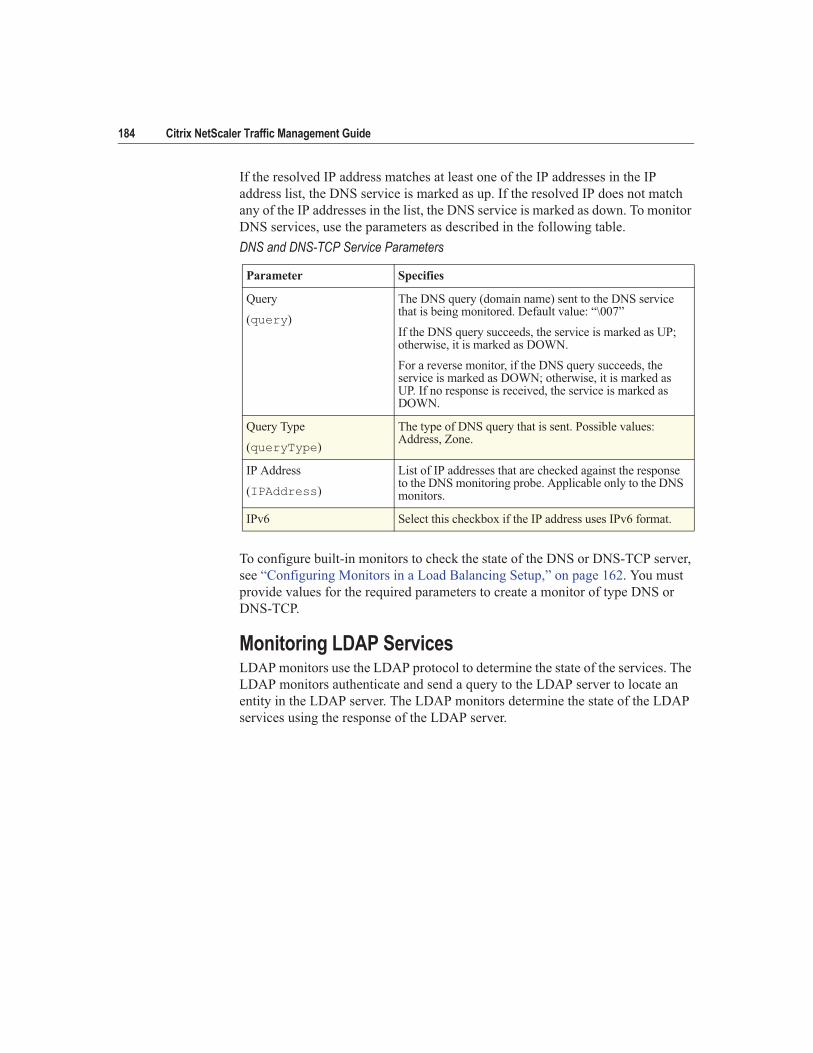
If the resolved IP address matches at least one of the IP addresses in the IP
address list, the DNS service is marked as up. If the resolved IP does not match
any of the IP addresses in the list, the DNS service is marked as down. To monitor
DNS services, use the parameters as described in the following table.
To configure built-in monitors to check the state of the DNS or DNS-TCP server,
see “Configuring Monitors in a Load Balancing Setup,” on page 162. You must
provide values for the required parameters to create a monitor of type DNS or
DNS-TCP.
Monitoring LDAP ServicesLDAP monitors use the LDAP protocol to determine the state of the services. The
LDAP monitors authenticate and send a query to the LDAP server to locate an
entity in the LDAP server. The LDAP monitors determine the state of the LDAP
services using the response of the LDAP server.
DNS and DNS-TCP Service Parameters
Parameter Specifies
Query
(query)
The DNS query (domain name) sent to the DNS service that is being monitored. Default value: “\007”
If the DNS query succeeds, the service is marked as UP; otherwise, it is marked as DOWN.
For a reverse monitor, if the DNS query succeeds, the service is marked as DOWN; otherwise, it is marked as UP. If no response is received, the service is marked as DOWN.
Query Type
(queryType)
The type of DNS query that is sent. Possible values: Address, Zone.
IP Address
(IPAddress)
List of IP addresses that are checked against the response to the DNS monitoring probe. Applicable only to the DNS monitors.
IPv6 Select this checkbox if the IP address uses IPv6 format.

Chapter 1 Load Balancing 185
The LDAP monitors can specify a location (using the Base DN parameter) in the
directory hierarchy where the LDAP server starts the query. You can also specify
an attribute of the target entity. The LDAP server uses the fields that the monitor
provides to search for the target entity. If the search is successful, the health check
is considered good and the service is marked up. If the LDAP server does not
locate the entry, a failure message is sent to the LDAP monitors and the service is
marked down. To monitor LDAP services, use the parameters as described in the
following table.
To configure built-in monitors to check the state of the LDAP server, see
“Configuring Monitors in a Load Balancing Setup,” on page 162. You must
provide values for the required parameters to create a monitor of type LDAP.
LDAP Parameters
Parameter Specifies
Base DN
(baseDN)
Base name for the LDAP monitor from where the LDAP search must start. If the LDAP server is running locally, the default value of base is dc=netscaler, dc=com.
Bind DN
(bindDN)
BDN name for the LDAP monitor.
Filter
(filter)
Filter for the LDAP monitor.
Password
(password)
Password used in monitoring LDAP servers.
Attribute
(attribute)
Attribute for the LDAP monitor.

186 Citrix NetScaler Traffic Management Guide
Monitoring MySQL ServicesThe MySQL monitor sends a query to the MySQL server to locate an entity in the
database and determines the state of the MySQL services using the response from
the database. If the entity exists in the database, the health check is considered
good and the service is marked up. If the entity is not found in the database, a
failure message is sent to the MySQL monitors and the service is marked down.
To monitor MySQL services, use the parameters as described in the following
table.
To configure built-in monitors to check the state of the MySQL server, see
“Configuring Monitors in a Load Balancing Setup,” on page 162. You must
provide values for the required parameters to create a monitor of type MySQL.
Monitoring SNMP ServicesThe Simple Network Management Protocol (SNMP) monitor periodically probes
the SNMP devices for performance and fault data. SNMP monitors check the
SNMP agent running on an SNMP device. You must specify an enterprise
identification ID (OID) when you configure the monitor. SNMP monitor sends a
query to the SNMP devices for an OID and compares the response to the OID that
you provide. The SNMP monitors determine the state of the SNMP services using
the response.
If the SNMP device does not have the OID that you specified, the SNMP monitor
determines the state of the service as DOWN. To monitor SNMP services, use the
parameters as described in the following table.
MYSQL Parameters
Parameter Specifies
Database
(database)
Database that is used for the MYSQL monitor.
SQL Query
(sqlQuery)
SQL query that is used for the MYSQL monitor.
SNMP Parameters
Parameter Specifies
SNMP OID
(snmpOID)
OID that is used for the SNMP monitor.
SNMP Community
(snmpCommunity)
Community that is used for the SNMP monitor.
SNMP Threshold
(snmpThreshold)
Threshold that is used for the SNMP monitor.
Chapter 1 Load Balancing 187
To configure built-in monitors to check the state of SNMP device, see
“Configuring Monitors in a Load Balancing Setup,” on page 162. You must
provide values for the required parameters to create a monitor of type SNMP.
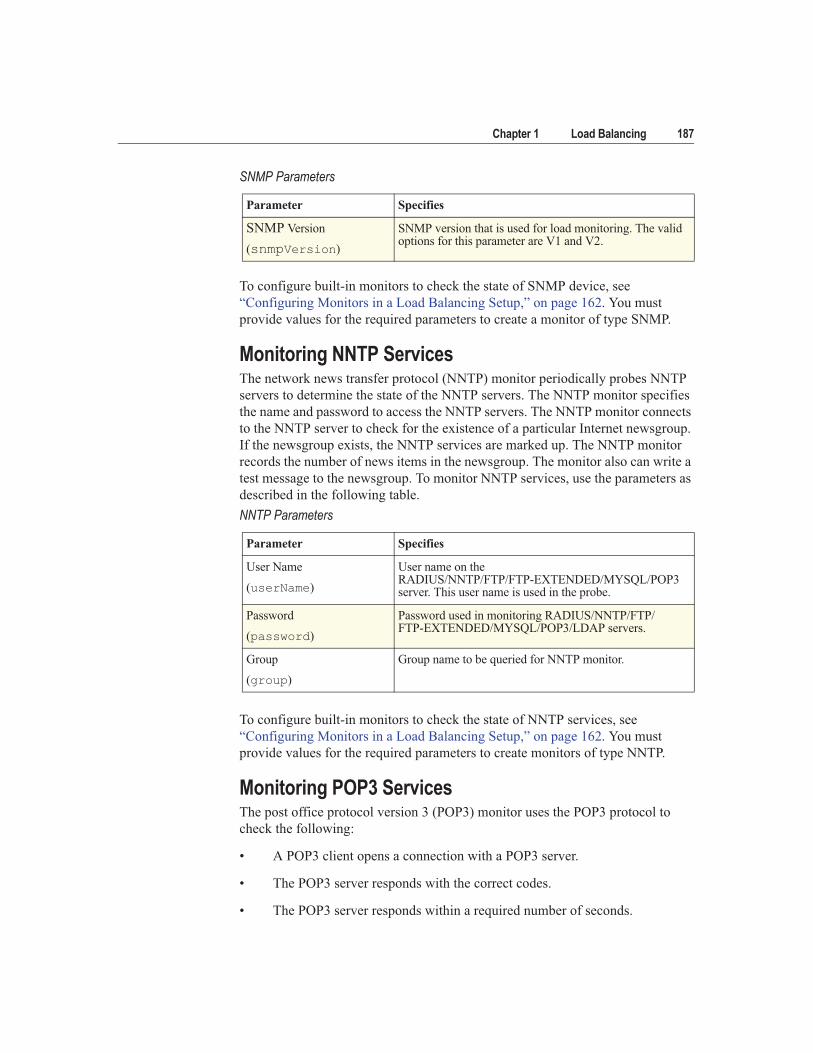
Monitoring NNTP ServicesThe network news transfer protocol (NNTP) monitor periodically probes NNTP
servers to determine the state of the NNTP servers. The NNTP monitor specifies
the name and password to access the NNTP servers. The NNTP monitor connects
to the NNTP server to check for the existence of a particular Internet newsgroup.
If the newsgroup exists, the NNTP services are marked up. The NNTP monitor
records the number of news items in the newsgroup. The monitor also can write a
test message to the newsgroup. To monitor NNTP services, use the parameters as
described in the following table.
To configure built-in monitors to check the state of NNTP services, see
“Configuring Monitors in a Load Balancing Setup,” on page 162. You must
provide values for the required parameters to create monitors of type NNTP.
Monitoring POP3 ServicesThe post office protocol version 3 (POP3) monitor uses the POP3 protocol to
check the following:
• A POP3 client opens a connection with a POP3 server.
• The POP3 server responds with the correct codes.
• The POP3 server responds within a required number of seconds.
SNMP Version
(snmpVersion)
SNMP version that is used for load monitoring. The valid options for this parameter are V1 and V2.
NNTP Parameters
Parameter Specifies
User Name
(userName)
User name on the RADIUS/NNTP/FTP/FTP-EXTENDED/MYSQL/POP3 server. This user name is used in the probe.
Password
(password)
Password used in monitoring RADIUS/NNTP/FTP/FTP-EXTENDED/MYSQL/POP3/LDAP servers.
Group
(group)
Group name to be queried for NNTP monitor.
SNMP Parameters
Parameter Specifies
188 Citrix NetScaler Traffic Management Guide
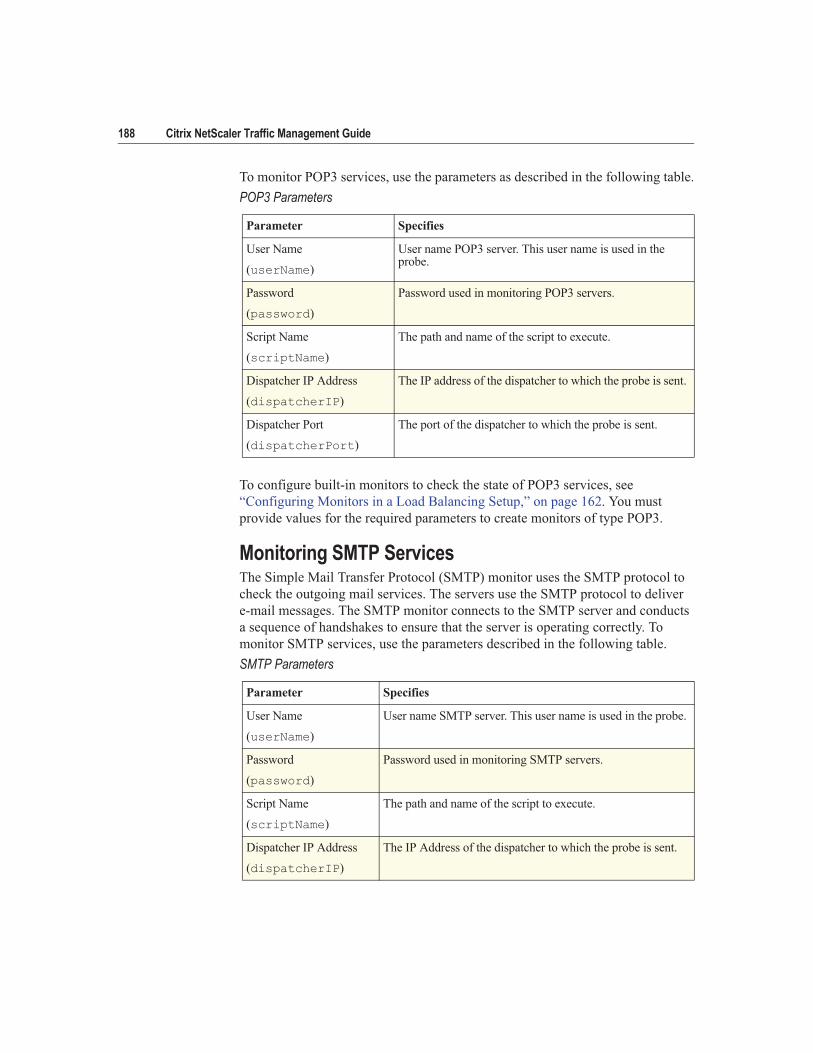
To monitor POP3 services, use the parameters as described in the following table.
To configure built-in monitors to check the state of POP3 services, see
“Configuring Monitors in a Load Balancing Setup,” on page 162. You must
provide values for the required parameters to create monitors of type POP3.
Monitoring SMTP ServicesThe Simple Mail Transfer Protocol (SMTP) monitor uses the SMTP protocol to
check the outgoing mail services. The servers use the SMTP protocol to deliver
e-mail messages. The SMTP monitor connects to the SMTP server and conducts
a sequence of handshakes to ensure that the server is operating correctly. To
monitor SMTP services, use the parameters described in the following table.
POP3 Parameters
Parameter Specifies
User Name
(userName)
User name POP3 server. This user name is used in the probe.
Password
(password)
Password used in monitoring POP3 servers.
Script Name
(scriptName)
The path and name of the script to execute.
Dispatcher IP Address
(dispatcherIP)
The IP address of the dispatcher to which the probe is sent.
Dispatcher Port
(dispatcherPort)
The port of the dispatcher to which the probe is sent.
SMTP Parameters
Parameter Specifies
User Name
(userName)
User name SMTP server. This user name is used in the probe.
Password
(password)
Password used in monitoring SMTP servers.
Script Name
(scriptName)
The path and name of the script to execute.
Dispatcher IP Address
(dispatcherIP)
The IP Address of the dispatcher to which the probe is sent.
Chapter 1 Load Balancing 189
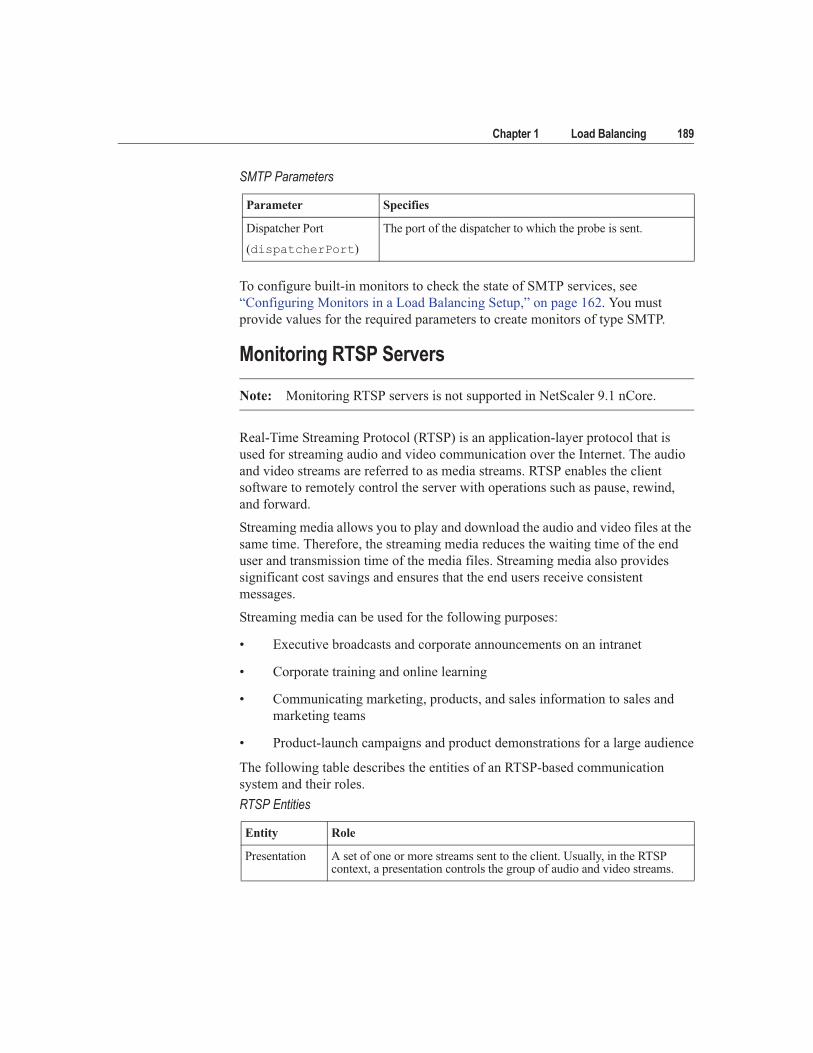
To configure built-in monitors to check the state of SMTP services, see
“Configuring Monitors in a Load Balancing Setup,” on page 162. You must
provide values for the required parameters to create monitors of type SMTP.
Monitoring RTSP Servers
Note: Monitoring RTSP servers is not supported in NetScaler 9.1 nCore.
Real-Time Streaming Protocol (RTSP) is an application-layer protocol that is
used for streaming audio and video communication over the Internet. The audio
and video streams are referred to as media streams. RTSP enables the client
software to remotely control the server with operations such as pause, rewind,
and forward.
Streaming media allows you to play and download the audio and video files at the
same time. Therefore, the streaming media reduces the waiting time of the end
user and transmission time of the media files. Streaming media also provides
significant cost savings and ensures that the end users receive consistent
messages.
Streaming media can be used for the following purposes:
• Executive broadcasts and corporate announcements on an intranet
• Corporate training and online learning
• Communicating marketing, products, and sales information to sales and
marketing teams
• Product-launch campaigns and product demonstrations for a large audience
The following table describes the entities of an RTSP-based communication
system and their roles.
Dispatcher Port
(dispatcherPort)
The port of the dispatcher to which the probe is sent.
RTSP Entities
Entity Role
Presentation A set of one or more streams sent to the client. Usually, in the RTSP context, a presentation controls the group of audio and video streams.
SMTP Parameters
Parameter Specifies

190 Citrix NetScaler Traffic Management Guide
The usage scenario of RTSP described in the following section illustrates the role
of the messages and entities in an RTSP-based communication system.
RTSP mechanism
The RTSP setup can be described as following:
1. The client uses the DESCRIBE method to request a media server for the
description of the presentation. The DESCRIBE method provides the
details of the media streams so that the client can start the appropriate
media applications.
2. The client sends a SETUP message to set up a session.
3. When a media server receives a SETUP message, it allocates resources
such as sockets (through which it sends the media) and bandwidth. The
server then responds with a session identifier.
4. The client specifies the URL, session identifier, and a time range in the
control messages to the server.
5. The server performs the appropriate action based on the control messages it
receives from the client.
6. When the client completes, it issues a TEARDOWN request to end the
session, and the server removes any allocated resources.
Media server A server that provides playback or recording for one or more media streams. Different media streams in a presentation can originate from different media servers. A media server can reside on the same Web server that invoked the presentation.
Media streams A single media instance (for example, an audio or a video stream and a single whiteboard or shared application group).
RTSP Entities
Entity Role
Chapter 1 Load Balancing 191
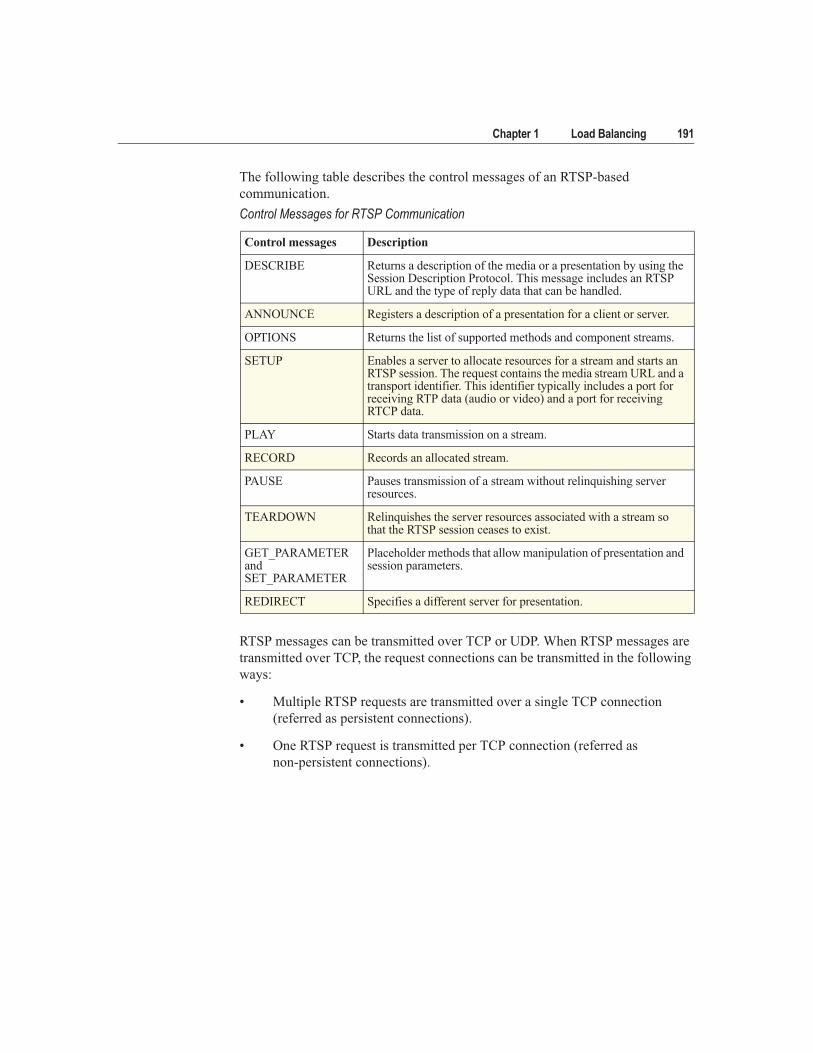
The following table describes the control messages of an RTSP-based
communication.
RTSP messages can be transmitted over TCP or UDP. When RTSP messages are
transmitted over TCP, the request connections can be transmitted in the following
ways:
• Multiple RTSP requests are transmitted over a single TCP connection
(referred as persistent connections).
• One RTSP request is transmitted per TCP connection (referred as
non-persistent connections).
Control Messages for RTSP Communication
Control messages Description
DESCRIBE Returns a description of the media or a presentation by using the Session Description Protocol. This message includes an RTSP URL and the type of reply data that can be handled.
ANNOUNCE Registers a description of a presentation for a client or server.
OPTIONS Returns the list of supported methods and component streams.
SETUP Enables a server to allocate resources for a stream and starts an RTSP session. The request contains the media stream URL and a transport identifier. This identifier typically includes a port for receiving RTP data (audio or video) and a port for receiving RTCP data.
PLAY Starts data transmission on a stream.
RECORD Records an allocated stream.
PAUSE Pauses transmission of a stream without relinquishing server resources.
TEARDOWN Relinquishes the server resources associated with a stream so that the RTSP session ceases to exist.
GET_PARAMETER and SET_PARAMETER
Placeholder methods that allow manipulation of presentation and session parameters.
REDIRECT Specifies a different server for presentation.
192 Citrix NetScaler Traffic Management Guide
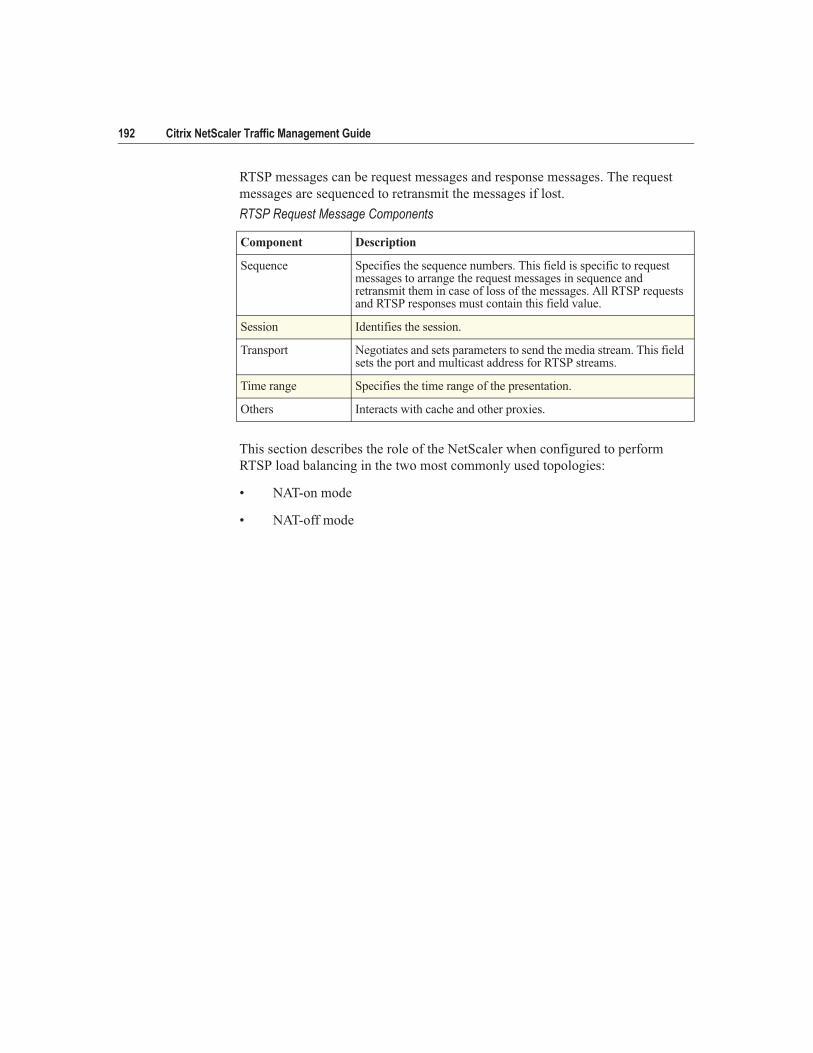
RTSP messages can be request messages and response messages. The request
messages are sequenced to retransmit the messages if lost.
This section describes the role of the NetScaler when configured to perform
RTSP load balancing in the two most commonly used topologies:
• NAT-on mode
• NAT-off mode
RTSP Request Message Components
Component Description
Sequence Specifies the sequence numbers. This field is specific to request messages to arrange the request messages in sequence and retransmit them in case of loss of the messages. All RTSP requests and RTSP responses must contain this field value.
Session Identifies the session.
Transport Negotiates and sets parameters to send the media stream. This field sets the port and multicast address for RTSP streams.
Time range Specifies the time range of the presentation.
Others Interacts with cache and other proxies.
Chapter 1 Load Balancing 193
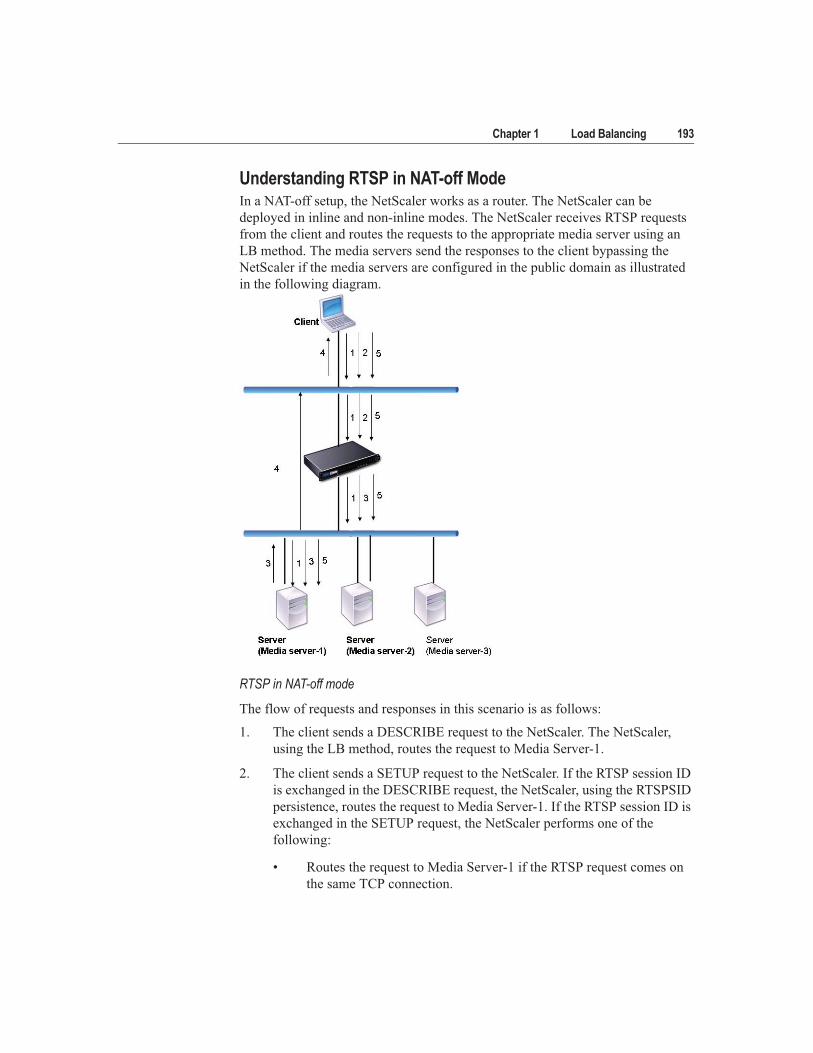
Understanding RTSP in NAT-off ModeIn a NAT-off setup, the NetScaler works as a router. The NetScaler can be
deployed in inline and non-inline modes. The NetScaler receives RTSP requests
from the client and routes the requests to the appropriate media server using an
LB method. The media servers send the responses to the client bypassing the
NetScaler if the media servers are configured in the public domain as illustrated
in the following diagram.
RTSP in NAT-off mode
The flow of requests and responses in this scenario is as follows:
1. The client sends a DESCRIBE request to the NetScaler. The NetScaler,
using the LB method, routes the request to Media Server-1.
2. The client sends a SETUP request to the NetScaler. If the RTSP session ID
is exchanged in the DESCRIBE request, the NetScaler, using the RTSPSID
persistence, routes the request to Media Server-1. If the RTSP session ID is
exchanged in the SETUP request, the NetScaler performs one of the
following:
• Routes the request to Media Server-1 if the RTSP request comes on
the same TCP connection.
194 Citrix NetScaler Traffic Management Guide
• Performs load balancing and sends the request to a different server if
the request comes on a different TCP connection.
3. Media Server-1 receives the SETUP request from the NetScaler and
allocates resources to process the RTSP request and sends the appropriate
session ID to the client.
4. The NetScaler does not perform NAT to identify the RTSP connections,
because the RTSP connections bypass the NetScaler.
5. The client then uses the session ID to identify the session and send control
messages to the media server. The Media Server-1 performs the requested
action such as play, forward, and rewind.
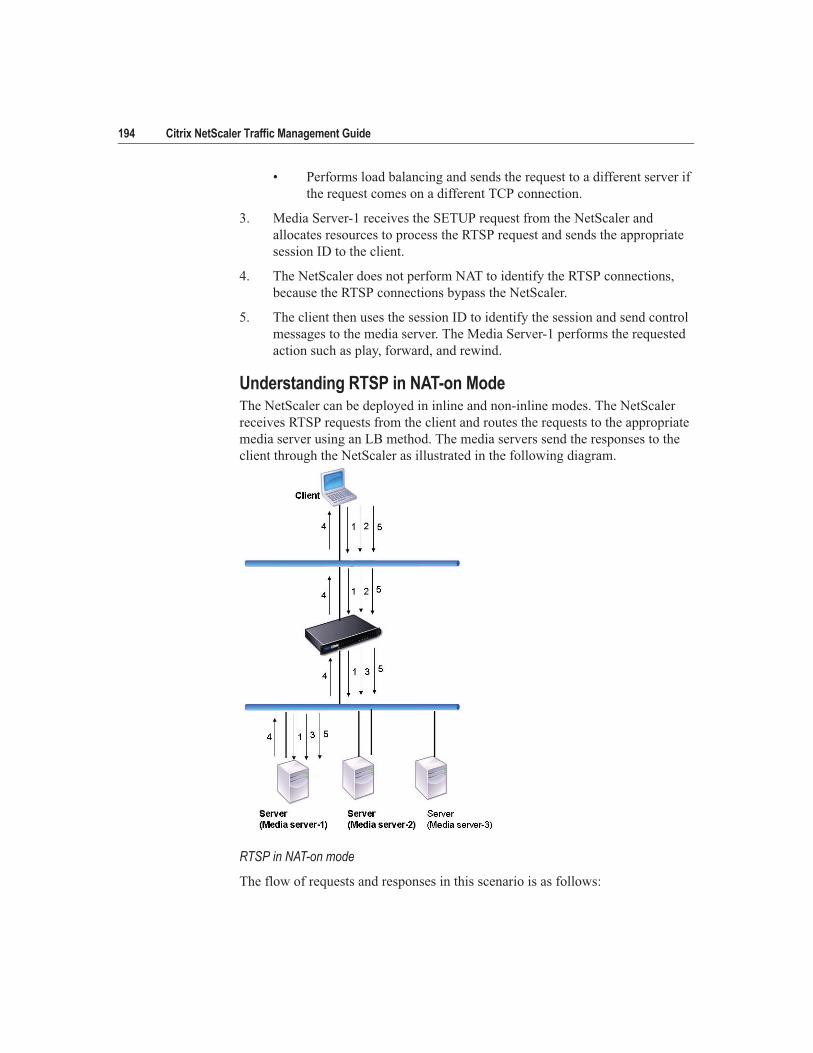
Understanding RTSP in NAT-on ModeThe NetScaler can be deployed in inline and non-inline modes. The NetScaler
receives RTSP requests from the client and routes the requests to the appropriate
media server using an LB method. The media servers send the responses to the
client through the NetScaler as illustrated in the following diagram.
RTSP in NAT-on mode
The flow of requests and responses in this scenario is as follows:
Chapter 1 Load Balancing 195
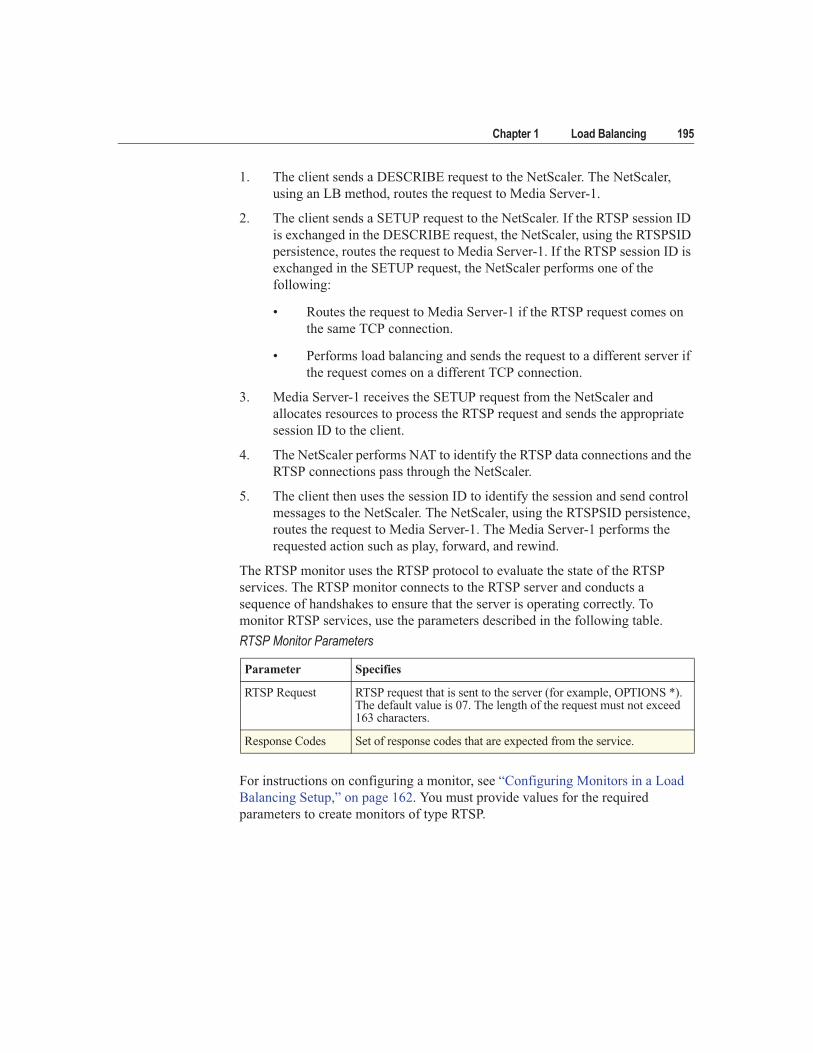
1. The client sends a DESCRIBE request to the NetScaler. The NetScaler,
using an LB method, routes the request to Media Server-1.
2. The client sends a SETUP request to the NetScaler. If the RTSP session ID
is exchanged in the DESCRIBE request, the NetScaler, using the RTSPSID
persistence, routes the request to Media Server-1. If the RTSP session ID is
exchanged in the SETUP request, the NetScaler performs one of the
following:
• Routes the request to Media Server-1 if the RTSP request comes on
the same TCP connection.
• Performs load balancing and sends the request to a different server if
the request comes on a different TCP connection.
3. Media Server-1 receives the SETUP request from the NetScaler and
allocates resources to process the RTSP request and sends the appropriate
session ID to the client.
4. The NetScaler performs NAT to identify the RTSP data connections and the
RTSP connections pass through the NetScaler.
5. The client then uses the session ID to identify the session and send control
messages to the NetScaler. The NetScaler, using the RTSPSID persistence,
routes the request to Media Server-1. The Media Server-1 performs the
requested action such as play, forward, and rewind.
The RTSP monitor uses the RTSP protocol to evaluate the state of the RTSP
services. The RTSP monitor connects to the RTSP server and conducts a
sequence of handshakes to ensure that the server is operating correctly. To
monitor RTSP services, use the parameters described in the following table.
For instructions on configuring a monitor, see “Configuring Monitors in a Load
Balancing Setup,” on page 162. You must provide values for the required
parameters to create monitors of type RTSP.
RTSP Monitor Parameters
Parameter Specifies
RTSP Request RTSP request that is sent to the server (for example, OPTIONS *). The default value is 07. The length of the request must not exceed 163 characters.
Response Codes Set of response codes that are expected from the service.
196 Citrix NetScaler Traffic Management Guide
Monitoring the Citrix XenApp ComponentYou can use Citrix XenApp (formerly Citrix Presentation Server) component
monitors to check various services of the XenApp (XML-SERVICE, WEB
Interface). These monitors are used in data centers where XenApp systems are
installed.
To create monitors for XML-SERVICE and WEB Interface services, see
“Creating Monitors,” on page 163.
Monitoring ARP RequestsThe address resolution protocol (ARP) locates a hardware address for a server
when only the network layer address is known. ARP works with IPv4 to translate
IP addresses to Ethernet MAC addresses.
You can configure an ARP monitor to track ARP requests. This can be useful if
you need to locate a device, for example, if you want to confirm its existence and
other methods, such as PINGs, are impractical. The ARP monitor sends ARP
requests and determines the state of the device based on whether it receives a
response from it. If there is a response to the ARP request, the monitor probe is
considered to be succeeded.
There are no special parameters for the ARP monitor.
Note that ARP monitoring is not supported for IPv6.
For instructions on configuring a monitor, see “Configuring Monitors in a Load
Balancing Setup,” on page 162.
Monitoring the Access GatewayYou can configure a CITRIX-AG monitor to view the health of an Access
Gateway appliance. Before configuring this monitor, you should create a local
user and password on the Access Gateway to serve as a single source of
authentication for the monitor. After configuring the Access Gateway with the
user name and password, you log on using the realm and user name. For example,
if you configure a realm named LDAP and a user name of user1, you log on as
LDAP/user1.
XenApp Monitor Parameters
Parameter Specifies
Application Name Applicable to the XML service monitor.
Site Path Applicable to the Web interface monitor.
Chapter 1 Load Balancing 197
Note that RSA SecurID authentication is not supported for this monitor. RSA
SecurID requires an RSA-generated token as a password, which is not supported
on the NetScaler.
For instructions on configuring a monitor, see “Configuring Monitors in a Load
Balancing Setup,” on page 162.
Monitoring the Advanced Access Control Login PageYou can monitor user accesses of the Access Gateway’s Advanced Access
Control login page.
The only special parameter for this monitor is the Logon Point Name. This is the
URL from which users access corporate resources using Access Gateway
Advanced. The logon point settings determine access to server farms, Access
Interface configuration, and other session-specific settings. In addition, a logon
point can be used as a filter within policies.
For instructions on configuring a monitor, see “Configuring Monitors in a Load
Balancing Setup,” on page 162.
Monitoring the Advanced Access Control Logon Agent Service PageThe Logon Agent Service (LAS) is a service component of Advanced Access
Control that requests authentication to the Authentication Service. The Logon
Agent Service serves requests through the Access Gateway device on behalf of
the end user.
Access Gateway Monitor Parameters
Parameter Specifies
User Name
(userName)
A configured user name.
Password
(password)
A configured password for the user.
Secondary Password
(secondaryPassword)
A secondary password for the user.
198 Citrix NetScaler Traffic Management Guide
The following are special parameters for the AAC Logon Agent Service
(AAC-LAS) monitor.
For instructions on configuring a monitor, see “Configuring Monitors in a Load
Balancing Setup,” on page 162.
Monitoring the Citrix XenDesktop Dynamic Desktop Controller ComponentYou can use Citrix XenDesktop component monitors for the XenDesktop server.
This monitor works with the Dynamic Desktop Controller and has the name
XD-DDC in the configuration utility. For instructions on configuring a monitor,
see “Configuring Monitors in a Load Balancing Setup,” on page 162.
Monitoring Applications and Services Using Customized MonitorsThis section describes the customized monitors and how you can use them to
check the state of applications and services. The NetScaler provides customized
monitors that determine the state of services based on the load on the service,
network traffic of the service, or user-defined scripts. The customized monitors
are the load monitors, inline monitors, and user monitors. Customized monitors
also allow you to define scripts and use the scripts to determine the state of the
service.
Configuring Inline MonitorsInline monitors analyze and probe the responses from the servers only when the
client requests are sent to the server. They do not probe if the responses from the
servers are deduced from traffic of the servers that are up. When there are no
client requests to the server, inline monitors use the configured URL to probe the
server as a regular HTTP monitor.
AAC-LAS Monitor Parameters
Parameter Specifies
Logon Point Name
(logonpointName)
URL from which users access corporate resources using Access Gateway Advanced. The logon point settings determine access to server farms, Access Interface configuration, and other session-specific settings. In addition, a logon point can be used as a filter within policies.
Logon Agent Service Version
(lasVersion)
The version number of the agent.
Chapter 1 Load Balancing 199
The inline monitor is of type HTTP-INLINE and can only be configured to work
with HTTP and HTTPS services. Inline monitors cannot be bound to HTTP or
HTTPS Global Server Load Balancing (GSLB) remote or local services. These
services represent vservers.
Inline monitors also have a time-out value and a retry count on failure of probes.
You can select one of the following action types that the NetScaler takes when a
failure occurs:
• NONE. No explicit action is taken. You can view the service and monitor,
and the monitor indicates the number of current contiguous error responses
and cumulative responses checked.
• LOG. Logs the event in ns/syslog and displays the counters.
• DOWN. Marks the service down and does not direct any traffic to the
service. This setting breaks any persistent connections to the service. This
action also logs the event and displays the counters.
After the service is down, the service remains in the down state for the configured
down time. After the down time, the configured URL is used to probe to check if
the service is up. If the probe succeeds, the state of the service is changed to up.
Traffic is directed to the service, and URL probes and traffic are sent to monitor
to check the state of the service, as needed. To configure inline monitors, see
“Configuring Monitors in a Load Balancing Setup,” on page 162.
200 Citrix NetScaler Traffic Management Guide
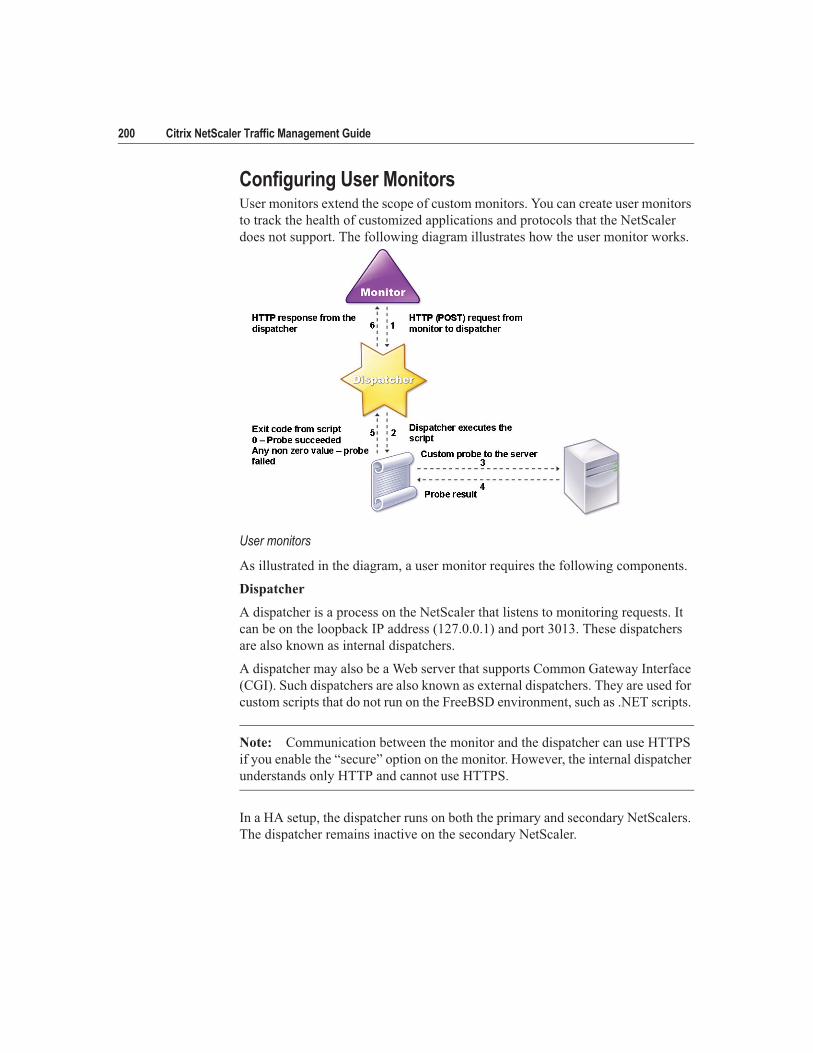
Configuring User MonitorsUser monitors extend the scope of custom monitors. You can create user monitors
to track the health of customized applications and protocols that the NetScaler
does not support. The following diagram illustrates how the user monitor works.
User monitors
As illustrated in the diagram, a user monitor requires the following components.
Dispatcher
A dispatcher is a process on the NetScaler that listens to monitoring requests. It
can be on the loopback IP address (127.0.0.1) and port 3013. These dispatchers
are also known as internal dispatchers.
A dispatcher may also be a Web server that supports Common Gateway Interface
(CGI). Such dispatchers are also known as external dispatchers. They are used for
custom scripts that do not run on the FreeBSD environment, such as .NET scripts.
Note: Communication between the monitor and the dispatcher can use HTTPS
if you enable the “secure” option on the monitor. However, the internal dispatcher
understands only HTTP and cannot use HTTPS.
In a HA setup, the dispatcher runs on both the primary and secondary NetScalers.
The dispatcher remains inactive on the secondary NetScaler.
Chapter 1 Load Balancing 201
Script
The script is a program that sends out custom probes to the back-end entity and
returns the response code to the dispatcher. The NetScaler is bundled with sample
scripts for commonly used protocols. The scripts exist in the /nsconfig/monitors
directory. If you want to add a new script, add the script in the location /nsconfig/
monitors. If you want to customize an existing script, copy the script with a new
name and modify the script. For the scripts to function correctly, the name of the
script file must not exceed 63 characters, and the maximum number of script
arguments is 512. To debug the script, you must run it using the nsumon-debug.pl
on the Command Line Interface (CLI). You must use the script name (with its
arguments), IP address, and the port as the arguments of the nsumon-debug.pl
script. Users must use the script name, IP address, port, time-out, and the script
arguments for the nsumon-debug.pl script.
Working of User Monitors
To track the status of the server, the monitor sends an HTTP POST request to the
configured dispatcher. This POST request contains the IP address and port of the
server, and the script that must be executed.
The dispatcher executes the script as a child process, with user-defined
parameters (if any). Then, the script sends a probe to the server. The script sends
the status of the probe (response code) to the dispatcher. The dispatcher converts
the response code to an HTTP response and sends it to the monitor. Based on the
HTTP response, the monitor marks the service as up or down.
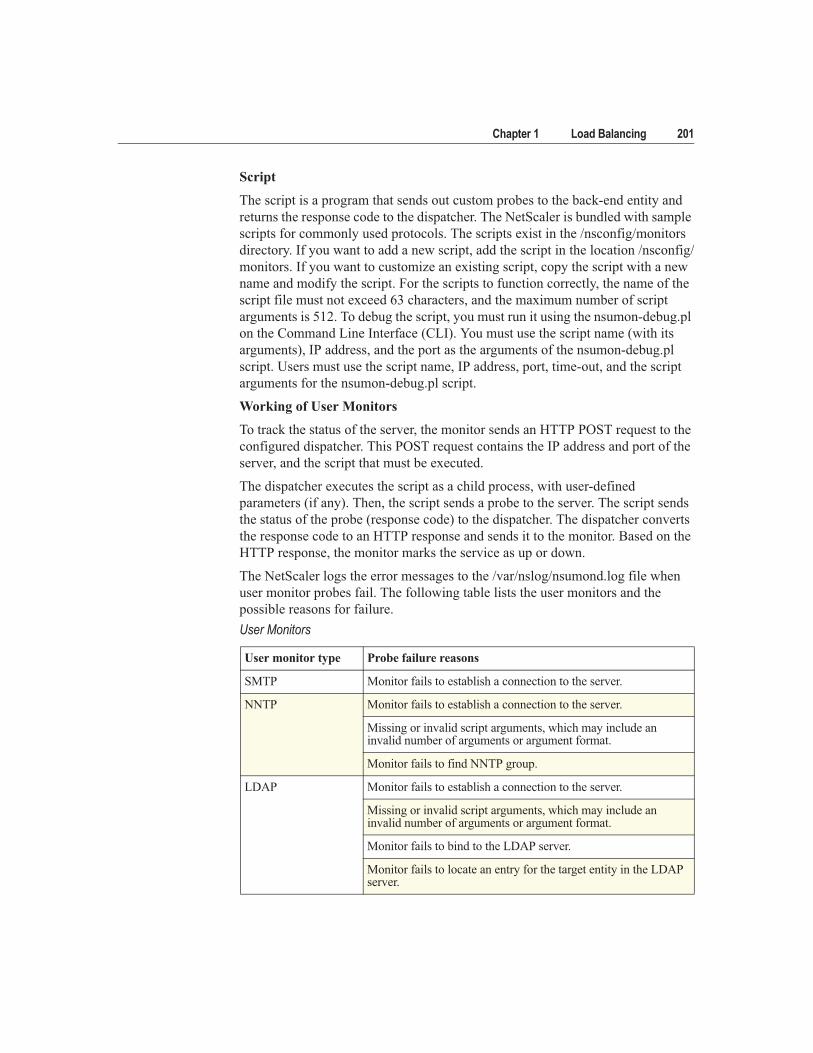
The NetScaler logs the error messages to the /var/nslog/nsumond.log file when
user monitor probes fail. The following table lists the user monitors and the
possible reasons for failure.
User Monitors
User monitor type Probe failure reasons
SMTP Monitor fails to establish a connection to the server.
NNTP Monitor fails to establish a connection to the server.
Missing or invalid script arguments, which may include an invalid number of arguments or argument format.
Monitor fails to find NNTP group.
LDAP Monitor fails to establish a connection to the server.
Missing or invalid script arguments, which may include an invalid number of arguments or argument format.
Monitor fails to bind to the LDAP server.
Monitor fails to locate an entry for the target entity in the LDAP server.

202 Citrix NetScaler Traffic Management Guide
To view the log file using the NetScaler command line
At the NetScaler command prompt, type:
shell
cat /var/nslog/nsumond.log
FTP The connection to the server times out.
Missing or invalid script arguments, which may include an invalid number of arguments or argument format.
Login fails.
Monitor fails to find the file on the server.
POP3 Monitor fails to establish a connection to the database.
Missing or invalid script arguments, which may include an invalid number of arguments or argument format.
Login fails.
MySQL Monitor fails to establish a connection to the database.
Missing or invalid script arguments, which may include an invalid number of arguments or argument format.
Login fails.
Preparation of SQL query fails.
Execution of SQL query fails.
SNMP Monitor fails to establish a connection to the database.
Missing or invalid script arguments, which may include an invalid number of arguments or argument format.
Login fails.
Monitor fails to create SNMP session.
Monitor fails to find the object identifier.
The monitor threshold value setting is greater than or equal to the actual threshold of the monitor.
RDP (Windows Terminal Server)
Missing or invalid script arguments, which may include an invalid number of arguments or argument format.
Monitor fails to create a socket.
Mismatch in version.
Monitor fails to confirm connection.
User Monitors
User monitor type Probe failure reasons
Chapter 1 Load Balancing 203
exit
User monitors also have a time-out value and a retry count on failure of probes.
You can use user monitors with non-user monitors. During high CPU utilization,
a non-user monitor enables faster detection of a server failure. If the user monitor
probe times out during high CPU usage, the state of the service remains
unchanged.
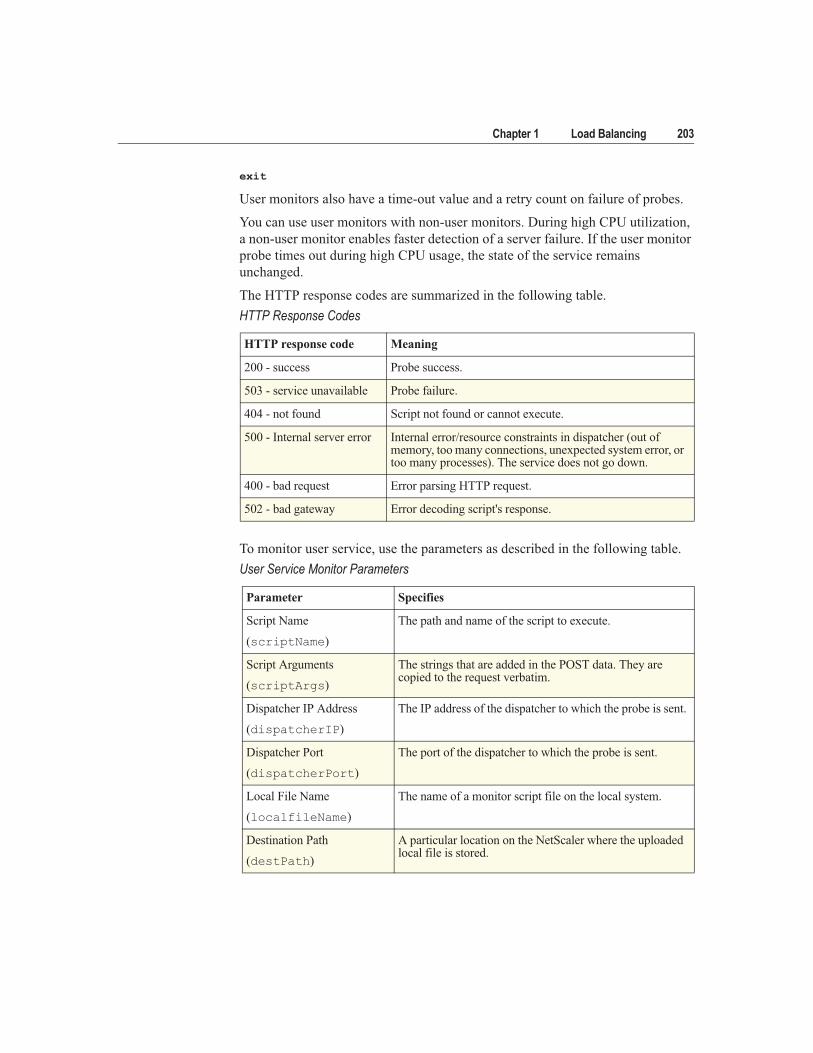
The HTTP response codes are summarized in the following table.
To monitor user service, use the parameters as described in the following table.
HTTP Response Codes
HTTP response code Meaning
200 - success Probe success.
503 - service unavailable Probe failure.
404 - not found Script not found or cannot execute.
500 - Internal server error Internal error/resource constraints in dispatcher (out of memory, too many connections, unexpected system error, or too many processes). The service does not go down.
400 - bad request Error parsing HTTP request.
502 - bad gateway Error decoding script's response.
User Service Monitor Parameters
Parameter Specifies
Script Name
(scriptName)
The path and name of the script to execute.
Script Arguments
(scriptArgs)
The strings that are added in the POST data. They are copied to the request verbatim.
Dispatcher IP Address
(dispatcherIP)
The IP address of the dispatcher to which the probe is sent.
Dispatcher Port
(dispatcherPort)
The port of the dispatcher to which the probe is sent.
Local File Name
(localfileName)
The name of a monitor script file on the local system.
Destination Path
(destPath)
A particular location on the NetScaler where the uploaded local file is stored.
204 Citrix NetScaler Traffic Management Guide
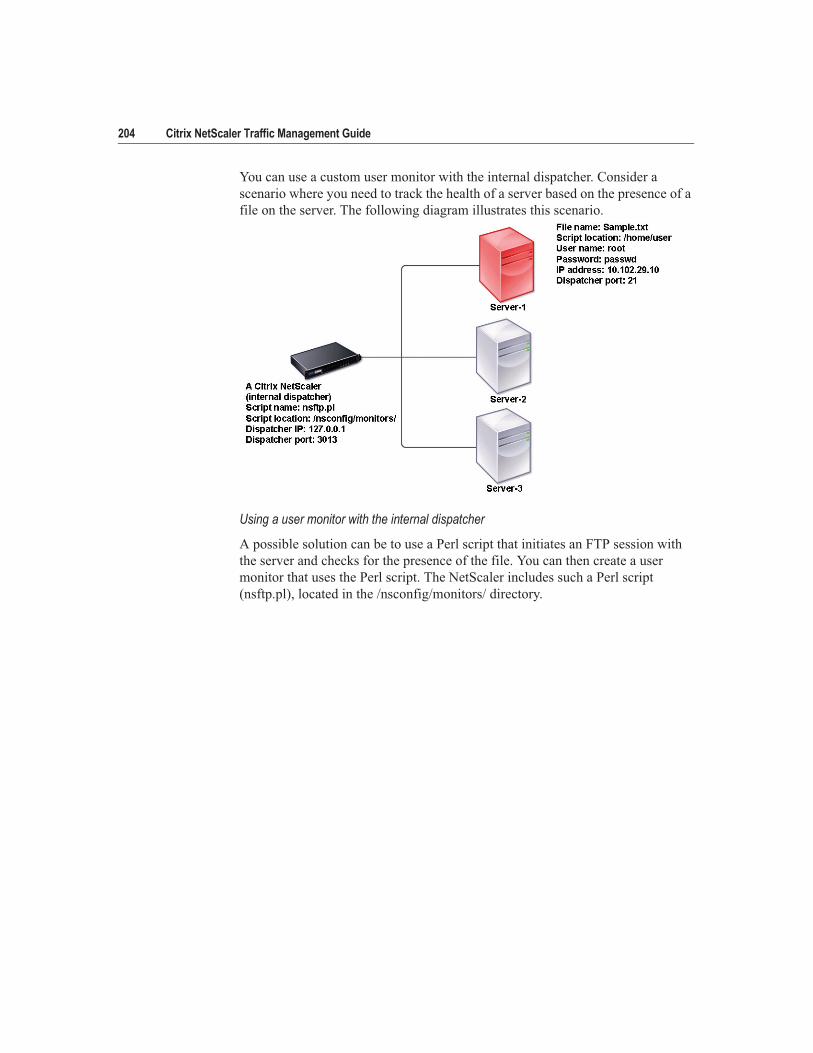
You can use a custom user monitor with the internal dispatcher. Consider a
scenario where you need to track the health of a server based on the presence of a
file on the server. The following diagram illustrates this scenario.
Using a user monitor with the internal dispatcher
A possible solution can be to use a Perl script that initiates an FTP session with
the server and checks for the presence of the file. You can then create a user
monitor that uses the Perl script. The NetScaler includes such a Perl script
(nsftp.pl), located in the /nsconfig/monitors/ directory.

Chapter 1 Load Balancing 205
You can use a user monitor with an external dispatcher. Consider a scenario
where you must track the health of a server based on the state of an SMTP service
on another server. This scenario is illustrated in the following diagram.
Using a user monitor with an external dispatcher
A possible solution would be to create a Perl script that checks the state of the
SMTP service on the server. You can then create a user monitor that uses the Perl
script. To configure user monitors, see “Configuring Monitors in a Load
Balancing Setup,” on page 162.
To configure user monitor using the NetScaler command line
At the NetScaler command prompt, type:
add monitor NameOfMonitor USER -scriptname NameOfScript –scriptargs
Arguments
Example
add monitor Monitor-User-1 USER -scriptname nsftp.pl –scriptargs
“file=/home/user/sample.txt;user=root;password=passwd"