Monitoring Systems and POWER5/6 LPARs with Ganglia Michael Perzl –...
93
-
Upload
junior-york -
Category
Documents
-
view
220 -
download
6
Transcript of Monitoring Systems and POWER5/6 LPARs with Ganglia Michael Perzl –...
2 Monitoring Systems and POWER5/6 LPARs with Ganglia
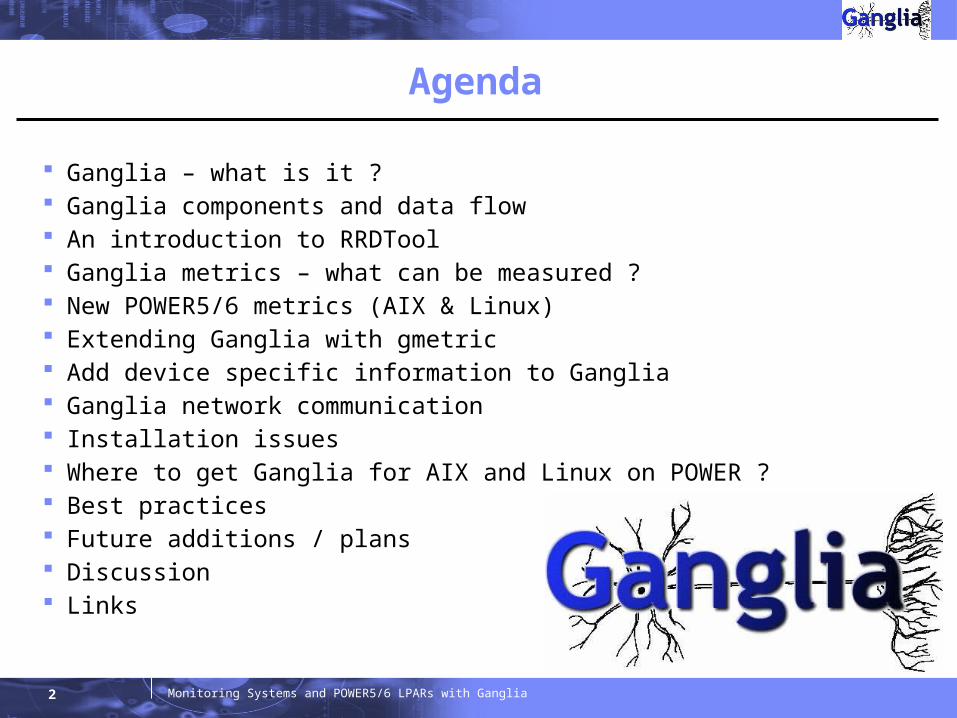
Agenda
Ganglia – what is it ? Ganglia components and data flow An introduction to RRDTool Ganglia metrics – what can be measured ? New POWER5/6 metrics (AIX & Linux) Extending Ganglia with gmetric Add device specific information to Ganglia Ganglia network communication Installation issues Where to get Ganglia for AIX and Linux on POWER ? Best practices Future additions / plans Discussion Links

Ganglia – what is it ?
4 Monitoring Systems and POWER5/6 LPARs with Ganglia
Ganglia – what is it ? (1/3)
Ganglia is an Open Source cluster performance monitoring tool and has been extended to include POWER5/6 features like shared processor LPARs, entitlement, physical CPU usage etc.
This session covers:– the technical details of Ganglia and the POWER5/6 extensions– how to set it up and use it to monitor all LPARs in a single machine and lots of
machines

5 Monitoring Systems and POWER5/6 LPARs with Ganglia
Ganglia – what is it ? (2/3)
Ganglia properties: scalable distributed monitoring system for high-performance computing
systems such as clusters and grids based on a hierarchical design targeted at federations of clusters relies on a multicast-based listen/announce protocol to monitor state within
clusters and uses a tree of point-to-point connections amongst representative cluster nodes to federate clusters and aggregate their state
leverages widely used technologies such as– XML for data representation– XDR (eXternal Data Representation) for compact, portable data transport– RRDtool for data storage and visualization
uses carefully engineered data structures and algorithms to achieve very low per-node overheads and high concurrency
robust implementation Open Source, written in C
– Downloaded 110,000+ times, 145+ countries, 500+ clusters, 2000+ nodes
6 Monitoring Systems and POWER5/6 LPARs with Ganglia
Ganglia – what is it ? (3/3)
Ganglia properties (cont.): has been ported to an extensive set of operating systems and processor
architectures:– AIX– Darwin– FreeBSD– HP-UX– IRIX– Linux– OSF– NetBSD– Solaris– Windows (via Cygwin)
is currently in use on over 500+ clusters around the world has been used to link clusters across university campuses and around the
world and can scale to handle clusters with 2000+ nodes– check http://ganglia.info/ for more details

Ganglia components and data flow
8 Monitoring Systems and POWER5/6 LPARs with Ganglia
Ganglia components
The ganglia system consists of: two unique daemons:
– Ganglia Monitoring Daemon (gmond)• monitoring daemon, collects the metrics• runs on each node
– Ganglia Meta Daemon (gmetad)• polls all gmond clients and stores the collected metrics in Round-Robin
Databases (RRDs)
a PHP-based web frontend a few other small utility programs
– gmetric• can be used to easily extend Ganglia with additional user-defined metrics
– gstat– gexec
9 Monitoring Systems and POWER5/6 LPARs with Ganglia
Ganglia – Schematic View
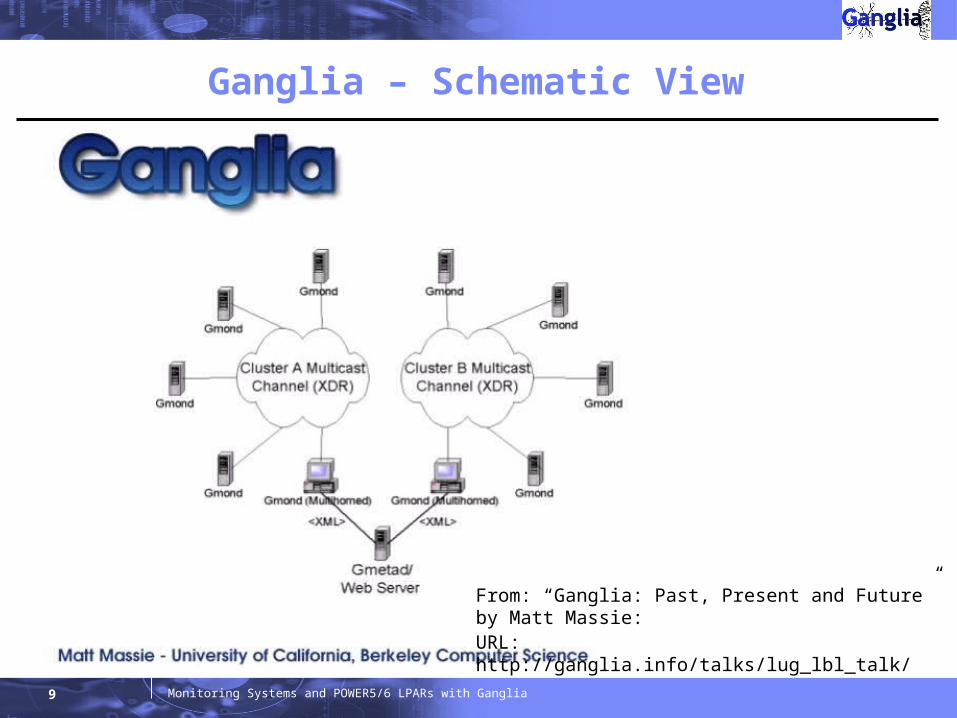
From: “Ganglia: Past, Present and Future” by Matt Massie:URL: http://ganglia.info/talks/lug_lbl_talk/

10 Monitoring Systems and POWER5/6 LPARs with Ganglia
Ganglia Architecture

11 Monitoring Systems and POWER5/6 LPARs with Ganglia
Ganglia Monitoring Daemon (gmond)
Ganglia Monitoring Daemon (gmond) is a multi-threaded daemon which runs on each cluster node you want to monitor.
Installation is easy:– just the daemon and a configuration file (/etc/gmond.conf)
gmond has four main responsibilities:1. monitor changes in host state2. announce relevant changes3. listen to the state of all other ganglia nodes via a unicast or multicast channel4. answer requests for an XML description of the cluster state
Each gmond transmits information in two different ways:– unicasting or multicasting host state in external data representation (XDR) format
using UDP messages– sending XML over a TCP connection

12 Monitoring Systems and POWER5/6 LPARs with Ganglia
Ganglia Meta Daemon (gmetad) (1/2)
Ganglia Meta Daemon (gmetad) is a daemon which typically only runs on one specific cluster node – or on more when using a staged setup.
Installation is easy:– just the daemon and a configuration file (/etc/gmetad.conf)
Federation in Ganglia is achieved using a tree of point-to-point connections amongst representative cluster nodes to aggregate the state of multiple clusters.
At each node in the tree a gmetad– periodically polls a collection of child data sources– parses the collected XML– saves all numeric volatile metrics to round-robin databases– exports the aggregated XML over a TCP socket to clients

13 Monitoring Systems and POWER5/6 LPARs with Ganglia
Ganglia Meta Daemon (gmetad) (2/2)
Data sources may be either– gmond daemons, representing specific clusters
or– other gmetad daemons, representing sets of clusters
Data sources use source IP addresses for access control– Multiple IP addresses can be specified for failover– The capability is natural for aggregating data from clusters since each gmond
daemon contains the entire state of its cluster

14 Monitoring Systems and POWER5/6 LPARs with Ganglia
Ganglia PHP web frontend (1/2)
Web frontend properties: provides a view of the gathered information via real-time dynamic web pages displays Ganglia data in a meaningful way for system administrators and users
– For example, one can view the CPU utilization over the past hour, day, week, month, or year
– The web frontend shows similar graphs for memory usage, disk usage, network statistics, number of running processes, and all other Ganglia metrics

15 Monitoring Systems and POWER5/6 LPARs with Ganglia
Ganglia PHP web frontend (2/2)
Web frontend properties (cont.): depends on the existence of the gmetad which provides it with data from
several Ganglia sources opens the local port 8651 (by default) and expects to receive a Ganglia XML
tree the web pages themselves are highly dynamic; any change to the Ganglia data
appears immediately on the site– This behavior leads to a very responsive site, but requires that the full XML tree be
parsed on every page access– Therefore, the Ganglia web frontend should run on a fairly powerful, dedicated
machine if it presents a large amount of data
is written in the PHP scripting language and uses graphs generated by gmetad to display history information
has been tested on many flavors of Unix (primarily Linux) with the Apache web server and the PHP 4.1 module

16 Monitoring Systems and POWER5/6 LPARs with Ganglia
/etc/gmond.conf
gmond
One daemon per node/LPAR
Operating Systemperformance stats
API
Ganglia - data flow (1/4)
File accessNetworkWeb
17 Monitoring Systems and POWER5/6 LPARs with Ganglia
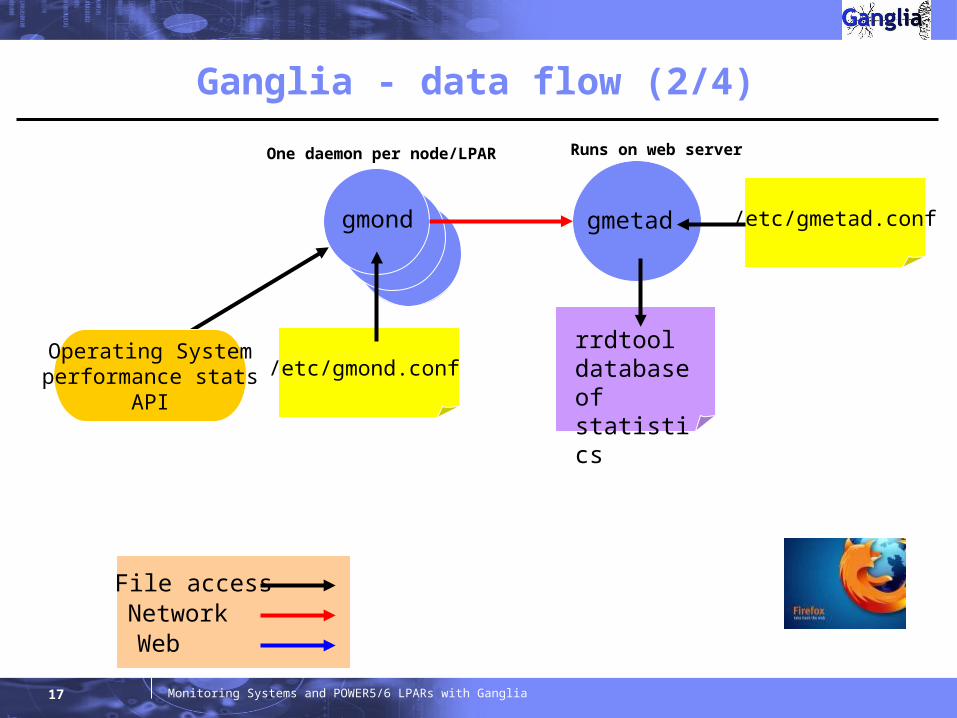
/etc/gmond.conf
gmond gmetad
rrdtooldatabaseof statistics
One daemon per node/LPAR Runs on web server
Browser
/etc/gmetad.conf
Operating Systemperformance stats
API
Ganglia - data flow (2/4)
File accessNetworkWeb

18 Monitoring Systems and POWER5/6 LPARs with Ganglia
/etc/gmond.conf
gmond gmetad
rrdtooldatabaseof statistics
Apache2+ PHP5
One daemon per node/LPAR Runs on web server
Browser
Ganglia FE scripts
/etc/gmetad.conf
Operating Systemperformance stats
API
Ganglia - data flow (3/4)
File accessNetworkWeb

19 Monitoring Systems and POWER5/6 LPARs with Ganglia
/etc/gmond.conf
gmond gmetad
rrdtooldatabaseof statistics
Apache2+ PHP5
gmetric
One daemon per node/LPAR Runs on web serverUser command
Browser
Ganglia FE scripts
/etc/gmetad.conf
Operating Systemperformance stats
API
Ganglia - data flow (4/4)
File accessNetworkWeb
20 Monitoring Systems and POWER5/6 LPARs with Ganglia
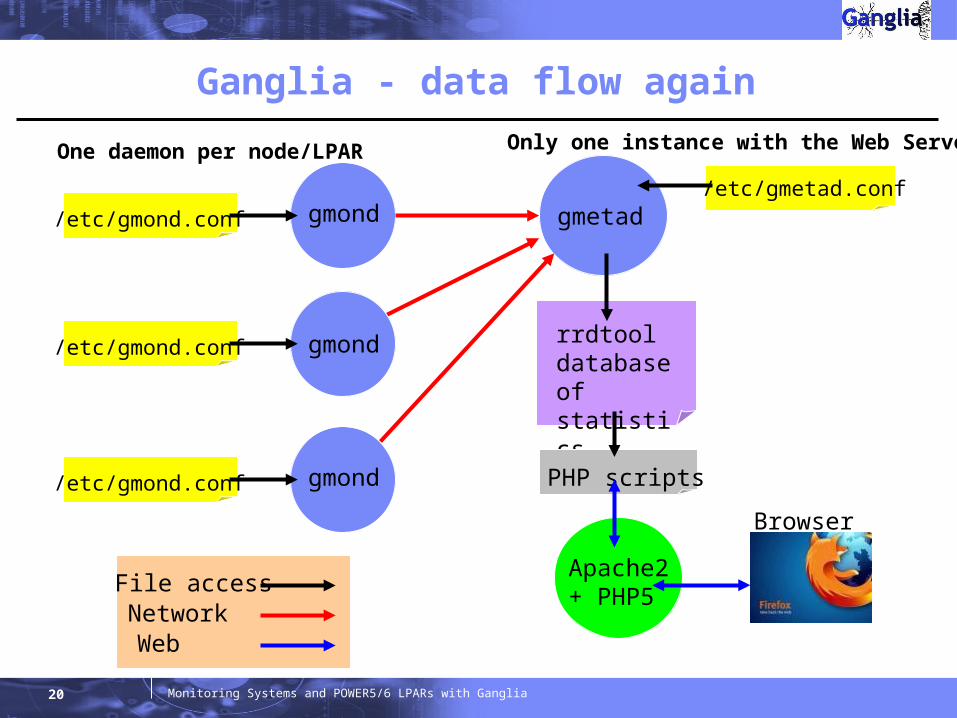
/etc/gmond.conf gmond gmetad
rrdtooldatabaseof statistics
Apache2+ PHP5
One daemon per node/LPAR Only one instance with the Web Server
Browser
PHP scripts
/etc/gmetad.conf
File accessNetwork
/etc/gmond.conf gmond
/etc/gmond.conf gmond
Web
Ganglia - data flow again
An introduction to RRDTool

22 Monitoring Systems and POWER5/6 LPARs with Ganglia
RRDTool
Homepage: http://oss.oetiker.ch/rrdtool/ RRD is the Acronym for Round-Robin Database. RRD is a system to store and display time-series data (i.e., network bandwidth,
machine-room temperature, server load average). It stores the data in a very compact way that will not expand over time (fixed
size of DB), and it presents useful graphs by processing the data to enforce a certain data density.
It can be used either via simple wrapper scripts (from shell or Perl) or via frontends that poll network devices and put a friendly user interface on it.
RRDTool is the industry standard tool to store and display time-series data!
23 Monitoring Systems and POWER5/6 LPARs with Ganglia
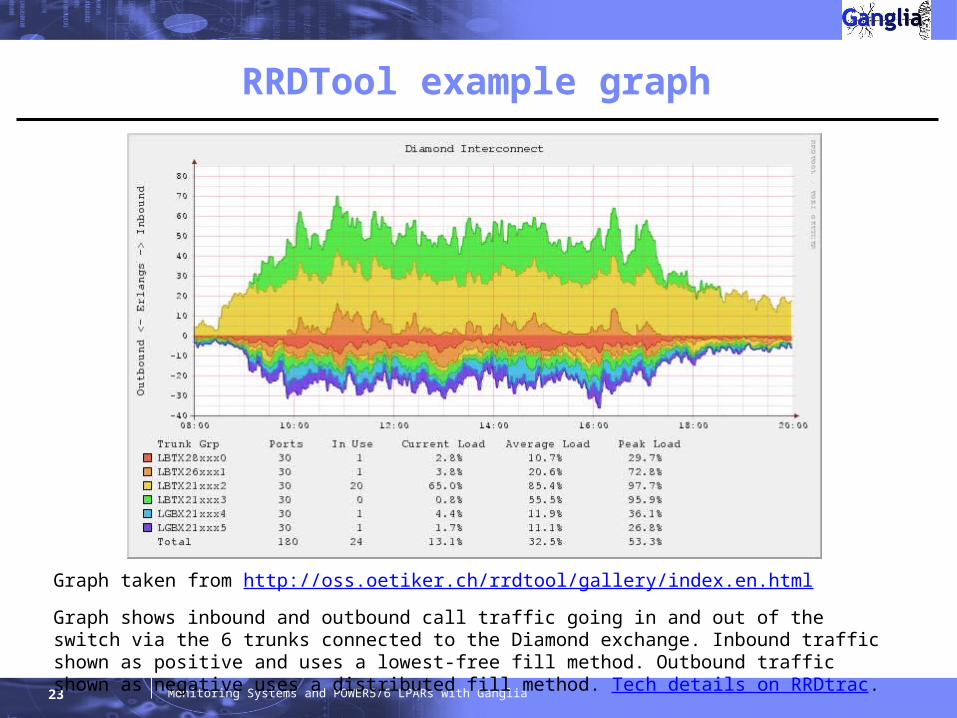
RRDTool example graph
Graph taken from http://oss.oetiker.ch/rrdtool/gallery/index.en.html
Graph shows inbound and outbound call traffic going in and out of the switch via the 6 trunks connected to the Diamond exchange. Inbound traffic shown as positive and uses a lowest-free fill method. Outbound traffic shown as negative uses a distributed fill method. Tech details on RRDtrac.

24 Monitoring Systems and POWER5/6 LPARs with Ganglia
RRDTool example
# rrdtool create test.rrd \ --start 920804400 \ --step 300 \ DS:km:COUNTER:600:U:U \ RRA:AVERAGE:0.5:1:24
# rrdtool update test.rrd 920804700:12345 920805000:12357 920805300:12363# rrdtool update test.rrd 920805600:12363 920805900:12363 920806200:12373# rrdtool update test.rrd 920806500:12383 920806800:12393 920807100:12399# rrdtool update test.rrd 920807400:12405 920807700:12411 920808000:12415# rrdtool update test.rrd 920808300:12420 920808600:12422 920808900:12423
# rrdtool graph kilometer.png \ --start 920804400 \ --end 920808000 \ DEF:mykm=test.rrd:km:AVERAGE \ LINE2:mykm#FF0000

Ganglia metrics – what can be monitored ?

26 Monitoring Systems and POWER5/6 LPARs with Ganglia
Metrics
Definition of a metric: A metric is a certain observed property of the system.
Number of metrics: 34 standard metrics, i.e., available (i.e., defined) on all platforms Additional platform dependent metrics available
– Solaris• 8 additional metrics available
– HP-UX• 4 additional metrics available
– AIX• 18 additional new metrics available for POWER5/6 !!!• details later….
Remarks: One RRD database per Ganglia metric is used Database size is fixed (~ 12 kB per RRD database with default settings) Some standard metrics do not exist on all platforms, e.g., some metrics (coming from
Linux) don’t exist or don’t make sense on AIX

27 Monitoring Systems and POWER5/6 LPARs with Ganglia
Ganglia standard metrics (1/2)
boottime–system boot timestamp
bytes_in–number of network bytes received per second
bytes_out–number of network bytes sent out per second
cpu_aidle–percent of time since boot idle CPU–not defined on AIX, Linux yes
cpu_idle–percent CPU idle time
cpu_nice–percent CPU nice–not defined on AIX, Linux yes
cpu_num–number of CPUs
cpu_intr–number of interrupts (??)–not defined on AIX, Linux yes
cpu_sintr–number of system interrupts (??)–not defined on AIX, Linux yes
cpu_speed–speed of CPUs in MHz
cpu_system–percent CPU system
cpu_user–percent CPU user
cpu_wio–CPU time spent waiting for I/O
disk_free–total free disk space in GB
disk_total–total available disk space in GB
load_one–load average over 1 minute
load_five–load average over 5 minutes
load_fifteen–load average over 15 minutes

28 Monitoring Systems and POWER5/6 LPARs with Ganglia
Ganglia standard metrics (2/2)
machine_type–type of machine (e.g., POWER5)
mem_total–total available memory in kB
mem_free–amount of free memory in kB
mem_shared–amount of shared memory–not defined on AIX, Linux yes
mem_buffers–amount of memory used for buffers–not defined on AIX, Linux yes
mem_cached–amount of memory used for cache–AIX: numperm memory pages
mtu–MTU size reported in bytes
os_name–name of OS
os_release–OS release version (on AIX: level of fileset bos.mp)
part_max_used–most filled disk partition–not defined on AIX, Linux yes
pkts_in–number of network packets received
pkts_out–number of network packets sent out
proc_run–total number of running processes
proc_total–total number of processes
swap_free–free swap space in kB–AIX: paging space free
swap_total–total available swap space in kB–AIX: paging space

New POWER5/6 metrics (AIX & Linux)
30 Monitoring Systems and POWER5/6 LPARs with Ganglia
Ganglia and POWER5/6
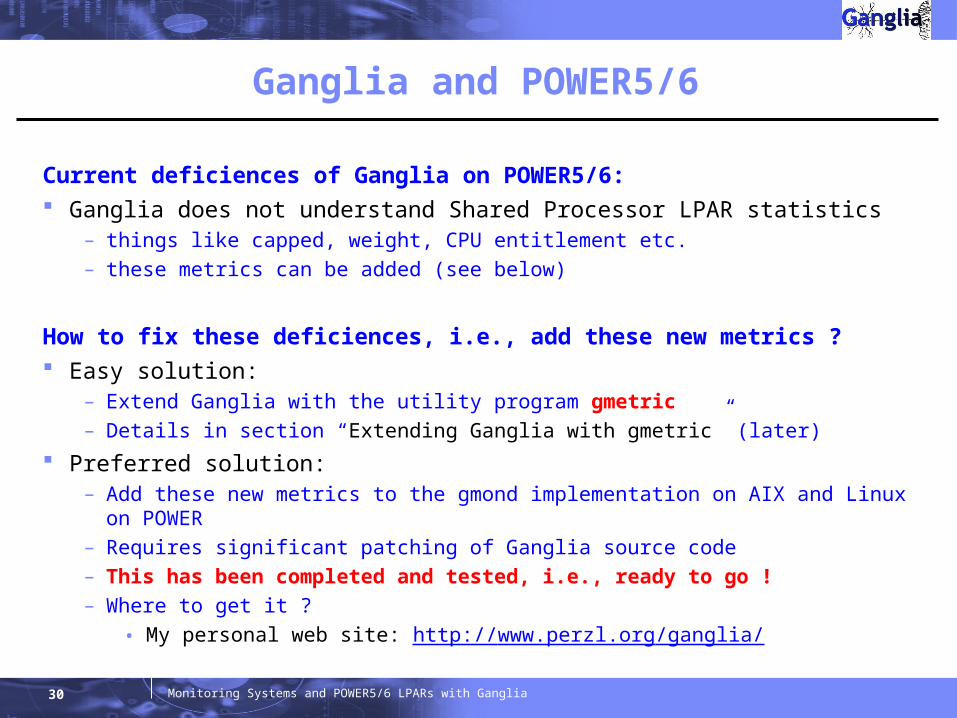
Current deficiences of Ganglia on POWER5/6: Ganglia does not understand Shared Processor LPAR statistics
– things like capped, weight, CPU entitlement etc.– these metrics can be added (see below)
How to fix these deficiences, i.e., add these new metrics ? Easy solution:
– Extend Ganglia with the utility program gmetric– Details in section “Extending Ganglia with gmetric” (later)
Preferred solution:– Add these new metrics to the gmond implementation on AIX and Linux on POWER– Requires significant patching of Ganglia source code– This has been completed and tested, i.e., ready to go !– Where to get it ?
• My personal web site: http://www.perzl.org/ganglia/

31 Monitoring Systems and POWER5/6 LPARs with Ganglia
Additional Ganglia POWER5/6 metrics (1/5)
Question: How are those additional metrics programmed and where do they get the
information from?
Answer: AIX:
– Only the APIs provided by libperfstat are used– As a consequence the fileset bos.perf.libperfstat must be installed
Linux:– Only entries in the /proc file system are used, e.g., /proc/cpuinfo, /proc/meminfo,
/proc/ppc64/lparcfg etc.– No additional fileset must be installed

32 Monitoring Systems and POWER5/6 LPARs with Ganglia
Additional Ganglia POWER5/6 metrics (2/5)
1) capped
2) cpu_entitlement
3) cpu_in_lpar
4) cpu_in_machine
5) cpu_in_pool
6) cpu_pool_idle
7) cpu_used
8) disk_read
9) disk_write
10) kernel64bit
11) lpar
12) lpar_name
13) lpar_num
14) oslevel
15) serial_num
16) smt
17) splpar
18) weight
List of 18 additional new metrics for POWER5 (AIX & Linux):

33 Monitoring Systems and POWER5/6 LPARs with Ganglia
Additional Ganglia POWER5 metrics (3/5)
1) capped– Type: String value– returns "yes" if the system is a POWER5 Shared Processor LPAR which is running in capped mode or "no"
otherwise
2) cpu_entitlement– Type: Float value– returns the Capacity Entitlement of the system in units of physical CPUs
3) cpu_in_lpar– Type: Integer value– returns the number of CPUs the OS sees in the system. In a POWER5 Shared Processor LPAR this returns the
number of virtual CPUs. When SMT is enabled this number is doubled.
4) cpu_in_machine– Type: Integer value– returns the number of physical CPUs in the whole system
5) cpu_in_pool– Type: Integer value– returns the number of physical CPUs in the Shared Processor Pool
6) cpu_pool_idle– Type: Float value– returns in fractional numbers of physical CPUs how much the Shared Processor Pool is idle
34 Monitoring Systems and POWER5/6 LPARs with Ganglia
Additional Ganglia POWER5 metrics (4/5)
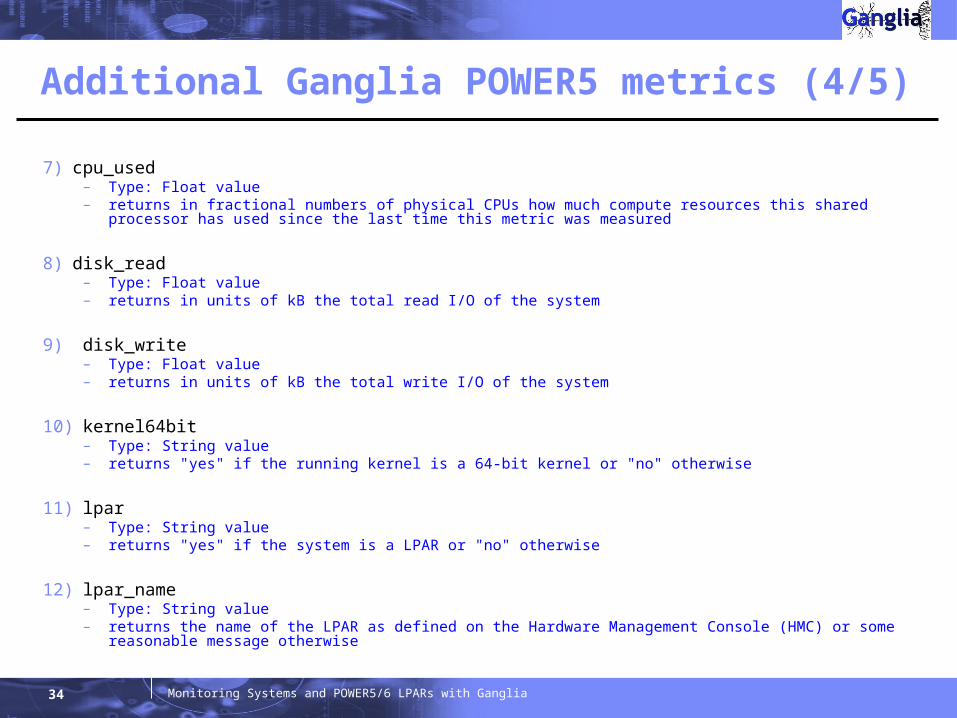
7) cpu_used– Type: Float value– returns in fractional numbers of physical CPUs how much compute resources this shared processor has used
since the last time this metric was measured
8) disk_read– Type: Float value– returns in units of kB the total read I/O of the system
9) disk_write– Type: Float value– returns in units of kB the total write I/O of the system
10) kernel64bit– Type: String value– returns "yes" if the running kernel is a 64-bit kernel or "no" otherwise
11) lpar– Type: String value– returns "yes" if the system is a LPAR or "no" otherwise
12) lpar_name– Type: String value– returns the name of the LPAR as defined on the Hardware Management Console (HMC) or some reasonable
message otherwise

35 Monitoring Systems and POWER5/6 LPARs with Ganglia
Additional Ganglia POWER5 metrics (5/5)
13) lpar_num– Type: Integer value– returns the partition ID of the LPAR as defined on the Hardware Management Console (HMC) or some
reasonable message otherwise
14) oslevel– Type: String value– returns the version string as provided by the AIX command 'oslevel‘
15) serial_num– Type: String value– returns the serial number of the system as provided by the AIX command 'uname‘
16) smt– Type: String value– returns "yes" if SMT is enabled or "no" otherwise
17) splpar– Type: String value– returns "yes" if the system is running in a shared processor LPAR or "no" otherwise
18) weight– Type: Integer value– returns the weight of the LPAR running in uncapped mode

Extending Ganglia with gmetric

37 Monitoring Systems and POWER5/6 LPARs with Ganglia
Extending Ganglia
How can I easily add metrics to Ganglia ? Ganglia has a simple way to add metrics that should be monitored The utility program gmetric is used for that purpose These new metrics are then automatically added to the database and web
server data and graphs
New metric(periodically call
gmetric to providenew data)

38 Monitoring Systems and POWER5/6 LPARs with Ganglia
gmetric example – Machine firmware level
Example of a static metric: Machine firmware level
gmetric --name firmware \ --value `lsattr -El sys0 -a modelname -F value` \ --type "string"
Remarks: The above will only save the statistics once. The firmware level is unlikely to change without reboot, therefore it is sufficient
to run this command once.

39 Monitoring Systems and POWER5/6 LPARs with Ganglia
gmetric example – database transactions
Example of a variable metric: Transaction rate of your database
To add the number of transaction and assuming you have a script that will work this out called "transactions" that returns a number with a decimal point – you will have to write this script yourself !
gmetric --name tpm \ --value `/usr/local/bin/transactions` \ --type double
Remarks: This command will only save the statistics once. As the number of transactions per minute will definitely change, to get these
always up to date, it is recommended to run the command regularly, e.g., run once every 60 seconds via cron.

Add device specific information to Ganglia
41 Monitoring Systems and POWER5/6 LPARs with Ganglia
General Remarks
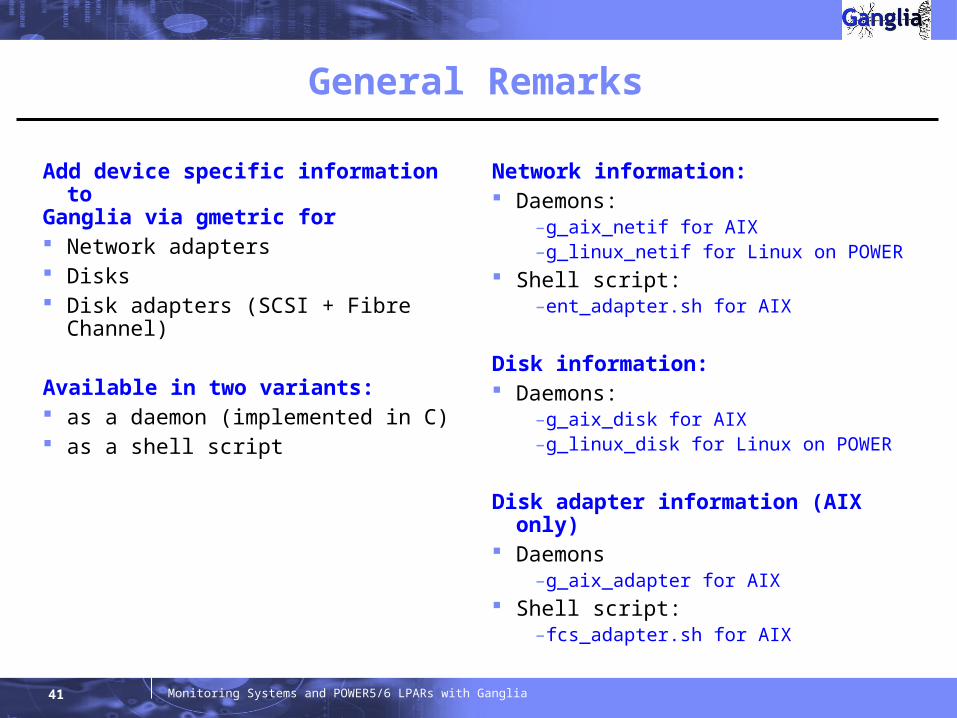
Add device specific information toGanglia via gmetric for Network adapters Disks Disk adapters (SCSI + Fibre Channel)
Available in two variants: as a daemon (implemented in C) as a shell script
Network information: Daemons:
–g_aix_netif for AIX–g_linux_netif for Linux on POWER
Shell script:–ent_adapter.sh for AIX
Disk information: Daemons:
–g_aix_disk for AIX–g_linux_disk for Linux on POWER
Disk adapter information (AIX only) Daemons
–g_aix_adapter for AIX Shell script:
–fcs_adapter.sh for AIX
42 Monitoring Systems and POWER5/6 LPARs with Ganglia
Add device specific information on AIX and Linux (1/4)
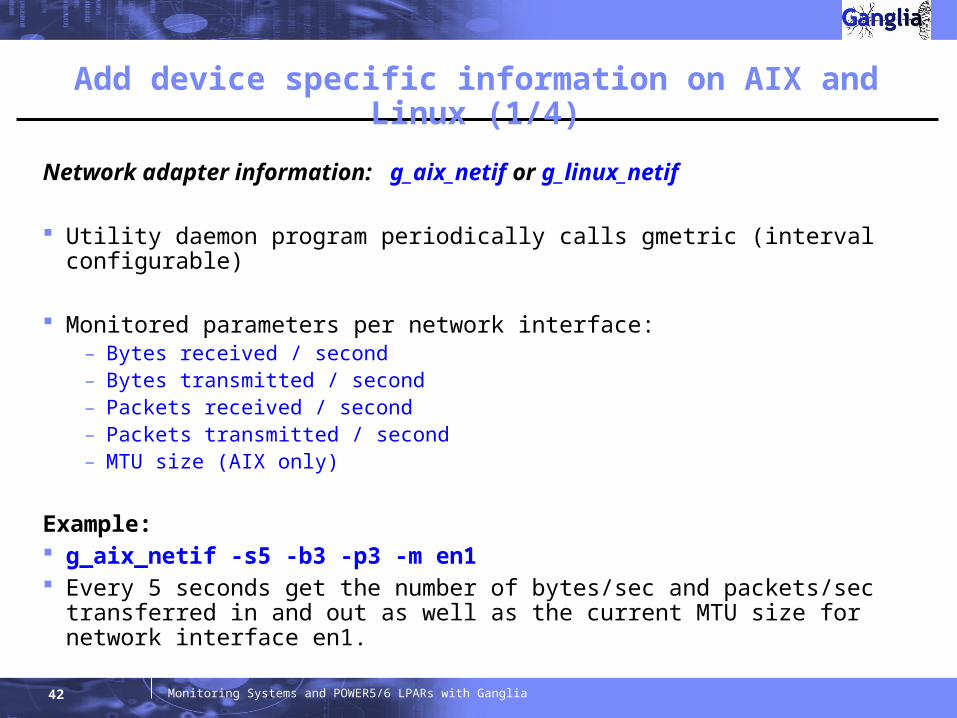
Network adapter information: g_aix_netif or g_linux_netif
Utility daemon program periodically calls gmetric (interval configurable)
Monitored parameters per network interface:– Bytes received / second– Bytes transmitted / second– Packets received / second– Packets transmitted / second– MTU size (AIX only)
Example: g_aix_netif -s5 -b3 -p3 -m en1 Every 5 seconds get the number of bytes/sec and packets/sec transferred in
and out as well as the current MTU size for network interface en1.

43 Monitoring Systems and POWER5/6 LPARs with Ganglia
Add device specific information on AIX and Linux (2/4)
Disk information: g_aix_disk or g_linux_disk
Utility daemon program periodically calls gmetric (interval configurable)
Monitored parameters per disk:– Bytes read / second– Bytes written / second
Example: g_aix_disk -s10 -i -o hdisk3 Every 10 seconds get the number of bytes/sec transferred in and out for disk
hdisk3.
44 Monitoring Systems and POWER5/6 LPARs with Ganglia
Add device specific information on AIX and Linux (3/4)
Disk adapter information: g_aix_adapter (AIX only)
Utility daemon program periodically calls gmetric (interval configurable)
Monitored parameters per disk adapter:– Bytes read / second– Bytes written / second
Example: g_aix_adapter –s5 –i –o scsi0 Every 5 seconds get the number of bytes/sec transferred in and out for SCSI
adapter scsi0.

45 Monitoring Systems and POWER5/6 LPARs with Ganglia
Add device specific information on AIX and Linux (4/4)
./g_aix_netif: Version 1.0
g_aix_netif [OPTIONS] <network-interface>
[-?] or [-h] This help information
[-s seconds] The time between output (default is 60 seconds), seconds must be in the range [1..3600].
[-c loop_count] The number of loops (default = 20 million), loop_count must be in the range [10..20000000].
[-b 0|1|2|3] Show bytes received/sent (default = off) 0 = don't show, 1 = show incoming 2 = show outgoing, 3 = show both
[-p 0|1|2|3] Show packets received/sent (default = off) 0 = don't show, 1 = show incoming 2 = show outgoing, 3 = show both
[-m] Show MTU size for <network-interface> (default = off)
[-d] Debug mode, remain in foreground, output only to screen
Please note:If not in debug mode (-d) g_aix_netif runs the same command via a shelland assumes gmetric will be found in the PATH and gmond is already running.g_aix_netif will disconnect from your terminal to become a daemon.Use "ps -ef | grep g_aix_netif" to confirm it is running.

Ganglia network communication

47 Monitoring Systems and POWER5/6 LPARs with Ganglia
Ganglia network communication
Ganglia by default uses Multicast Some network administrators might not like Multicast This can be changed to Unicast - requires changes to default config files
– Very simple changes to the gmond.conf files
Ganglia gmond network “chatter” The processes talk to each other quite a lot Not large in 100Mb or 1Gb or virtual networks terms Recommendation:
– Ganglia over admin network rather than user network if possible

48 Monitoring Systems and POWER5/6 LPARs with Ganglia
gmond: Multicast configuration example
gmond.conf:
/* This configuration is as close to 2.5.x default behavior as possible The values closely match ./gmond/metric.h definitions in 2.5.x */globals { daemonize = yes setuid = yes on some Linux distros: no user = nobody debug_level = 0 max_udp_msg_len = 1472 mute = no deaf = no host_dmax = 3600 /*secs */ cleanup_threshold = 300 /*secs */ gexec = no}
/* If a cluster attribute is specified, then all gmond hosts are wrapped inside of a <CLUSTER> tag. If you do not specify a cluster tag, then all <HOSTS> will NOT be wrapped inside of a <CLUSTER> tag. */cluster { name = "System p5 Model 550" owner = "unspecified" latlong = "unspecified" url = "unspecified"}
gmond.conf continued:
.../* The host section describes attributes of the host, like the location */host { location = "System p5 Model 550"}
/* Feel free to specify as many udp_send_channels as you like. Gmond used to only support having a single channel */udp_send_channel { mcast_join = 239.2.11.71 port = 8649}
/* You can specify as many udp_recv_channels as you like as well. */udp_recv_channel { mcast_join = 239.2.11.71 port = 8649 bind = 239.2.11.71}
/* You can specify as many tcp_accept_channels as you like to share an xml description of the state of the cluster */tcp_accept_channel { port = 8649}

49 Monitoring Systems and POWER5/6 LPARs with Ganglia
gmond: Unicast configuration example
gmond.conf:
/* This configuration is as close to 2.5.x default behavior as possible The values closely match ./gmond/metric.h definitions in 2.5.x */globals { daemonize = yes setuid = yes on some Linux distros: no user = nobody debug_level = 0 max_udp_msg_len = 1472 mute = no deaf = no host_dmax = 3600 /*secs */ cleanup_threshold = 300 /*secs */ gexec = no}
/* If a cluster attribute is specified, then all gmond hosts are wrapped inside of a <CLUSTER> tag. If you do not specify a cluster tag, then all <HOSTS> will NOT be wrapped inside of a <CLUSTER> tag. */cluster { name = "System p5 Model 550" owner = "unspecified" latlong = "unspecified" url = "unspecified"}...
gmond.conf continued:
.../* The host section describes attributes of the host, like the location */host { location = "System p5 Model 550"}
/* Feel free to specify as many udp_send_channels as you like. Gmond used to only support having a single channel */udp_send_channel { host = p550-aix port = 8649}
/* You can specify as many udp_recv_channels as you like as well. */udp_recv_channel { port = 8649}
/* You can specify as many tcp_accept_channels as you like to share an xml description of the state of the cluster */tcp_accept_channel { port = 8649}

50 Monitoring Systems and POWER5/6 LPARs with Ganglia
gmetad: configuration example
# Format:# data_source "my cluster" [polling interval] address1:port addreses2:port ...## The keyword 'data_source' must immediately be followed by a unique string which identifies the source,# then an optional polling interval in seconds. The source will be polled at this interval on average.# If the polling interval is omitted, 15sec is asssumed.## A list of machines which service the data source follows, in the format ip:port, or name:port.# If a port is not specified then 8649 (the default gmond port) is assumed.# default: There is no default value## data_source "my cluster" 10 localhost my.machine.edu:8649 1.2.3.5:8655# data_source "my grid" 50 1.3.4.7:8655 grid.org:8651 grid-backup.org:8651# data_source "another source" 1.3.4.7:8655 1.3.4.8data_source "Systen p5 Model 550" 15 p550-aix:8649 p550-nim:8649
# Round-Robin Archives# You can specify custom Round-Robin archives here (defaults are listed below)## RRAs "RRA:AVERAGE:0.5:1:240" "RRA:AVERAGE:0.5:24:240" "RRA:AVERAGE:0.5:168:240" \# "RRA:AVERAGE:0.5:672:240" "RRA:AVERAGE:0.5:5760:370"
# The name of this Grid. All the data sources above will be wrapped in a GRID tag with this name.# default: Unspecifiedgridname "Mycluster"

51 Monitoring Systems and POWER5/6 LPARs with Ganglia
Security issues
Ganglia setup can be tunneled through SSH if– certain security guidelines must be adhered to– security guidelines allow only SSH connections, nothing else
Detailed description of such a setup can be found at:– http://www.ibm.com/collaboration/wiki/display/LinuxP/Ganglia/

Installation issues

53 Monitoring Systems and POWER5/6 LPARs with Ganglia
Build requirements for Ganglia from scratch
RRDTool package dependencies–freetype2
–libart_lpgl
–libpng
–Perl
–zlib
Apache 2 package dependencies–httpd
• expat
• Perl
• zlib
–mod_ssl
• httpd
• openssl
PHP package dependencies–none
gmond package dependencies–none
gmetad packages dependencies–Apache 2
–PHP
–libxml2
–rrdtool

54 Monitoring Systems and POWER5/6 LPARs with Ganglia
Installation issues on POWER5/6
Linux: Installation on any recent Linux distribution is very easy!
– All Linux distributions contain the necessary RPM packages.
AIX: For AIX some (though not all) of the prerequisites can be fulfilled with RPM
packages from the AIX Toolbox for Linux Applications:– http://www.ibm.com/servers/aix/products/aixos/linux/
There was also a problem for people getting hold of Apache 2 on AIX with the latest PHP version, so Nigel Griffiths wrote a How-To to build these popular Open Source tools for AIX with GCC:
– http://www.ibm.com/collaboration/wiki/display/WikiPtype/aixopen
Compilation of Ganglia with the IBM C/C++ compilers is also easy and is done for the Ganglia binaries provided on my personal website:
– http://www.perzl.org/ganglia/

Where to get Ganglia for AIXand Linux on POWER ?

56 Monitoring Systems and POWER5/6 LPARs with Ganglia
Ganglia binaries and source code for POWER5/6 (1/2)
Where to get it ? My personal web site: http://www.perzl.org/ganglia/
What is available ? Binary and source RPMs available for:
– AIX v4.3.3 (gmond only)– AIX 5L v5.1 and v5.2– AIX 5L v5.3– Red Hat Enterprise Linux 4 and 5– SLES 9 and SLES 10– Fedora Core 4, 5, 6 and 7– openSUSE 10.0, 10.1, 10.2 and 10.3
Precompiled Apache 2 + PHP for Ganglia gmetad on AIX5L v5.1 and higher My enhanced Ganglia web interface Device specific information (network, disk, adapter) added to Ganglia via
gmetric
57 Monitoring Systems and POWER5/6 LPARs with Ganglia
Ganglia binaries and source code for POWER5/6 (2/2)
Required source code changes against version 3.0.5 of Ganglia to incorporate the new POWER5/6 metrics:
– configure – configure.in– gmetad/Makefile.in– gmond/gmond.c– lib/apr_net.c– lib/libgmond.c– lib/protocol.x – libmetrics/libmetrics.h – libmetrics/aix/metrics.c – libmetrics/linux/metrics.c – libmetrics/tests/test-metrics.c

58 Monitoring Systems and POWER5/6 LPARs with Ganglia
Download statistics of http://perzl.org/ganglia/ (1/2)
Data as of November 1st, 2007
Monthly access of http://www.perzl.org/ganglia/
5 525
92130
250 246
343
273
326
282 266 280256
457
0
50
100
150
200
250
300
350
400
450
500
08/20
06
09/20
06
10/20
06
11/20
06
12/20
06
01/20
07
02/20
07
03/20
07
04/20
07
05/20
07
06/20
07
07/20
07
08/20
07
09/20
07
10/20
07
Number of accesses per month

59 Monitoring Systems and POWER5/6 LPARs with Ganglia
Download statistics of http://perzl.org/ganglia/ (2/2)
Data as of November 1st, 2007
Monthly download numbers of binary packages
0
20
40
60
80
100
120
140
160
11/2006 12/2006 01/2007 02/2007 03/2007 04/2007 05/2007 06/2007 07/2007 08/2007 09/2007 10/2007
gmond RPM (all versions) gmetad RPM (all versions) Apache .tar.bz2 (AIX only)

Best Practices

61 Monitoring Systems and POWER5/6 LPARs with Ganglia
Some things to consider before you start…
A. Hostnames– To Ganglia a new hostname is a new machine– Has to resolve IP address so use DNS
B. IP addresses stable– Make sure you are not going to change IP addresses
C.Time and date– Make sure the timezone, time and date is consistent on all machines in a cluster– Use of NTP is recommended
So– These are normal on production machines– For prototype and test systems – get this right before starting Ganglia
Simple Ganglia How-To available for people setting up their first Ganglia system available at:– http://www.ibm.com/collaboration/wiki/display/WikiPtype/ganglia
On all nodes

62 Monitoring Systems and POWER5/6 LPARs with Ganglia
/etc/gmond.conf gmond gmetad
rrdtool- database of stats
Apache2+ PHP5
Daemon one per node/LPAR Only one copy with the Web Server
Browser
PHP scripts
/etc/gmetad.conf
File accessNetwork
/etc/gmond.conf gmond
/etc/gmond.conf gmond
Web
1
2
3
1
1
Ganglia data flow and what goes where…

63 Monitoring Systems and POWER5/6 LPARs with Ganglia
Best Practices
Preferred setup Ganglia sampling intervals Ganglia default ports Shared Ethernet statistics Fibre Channel statistics Enhanced web interface
64 Monitoring Systems and POWER5/6 LPARs with Ganglia
Best Practices – Preferred Setup
Define each System p machine with all its LPARs as a separate cluster Use Unicast for network communication Define at least two LPARs per System p machine as gmond hosts for gmetad
– One would be sufficient, however, two is better for high availibility reasons
Define those two LPARs in /etc/gmetad.conf as the information brokers for that machine
From gmetad: Don’t poll the gmond hosts more frequently than every 15 secs Know upfront what time intervals to use for sampling (RRAs stanza in
/etc/gmetad.conf)– See next slides
Use my extensions for– Ethernet adapters– Fibre Channel adapters– Web interface

65 Monitoring Systems and POWER5/6 LPARs with Ganglia
Best Practices – Ganglia Sampling Intervals (1/6)
Important to know: The sampling interval is defined in /etc/gmetad.conf.
The "RRAs" stanza is used to defined individual settings. The sampling settings are global.
If no "RRAs" stanza is defined a default configuration is used. For historic reasons all values are specified in intervals of 15 seconds.

66 Monitoring Systems and POWER5/6 LPARs with Ganglia
Best Practices – Ganglia Sampling Intervals (2/6)
Example: Default settings in Ganglia
RRAs "RRA:AVERAGE:0.5:1:240" \ "RRA:AVERAGE:0.5:24:240" \ "RRA:AVERAGE:0.5:168:240" \ "RRA:AVERAGE:0.5:672:240" \ "RRA:AVERAGE:0.5:5760:370"
used for
Translation: display of
Take 240 samples at 1 × 15 seconds intervals hour Take 240 samples at 24 × 15 seconds (= 6 minutes) intervals day Take 240 samples at 168 × 15 seconds (= 42 minutes) intervals week Take 240 samples at 672 × 15 seconds (= 168 minutes) intervals month Take 370 samples at 5760 × 15 seconds (= 24 hours) intervals year

67 Monitoring Systems and POWER5/6 LPARs with Ganglia
Best Practices – Ganglia Sampling Intervals (3/6)
Example: 1-minute sampling for one year
RRAs "RRA:AVERAGE:0.5:4:525600"
Translation: Take 525600 samples at 4 × 15 seconds (= 1 minute) intervals 525600 = 60 (samples/hour) × 24 (hours) × 365 (days) × 1 (year)
68 Monitoring Systems and POWER5/6 LPARs with Ganglia
Best Practices – Ganglia Sampling Intervals (4/6)
Example: 1-minute sampling for 6 months, 5-minute sampling for 2 years
RRAs "RRA:AVERAGE:0.5:4:259200" \ "RRA:AVERAGE:0.5:20:210240"
Translation: Take 259200 samples at every 4 × 15 seconds (= 1 minute) intervals
– 259200 = 60 (samples/hour) × 24 (hours) × 30 (days) × 6 (months)
Take 210240 samples at every 20 × 15 seconds (= 5 minutes) intervals– 210240 = 12 (samples/hour) × 24 (hours) × 365 (days) × 2 (years)

69 Monitoring Systems and POWER5/6 LPARs with Ganglia
Best Practices – Ganglia Sampling Intervals (5/6)
Example: 15-second sampling for 1 day, 1-minute sampling for 2 months, 10-minute sampling for 1 year
RRAs "RRA:AVERAGE:0.5:1:5760" \ "RRA:AVERAGE:0.5:4:86400" \ "RRA:AVERAGE:0.5:40:52560"
Translation: Take 5760 samples at every 1 × 15 seconds intervals
– 5760 = 4 (samples/minute) 60 (samples/hour) × 24 (hours)
Take 86400 samples at every 4 × 15 seconds (= 1 minute) intervals– 86400 = 60 (samples/hour) × 24 (hours) × 30 (days) × 2 (months)
Take 52560 samples at every 40 × 15 seconds (= 10 minutes) intervals– 52560 = 6 (samples/hour) × 24 (hours) × 365 (days) × 1 (year)

70 Monitoring Systems and POWER5/6 LPARs with Ganglia
Best Practices – Ganglia Sampling Intervals (6/6)
Example: 1-minute sampling for 2 months, 5-minute sampling for 6 months, 15-minute sampling for 3 years
RRAs "RRA:AVERAGE:0.5:4:86400" \ "RRA:AVERAGE:0.5:20:51840" \ "RRA:AVERAGE:0.5:60:105120"
Translation: Take 86400 samples at every 4 × 15 seconds (= 1 minute) intervals
– 86400 = 60 (samples/hour) × 24 (hours) × 30 (days) × 2 (months)
Take 210240 samples at every 20 × 15 seconds (= 5 minutes) intervals– 51840 = 12 (samples/hour) × 24 (hours) × 30 (days) × 6 (month)
Take 105120 samples at every 60 × 15 seconds (= 15 minutes) intervals– 105120 = 4 (samples/hour) × 24 (hours) × 365 (days) × 3 (years)

71 Monitoring Systems and POWER5/6 LPARs with Ganglia
Best Practices – Default Ports
Ganglia by default uses the following ports:
8649The port gmond uses for
– Sending to other gmonds via UDP (udp_send_channel in /etc/gmond.conf)– Receiving from other gmonds via UDP (udp_receive_channel in /etc/gmond.conf)– Sending an XML description of the state of the cluster (tcp_accept_channel in
/etc/gmond.conf)
8651The port gmetad will answer requests for XML.
8652The port gmetad will answer queries for XML.This facility allows simple subtree and summation views of the XML tree.

72 Monitoring Systems and POWER5/6 LPARs with Ganglia
Best Practices – Shared Ethernet Statistics
Question: How to monitor SEA statistics on the VIO server ? The AIX libperfstat library seems not to report any statistics about Ethernet
adapters if there are no interfaces defined on that adapter. Only seldom interfaces are defined on SEAs. The AIX command ‘entstat’ however provides these statistics.
Solution: Extension through gmetric via a shell script Korn shell script ‘ent_adapter.sh’ Get it from http://www.perzl.org/ganglia/devicespecific.html Graphs will appear immediately for that specific host

73 Monitoring Systems and POWER5/6 LPARs with Ganglia
Best Practices – Fibre Channel Statistics
Question: How to monitor Fibre Channel statistics on the VIO server ? The AIX libperfstat library seems not to report any statistics about Fibre
Channel adapters if there are no disks attached to the adapter. Tapes, for instance, would be left out. The AIX command ‘fcstat’ however provides these statistics.
Solution: Extension through gmetric via a shell script Korn shell script ‘fcs_adapter.sh’ Get it from http://www.perzl.org/ganglia/devicespecific.html Graphs will appear immediately for that specific host

74 Monitoring Systems and POWER5/6 LPARs with Ganglia
Best Practices – Enhanced Web Interface (1/2)
Get it from:http://www.perzl.org/ganglia/webinterface.html
Includes the following extensions:
Jscalendar patch of Timothy D. Witham for selecting custom intervals for graph display.
Custom Graph Patch of Alex Balk.
Zoomable graphs–Adapted from the UC Berkeley Grid live Demo website.
–They implemented some nice graph zooming, i.e., when you click onto a single node metric graph or on one of the Grid overview graphs you get a nicely scaled bigger version of that graph.
75 Monitoring Systems and POWER5/6 LPARs with Ganglia
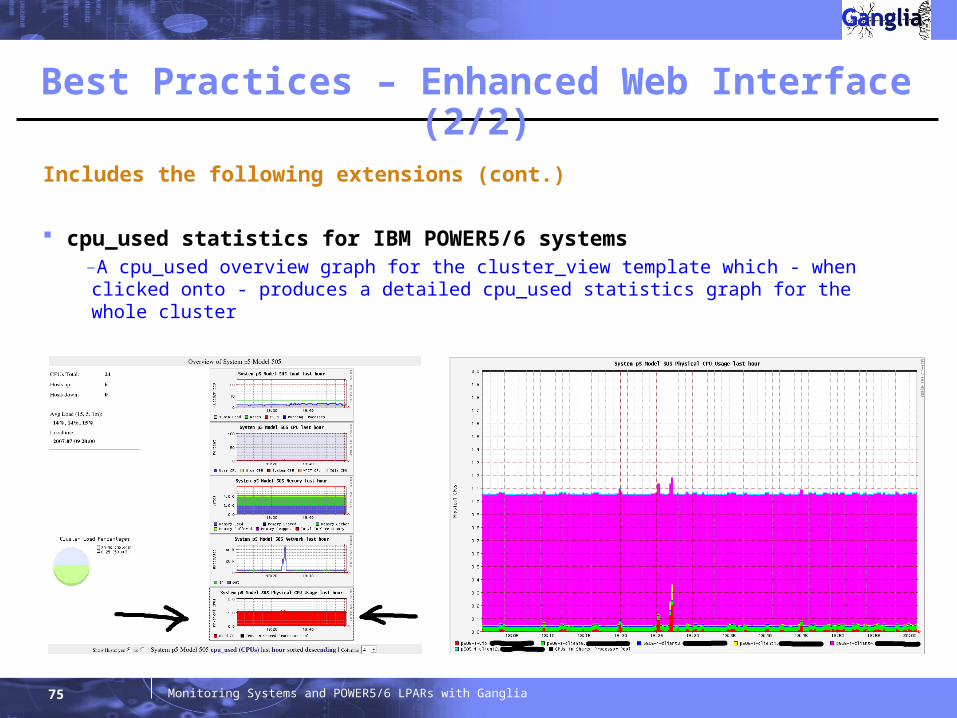
Best Practices – Enhanced Web Interface (2/2)
Includes the following extensions (cont.)
cpu_used statistics for IBM POWER5/6 systems–A cpu_used overview graph for the cluster_view template which - when clicked onto - produces a detailed cpu_used statistics graph for the whole cluster

Future additions / plans

77 Monitoring Systems and POWER5/6 LPARs with Ganglia
Future additions / plans
Try to incorporate the POWER5/6 additions into the Ganglia mainstream source code
Adapt the AIX and Linux on POWER metrics to POWER6 Provide a custom web interface tailored specifically to POWER5/6 Future updates on my personal web site:
– Update RPMs to newest versions– Provide RPMs for Apache + PHP on my AIX Open Source web site (very soon)

Discussion
79 Monitoring Systems and POWER5/6 LPARs with Ganglia
Ganglia advantages
Overview and major statistics available at one look with nice graphs Available on many platforms Widely used, many users and many different setups Global view (cluster/grid) and local view (single node) available Easily remote accessible through web interface Highly customizable through config files Shared Processor LPAR statistics available Monitored data is stored in Round-Robin Databases (RRDs), i.e., this information could
be easily passed on accounting too Fine granular statistics possible Different time interval views: hour, day, week, month, year or customizable Open Source (source code and binary RPMs for AIX and Linux on POWER) available Low risk and low cost Easily extendible
– through utility program gmetric
– through adapting the Ganglia source code (as shown in this presentation)
80 Monitoring Systems and POWER5/6 LPARs with Ganglia
Ganglia disadvantages
Not an official IBM tool No official support available Primarily a monitoring tool, not an accounting tool ‘‘Only‘‘ a monitoring (visualization) tool, no actions can be triggered AIX setup from scratch requires some work (building all prerequisite software),
although it is well documented– Normally not necessary by using my binary RPMs

Links

82 Monitoring Systems and POWER5/6 LPARs with Ganglia
Links (1/2)
Main Ganglia website– http://ganglia.info/
Ganglia Documentation– http://ganglia.info/docs/
Ganglia Source Code Download– http://ganglia.sourceforge.net/downloads.php
Ganglia POWER5/6 extensions and ready-to-run binaries (RPM files) as well as source code
– http://www.perzl.org/ganglia/
My personal AIX Open Source repository– http://www.perzl.org/aix/

83 Monitoring Systems and POWER5/6 LPARs with Ganglia
Links (2/2)
Ganglia Usage at Wikipedia– http://ganglia.wikimedia.org/
RRDTool homepage– http://oss.oetiker.ch/rrdtool/
Ganglia How-To on IBM AIX wiki site (written by Nigel Griffiths)– http://www.ibm.com/collaboration/wiki/display/WikiPtype/ganglia
Open Source with AIX on IBM AIX wiki site (written by Nigel Griffiths)– http://www.ibm.com/collaboration/wiki/display/WikiPtype/aixopen
IBM AIX wiki site:– http://www.ibm.com/collaboration/wiki/display/WikiPtype/Home
IBM Linux on POWER wiki site:– http://www.ibm.com/collaboration/wiki/display/LinuxP/Home

84 Monitoring Systems and POWER5/6 LPARs with Ganglia
Thank you for your attention !Thank you for your attention !
Questions ?

Backup Slides
Simple setup example

87 Monitoring Systems and POWER5/6 LPARs with Ganglia
1 Simple gmond install (1/2)
On all data nodes:
Install the gmond RPM file on each data node– rpm –Uvh ganglia-gmond-VVV.PPP.rpm– VVV.PPP is the version number and platform like:
• 3.0.5• aix5.1.ppc, aix5.3.ppc, suse.ppc64, redhat.ppc64
Edit the configuration file– /etc/gmond.conf
On Linux on POWER– need access to /proc/ppc64/lparcfg = root user only– So also set “setuid = no” depending on Linux distribution
On all data nodes
cluster { name = "unspecified" owner = "unspecified" latlong = "unspecified" url = "unspecified" }
cluster { name = "mycluster" owner = "unspecified" latlong = "unspecified" url = "unspecified" }
Cluster name

88 Monitoring Systems and POWER5/6 LPARs with Ganglia
1 Simple gmond install (2/2)
Use the gmond control script located in /etc to start gmond:– /etc/init.d/gmond start
• Linux (SUSE and Red Hat)– /etc/rc.d/init.d/gmond start
• AIX
These scripts also automatically start gmond when booting the system
All options are: – start– stop– restart– status
Easy to automate the install:Just a couple of files +the gmond.conf is the same on all nodes/LPARs
On all data nodes
89 Monitoring Systems and POWER5/6 LPARs with Ganglia
2 Simple gmetad - prerequisites (1/3)
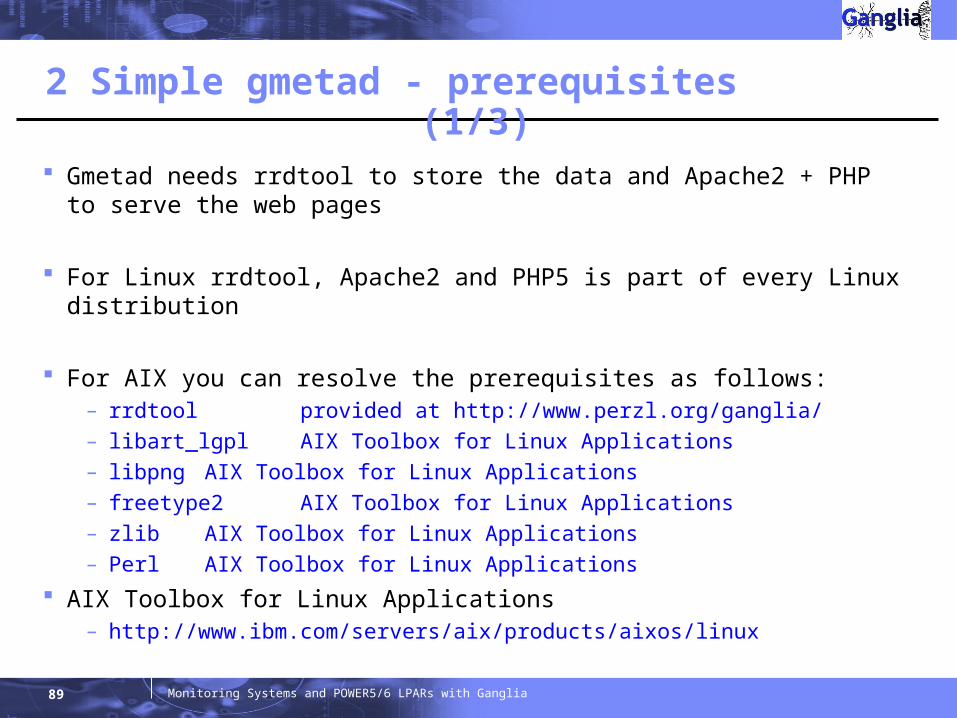
Gmetad needs rrdtool to store the data and Apache2 + PHP to serve the web pages
For Linux rrdtool, Apache2 and PHP5 is part of every Linux distribution
For AIX you can resolve the prerequisites as follows: – rrdtool provided at http://www.perzl.org/ganglia/ – libart_lgpl AIX Toolbox for Linux Applications– libpng AIX Toolbox for Linux Applications– freetype2 AIX Toolbox for Linux Applications– zlib AIX Toolbox for Linux Applications– Perl AIX Toolbox for Linux Applications
AIX Toolbox for Linux Applications– http://www.ibm.com/servers/aix/products/aixos/linux
90 Monitoring Systems and POWER5/6 LPARs with Ganglia
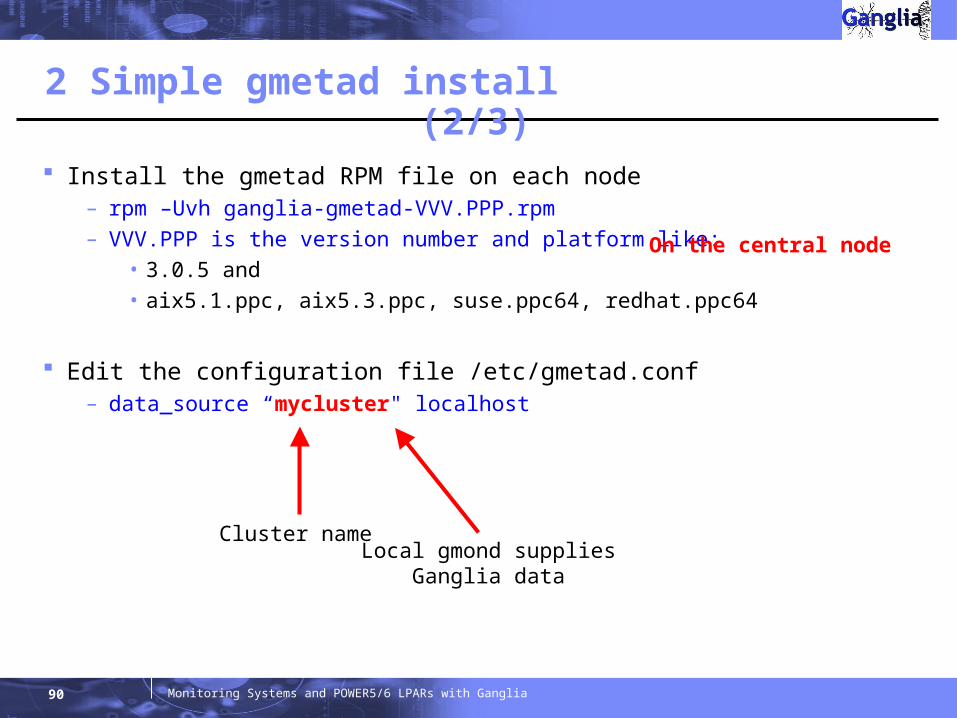
2 Simple gmetad install (2/3)
Install the gmetad RPM file on each node– rpm –Uvh ganglia-gmetad-VVV.PPP.rpm– VVV.PPP is the version number and platform like:
• 3.0.5 and• aix5.1.ppc, aix5.3.ppc, suse.ppc64, redhat.ppc64
Edit the configuration file /etc/gmetad.conf– data_source “mycluster" localhost
Cluster nameLocal gmond supplies
Ganglia data
On the central node

91 Monitoring Systems and POWER5/6 LPARs with Ganglia
2 Start gmetad (3 of 3)
Use the gmetad control script located in /etc to start gmetad:– /etc/init.d/gmetad start
• Linux (SUSE and Red Hat)– /etc/rc.d/init.d/gmetad start
• AIX
These scripts also automatically start gmetad when booting the system
All options are: – start– stop– restart– status
On the central node

92 Monitoring Systems and POWER5/6 LPARs with Ganglia
3 Ganglia Web Server front end setup (1/2)
Could use existing web server but we need PHP support– On AIX – we have only used Apache2 and PHP5 (see next foil)– On Linux use version included with the distribution
(Red Hat EL 4 & 5, SUSE SLES 9 & SLES 10)
Simple test of PHP if it works:– Create <web-server-directory>/phptest.php– Use browser to access this file– Should print out lots of interesting data
rpm –Uvh ganglia-web-3.0.5-1.noarch.rpm– “noarch” as this is PHP scripts only– may have to use the “--ignoreos” flag for installation– may have to move these files to your web server directory tree
• depends on if you are running AIX or Linux
<h1>PHP Test</h1> <?PHP phpinfo() ?>
On the central node

93 Monitoring Systems and POWER5/6 LPARs with Ganglia
For AIX you will not be able to find Apache2 and PHP5 with the required features:
– AIX CD-ROM or update download site – nope– AIX repositories (Bull or UCLA) – nope – AIX Toolbox for Linux Applications – nope– WAS – nope– IBM HTTP Server (Apache with add-ons) – nope
Get Apache + PHP from my personal website instead!– http://www.perzl.org/ganglia/– http://www.perzl.org/aix/
If you have to recompile your own Apache + PHP– Using latest GNU GCC compiler and latest libraries - it is actually easy– Nigel Griffiths wrote the details of how to do this on the AIX 5L Wiki at
• http://www.ibm.com/collaboration/wiki/display/WikiPtype/aixopen
On the central node
3 Ganglia Web Server front end setup (AIX) (2/2)