Monitoring Regional Trade Integration: The case of Africa Lelio Iapadre (University of L’Aquila...
27
Monitoring Regional Trade Integration: The case of Africa Lelio Iapadre (University of L’Aquila and UNU-CRIS) 4 th GARNET Annual Conference IFAD, Rome, 13 November 2009 Based on P. Lelio Iapadre and Francesca Luchetti, Trade Regionalisation and Openness in Africa, background paper for the European Report on Development
-
Upload
raymond-boyd -
Category
Documents
-
view
214 -
download
0
Transcript of Monitoring Regional Trade Integration: The case of Africa Lelio Iapadre (University of L’Aquila...

Monitoring Regional Trade Integration:
The case of AfricaLelio Iapadre
(University of L’Aquila and UNU-CRIS)4th GARNET Annual ConferenceIFAD, Rome, 13 November 2009
Based on P. Lelio Iapadre and Francesca Luchetti, Trade Regionalisation and Openness in Africa, background paper for the European Report on
Development

United Nations University - Comparative Regional Integration Studies - UNU-CRIS
The geographic scope of international integration
• National perspective– Openness to the rest of the world– Geographic diversification and concentration– The role of distance
• Regional perspective– Intra- and extra-regional integration
• Global perspective– Global integration as an average of national integration
indicators– Intrinsically global processes, without reference to
national borders

Regional Integration: Basic Concepts(UNU-CRIS, 2006 World Report on Regional Integration)
• Regional integration (a political definition):“the emergence of a governance level between the national and the global levels within the system of world governance, based on (regional) cooperative behaviour and the design of common policies and institutions by actors that traditionally belong(ed) to the national governance level”
• Regionalisation“a complex and multi-dimensional social transformation process, whereby the regional level is becoming a relevant space for many aspects of human behaviour and activities, driven by social and technological forces similar to those driving the globalisation process”

Regional trade integration
• Ex-ante measures:–Regional trade liberalisation
• Ex-post measures:–Trade regionalisation

Monitoring regional trade liberalisation
• Measurement needs– Measuring to what extent barriers to intra-
regional trade have actually been removed– WTO consistency of preferential integration
agreements• Barriers to intra-regional trade• Barriers to extra-regional trade
Monitoring regional trade liberalisation
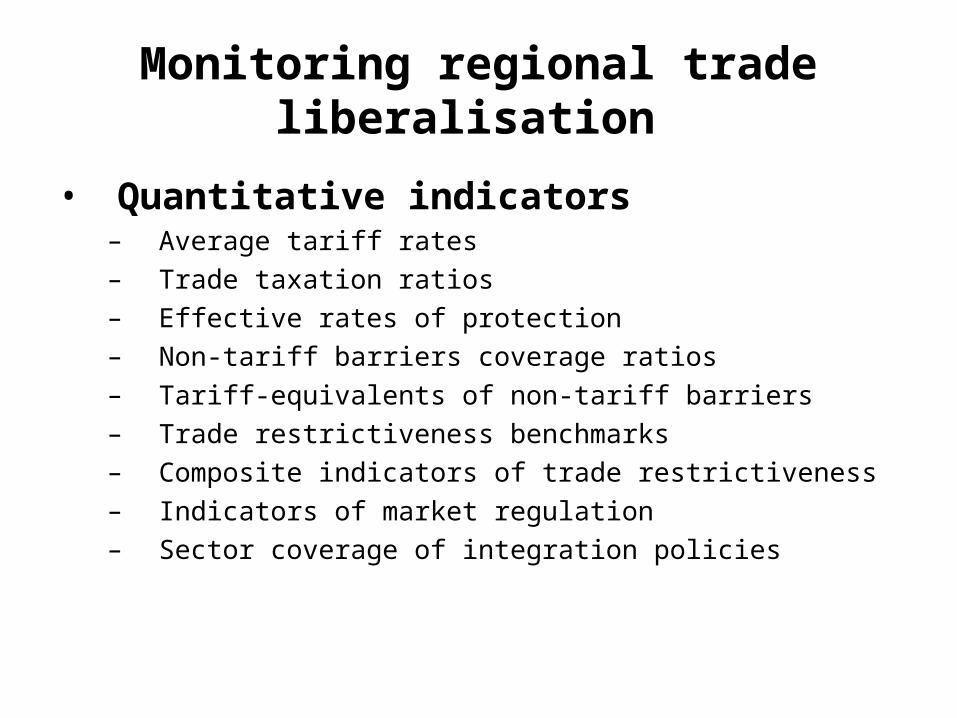
• Quantitative indicators– Average tariff rates– Trade taxation ratios– Effective rates of protection– Non-tariff barriers coverage ratios– Tariff-equivalents of non-tariff barriers– Trade restrictiveness benchmarks– Composite indicators of trade restrictiveness– Indicators of market regulation– Sector coverage of integration policies

Monitoring regional trade liberalisation
• Qualitative indicators– Harmonisation of regulatory regimes– Rules of origin (symmetry and simplicity)– Transparency of custom procedures– Non-discrimination in the treatment of intellectual property
rights– National treatment in investment regulations– Fairness of dispute-settlement procedures– Non-discrimination in government procurement– Harmonisation of competition rules
Monitoring trade regionalisation
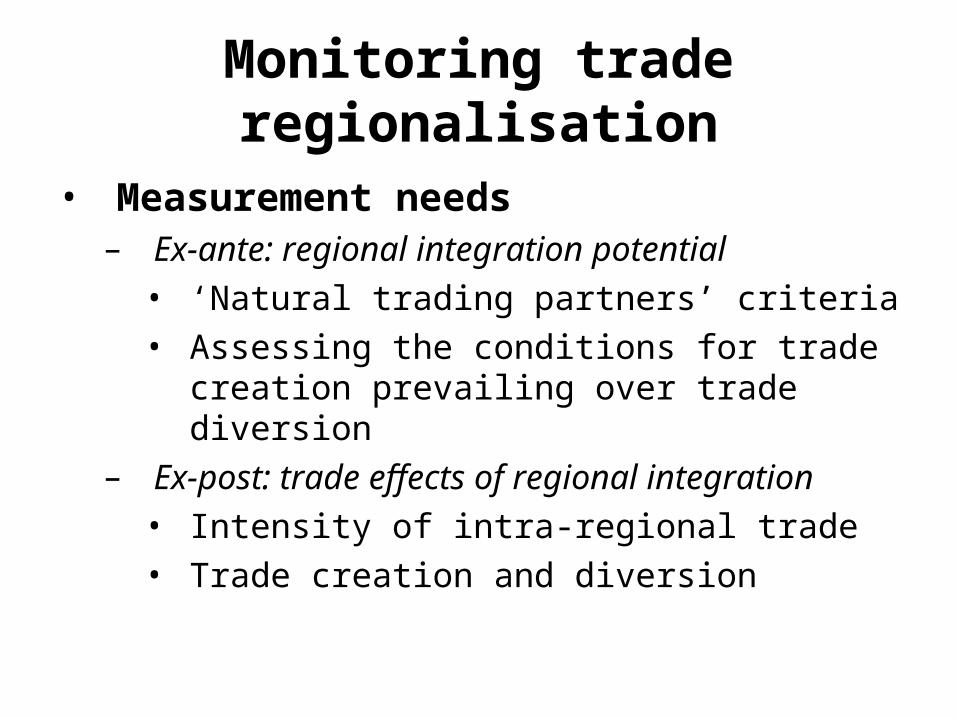
• Measurement needs– Ex-ante: regional integration potential• ‘Natural trading partners’ criteria• Assessing the conditions for trade creation
prevailing over trade diversion– Ex-post: trade effects of regional integration• Intensity of intra-regional trade• Trade creation and diversion

Monitoring trade regionalisation
• Statistical tools – Indicators of intra- and extra-regional trade
intensity– Network analysis of regional trade– Methods to assess the impact of regional trade
integration • Gravity models• Computable general equilibrium models

Indicators of trade regionalisation: the case of Africa
• Regional integration is often considered an important element of development strategies in Africa
• Welfare and growth effects of regional integration policies pass through their effects on trade
• Traditional indicators of intra-regional trade intensity can be misleading
• A correct measurement of intra-regional trade intensity is essential to estimate the impact of policies and improve the specification of gravity models

African regions
• Six non-overlapping African regions– Arab Maghreb Union (AMU)– North East Africa– Economic Community of West African States
(ECOWAS)– Central Africa– East African Community (EAC)– Southern Africa

Trade shares
• Intra-regional trade share:Srr = trr / trw
0 ≤ Srr ≤ 1
where: trr = intra-regional trade of region r;
trw= total trade of region r.
• Extra-regional trade share: 1 – Srr

Intra-regional trade shares in Africa are very low
0%
2%
4%
6%
8%
10%
12%
14%
16%
AMU CENTRAL AFRICA EAC ECOWAS NORTH EAST AFRICA SOUTHERN AFRICA
INTRA - REGIONAL TRADE SHARE
1990 1995 2000 2005 2008
Source: Based on IMF - DOTS data

Problems of trade shares
Cross-region comparisons
Time-series analysis for the same region
Sensitivity to the number of countries(given the size of the region)
Regions with a higher number of countries tend to show a higher intra-regional trade share
An increase in the number of member countries increases a region’s intra-regional trade share
Sensitivity to the size of the region(given the number of countries)
Larger regions (in terms of total trade) tend to show a higher intra-regional trade share
Pro-cyclical distortion

Trade intensity indices• Intra-regional trade intensity
Ir = Srr / Wr = (trr / trw) / (twr / tww )where: Wr = region r’s weight in world trade
twr = world trade with region r = trw
tww = world trade• Extra-regional trade intensity
Er = (1 – Srr) / (1 – Wr)• Geographical neutrality (no preferences)
Ir = 1 ↔ Er = 1

Intra-regional trade shares in Africa are very high in proportion to the regions’ shares of world trade.
0
20
40
60
80
100
120
140
160
180
AMU CENTRAL AFRICA EAC ECOWAS NORTH EAST AFRICA SOUTHERN AFRICA
INTRA-REGIONAL TRADE INTENSITY INDEX
1990 1995 2000 2005 2008Source: Based on IMF-DOTS data.
Problems of trade intensity indices
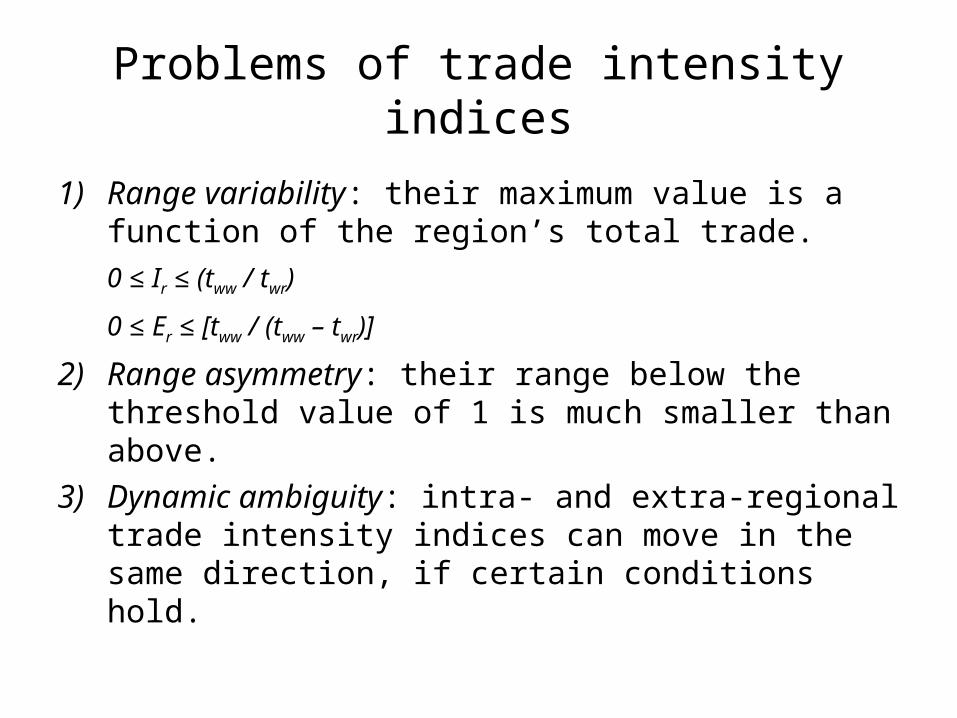
1) Range variability: their maximum value is a function of the region’s total trade.0 ≤ Ir ≤ (tww / twr)
0 ≤ Er ≤ [tww / (tww – twr)]
2) Range asymmetry: their range below the threshold value of 1 is much smaller than above.
3) Dynamic ambiguity: intra- and extra-regional trade intensity indices can move in the same direction, if certain conditions hold.

A possible solution: revealed trade preference indices
• Regional trade introversion indexJr = (HIr – HEr) / (HIr + HEr)-1 ≤ Jr ≤ 1
where:HIr = Srr/Vr ≡ (trr/trw)/(tor/tow)HEr = (1 – Srr) /(1 – Vr)tor = region’s r extra-regional trade;
tow = total trade of the rest of the world.• Regional trade extroversion index
Fr = (HEr – HIr) / (HEr + HIr) = – Jr
-1 ≤ Fr ≤ 1• Geographical neutrality (no preferences)
Jr = 0 ↔ Fr = 0• Bi-regional symmetry: for i = 1, 2
J1 = J2 and F1 = F2

Regional trade introversion is very high in Africa
0.0
0.1
0.2
0.3
0.4
0.5
0.6
0.7
0.8
0.9
1.0
AMU NORTH EAST AFRICA ECOWAS CENTRAL AFRICA EAC SOUTHERN AFRICA
Regional trade introversion
1990
1995
2000
2005
2007
2008
Based on IMF-DOTS data.

1990 AMUNORTH EAST
AFRICAECOWAS
CENTRAL AFRICA
EACSOUTHERN
AFRICAEUROPEAN
UNION
REST OF THE
WORLDAMU 0.46NORTH EAST AFRICA 0.29 0.66ECOWAS -0.33 -0.92 0.89CENTRAL AFRICA 0.56 -0.84 0.65 0.89EAC -0.62 0.70 -0.83 -1.00 0.98SOUTHERN AFRICA -0.75 -0.63 -0.27 -0.53 0.50 0.76EUROPEAN UNION 0.49 0.09 0.09 0.35 0.11 0.10 0.67REST OF THE WORLD -0.54 -0.13 -0.27 -0.49 -0.35 -0.20 -0.68 0.70
2000 AMUNORTH EAST
AFRICAECOWAS
CENTRAL AFRICA
EACSOUTHERN
AFRICAEUROPEAN
UNION
REST OF THE
WORLDAMU 0.63NORTH EAST AFRICA 0.18 0.71ECOWAS 0.17 -0.62 0.92CENTRAL AFRICA -0.04 -0.77 0.78 0.86EAC -0.86 0.83 -0.18 -0.72 0.99SOUTHERN AFRICA -0.61 -0.48 0.29 0.21 0.84 0.87EUROPEAN UNION 0.60 0.04 0.02 0.09 -0.09 0.04 0.75REST OF THE WORLD -0.65 -0.09 -0.24 -0.19 -0.32 -0.22 -0.75 0.76
2008 AMUNORTH EAST
AFRICAECOWAS
CENTRAL AFRICA
EACSOUTHERN
AFRICAEUROPEAN
UNION
REST OF THE
WORLDAMU 0.49NORTH EAST AFRICA 0.25 0.71ECOWAS -0.27 -0.73 0.88CENTRAL AFRICA -0.25 -0.71 0.60 0.77EAC -0.68 0.69 -0.31 -0.73 0.99SOUTHERN AFRICA -0.64 -0.30 0.32 -0.18 0.80 0.87EUROPEAN UNION 0.48 -0.17 -0.13 -0.07 -0.31 -0.14 0.74REST OF THE WORLD -0.52 0.09 -0.10 -0.01 -0.17 -0.13 -0.74 0.75Source: based on IMF DOTS data.
Table 1 - REVEALED TRADE PREFERENCE INDEX

Geographic direction of regional trade
• Another important aspect of trade regionalisation is the geographic diversification of intra-regional trade flows.
• If the distribution of intra-regional trade flows were proportional to the trade size of regional partners (neutrality), this could reveal that distance-related intra-regional barriers do not affect the direction of bilateral trade flows.
• Intra-regional geographic neutrality index (IRGNIi):IRGNIi = 1 – Σj≠i|ISij – IVij| /2
where:ISij = partner j’s share of region i’s intra-regional trade;IVij = partner j’s share of region i’s total extra-regional trade.

0.0
0.1
0.2
0.3
0.4
0.5
0.6
0.7
0.8
0.9
AMU NORTH EAST AFRICA ECOWAS CENTRAL AFRICA EAC SOUTHERN AFRICA
GEOGRAPHIC NEUTRALITY OF INTRA-REGIONAL TRADE
1990 2000 2008Source: based on IMF DOTS data.Source: Based on IMF DOTS data.

Regional trade openness
• A region’s relative degree of openness (Oi) can be measured by its trade-to-GDP ratio relative to the world average trade-to-GDP ratio:
Oi = (ti./yi)/(T/Y)where:ti. = region i’s total trade.T = world trade.yi = region i’s gross domestic product (GDP)Y = world GDP.
• Symmetric indicator of relative trade openness (SOi): SOi = {(ti./yi) – [(T – ti.)/(Y – yi)]} /{(ti./yi) + [(T – ti.)/(Y – yi)]}–1 ≤ SOi ≤ 1

The degree of trade openness of African RIAs is relatively low, notwithstanding the small size of their economies.
-0.40
-0.30
-0.20
-0.10
0.00
0.10
0.20
0.30
0.40
AMU CENTRAL AFRICA EAC ECOWAS NORTH EAST AFRICA SOUTHERN AFRICA
RELATIVE OPENNESS (Symmetric indicators)
1990 1995 2000 2005 2008
Source: Based on IMF-DOTS data

Raw materials and Africa’s trade
0
20
40
60
80
100
120
140
160
0
0.5
1
1.5
2
2.5
3
3.5
1999 2000 2001 2002 2003 2004 2005 2006 2007
Africa's shares of world exports
Export prices of primary commodities (2005 = 100, right)
Africa's share of world manufacture exports (left)
Africa's share of world merchandise exports (left)

Conclusions
• Trade regionalisation in Africa is not low• Regional trade introversion is very strong, even in
comparison with other RIAs among developing countries
• This is due to their very limited capabilities in extra-regional trade (domestic and external barriers) rather than to the process of regional integration
• Trade introversion is falling in some African regions– Increase in African inter-regional trade intensity in the ‘90s– Increase in trade intensity with the rest of the world, but
not with the EU

Conclusions
• Africa’s world export share has been sustained by sales of raw materials to emerging countries
• But its share of world manufacturing exports is still very low and has been declining in the last few years
• Regional integration policies can be very important to promote sustainable development in Africa
• Their success will, however, be measured more by their ability to create the necessary infrastructure for a more effective integration of African countries into world markets, than on their effect on intra-regional trade.