Monitoring Public Health Nutrition in...
35
Monitoring Public Health Nutrition in Europe; Nutritional indicators and determinants of health status (SI2.291742) Final Technical Report October 2003 CO-ORDINATING CENTRES: Unit for Preventive Nutrition, Department of Biosciences at NOVUM, Karolinska Institutet S 141 57 Huddinge, SWEDEN School of Health and Life Sciences, Department of Nutrition and Dietetics, 150 Stamford Street London SE1 9NN, UNITED KINGDOM
Transcript of Monitoring Public Health Nutrition in...

Monitoring Public Health Nutrition in Europe;
Nutritional indicators and determinants of health status
(SI2.291742)
Final Technical Report October 2003
CO-ORDINATING CENTRES: Unit for Preventive Nutrition, Department of Biosciences at NOVUM, Karolinska Institutet S 141 57 Huddinge, SWEDEN
School of Health and Life Sciences, Department of Nutrition and Dietetics, 150 Stamford Street London SE1 9NN, UNITED KINGDOM

Monitoring Public Health Nutrition in Europe
Monitoring Public Health Nutrition in Europe; SI2.291742 - Final Technical Report Nutritional indicators and determinants of health status EXECUTIVE SUMMARY For the majority of European adults, who neither smoke nor drink excessively, what they eat and how physically active they are, are the most significant controllable risk factors affecting their long-term health. Public Health Nutrition (PHN) focuses on the promotion of good health through healthy food habits and a physically active lifestyle and the prevention of related illness in the population. However, PHN includes factors such as socio-economic, demographic and anthropometric factors and other factors related to nutritional status and the promotion of healthy habits. Specific indicators such as breast-feeding initiation and duration, total alcohol intake and drinking pattern, physical activity level and pattern and aerobic fitness have to be considered in a PHN context. The present project, Monitoring Public Health Nutrition in Europe, was therefore necessary to cover the topic as a whole, and specifically, to create a “user-window in nutrition” within the Health Monitoring System. The original project aims, reformulated during the project period to better correspond to the current situation in the Health Monitoring Program, were as follows;
1. To develop a theoretical framework for the selection and prioritization of indicators for monitoring Public Health Nutrition;
2. To identify indicators relevant to the monitoring of Public Health Nutrition; 3. To examine the nutritional aspects and proposals another monitoring projects; 4. To consider other novel proposals for monitoring Public Health Nutrition; 5. To integrate these into a recommended list of indicators for Public Health Nutrition; 6. To integrate the surveillance system into training and educational systems, in particular
the Program for the European Masters in Public Health Nutrition.
Seven Primary Categories (PC) for investigation were identified at a Plenary Meeting in Luxembourg, October 2000. These were:
PC 1. Health promotion PC 2. Food and nutrient intake, including breastfeeding and alcohol PC 3. Nutritional status and physical activity habits and fitness PC 4. Socio-demographic factors PC 5. Inequality PC 6. Genetic factors and interactions PC 7. Life stages and vulnerable/critical periods
Three Working Parties provided useful comments on the prioritizing of the many indicators. These comments were then fed to the co-ordinators in the Executive Committee, who further developed a prioritization scheme. The Report Committee took responsibility for preparing the report. Meanwhile experiences were presented and discussed at several international meetings. Information was also disseminated through publications and newsletters, and through training at Master’s and PhD levels over Europe. The information gathered on possible indicators and related operational measures, are here described on next page, by Primary Category. In most cases, operational measures can be defined in detail from their generic indicators. However, in some instances the level of detail of these corresponds to such an extent that it is difficult to make a distinction, such is the case for alcohol. Standardized methods for data collection are also given in the Report. Recommendations for indicators for monitoring PHN in the EU are:
2

Monitoring Public Health Nutrition in Europe
Indicator Operational measure
Health promotion Nutrition policy A Nutrition Policy with specific recommendations is set down in national or Government
legislation. Nutritional fortification A unified practice of food fortification and monitoring of the incidence of related diseases
impact, efficacy and side effects across the European Union. Sociodemographic/economic Age Percentage of population over the age of 71 years. Education Percentage of population with only elementary education and below. Occupation Percentage of the adult population in manual occupations. Household income Percentage of households with a total income below 50% of the median income of the
country. Unemployment Percentage of the population that have been unemployed for more than 12 months. Food and nutrient intake Consumption /Availability of vegetables (excl. potatoes and vegetable juice)
Average per capita adult intake of less than 300g/day
Consumption /Availability of fruit (excl fruit juice) Average per capita adult intake of less than 100g/day Consumption /Availability of fish Diets that contain less than 200g of fatty fish a week Saturated fatty acid content of the typical diet Average diet with a saturated fatty acid content of more than 10% of energy intake Consumption /Availability of meat and meat products
Average per capita adult intake of more than 80g red meat/day
Poly-unsaturated fatty acid content of the typical diet
Average diet with less than 7-8% of energy from PUFA
Mono-unsaturated fatty acid content of the typical diet
Average diet with low MUFA
NSP content of the typical diet Average diet with less than 25g/d Vitamin content of the typical diet Diet with levels of Vit C, D, E, folate and carotenoids below recommended levels Mineral content of the typical diet Diet with levels of Fe, I, Ca and Se below recommended levels Breastfeeding (bf) Initiation Total and exclusive bf at birth, i.e. throughout the first 48 hrs of age Duration Total breastfeeding at 6 months of age (can be collected during routine check-up close to 6
months, giving the range of data collection) Quality Exclusive breastfeeding at 6 months of age (can be collected during routine check-up close
to 6 months, giving the range of data collection) Alcohol Total consumption Total alcohol consumption per capita per beverage category Abstainers The share of abstainers in the total population
The share of heavy drinkers in the total population The share of the total alcohol consumption consumed as an intoxicant The frequency of heavy drinking occasions (binge drinking)
Drinking Pattern
The share of total alcohol consumption consumed with meals Nutrient status Carotenoid status Retinol and total plasma carotenoids levels of a representative sample of the population, in
the routine nutritional surveys. Age-gender specific cut-off points to be determined Fatty acid profile Total plasma cholesterol and cholesterol fractions, fatty acid cholesterol esters levels of a
representative sample of the population in the routine nutritional surveys. Age-gender specific cut-off points to be determined
Folate status Erythrocyte folate levels of a representative sample of the population in the routine nutritional surveys. Age-gender specific cut-off points to be determined
Selenium status Plasma selenium levels of a representative sample of the population in the routine nutritional surveys. Age-gender specific cut-off points to be determined
Iron status Haemoglobin, serum ferritin and serum transferrin receptor using appropriate cut off points by age and gender
Vitamin D status Circulating levels of 25-hydroxy vitamin D 3 provide the most appropriate measure of vitamin D status
Anthropometry Body composition (BMI) Height and weight, Waist/hip ratio, Sagittal abdominal diameter Physical activity and Fitness Level The total amount of activity expressed either as activity energy expenditure or physical
activity level (PAL), assessed using the Int Phys Activity Questionnaire (IPAQ) Pattern Time (mins/day or week) spent at health enhancing physical activity level (IPAQ) Inactivity Time (mins/day or week) spent sitting (IPAQ) Determinants Environmental determinants for physical activity Fitness Aerobic power, assessed using the UKK Walk Test 2 km, and UKK Fitness Test Battery
3

Monitoring Public Health Nutrition in Europe
CONTENTS OF THE FINAL REPORT EXECUTIVE SUMMARY................................................................................................................2 CONTENTS OF THE FINAL REPORT ........................................................................................4 BACKGROUND, AIMS AND THE PROJECT ACTIVITIES ....................................................6
The Health Monitoring System (HMS) ...........................................................................................6 Public Health Nutrition ....................................................................................................................6 The Project .......................................................................................................................................6 The original Project Aims ................................................................................................................7 The Project Proposal ........................................................................................................................7 The delay and its consequences .......................................................................................................7 The further Development of the Project Aims.................................................................................8 The revised Project Aims.................................................................................................................8 Further Project Work .......................................................................................................................9
OBJECTIVES AND METHODS ...................................................................................................11 General Considerations ..................................................................................................................11 Objectives.......................................................................................................................................11 Methods..........................................................................................................................................12 Defining Indicators ........................................................................................................................12 Complementary Projects ................................................................................................................14 Prioritization of Generic Indicators................................................................................................14 Comparability of Measures............................................................................................................16
RESULTS .........................................................................................................................................17 Health Promotion (PC 1)................................................................................................................17 Food and Nutrient intake (PC 2) ....................................................................................................17 The DAFNE Project.......................................................................................................................18 Derivations of estimates of nutrient intake ....................................................................................19 Alcohol (PC 2) ...............................................................................................................................20 Breastfeeding (PC 2)......................................................................................................................21 Nutritional Status (PC 3)................................................................................................................21 Anthropometry (PC 3) ...................................................................................................................22 Physical Activity (PC 3) ................................................................................................................23 Health-related Fitness (PC3)..........................................................................................................23 Socio-demographic Factors (PC 4) ................................................................................................24 Inequality (PC 5)............................................................................................................................25 Availability of Prioritized Indicators .............................................................................................25 Table 2. Availability of prioritized indicators in participating countries.......................................26
INTEGRATION AND DISSEMINATION ...................................................................................27 Training Programme ......................................................................................................................27 Dissemination.................................................................................................................................27
RECOMMENDATIONS.................................................................................................................28 COMPARISON OF RECOMMENDATIONS .............................................................................30 STANDARDIZED METHODS FOR COLLECTION.................................................................31
Blood Samples ...............................................................................................................................31 Anthropometry ...............................................................................................................................31 Dietary Intake.................................................................................................................................31 Alcohol...........................................................................................................................................32 Physical Activity ............................................................................................................................32 Aerobic Fitness ..............................................................................................................................32
CONCLUSIONS ..............................................................................................................................33 User Window in Nutrition..............................................................................................................34
ACKNOWLEDGEMENTS.............................................................................................................34
4
Monitoring Public Health Nutrition in Europe
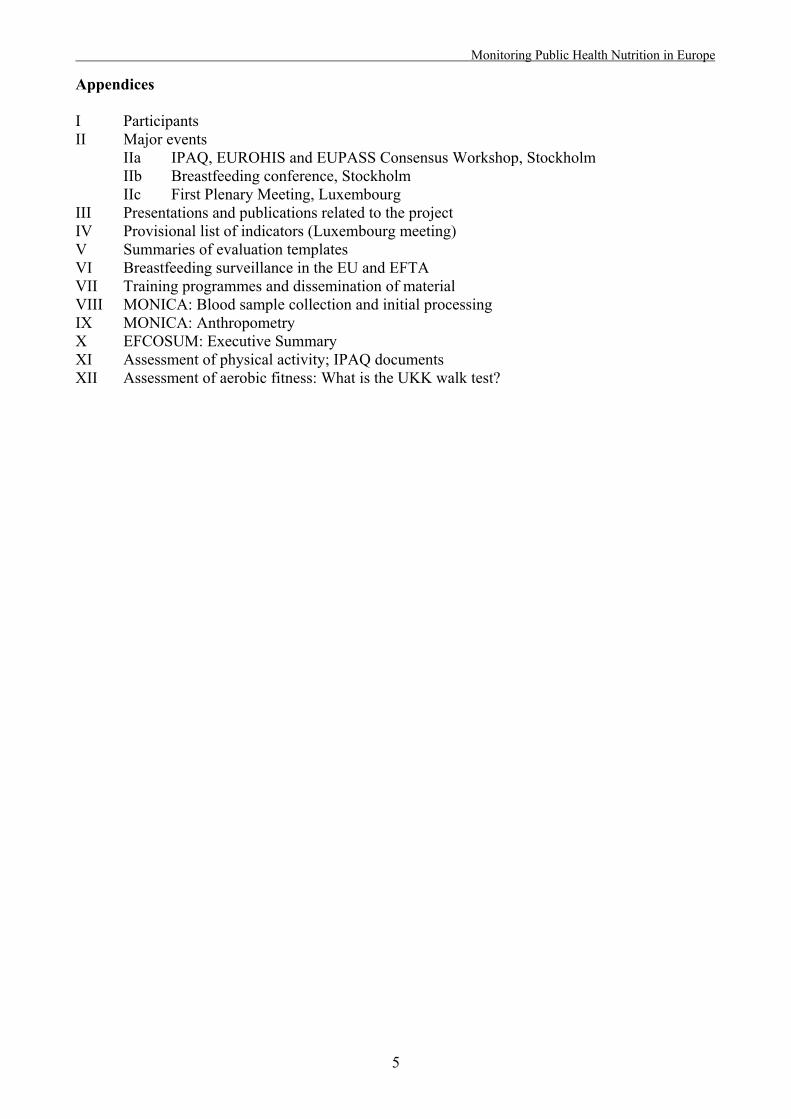
Appendices I Participants II Major events
IIa IPAQ, EUROHIS and EUPASS Consensus Workshop, Stockholm IIb Breastfeeding conference, Stockholm IIc First Plenary Meeting, Luxembourg
III Presentations and publications related to the project IV Provisional list of indicators (Luxembourg meeting) V Summaries of evaluation templates VI Breastfeeding surveillance in the EU and EFTA VII Training programmes and dissemination of material VIII MONICA: Blood sample collection and initial processing IX MONICA: Anthropometry X EFCOSUM: Executive Summary XI Assessment of physical activity; IPAQ documents XII Assessment of aerobic fitness: What is the UKK walk test?
5

Monitoring Public Health Nutrition in Europe
BACKGROUND, AIMS AND THE PROJECT ACTIVITIES The Health Monitoring System (HMS) The present project is part of the development of the European Union (EU) Programme on Health Monitoring, initiated 1996/97 during the previous Public Health Programme period, the purpose of which has been to establish a platform for a community Health Monitoring System (HMS). Co-ordinator is the ECHI (European Core Health Indicator) project. This monitoring system will allow for the measurement of health status, trends and determinants throughout the community. The first general objective of the Public Health Directorate is, as defined in the current Public Health Programme (Programme of Community action in the field of public health 2003 to 2008), to improve information and knowledge for the development of Public Health. A concept paper published in January 2002 in health information states: 'the success of the community health information and knowledge system depends on the definition of clear and attainable aims'. It follows from this that clear definitions of indicators of health are initially needed and these should be consistent across member states. The main purpose of the Health Monitoring Programme (HMP) has been to gather nationally available data on the health of the populations of its member states and to analyze and present these data in a way that allows maximum comparison across member states. International strategies to tackle major public health problems may thereby also be facilitated. Public Health Nutrition For the majority of European adults, who neither smoke nor drink excessively, what they eat and how physically active they are, are the most significant controllable risk factors affecting their long-term health. Whilst nutrition and physical activity are generally separated by tradition in academic structure, they are invariably linked in the public health context, in health care and in daily life. Public Health Nutrition (PHN) focuses on the promotion of good health through healthy food habits and a physically active lifestyle and the prevention of related illness in the population. The Project The present project, Monitoring Public Health Nutrition in Europe, was initiated in 1998 by staff members within the Commission, from the recognition of the importance of diet, nutrition and physical activity for health status. Project initiatives had already at that time been taken in the area of food intake and physical activity (EFCOSUM and EUPASS, respectively, both of which received support from 1999). However, good health through food habits and a physically active lifestyle, i.e. Public Health Nutrition, covers a much broader spectrum than food intake and physical activity/exercise measures alone, and include factors such as socio-economic, demographic and anthropometric factors and other factors related to nutritional status and the promotion of healthy habits. Specific indicators such as breast-feeding initiation and duration, total alcohol intake and drinking pattern, and aerobic fitness had to be considered in a public Health Nutrition context. A third project within the Health Monitoring Project was therefore necessary to cover the topic as a whole, and specifically, to create a “user-window in nutrition” within the Health Monitoring System.
6

Monitoring Public Health Nutrition in Europe
The original Project Aims Initiation of any possible project at that time had to consider the situation within the HMP, which in itself was just in earliest phases. After a series of discussions at various meetings among European Public Health Nutritionists during the academic year 1998/99, a core group of scientists came together in Stockholm at the end of the summer 1999, to formulate the project aims of such a project and prepare a project proposal. The original aims suggested for the project were:
- To establish the utility of a European surveillance system on indicators and determinants of health status;
- To select a useful set of indicators and to collect available, reliable and relevant data on these indicators;
- To design a European surveillance system according to the above, with emphasis on European aspects, such as integration and comparability and national and regional handling of collected data;
- To integrate and coordinate the new system with the other systems under development in parallel in the Commission Monitoring Programme;
- To communicate the importance and efficacy of the above surveillance system towards policy makers at European, national and regional levels, as well as actors in health promotion, implementation and evaluation at national and regional levels.
- To integrate the surveillance system into training and educational systems, in particular the programme for the European Masters in Public Health Nutrition.
The Project Proposal A project group was formed, an organization was agreed upon and a proposal was submitted by January 15th, 2000. The handling of the proposal in the Commission was then delayed, beyond the control of the project group, due to administrative and political obstacles within the Commission. The project organization was repeatedly informed all through the year 2000 that the possibilities for the project to get funding were very limited, if not negligible. Therefore, the decision to fund the project communicated to the project organiser by the end of 2000 was entirely unexpected. A contract was then signed in January, more than one year after submission and returned to the project co-ordinator and the university administration in February 2001. The delay and its consequences After more than a year of unplanned inactivity, the project group had more or less disintegrated, not in the least due to the many negative signals about the possible funding and the future of the project. Important project partners had meanwhile accepted other commitments and had to reconsider their participation in the project. Some of them were heavily involved in the preparation for the World Nutrition Congress in Vienna, August 2001. However, the Executive Committee was able to attract all of the original partners again. However, a few modifications in the early project plan had to be made:
a) Two project meetings could be held during the spring of 2001, namely the Expert Meeting on Breast-feeding (as was originally planned) and the Expert Meeting on Physical Activity (instead of the first plenary meeting); and
b) The Plenary Meeting planned for Vienna in August was postponed to October. It was moved to Luxembourg, to make it possible for the staff-members of the Commission to participate, as important developments of the project aims and project plan had to be discussed.
7

Monitoring Public Health Nutrition in Europe
Appendix I shows in summary the key participants at each of the major meetings. An Executive Committee Meeting was held in Stockholm, in conjunction with the EU Basics Course in Public Health Nutrition in June, 2001, with representative from the Commission, to discuss a revision of the outline in light of the progress of the contributors to the Monitoring Programme. The meeting identified some needs to be considered at the forthcoming plenary meeting with the Working Group in Luxembourg in October. The kick-off in October, 2001, for the major strand of the project thereby occurred two years (!) after the project was designed and the project aims were formulated and agreed. It has to be emphasized that this delay was to a great extent due the handling of the proposal in the Commission. This also partly explains why the work in later phases of the project with the project report was delayed. The further Development of the Project Aims In October, at the Plenary Meeting in Luxembourg, the Executive Committee and the Working Group had to re-consider the current situation in the Health Monitoring Project which, by that time, had developed substantially. This meant that the Working Group had to discuss and rewrite the project aims and the project plan accordingly, together with the staff members of the Commission, but without loosing the original intentions. In fact, it was stated already in the Grant Agreement (page 10), that “the project will, above all, be subject to continuous assessment during the ongoing integrative work with other monitoring projects running in parallel”, i.e. the project organization had to be flexible and had to adapt to the growth and the continuous development of the HMP. Above all, the project aims had to be reconsidered. It was decided that number 2 and 6 of the original project aims, listed in a previous paragraph, were both still fully relevant. Number 1 was to a certain extent out-of-date, as a number of other projects, such as the EUPASS project (in which our project was represented), and EFCOSUM, had convincingly demonstrated the utility of a European surveillance system on some Public Health Nutrition indicators and determinants of health status. However, even if emphasis should not be put on this aim as originally intended, this aim should remain as an important component in the revised aims. Number 3, 4 and 5 were found to be even more pre-mature, as an insight had emerged within the Health Monitoring Programme that the establishment of a consistent, permanent and coherent Community system of Public Health indicators, was a most complex process. Such a process had to develop with all partners in a co-ordinated and integrated manner within the HMP as a whole, and not as an isolated process only in the field of Public Health Nutrition. Such a process should take place at a later phase of the development, when all indicators were defined, priorities in between them had been made and other crucial circumstances for a European system had been identified. Co-ordination with other DG.s within the Commission had also to occur. These circumstances were not obvious to the participants in the HMP when the project aims of the Public Health Nutrition project were discussed two years before, i.e. 1999. Thus, it was not any longer up to any individual project to establish its own system for data collection. The revised Project Aims The project group decided, together with representatives for the Commission, to develop and up-date the project aims and reformulate them to better correspond to the current situation in the HMP.
8

Monitoring Public Health Nutrition in Europe
The original aims remained as the main components of the programme and the overarching aims were as follows;
7. To develop a theoretical framework for the selection and prioritization of indicators for monitoring Public Health Nutrition;
8. To identify indicators relevant to the monitoring of Public Health Nutrition; 9. To examine the nutritional aspects and proposals another monitoring projects; 10. To consider other novel proposals for monitoring Public Health Nutrition; 11. To integrate these into a recommended list of indicators for Public Health Nutrition; 12. To integrate the surveillance system into training and educational systems, in particular
the programme for the European Masters in Public Health Nutrition.
The EURODIET project which was initiated in October 1998, had the main aim of contributing towards a co-ordinated European Union (EU) and member state health promotion program on nutrition, diet, and healthy lifestyles, by establishing a network, strategy and action plan for the development of European dietary guidelines. It was commissioned in recognition that the considerable body of scientific evidence on healthy nutrition and lifestyles needs to inform health policy, and to define practical guidelines for diet-related disease prevention/health promotion strategies. The main outcomes of the EURODIET project in terms of its relevance for public health nutrition, as described in the following paragraph, also led to a further revision of the aim and objectives or the current project.
The EURODIET-project had identified, as reported in the Journal Public Health Nutrition in special issues in April, 2001, three areas to be considered specifically in future development of promotion of health food habits, namely breast-feeding, fruit and vegetable consumption and physical activity, which the group also had to take into account. These three areas, at least breast-feeding and physical activity, had to be specifically dealt with, as no other project within the HMP had considered them fully. The EUPASS project recommended further exploration of the International Physical Activity Questionnaire (IPAQ) in their report. This was the reason for two project strands, in breast-feeding and physical activity, to start already during the spring of 2001 before the major strand of the project. Further Project Work The work within the present project then developed according to the revised plan. The Working Parties, organized as will be described in the following Section, then provided useful comments on the prioritizing of the indicators. These were then fed to the co-ordinators who further developed the prioritization scheme. The Report Committee took responsibility for preparing the report. Meanwhile experiences were presented and discussed at several international meetings (Appendix II). Information was also disseminated through publications and newsletters, and through training at Master and PhD level, also at European level. The Executive Committee had regular contacts, usually as telephone conferences, but had also meetings, according to the original project plan, in Stockholm (twice), London (twice) and, towards the end of the project, also in Luxembourg (instead of London, in conjunction with a HMP co-ordinators meeting).
9

Monitoring Public Health Nutrition in Europe
Furthermore, the project has been represented at all five (5) Health Monitoring Project co-cordinators Meetings in Luxembourg during the project period, through the project co-ordinator himself and fully according the project plan up to the last meeting in March 2003. In fact the project co-ordinator participated at a number of meetings also before the project period (from November 1999), in total 8 such meetings (Appendix II). An overview of the various meetings and relationship between the EC, Working Group and the ECHI project is presented in Figure 1. Presentations and publications related to the project are presented in Appendix III.
Figure 1. Flow-chart showing the relationship in between Co-ordinators meetings in Luxembourg and the ECHI-project, the meetings in the Executive Committee, the Working Group meeting in Luxembourg and the Expert Meetings in Stockholm, and the Work in the Working Parties (n=3). The various outcomes of the process are also seen, from presentations at international scientific meetings and related publications, to integration of the outcome into academic training at different levels, above all the European master’s programme, and, finally, the Report to the Health Monitoring Programme within the Commission.
Eur Core HealthIndicators (ECHI)
Co-ordinatorsMeetings, Luxembourg
EC Meetings, telephone, or inStlm, London, Luxembourg
Luxembourg Oct 01Working Group Meeting
Stockholm May 01Expert Meeting Breastfeeding
Stockholm March 01Expert Meeting Phys Activity
WorkingParties
2nd Int Conf Monitoring BehavoirHelsinki, 2001 (2 pres)
1st Conf Int Soc Behavior Nutr Phys Act, Seattle, 2002 (3 pres)
3rd Int Sci Meeting Global Surv-eillance Health Behavior, 2003
Presentations atInt Scientific Meetings
Original scientific papers,Proceedings, Abstracts
Text-book chapter,debate articles
Recommendations andPolicy formulation
Related Int Publications
SUMMARY Report
Newsletter
PROJECT REPORT
ReportCommittee
EU Basics Summer SchoolsStockholm, Valencia, Crete
Course modules in EurPHN Master's Programs
Courses for PhD studentsat Eur Academic Centres
TrainingEur Master's PHN
MonitoringPHN in Europe
Health MonitoringProgramme (HMP)
10

Monitoring Public Health Nutrition in Europe
OBJECTIVES AND METHODS General Considerations From the general objectives and statements presented above, it follows that the main aim of present project work in the area of Public Health Nutrition (PHN), Monitoring Public Health Nutrition in Europe, should be to define clearly the indicators for diet, nutrition and physical activity that should be monitored for related health outcomes. The recommended indicators, however, should ideally be those indicators that are already being collected in the majority of member states or those that can be added easily to current data collection systems in the Member States. Many projects within the EU Programme on Health Monitoring have been completed or are well established. The nutrition related recommendations made in reports or other documents from these projects should also be considered in this project. The chosen indicators must also be understandable and easily accessible to a variety of audiences such as medical practitioners, researchers, educationalists and policy makers. The indicators chosen must relate to issues of health (and "health potential”) as well as the problems of disease. The scale and cost of diseases that are linked to nutrition and the burden of these diseases to the Member States is significant. Therefore, the chosen indicators must have a relationship with the major causes of mortality and morbidity in the European Union, namely cardiovascular diseases, cancer, non-insulin dependent diabetes, obesity, and osteoporosis. Objectives The approach taken to achieve the aims, further developed at the Luxembourg Working Group meeting, in October 2001, consisted of five main steps: 1. The development of a theoretical model for defining and prioritizing the indicators. In the development of this list, work completed by other projects was integrated into the model. The collation and integration of this work was an important aspect of the development of the final list of prioritized indicators. 2. The collection of data from the Member States on the information routinely collected within each country. Many data banks are being developed for the HMS system and use was made of these databanks to collate data on nutritional and health indicators. All member countries were also contacted for details of data routinely collected that could be relevant to health and nutritional status. 3. A comparison of the theoretical list of ideal indicators with the data routinely collected to establish a short list of indicators that could be monitored, for use in Public Health Nutrition. 4. Recommendations for standard methods of collection of data for the chosen indicators. Other studies have spent considerable time and research to determine common methods for monitoring of socio-economic indicators, nutritional status, dietary intake and biomarkers. Their work has been included in this report where relevant. 5. Recommendations for the collection of data on indicators that are at present, not routinely monitored in all Member States.
11
Monitoring Public Health Nutrition in Europe
Methods A theoretical framework to identify a number of priority indicators was based on an evaluation template proposed at a Working Group Meeting in Luxembourg of October 2001. The template included the generic indicator’s name, its operational definition, the justification for selection and technical criteria for inclusion of proposed indicators. These are defined as follows: Evaluation criteria Questions to be addressed Justification Were there studies that linked the indicator with an increased chance
of disease? Usefulness Were the indicator groups easily identified and will routinely
collected data be relevant and changes easily tracked? Robustness Were the studies indicating the link with health status statistically
significant? Understandable Will changes be easy to implement and address the problem?
Relevant data sources What current data collections should be used?
Diseases linked to nutrition Is there a clear link between nutrition and disease states that have a
large impact on public health? This template was used initially to identify and evaluate the appropriateness of a number of indicators. It evolved into the following more comprehensive framework: • Identification of a full range of indicators with impact on Public Health Nutrition; • The examination of the strength of the correlation of an indicator with the diseases of major
concern in Public Health Nutrition; • Correlation of indicators with data availability in the Member States; • Selection of indicators that have a strong established connection with major diseases of
concern in Public Health and were available in the majority of Member States; • Recommendations for the collection of indicators that should be monitored in the future. Figure 2 shows the development of the selection process from which the final recommended indicators were derived. It also emphasizes the importance of the input and existing work from other projects such as EFCOSUM, DAFNE, EUPASS, CINDI, MONICA, EURODIET AND ECHI among others. Defining Indicators Seven Primary Categories (PC) for investigation were identified. These were:
PC 1. Health promotion PC 2. Food and nutrient intake, including breastfeeding and alcohol PC 3. Nutritional status and physical activity habits and fitness PC 4. Socio-demographic factors PC 5. Inequality PC 6. Genetic factors and interactions PC 7. Life stages and vulnerable/critical periods
12

Monitoring Public Health Nutrition in Europe
Monitoring Public Health Nutrition Project
EURODIET MONICA CINDI etc.
EFCOSUM DAFNE EUPASS
Possible indicators
Evaluation template
HIS, HES, WHO, etc.
ECHI Prioritised indicators
Policy action perspectives: • Monitoring policies • Defining operational
measures • Database availability
Recommended indicators Figure 2. Schematic overview of the selection process for recommended indicators with input from related projects.
13

Monitoring Public Health Nutrition in Europe
It was intended to generate a comprehensive list of possible indicators from which to build a theoretical framework of those which were likely to prove most useful for the purposes of PHN monitoring in the EU. This extensive list of indicators (Appendix IV) was initially divided between three groups (Working Party A to C) of project participants for evaluation and prioritization. Working Party A took responsibility for PC 1, PC 4 and PC5, Working Party B PC 2, and Working Party C for PC 3. Each Working Party took responsibility for their own work, and organized it accordingly. The groups then provided useful comments on the prioritizing of the indicies. These were then fed to the co-ordinators, who further developed the prioritization scheme. No group was established for genetic factors and interactions (PC 6), as this area is still very much in the early stages of research. It would therefore not be prudent to make recommendations in this area for a monitoring system for whole populations. Nor was a group created to specifically look at life stages and vulnerable/critical periods (PC 7), as these can be integrated into the other variables within the other groups, where possible. The Working Group took the view that issues relating to food safety and contamination are primarily to do with environmental safety rather than Public Health Nutrition, and so they are not considered in this report. Complementary Projects In order to evaluate the usefulness of an indicator for monitoring Public Health Nutrition, literature research was undertaken to find evidence for sound and robust links between an indicator and health status. Intervention studies in particular have been sought and examined for outcome. Due regard has of course also been paid to the work that has been undertaken to date. Other health monitoring projects and reports in the area of nutrition and health have made recommendations on nutritional aspects of public health, such as The EURODIET Project, the French Initiative, the European Council Resolution in Nutrition and Health, The EC Status Report, the WHO Action Plan in Nutrition for Europe, and the WHO CINDI food based guidelines, the European Nutrition and Health report (work in progress) as well as more recent documents from WHO and WHO/FAO. It was an essential part of this study to consider their conclusions. There is, however, scope for considering specifically the indicators chosen by other projects within the development of the European HMS, such as ECHI, EFCOSUM, EUPASS, DAFNE, ECAS, and ‘Monitoring socio-economic inequalities in health in the European Union: Guidelines and illustrations' by Kunst et al, alongside those proposed in this report, and for suggesting additional or alternative indicators according to the framework produced in the present project. Research completed in the SENECA, MONICA and EPIC projects has also been relevant in this context. Prioritization of Generic Indicators In order to understand if an indicator was likely to be useful in monitoring improvements in Public Health Nutrition, literature research was undertaken to find evidence for sound and robust links between an indicator and health status. Epidemiological and particularly interventions studies were sought and examined for outcome. The original list of indicators was very comprehensive and is listed in Appendix IV. To be of practical value this list had to be pared down to a smaller list of priority indicators that were key to the monitoring of the state of Public Health Nutrition. This prioritization of a small number does not however negate the value of other indicators. In the balance of Public Health Nutrition, however, the indicators not included are likely to relate to smaller numbers of people in the population or generally have less impact on nutrition related
14

Monitoring Public Health Nutrition in Europe
health. The process of prioritization basically consisted of identifying the level of evidence for the major links between the indicators, the rationale for inclusion, selection of priority indicators according to strict criteria and a scoring system to identify prioritized indicators. The process of prioritization consisted of four steps: Step 1 An Excel workbook consisting of ten separate spreadsheets (five for PC 1, four for PC 4, and one for PC 5) was constructed. The spreadsheets were organized by subdividing the primary categories into secondary categories as follows: Primary category:
Environmental Socio-economic Inequality
Generic indicator (one per spreadsheet)
Nutrition Policy Nutrition Intervention Associated Policies Food availability Food Security
Age Education Occupation Income
Inequality
In the spreadsheets, the indicators listed by the delegates in Luxembourg in October were used as column headings. Rows were designated with the criteria for selection from the template. On these spreadsheets, if a link has been established in a published research study between the evaluation criteria and an indicator, a brief note was written in the appropriate cell. Robustness of such studies and sources of data were also noted in the appropriate cells on this spread sheet. These spreadsheets illustrated the level of evidence for the major links between the indicators and health status. A blank cell indicates either no evidence available or no convincing evidence linking the generic indicator with headings in the evaluation template. Step 2 Using these spreadsheets, a shorter list of indicators was selected from the initial comprehensive list of indicators in Appendix IV. The selection of priority indicators was made using the following criteria: For each primary category, one operational measure was chosen from each generic indicator. The operational measure in each generic indicator, which showed the strongest association with diseases, which could be clearly defined and which could be readily understood was selected. For example, in the socio-economic Primary category, in the generic indicator “occupation” the rational was as follows: 'Studies have shown that people in manual occupations have a greater risk of heart disease, non-insulin dependent diabetes, most cancers, obesity, neural tube defects, low birth weights etc. In addition, the identification of non-manual versus manual workers is routinely determined and recorded in many National Censuses and Household Budget Surveys. Therefore, for occupation, the percentage of the adult population in manual occupations were considered appropriate for further examination as a priority indicator and selected for the shorter list.' Thus a shorter list of operational measures for PC 1, PC 4 and PC 5 was constructed from the original 10 spreadsheets.
15

Monitoring Public Health Nutrition in Europe
Step 3 Using the selected operational measures for each generic indicator (Step 2) in each PC, a new spreadsheet was developed. Each operational measure was entered as a column heading on the first of the two linked spreadsheets. The rows were representative of the criteria for evaluation, as described in the table above. If, in our view, a connection had been shown between an indicator and an evaluation criteria, this was recorded by placing an ‘*’ in the appropriate cell. For example, many studies have established that there is an increased risk of cardiovascular diseases in the manual occupations. As this link has been firmly established in epidemiological findings, an ‘*’ was placed in the appropriate cell on the socio-demographic spreadsheet. Step 4 A furth er spreadsheet for each PC was linked to spreadsheet in Step 3. For each evaluation criterion, for each of the operational measures, we summed the number of asterisks in the table in Step 3. This score was then used to prioritize the operational measures. The summaries from these evaluation templates are in Appendix V. No formal weighting was given to different diseases when scoring the operational measures. However when reviewing the scores, if a link had been established between an operational measure and a disease, such as CVD, cancer and diabetes, this operational measure was given consideration for prioritization even if the score was not high. The influence these major diseases have on Public Health were then reflected in the prioritization process Comparability of Measures A key challenge of a monitoring system must be to ensure that measures between countries are comparable. For many of the indicators listed in this report, steps have already been taken to address this issue (EFCOSUM, DAFNE, EUPASS, etc.). Within-country policy decisions regarding implementation of monitoring must be informed by the operational measures relating to each indicator to promote comparability of findings across the EU. More detailed recommendations are given at the end of this report.
16

Monitoring Public Health Nutrition in Europe
RESULTS The information gathered from the spreadsheets on possible indicators and related operational measures is described in the following sections, by primary category (PC). In most cases, operational measures can be defined in detail from their generic indicators. However, in some instances the level of detail of these corresponds to such an extent that it is difficult to make a distinction, such is the case for alcohol. In contrast, the indicators for Primary Category 1 are hard define in terms of operational measures and the latter are therefore not given. Health Promotion (PC 1) Using the method described earlier, the following indicators had high scores and were then chosen for consideration as priority indicators for monitoring: Indicator: NUTRITIONAL POLICY AND STATUTORY LEGISLATION Justification: Implementation of such would reflect Article 152 of the Amsterdam treaty, which states: “A high level of human health shall be ensured in the definition and implementation of all community policies and activities.” At present, few countries in the Member States have a Nutrition Policy. Indicator: NUTRITIONAL INTERVENTION: FORTIFICATION Justification: It has been shown that food and drink fortification (e.g. salt with iodine, breakfast cereals with iron) has helped to reduce the risk of some nutrition related diseases. The effects of fortification of flour and bread with folic acid to reduce the incidence of neural tube defects and heart disease has yet to be fully evaluated. The results of the studies undertaken are at present ambiguous. However, extending, monitoring and evaluating the fortification practices across Europe is to be recommended. Food and Nutrient intake (PC 2) For food consumption and nutrient intake, there is a large body of literature relating the generic indicators to nutrition-related health outcomes. Indicator: CONSUMPTION / AVAILABILITY OF VEGETABLES (excl. potatoes and vegetable juice) Operational measure: average per capita adult intake of less than 300g/day Justification: Higher intake of vegetables is associated with reduced risk of some cancers, CVD and NIDD and lower BMI. Indicator: CONSUMPTION / AVAILABILITY OF FRUIT (excl. fruit juice) Operational measure: Average per capita adult intake of less than 100g/day Justification: Higher intake of fruit is associated with reduced risk of some cancers, CVD and NIDD and lower BMI. Indicator: CONSUMPTION / AVAILABILITY OF MEAT AND MEAT PRODUCTS Operational measure: Average per capita adult intake of more than 80g red meat/day Justification: High intake of red meat and processed meat is associated with an increased risk of colon cancer and may increase the risk of ischaemic heart disease.
17

Monitoring Public Health Nutrition in Europe
Indicator: CONSUMPTION / AVAILABILITY OF FISH Operational measure: Diets that contain less than 200g of fatty fish a week Justification: Oily fish contain essential fatty acids that reduce the risk of sudden cardiac death and secondary myocardial infarction. Indicator: SATURATED FATTY ACID CONTENT OF THE TYPICAL DIET Operational measure: Average diet with a saturated fatty acid content of more than 10% of energy intake Justification: High intake of saturated fatty acids are associated with the development of CVD, and possibly breast cancer. The values for trans fatty acids should be included in the estimates of saturated fatty acids. Indicator: POLYUNSATURATED FATTY ACID CONTENT OF THE TYPICAL DIET Operational measure: Average diet with less than 7-8% of energy from PUFA Justification: High mono- and polyunsaturated fatty acid intakes are linked with better “health potential”. Indicator: MONO-UNSATURATED FATTY ACID CONTENT OF THE TYPICAL DIET Operational measure: Average diet with low MUFA Justification: High mono- and polyunsaturated fatty acid intakes are linked with better “health potential”. Indicator: NON-STARCH POLYSACCHARIDES (NSP) CONTENT OF THE TYPICAL DIET Operational measure: Average diet with less than 25g/d Justification: Higher NSP intakes are associated with decreased risk of colorectal cancer and lower BMI. Indicator: VITAMIN CONTENT OF THE TYPICAL DIET: vitamins C, D and E, folate and carotenoids Operational measure: Diet with levels of Vit C, D, E, folate and carotenoids below recommended levels Justification: Low intakes of vitamin D are associated with increased risk of osteomalacia, rickets and may contribute to risk of osteoporosis. Low intakes of vitamins C and E, folic acid and carotenoids are associated with increased risk of certain cancers, CHD, CVD and neural tube defects. Indicator: MINERAL CONTENT OF THE TYPICAL DIET: Fe, I, Ca and Se Operational measure: Diet with levels of Fe, I, Ca and Se below recommended levels Justification: Low intakes are associated with increased risks of iron deficiency and iron deficiency anaemia (Fe), iodine deficiency disorders (I), osteoporosis, osteomalacia, rickets (Ca) and cancer and cardiovascular disease (Se). The DAFNE Project With regard to comparisons between countries, comparability of operational measures is crucial to the correct interpretation of the comparisons. This has been a key feature of both DAFNE and EPIC for example. It has also informed the thinking behind EFCOSUM and their suggested list of generic indicators. The DAFNE project, a pan-European database of data from household budget surveys (HBS), has already revealed considerable variations in national food consumption, food habits and nutrient intake. In a system to monitor public health nutrition, monitoring of food availability is vital, as HBS are conducted in every EU country, so providing a ready source of data at low cost. In addition, there are important problems with bias in individual food intake studies especially when
18
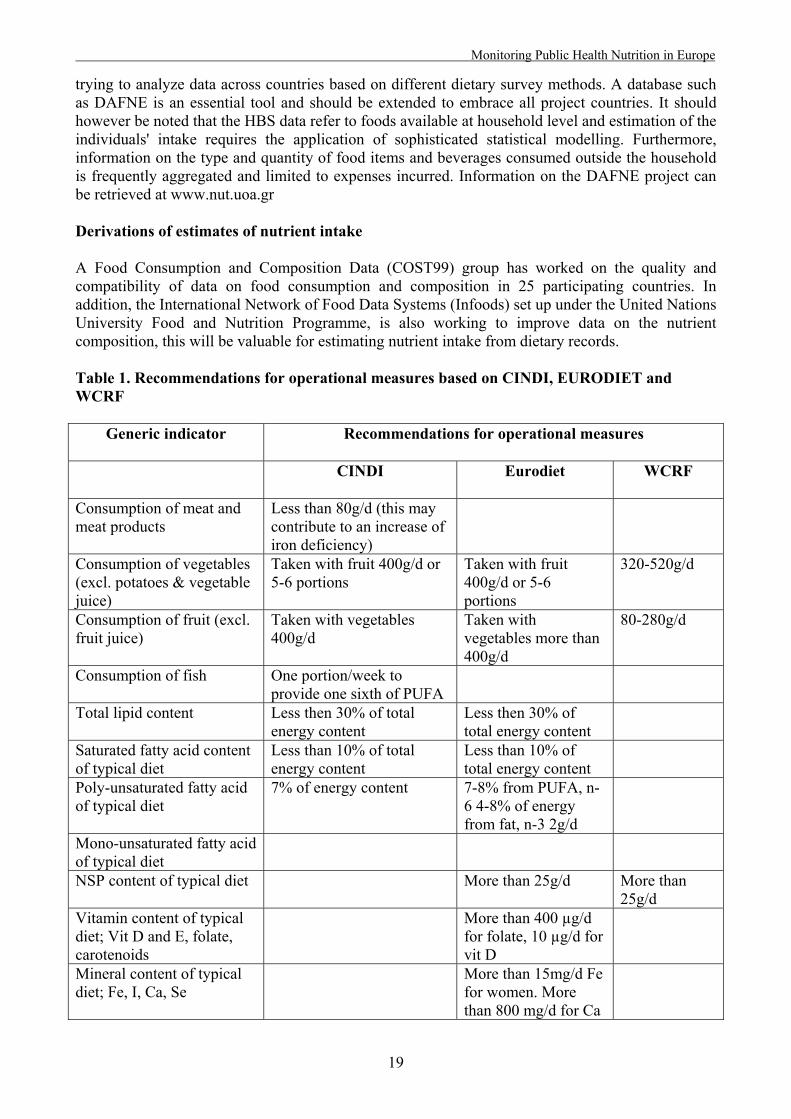
Monitoring Public Health Nutrition in Europe
trying to analyze data across countries based on different dietary survey methods. A database such as DAFNE is an essential tool and should be extended to embrace all project countries. It should however be noted that the HBS data refer to foods available at household level and estimation of the individuals' intake requires the application of sophisticated statistical modelling. Furthermore, information on the type and quantity of food items and beverages consumed outside the household is frequently aggregated and limited to expenses incurred. Information on the DAFNE project can be retrieved at www.nut.uoa.gr Derivations of estimates of nutrient intake A Food Consumption and Composition Data (COST99) group has worked on the quality and compatibility of data on food consumption and composition in 25 participating countries. In addition, the International Network of Food Data Systems (Infoods) set up under the United Nations University Food and Nutrition Programme, is also working to improve data on the nutrient composition, this will be valuable for estimating nutrient intake from dietary records. Table 1. Recommendations for operational measures based on CINDI, EURODIET and WCRF
Generic indicator Recommendations for operational measures
CINDI
Eurodiet WCRF
Consumption of meat and meat products
Less than 80g/d (this may contribute to an increase of iron deficiency)
Consumption of vegetables (excl. potatoes & vegetable juice)
Taken with fruit 400g/d or 5-6 portions
Taken with fruit 400g/d or 5-6 portions
320-520g/d
Consumption of fruit (excl. fruit juice)
Taken with vegetables 400g/d
Taken with vegetables more than 400g/d
80-280g/d
Consumption of fish One portion/week to provide one sixth of PUFA
Total lipid content Less then 30% of total energy content
Less then 30% of total energy content
Saturated fatty acid content of typical diet
Less than 10% of total energy content
Less than 10% of total energy content
Poly-unsaturated fatty acid of typical diet
7% of energy content 7-8% from PUFA, n-6 4-8% of energy from fat, n-3 2g/d
Mono-unsaturated fatty acid of typical diet
NSP content of typical diet
More than 25g/d More than 25g/d
Vitamin content of typical diet; Vit D and E, folate, carotenoids
More than 400 µg/d for folate, 10 µg/d for vit D
Mineral content of typical diet; Fe, I, Ca, Se
More than 15mg/d Fe for women. More than 800 mg/d for Ca
19

Monitoring Public Health Nutrition in Europe
The operational measures for food intake, should in the first instance, be based on EURODIET and WHO Food Based Guidelines as proposed in the CINDI dietary guide. The CINDI guide (focusing on changes to diet in Eastern European countries) and the EURODIET Food Based Guidelines are based on foods rather than nutrients. It is intended that the guidelines should be tailored to correspond to local conditions of food consumption and prevalence of disease. However, these guides do give broad recommendations in some of the indicators that we are proposing. The World Cancer Research Fund, in association with the American Institute for Cancer Research, has also made recommendations for food based guidelines. These reports' recommendations for operational measures are presented in Table 1 for the chosen generic indicators. There are no specific recommendations for the intake of iron, selenium, calcium and vitamin E and therefore alternative sources of recommendations should be sought for these nutrients. Alcohol (PC 2) For alcohol, there have been two major influential reports: ECAS I and ECAS II (European Comparative Alcohol Study), carried out by the National Public Health Institute, Sweden. ECAS I examined alcohol consumption in Europe and reported its findings in June 2001 in “A report from the Swedish Presidency June 2001”. This report was based on data collected by ECAS II and some data from the WHO. The report covered the following areas: a) Trends in drinking, b) Analysis of alcohol-related problems, and c) Trends and analyses of Alcohol Control Policy. There was a lack of comparative data across countries and over time, so long-term trends of drinking patterns from 15 countries could not be systematically described. ECAS therefore conducted a special survey for data at an individual level, in six countries. This assessed: a) Wine drinking (Italy and France), b) Beer drinking (Germany and the UK), and c) Former spirit drinking but now beer drinking (Finland and Sweden). ECAS II set out to address some of the problems highlighted in the ECAS I report. The main aims were:
• To find indicators of alcohol consumption and alcohol-related mortality; • To examine the validity and relevance of these indicators; • Elaboration of methods for collecting and analyzing data.
Indicator: TOTAL ALCOHOL CONSUMPTION Justification: The major indicator of alcohol consumption is total alcohol consumption. Total alcohol consumption is composed of both recorded and unrecorded alcohol consumption. The major tool for describing and monitoring drinking patterns is national representative population surveys. These can also be used as a direct estimate of unrecorded alcohol consumption. As an indicator of public health, total alcohol consumption per capita per beverage category should include unrecorded alcohol consumption, but much is still to be done in this field. Other important indicators / operational measures (no distinction is made) are: Indicator / operational measure: THE SHARE OF ABSTAINERS IN THE TOTAL POPULATION, AMONG MALES AND FEMALES, AND AMONG ADOLESCENT BOYS AND GIRLS
20

Monitoring Public Health Nutrition in Europe
Indicator / operational measure: THE SHARE OF HEAVY DRINKERS IN THE TOTAL POPULATION, AMONG MALES AND FEMALES Indicator / operational measure: THE FREQUENCY OF HEAVY DRINKING OCCASIONS (BINGE DRINKING) Indicator / operational measure: The share of total alcohol consumption consumed with meals and among males and females Indicator / operational measure: THE SHARE OF TOTAL ALCOHOL CONSUMPTION WITH MEALS AMONG MALES AND FEMALES Indicator / operational measure: THE CONTRIBUTION OF ALCOHOL TO ENERGY INTAKE Breastfeeding (PC 2) The expert group report is included in Appendix VI. Their conclusions are that improved promotion of breastfeeding at a local, national and international level is needed, but this requires reliable and valid prevalence data across countries. WHO definitions of infant feeding should be used. The core indicators should cover: Indicator: INITIATION OF BREASTFEEDING Operational measure: Breastfeeding and exclusive breastfeeding rates at birth, i.e. through out the first 48 hours of life Indicator: DURATION OF BREASTFEEDING Operational measure: Breastfeeding and exclusive breastfeeding rates at 6 months of age Indicator: QUALITY OF BREASTFEEDING Operational measure: Breastfeeding rates at 12, 18 and 24 months of age Nutritional Status (PC 3) The following biomarkers are recommended for monitoring. Indicator: SERUM CAROTENOID LEVELS Operational measure: Retinol and total plasma carotenoids levels of a representative sample of the population, in the routine nutritional surveys. Age-gender specific cut-off points to be determined Justification: Low concentrations of carotenoid in serum reflect the level of intake of fruit and vegetables. Low consumption of fruit and vegetables is associated with increased incidence of cancers, cardiovascular disease, obesity and adult onset diabetes. Indicator: BLOOD LIPID PATTERN Operational measure: Total plasma cholesterol and cholesterol fractions, fatty acid cholesterol esters levels of a representative sample of the population in the routine nutritional surveys. Age-gender specific cut-off points to be determined Justification: Raised levels of cholesterol, especially LDL and triacyl glycerides, may place an individual at increased risk of cardiovascular disease.
21

Monitoring Public Health Nutrition in Europe
Indicator: HAEMOGLOBIN, SERUM FERRITIN, SERUM TRANSFERRIN RECEPTOR Operational measure: Haemoglobin, serum ferritin and serum transferrin receptor using appropriate cut off points by age and gender Justification: Low haemoglobin levels, low serum ferritin levels, and raised serum transferrin receptor can reflect the varying aspects of dietary iron deficiency. All are associated with poor growth, poor immune status, diminished physical and mental performance, and poorer outcomes of pregnancy. In Europe, deficiency is due mainly to dietary deficiency (rather than infestation or other pathological causes). Indicator: FOLIC ACID STATUS Operational measure: Erythrocyte folate levels of a representative sample of the population in the routine nutritional surveys. Age-gender specific cut-off points to be determined Justification: Low levels of folate increase the risk of neural tube defects and chronic conditions such as cardiovascular disease in the population. The possible role of folate status in carcinogenesis is currently under investigation. Could be linked to homocysteine levels as a marker for cardiovascular disease. Indicator: SELENIUM STATUS Operational measure: Plasma selenium levels of a representative sample of the population in the routine nutritional surveys. Age-gender specific cut-off points to be determined Justification: Low serum selenium levels are associated with increased mortality from cancer and heart disease. Some areas of Europe probably have a poor selenium status and this status is thus worth estimating. Indicator: SERUM 25-HYDROXY VITAMIN D3 Operational measure: Circulating levels of 25-hydroxy vitamin D 3 provide the most appropriate measure of vitamin D status Justification: Serum 25-hydroxyvitamin D3 is the most useful marker of vitamin D status and low concentrations are associated with increased risks of rickets, osteomalacia, osteoporosis and bone fractures. Anthropometry (PC 3) Indicator: BODY COMPOSITION Operational measure: BODY MASS INDEX (BMI) Justification: The BMI (kg/m2)is more highly correlated with body fat than any other indicator of height and weight. Categories in adults should reflect underweight (<20), normal (20-24), overweight (25-29) and obese (>=30). Operational measure WAIST CIRCUMFERENCE Justification: The presence of excess body fat in the abdomen, when out of proportion to total body fat, is considered an independent predictor of risk of ailments associated with obesity Operational measure WAIST-TO-HIP RATIO (WHR) Justification: For most people, carrying extra weight around their waist increases health risks more than carrying extra weight around their hips or thighs. Overall obesity is still more risky than body fat storage locations or waist-to-hip ratio Operational measure SAGITTAL ABDOMINAL DIAMETER (SAD)
22

Monitoring Public Health Nutrition in Europe
Justification: Recent research indicates that the abdominal sagittal diameter (height of the abdomen measured halfway between lower rib and iliac crest while the patient is in a supine position) is a better correlate of abdominal visceral adipose tissue accumulation than the commonly used waist-to-hip ratio (WHR). Sagittal diameter values over 25 cm are most likely to be associated with potentially "atherogenic" metabolic disturbances Physical Activity (PC 3) Physical activity is defined as any bodily movement produced by skeletal muscle that results in energy expenditure. It is closely related to but different from physical exercise, that is planned, structured and repetitive bodily movement done to improve or maintain fitness. The amount and character of all activities have physiological and medical consequences. Health-enhancing physical activity (HEPA) refers to all physical activity that has a positive effect on health. The physical activity level and pattern of a population is an important generic indicator in Public Health Nutrition. Relative physical inactivity, usually together with unhealthy food habits, is associated with the development of many of the major non-communicable diseases in society, such as CVD, some cancers, obesity, diabetes and osteoporosis. It has become increasingly clear that physical inactivity is a global health issue. Physical activity is a complex behavior. Any activity can be described in terms such as intensity, frequency and duration, and these dimensions must be considered. An assessment methodology should also consider inactivity, such as time spent sitting. Physical activity can be related to work, transportation, home and leisure time. The activities at either of these domains may have specific health consequences, and advanced monitoring should also consider these. There is increasing interest in the contextual (environmental) barriers that prevent or limit the opportunity to walk and cycle in areas around where we live and work. Factors that are emerging as important include land use, housing density, accessibility to public transport systems, and perceived safety from traffic and crime. Indicator: PHYSICAL ACTIVITY LEVEL AND PATTERN Operational measures: • The total amount of activity expressed either as activity energy expenditure (kcal, Joules,
MET mins, etc) or physical activity level (PAL); • Time (mins/day or week) spent at health enhancing physical activity level (i.e. activity at
moderate and vigorous intensity levels); • Time (mins/day or week) spent sitting; • The environmental determinants for physical activity, as defined by the IPAQ environmental
module Health-related Fitness (PC3) Health-related fitness includes the characteristics of functional capacity that are affected positively by physical activity or negatively by the lack of physical activity and are, at the same time, associated with health status. Good health-related fitness is comprised of endurance, bodily control, muscular strength, joint mobility, and suitable weight. A person who is sufficiently healthy can cope with everyday activities without overtiring. Health-related fitness broadens the traditional concept of fitness as the capacity to perform sports and physical activities to include the functional capacity needed for everyday life and health. Indicator: MAXIMAL AEROBIC POWER
23

Monitoring Public Health Nutrition in Europe
Operational measure: Walk test, 2km Justification: Population assessment of cardiovascular fitness (aerobic fitness/maximal aerobic power) is the gold standard. A test, the UKK Walk Test, has been developed. It is well suited for the assessment of health-related fitness among the general population. It also reflects the functional capacity of the musculo-skeletal system. Optional indicators/measures, as defined within EUROFIT: Indicator: BODILY CONTROL Indicator: MUSCULAR STRENGTH Indicator: JOINT MOBILITY Socio-demographic Factors (PC 4) Indicator: AGE DISTRIBUTION Operational measure: the percent of the population aged 71+ Justification: The over 71-age group has a high morbidity and mortality, presenting a considerable health burden. In addition, this group is often malnourished and typically requires nutrient dense food. Indicator: EDUCATIONAL LEVEL Operational measure: the percent of the population with low educational level Justification: Numerous studies have linked lower educational levels with a poor health status and a less healthy diet. Indicator: OCCUPATION Operational measure: the percent of the population in manual occupations Justification: Numerous studies have linked manual occupations with a poor health status and a less healthy diet. The number and percentage of manual workers in the adult population should be monitored to estimate the health burden and to inform measures to improve their health status. Indicator: HOUSEHOLD INCOME Operational measures:
• Percentage of households with a total income below 50% of the median income of the country
Justification: Studies have shown that households on low income have a greater morbidity and mortality. Their level of income compared to the general population is more significant than the absolute level of income. The proportion of such households in a population should thus be monitored.
• The number of household with income in the lowest 5% Justification: As for the above indicator households on low incomes have a greater morbidity and mortality and their prevalence should be monitored
• The percentage of households with income below budget standards Justification: Budget standards represent a level of income that gives and commensurates with an acceptable standard of living for that area or state. Any household however with an income below this standard will thus have little income, is unlikely to be able to afford the goods and services that they require for a healthy life. The consequence is likely to be and this can result in a less healthy diet and a poor health status. This operational measure can only be monitored if the state sets budget standards are set by the state or an acknowledged and accepted authority
24

Monitoring Public Health Nutrition in Europe
Inequality (PC 5) There are three suggested mechanisms, through which socio-economic circumstances impact on social inequality, namely behavioral, material/structural and psycho-social factors including social support. Only the basic material factors were included in the original list of indicators for prioritization. However, this report recognizes the important role that psychosocial factors play in Public Health and in the area of Public Health Nutrition. At the present time, however it was considered premature to prioritize any particular generic indicator in this area. The ongoing work of the European Science Foundation programme Social Variations in Health Expectancy in Europe and information from the pan-European survey on food attitudes has been of help to identify relevant indicators in this area for future monitoring purposes. As we have considered only the material aspect of inequality, the list of operational measures for inequality are almost identical to the socio-demographic/ socio-economic indicators, and only one extra needs to be added, that is long term unemployment. Thus, in relation to the three PCs Environment, Socio-demographic and Inequality, it is appropriate to link information on the selected variables with measures of nutritional exposure (diet) or status (biomarkers, anthropometry, etc) in order to monitor changes in Public Health Nutrition. Indicator: THE PERCENT OF POPULATION LONG TERM UNEMPLOYED Operational measure: Percentage of the population that have been unemployed for more than 12 months. Justification: Numerous studies have shown that the long term unemployed have a higher morbidity and mortality rate and a less healthy diet the longer the period of unemployment, the more the food budget is restricted as financial reserves are eroded. Subsequently, the diet increases in saturated fat content and decreases in its content of fresh fruit and vegetables. Availability of Prioritized Indicators An Excel spreadsheet questionnaire was devised and sent to a representative of each participating country. Each representative then investigated which data were routinely collected in their country. This was a considerable operation and we are grateful to all those who took the trouble to complete the questionnaire. Prioritized indicators and their availability are listed in Table 2. The indicators listed below were chosen on the basis that research has shown that these factors have an association with poor health status and a poor diet. The related diseases place a considerable burden on the health services in the member states. These indicators were thus considered relevant to monitoring Public Health Nutrition. With respect to Table 2 it should be noted that:
• At the moment of data collection, no data on physical activity was available in Member States. The Eurobarometer study that deals with this was carried out in 15 EU countries and is currently in the stage of data analysis.
• The results of the two ECAS studies concluded that there is very limited information on
comparable alcohol consumption indicators in EU countries and it was not the intention of our project to try to collect information on the availability of these indicators.
• The information received from France was very limited
25
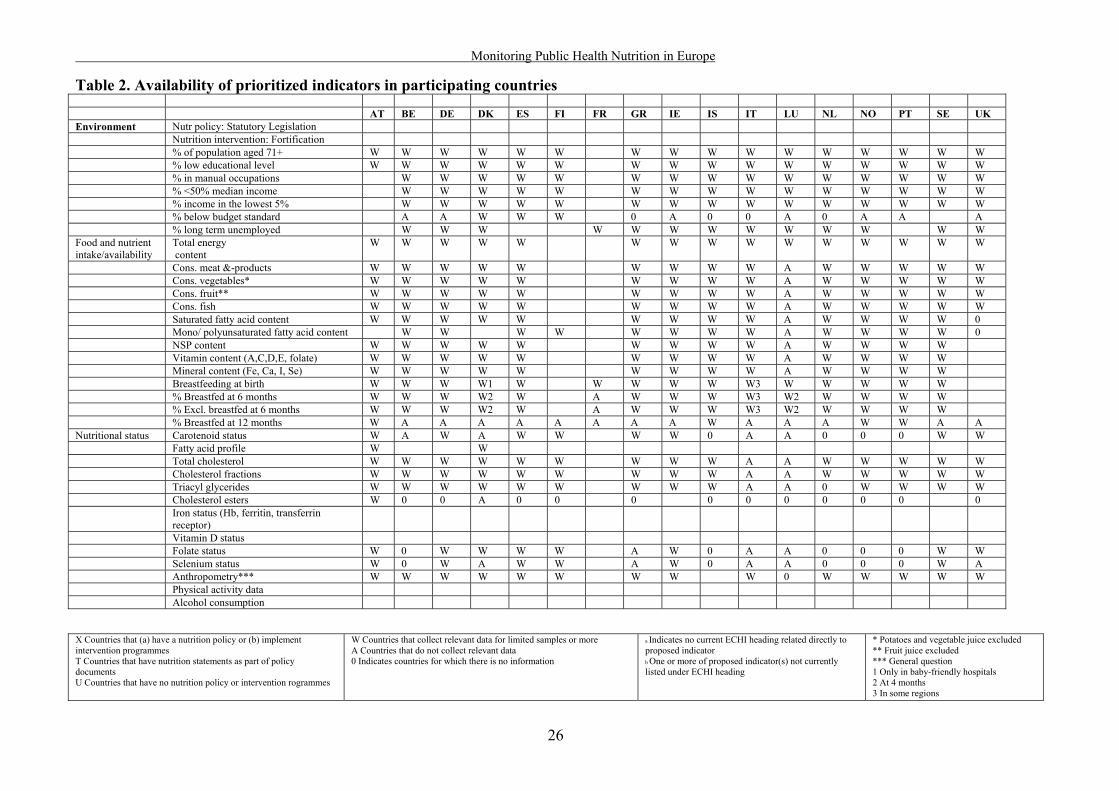
Monitoring Public Health Nutrition in Europe
Table 2. Availability of prioritized indicators in participating countries AT BE DE DK ES FI FR GR IE IS IT LU NL NO PT SE UKEnvironment Nutr policy: Statutory Legislation Nutrition intervention: Fortification
% of population aged 71+ W W W W W W W W W W W W W W W W% low educational level W W W W W W W W W W W W W W W W% in manual occupations W W W W W W W W W W W W W W W% <50% median income W W W W W W W W W W W W W W W% income in the lowest 5% W W W W W W W W W W W W W W W% below budget standard A A W W W 0 A 0 0 A 0 A A A% long term unemployed W W W W W W W W W W W W W
Food and nutrient intake/availability
Total energy content
W W W W W W W W W W W W W W W
Cons. meat &-products W W W W W W W W W A W W W W WCons. vegetables* W W W W W W W W W A W W W W WCons. fruit** W W W W W W W W W A W W W W WCons. fish W W W W W W W W W A W W W W WSaturated fatty acid content W W W W W W W W W A W W W W 0Mono/ polyunsaturated fatty acid content W W W W W W W W A W W W W 0NSP content W W W W W W W W W A W W W WVitamin content (A,C,D,E, folate) W W W W W W W W W A W W W WMineral content (Fe, Ca, I, Se) W W W W W W W W W A W W W WBreastfeeding at birth W W W W1 W W W W W W3 W W W W W% Breastfed at 6 months W W W W2 W A W W W W3 W2 W W W W% Excl. breastfed at 6 months W W W W2 W A W W W W3 W2 W W W W% Breastfed at 12 months W A A A A A A A A W A A A W W A A
Nutritional status Carotenoid status W A W A W W W W 0 A A 0 0 0 W W Fatty acid pro
Total cholesterol W W W W W W W W W A A W W W W WCholesterol fractions W W W W W W W W W A A W W W W WTriacyl glycerides W W W W W W W W W A A 0 W W W WCholesterol esters W 0 0 A 0 0 0 0 0 0 0 0 0 0
Iron status (Hb, ferritin, transferrin receptor) Vitamin D stFolate status W 0 W W W W A W 0 A A 0 0 0 W WSelenium status W 0 W A W W A W 0 A A 0 0 0 W AAnthropometry*** W W W W W W W W W 0 W W W W WPhysical activity dAlcohol consumption
file W W
atus ata X Countries that (a) have a nutrition policy or (b) implement intervention programmes T Countries that have nutrition statements as part of policy documents U Countries that have no nutrition policy or intervention rogrammes
W Countries that collect relevant data for limited samples or more A Countries that do not collect relevant data 0 Indicates countries for which there is no information
a Indicates no current ECHI heading related directly to proposed indicator b One or more of proposed indicator(s) not currently listed under ECHI heading
* Potatoes and vegetable juice excluded ** Fruit juice excluded *** General question 1 Only in baby-friendly hospitals 2 At 4 months 3 In some regions
26

Monitoring Public Health Nutrition in Europe
INTEGRATION AND DISSEMINATION Training Programme The European Master Programme for Public Health Nutrition, which was initiated in 1997, and has been supported by the European Commission since 1998, produced a common core curriculum in the year 2000. This document preambles the developments and includes issues on monitoring and surveillance into two major parts of the curriculum, the EU Basics Course in Public Health Nutrition, and the course Assessment in nutrition and physical activity (see Appendix VII). During the development of the project, the process and suggestions for action have been included year by year in the common summer school EU Basics in Public Health Nutrition that have been run since 1999. At some of those occasions, when the summer school was held in parallel with the European Master Programme on Ageing and the European Master Programme in Health Promotion, the other programmes have been included in a common session on this topic (see Appendix VII). The short version of the report will be disseminated to all participating universities, for use in the training of students within the Assessment course and as background material within the Epidemiology and Biostatistics course. The material will of course also be used in the EU Basics Course. Dissemination The process has also been followed in the common newsletter, with reference to the latest developments in the project (see example, Appendix VII). As soon as the report is approved by the commission, the short version of the report will be made available on the website for the European PHN Network. The report will also be announced in the newsletter. Depending on the further funding of the European PHN Network, the results of the monitoring project will be discussed and disseminated through Network meetings and common course literature developments in the area.
27

Monitoring Public Health Nutrition in Europe
RECOMMENDATIONS The selection of prioritized indicators listed in the previous section were presented in three different areas
• Environmental, socio-economic and inequality • Food consumption / availability and nutrient intake (including alcohol and breastfeeding) • Nutritional status (including physical activity and anthropometry)
Following consecutive discussions with Commission representatives and taking into account the availability of the prioritized indicators in the Member States it was decided that the original list was too comprehensive and needed to be limited. This is in line with the rationale of e.g. the group studying perinatal indicators who stated that 'it is important to limit the number of indicators on the basis that 10 good indicators are better than 50 of varying quality'. For the current project, it was considered that it would be appropriate to recommend approximately 10 indicators for each of the above areas, limiting the total number to around 30 indicators to be put forward for recommendation to the Commission. These indicators, their suggested operational measures and a summary of the rationale are given in table 3. Table 3. Recommendations for indicators for monitoring public health nutrition in the EU Indicator Operational measure Rational
Health promotion Nutrition policy A Nutrition Policy with specific
recommendations is set down in national or Government legislation.
A Nutrition Policy defined in legislation will inform other associated policies and will be influenced by this and drafted accordingly. With the evidence of the links between nutrition and health status, Nutrition Policies should now be defined clearly in all member states.
Nutritional fortification A unified practice of food fortification and monitoring of the incidence of related diseases impact, efficacy and side effects across the European Union.
Since fortification has been shown to have positive health benefits for a large proportion of the population a unified practice of food fortification is thus to be recommended
Sociodemographic/economic Age Percentage of population over the age of
71 years. The over 71 age group has a high morbidity and mortality thus the monitoring of the prevalence of this group in the population will help inform policy and development of health services.
Education Percentage of population with only elementary education and below.
The monitoring of the percentage of the population with only elementary education or below, will inform both the education and health policies.
Occupation Percentage of the adult population in manual occupations.
The monitoring of the percentage of the population in manual occupations can inform policy in many areas and changes can be targeted at these groups.
Household income Percentage of households with a total income below 50% of the median income of the country.
The percentage of the population with incomes below 50% of the median of the country’s income should be monitored, as this group have a high morbidity and mortality. The majority of the EU Member states measure household income in many of the routine surveys undertaken. This would thus be easy to implement.
Unemployment Percentage of the population that have been unemployed for more than 12 months.
The monitoring of the number of long term unemployed can indicate, the extent of a developing health problem and can therefore inform preventative policies.
Food and nutrient intake Consumption /Availability of vegetables (excl. potatoes and vegetable juice)
Average per capita adult intake of less than 300g/day
Higher intake of vegetables decreases risk of some cancers, CVD and NIDD and decreases weight gain
Consumption /Availability of fruit (excl. fruit juice)
Average per capita adult intake of less than 100g/day
Higher intake of fruit decreases risk of some cancers, CVD and NIDD and decreases weight gain
Consumption /Availability of fish
Diets that contain less than 200g of fatty fish a week
Oily fish contain essential fatty acids and increase the chances of recovery from myocardial infarction
Saturated fatty acid content of the typical diet
Average diet with a saturated fatty acid content of more than 10% of energy intake
High intake of fatty acids are associated with the development of CVD, and breast cancer
Consumption /Availability of meat and meat products
Average per capita adult intake of more than 80g red meat/day
High intake of red meat and processed meat is associated with colon cancer and may increase risk of CVD
Poly-unsaturated fatty acid content of the typical diet
Average diet with less than 7-8% of energy from PUFA
High intake is associated with risk of fatal CVD
Mono-unsaturated fatty acid content of the typical diet
Average diet with low MUFA High intake is associated with a decreased risk of fatal CVD
NSP content of the typical diet Average diet with less than 25g/d Higher intakes decrease the risk of colo-rectal cancer and decreases diet weight gain Vitamin content of the typical diet
Diet with levels of Vit C, D, E, folate and carotenoids below recommended levels
Increased risk of osteoporosis, osteomalacia and rickets and possible increased risk of cancer and CVD and neural tube defects
Mineral content of the typical diet
Diet with levels of Fe, I, Ca and Se below recommended levels
Risk of iron deficiency anaemia, iodine deficiency disease, osteoporosis osteomalacia and rickets and possible increased risk of cancer and CVD
Breastfeeding (bf) Initiation Total and exclusive bf at birth, i.e.
throughout the first 48 hrs of age Assesses initiation, which is determined by the hospital routines and overall support
28

Monitoring Public Health Nutrition in Europe
Indicator Operational measure Rational Duration Total breastfeeding at 6 months of age
(can be collected during routine check-up close to 6 months, giving the range of data collection)
Assesses duration
Quality Exclusive breastfeeding at 6 months of age (can be collected during routine check-up close to 6 months, giving the range of data collection)
Assesses duration of breastfeeding, follows up on recommendation
Alcohol Total consumption Total alcohol consumption per capita
per beverage category The major indicator of alcohol consumption is total alcohol consumption. Total alcohol consumption is composed of both recorded and unrecorded alcohol consumption.
Abstainers The share of abstainers in the total population
Inversely related to alcohol-related mortality in a population
The share of heavy drinkers in the total population
Related to prevalence of liver cirrhosis, accidents, homocides and total deaths in a country
The share of the total alcohol consumption consumed as an intoxicant
Related to prevalence of liver cirrhosis, accidents, homocides and total deaths in a country
The frequency of heavy drinking occasions (binge drinking)
As above, with generally stronger effects and increase in suicides in Northern European countries
Drinking Pattern
The share of total alcohol consumption consumed with meals
Related to prevalence of liver cirrhosis, accidents, homocides and total deaths in a country
Nutrient status Carotenoid status Retinol and total plasma carotenoids
levels of a representative sample of the population, in the routine nutritional surveys. Age-gender specific cut-off points to be determined
Measurement of this indicator would indicate the intake of fruit and vegetables. The consumption of low levels of fruit and vegetables is associated with increased incidence of cancers, cardiovascular disease late onset diabetes and obesity and is therefore associated with a higher health burden
Fatty acid profile Total plasma cholesterol and cholesterol fractions, fatty acid cholesterol esters levels of a representative sample of the population in the routine nutritional surveys. Age-gender specific cut-off points to be determined
Monitoring the lipid profiles of a sample of the population will therefore indicate the risk of coronary heart disease and also the general fatty acid content of diets. Serum cholesterol esters are suitable indices of the fatty acid pattern of individuals and populations
Folate status Erythrocyte folate levels of a representative sample of the population in the routine nutritional surveys. Age-gender specific cut-off points to be determined
Measurement of this indicator would highlight the risk of neural tube defects and chronic conditions such as cardio vascular disease e.g. ischaemic heart disease in the population. The possible role of folate status in carcinogenesis is currently under investigation
Selenium status Plasma selenium levels of a representative sample of the population in the routine nutritional surveys. Age-gender specific cut-off points to be determined
Some areas of Europe probably have a poor selenium status and this status is thus worth estimating. Measurement of selenium levels will highlight those geographical areas and members of the population at risk of related diseases
Iron status Haemoglobin, serum ferritin and serum transferrin receptor using appropriate cut off points by age and gender
Iron deficiency in various aspects is likely to be the most widespread deficiency in the EU
Vitamin D status Circulating levels of 25-hydroxy vitamin D 3 provide the most appropriate measure of vitamin D status
In toddlers and in adolescents from minority ethnic groups (especially from the Indian sub-continent) low vitamin D intake and lack of exposure to sunlight may precipitate rickets. Further, in older people with low exposure to sunlight, low vitamin D intake may lead to osteomalacia and osteoporosis and increased risk of bone fracture
Anthropometry Body composition (BMI) Height and weight, Waist/hip ratio,
Sagittal abdominal diameter Measures of body size and proportions are correlated with disease risk especially vascular diseases of the heart and brain and diabetes. Changes in body size and proportion have been shown to alter risk and so lend them-selves to programmes of health promotion
Physical activity and Fitness Level The total amount of activity expressed
either as activity energy expenditure or physical activity level (PAL)
Pattern Time (mins/day or week) spent at health enhancing physical activity level
Inactivity Time (mins/day or week) spent sitting
Physical activity is a complex behavior. Any activity can be described in terms such as intensity, frequency and duration, and these dimensions must be considered. An assessment methodology should also consider inactivity, such as time spent sitting. Physical activity can be related to work, transportation, home and leisure time. The activities at either of these domains may have specific health consequences, and advanced monitoring should also consider these. The International Physical Activity Questionnaire (IPAQ) fulfills all these requirements.
Determinants Environmental determinants for physical activity
An environmental module attached to IPAQ (see above) is internationally tested and evaluated, and includes a series of environmental determinants
Fitness Aerobic power, assessed using the UKK Walk Test 2 km, and other aspects of fitness tested using the UKK health related fitness test battery
The UKK Walk Test was developed especially to assess cardiovascular fitness by measuring its gold standard, maximal aerobic power (VO2 max). In later studies it was also found that the test reflects the functional capacity of the musculoskeletal system. Therefore, the UKK Walk Test is well suited for the assessment of health-related fitness among the general population. Other aspects of fitness, as described in the UKK health-related fitness test battery should also be assessed.
29

Monitoring Public Health Nutrition in Europe
COMPARISON OF RECOMMENDATIONS Table 4 compares the recommendations of this present report (EUPHN) with the following reports and the final column of Table 4 indicates the number of countries in which these indicators are at presently monitored. This “availability column” summarizes Table 2. Table 4. Comparison of recommendations from EUPHN, ECHI, EFCOSUM and Kunst et al EUPHN ECHI Kunst et al EFCOSUM Availability Nutrition Policy 8 Nutrition Intervention Fortification 11 Age (% elderly over 71) W 14 Occupation: % of adult population in manual occupation W W 14 Education: % of population with only elementary education or below W W 14 Income: % of population with income below 50% of median W W 14 Unemployment: % of population unemployed for more than 12 months W W 8 Food and Nutrient intake Total energy consumed W 13 Consumption /Availability of meat and meat products 13 Consumption /Availability of fish W W 13 Consumption /Availability of fruit W W 13 Consumption /Availability of vegetables W W 13 Consumption /Availability of fruit and vegetables - Saturated fatty acid content W W 11 NSP content 6 Vitamin content: Folate, Carotenoids W 12 Mineral content: Iron, Calcium, Iodine, Sodium and Selenium W 12 Measurement of alco l consumption holevels across Europe Coding and recoding of alcohol related illness W Monitoring alcohols role in disability W Drinking patterns and problems W Initiation of breastfeeding W 14 Prevalence of breastfeeding at 6 months 15 Prevalence of exclusive breastfeeding at 6 months W 11 Prevalence of exclusive breastfeeding at 12 months W 4 Carotenoid status W 7 Fatty acid profiles W 11 Folate status W 6 Selenium status W 5 Anthropometry 12 1. Design for a Set of European Community Health Indicators. Final report by the ECHI project, February, 2001 (ECHI). 2. Monitoring socio-economic inequalities in health in the EU. Guidelines and illustrations. February 2001. Anton E. Kunst, Vivian Bos, Johan P. Mackenbach. 3. European Food Consumption Survey Method. Final report. June 2001. EFCOSUM group (EFCOSUM).
30

Monitoring Public Health Nutrition in Europe
STANDARDIZED METHODS FOR COLLECTION Blood Samples This report recommends that the protocol developed by the WHO MONICA project and EPIC should be used for taking blood samples and estimation of lipids in the blood. The details of which can be found in Appendix VIII and with full references in the MONICA Manual and the EPIC protocol summary. Briefly, venipunctures should be carried out with the subject or patient in a sitting position. Prolonged venous occlusion can cause changes in the apparent concentrations of blood constituents Use of a tourniquet should therefore be avoided. If a good flow cannot be obtained in some subjects and the tourniquet has to be used, it must be released before the withdrawal of blood. Standardization of the position (sitting position is recommended) is necessary since plasma volume changes occur when a standing subject assumes a recumbent position Anthropometry This report recommends that height and weight measurements be taken in line with the protocol developed by the WHO MONICA project and EPIC. The details of which can be found in Appendix IX and with full references in the MONICA Manual and the EPIC protocol summary Briefly, measurements must be carried out on a hard floor surface (tile, cement, etc.) and must not be carpeted or be covered with other soft materials. If only a carpeted surface is available, a wooden platform should be laid down to serve as a floor. The participant is asked to remove his/her shoes and heavy outer garments. To measure height, the participant should stand with his/her back to the height rule. The back of the head, back, buttocks, calves and heels should be touching the upright, feet together. The top of the external auditory meatus (ear canal) should be level with the inferior margin of the bony orbit (cheek bone). The position is aided by asking participant to hold the head in a position where he/she can look straight at a spot, head high, on the opposite wall. The triangle is placed on the on the height rule and slides down to the head so that the hair (if present) is pressed flat. Information is recorded on a survey form to the nearest centimetre. For measuring weight, the use of balance scales is recommended. If the digital scales are used, testing with standard weights is of particular importance. The scale should be balanced with both weights at zero and the balance bar aligned. The participant should have removed his/her shoes and heavy outer garments (jacket, coat, etc.) and should stand in the centre of the platform as standing off-centre may affect measurement. The weights are moved until the beam balances (the arrows are aligned). The weight is read and recorded on the form. Weights are recorded to the nearest 200 g. Dietary Intake EFCOSUM have undertaken a study for the estimation of dietary intake. They concluded that the 24 hour recall method was the most suitable for comparisons between countries. The quality of the comparisons will improve if more than one 24hrs recall is obtained from each respondent, and will facilitate analyses of distribution of intakes which single 24hrs recalls will not. The protocol is described in Appendix X. The present report recommends the adoption of the EFCOSUM protocol for 24h recall (the “triple pass” method as described in Appendix X).
31
Monitoring Public Health Nutrition in Europe
Apart from dietary intake, in a system to monitor public health nutrition, monitoring of food availability is vital. A database such as DAFNE, which is based on household budget survey data, is an essential tool and should be extended to embrace all project countries
Alcohol No protocol was recommended for the measurement of individual alcohol intake in the Alcohol report. A protocol has therefore to be established for this indicator. This could be along the lines of the method used by ECAS, or the English survey carried out by the National Centre for Social Research, Survey of Smoking, Drinking and Drug use among School Children in England 2000 and 2001. Physical Activity The development of an international measure for physical activity, The International Physical Activity Questionnaire (IPAQ), commenced in Geneva in 1998 and was followed by extensive reliability and validity testing undertaken in 12 countries (14 sites) across six continents during 2000 (Appendix XIa). IPAQ was also tested in a number of European countries by the EUPASS project 2000-2002 (App. XIb). The final results suggest that these measures have acceptable measurement properties for use in many settings and in different languages. A scoring protocol has been written, and an optional environmental module has been developed (App. XIc,d). IPAQ is therefore recommended for use in the European Health Monitoring system. It has been used in EU Eurobarometer (2002) (App. XIe) and will be used by WHO, above all in the World Health Survey. International collaboration on IPAQ is on-going. Aerobic Fitness and other aspects of fitness The UKK Self Walk Test by the UKK Institute (www.ukkinstituutti.fi) is based on 2 km/1,24 miles brisk walk on a hard, even surface (Appendix XII). The test especially measures cardio-respiratory fitness. The result of the test is based on age, body mass index, walking time and your heart rate at the end of the walk. It tells how fit you are compared to others your age and gender. The resulting index corresponds to VO2max (ml/kg/min). The test has been designed for healthy persons between the ages of 20 and 65. It does not give dependable results for people outside this age range or for those who are highly fit. The test has been designed to be performed after a supervised test in order to get a reliable result. Other aspects of fitness should be tested as described in the UKK Health-related Fitness Test Battery.
32

Monitoring Public Health Nutrition in Europe
CONCLUSIONS Health surveys, Household Budget Surveys and Individual Dietary, Nutrition and Physical Activity Surveys are valuable tools for monitoring Public Health Nutrition. These surveys in many countries monitor the majority of the recommended indicators. However, no country covers all major indicators related to Public Health Nutrition. If a consistent approach is taken in future surveys, the establishment of a permanent and coherent Community monitoring system of Public Health Nutrition indicators will be possible. The monitoring of Public Health in Europe project will be well equipped to inform policy and predict outcomes in the field of Nutritional Public Health. In future, we recommend that all European countries, and/or the European Health Monitoring System, should add questions to their surveys, according to the list of recommended indicators presented by this project, to ensure that all the relevant areas of Public Health Nutrition are covered. This will allow for the valid measurement of nutritional health status, trends and determinants throughout the Community. This will make it possible to facilitate the planning, monitoring and evaluation of Community Programmes and Actions in the field of Public Health Nutrition, or even Public Health in a broader sense. This will also make it possible to provide Member States with appropriate information to support their national health policies. The DAFNE project, based on Household Budget Survey data has proved that much information useful for monitoring can be extracted from current available data. A key issue is to ensure the comparability of measurements, for which DAFNE has set a useful precedent. To ensure comparability in specific areas following suggestions have to be considered: a) The classification of socio-demographic measures needs to be standardized across countries in future monitoring procedures along the guidelines of Kunst et al. b) Dietary surveys need to include a detailed analysis of nutrients in the diet, including fatty acid composition, vitamin and mineral composition and the non-starch poly-saccharide content. The lack of comparable data on alcohol across the Member countries makes it difficult to formulate uniform recommendations and it is evident that much needs to be done in this field. In contrast, promising initiatives have already been taken in the area of breastfeeding. c) In the area of nutritional status, the monitoring of biomarkers needs to be extended and an accepted protocol for measuring the biomarkers should be followed by all member states. Such standard protocols have already been developed for the monitoring of physical activity and fitness level. A significantly more challenging task will then be to change food habits towards the recommended diet, to increase the incidence and duration of exclusive breastfeeding, and to increase the level of physical activity in the population. A project for the development of breastfeeding has already been initiatied by the Commission, based on experiences from the Eurodiet and the current projects. The EuroBarometer distributed in the autumn 2002 used indicators developed with the present project, and the collected data are currently under analyses. By the use of such data, and other data on nutritional status of the populations in the EU countries, using the indicators defined in the present project and the recommendations for data collection, formulation of common European strategies will hopefully be facilitated. (cont.)
33

Monitoring Public Health Nutrition in Europe
34
User Window in Nutrition The concept of a nutrition “user window” is useful. A number of the nutrition related indicators exist in other categories of the ECHI list (e.g. occupational class and income are key determinants of food purchasing and consumption; smoking has an impact on nutrient requirements and utilization). It is important to recognize that where a user window has been defined, the underlying principal should be that the indicators identified in that window should be collected concurrently from the same sample included in any study or survey so as to facilitate analyses linking the key variables. For example, it would be helpful to have information on smoking habits as well as socio-demographic data in household budget surveys in order to make a better assessment of the likely influence of nutrition on diet-related disease risks. Moreover, such data would have to be collected in compatible ways in every country to facilitate EU-wide analyses. ACKNOWLEDGEMENTS The Project Participants gratefully acknowledge the Commission for the financial support to the present project (Grant Agreement no SI2.291742/ 2001CVG3 – 507/). Special gratitude is directed to Henriette Chamouillet, for ever stimulating presence and devoted support, and to her successors Frederic Sicard for constructive discussions. The continuous guidance and encouraging support from Pieter Kramers, the ECHI project co-ordinator, is also fully acknowledged. A great number of academic scientists and public health experts are acknowledged representing national authorities and national and international organisations and NGOs all over Europe. They have contributed to the discussions with their knowledge and experiences and thereby contributed to the success of the project.

This report was produced by a contractor for Health & Consumer Protection Directorate General and represents the views of thecontractor or author. These views have not been adopted or in any way approved by the Commission and do not necessarilyrepresent the view of the Commission or the Directorate General for Health and Consumer Protection. The EuropeanCommission does not guarantee the accuracy of the data included in this study, nor does it accept responsibility for any use madethereof.