Monitoring Physical Threats - · PDF fileMonitoring Physical Threats in the Data Center ......
13
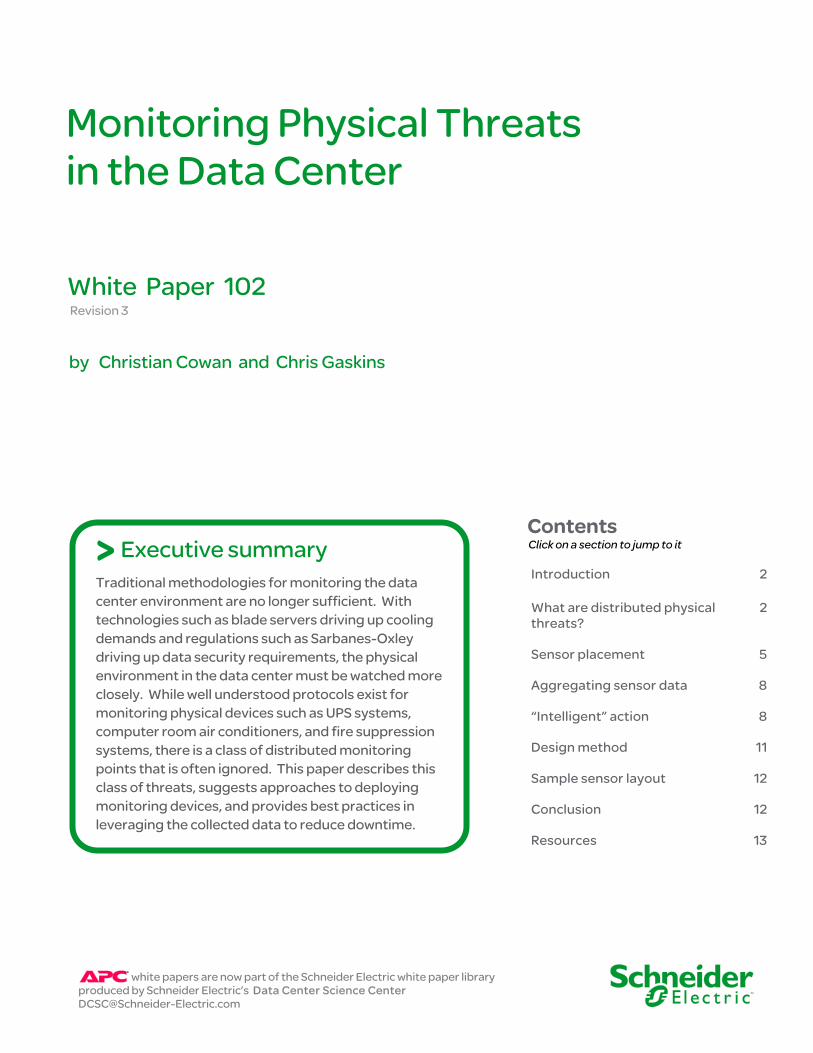
Monitoring Physical Threats in the Data Center Revision 3 by Christian Cowan and Chris Gaskins Introduction 2 What are distributed physical threats? 2 Sensor placement 5 Aggregating sensor data 8 “Intelligent” action 8 Design method 11 Sample sensor layout 12 Conclusion 12 Resources 13 Click on a section to jump to it Contents White Paper 102 Traditional methodologies for monitoring the data center environment are no longer sufficient. With technologies such as blade servers driving up cooling demands and regulations such as Sarbanes-Oxley driving up data security requirements, the physical environment in the data center must be watched more closely. While well understood protocols exist for monitoring physical devices such as UPS systems, computer room air conditioners, and fire suppression systems, there is a class of distributed monitoring points that is often ignored. This paper describes this class of threats, suggests approaches to deploying monitoring devices, and provides best practices in leveraging the collected data to reduce downtime. Executive summary > white papers are now part of the Schneider Electric white paper library produced by Schneider Electric’s Data Center Science Center [email protected]
Transcript of Monitoring Physical Threats - · PDF fileMonitoring Physical Threats in the Data Center ......
Monitoring Physical Threats in the Data Center
Revision 3
by Christian Cowan and Chris Gaskins
Introduction 2
What are distributed physical threats?
2
Sensor placement 5
Aggregating sensor data 8
“Intelligent” action 8
Design method 11
Sample sensor layout 12
Conclusion 12
Resources 13
Click on a section to jump to it Contents
White Paper 102
Traditional methodologies for monitoring the data center environment are no longer sufficient. With technologies such as blade servers driving up cooling demands and regulations such as Sarbanes-Oxley driving up data security requirements, the physical environment in the data center must be watched more closely. While well understood protocols exist for monitoring physical devices such as UPS systems, computer room air conditioners, and fire suppression systems, there is a class of distributed monitoring points that is often ignored. This paper describes this class of threats, suggests approaches to deploying monitoring devices, and provides best practices in leveraging the collected data to reduce downtime.
Executive summary>
white papers are now part of the Schneider Electric white paper libraryproduced by Schneider Electric’s Data Center Science Center [email protected]
Monitoring Physical Threats in the Data Center
Schneider Electric – Data Center Science Center White Paper 102 Rev 3 2
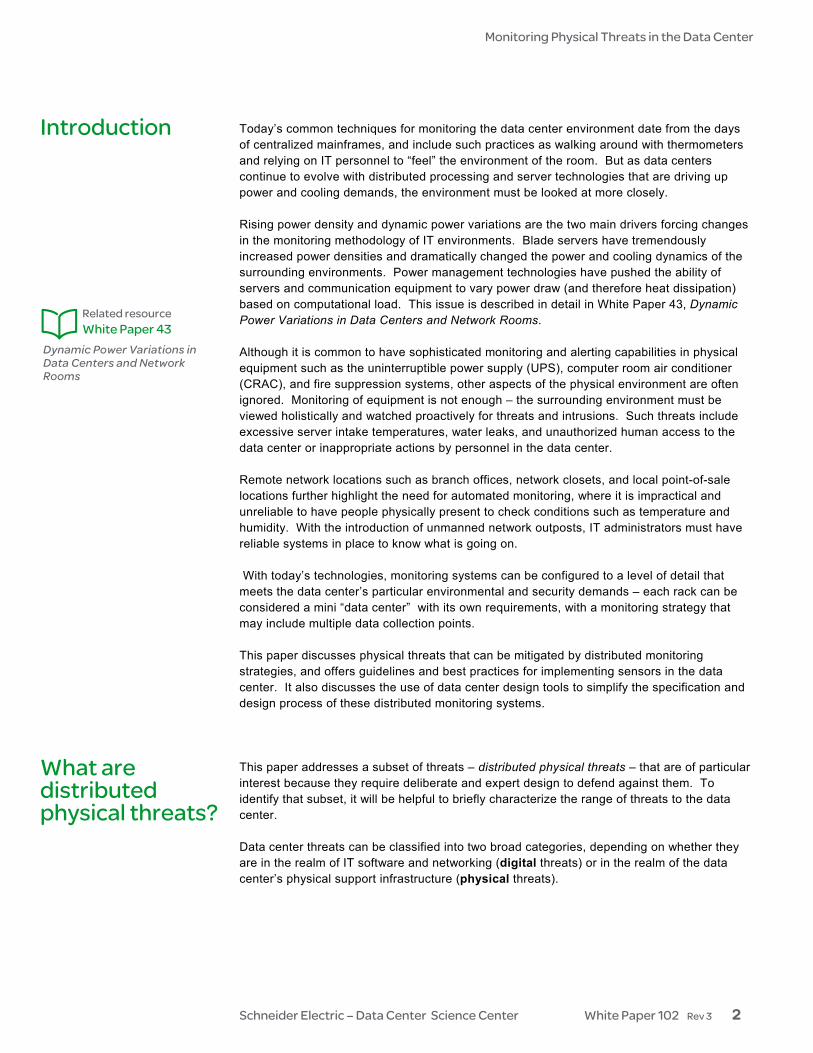
Today’s common techniques for monitoring the data center environment date from the days of centralized mainframes, and include such practices as walking around with thermometers and relying on IT personnel to “feel” the environment of the room. But as data centers continue to evolve with distributed processing and server technologies that are driving up power and cooling demands, the environment must be looked at more closely. Rising power density and dynamic power variations are the two main drivers forcing changes in the monitoring methodology of IT environments. Blade servers have tremendously increased power densities and dramatically changed the power and cooling dynamics of the surrounding environments. Power management technologies have pushed the ability of servers and communication equipment to vary power draw (and therefore heat dissipation) based on computational load. This issue is described in detail in White Paper 43, Dynamic Power Variations in Data Centers and Network Rooms. Although it is common to have sophisticated monitoring and alerting capabilities in physical equipment such as the uninterruptible power supply (UPS), computer room air conditioner (CRAC), and fire suppression systems, other aspects of the physical environment are often ignored. Monitoring of equipment is not enough – the surrounding environment must be viewed holistically and watched proactively for threats and intrusions. Such threats include excessive server intake temperatures, water leaks, and unauthorized human access to the data center or inappropriate actions by personnel in the data center. Remote network locations such as branch offices, network closets, and local point-of-sale locations further highlight the need for automated monitoring, where it is impractical and unreliable to have people physically present to check conditions such as temperature and humidity. With the introduction of unmanned network outposts, IT administrators must have reliable systems in place to know what is going on. With today’s technologies, monitoring systems can be configured to a level of detail that meets the data center’s particular environmental and security demands – each rack can be considered a mini “data center” with its own requirements, with a monitoring strategy that may include multiple data collection points. This paper discusses physical threats that can be mitigated by distributed monitoring strategies, and offers guidelines and best practices for implementing sensors in the data center. It also discusses the use of data center design tools to simplify the specification and design process of these distributed monitoring systems. This paper addresses a subset of threats – distributed physical threats – that are of particular interest because they require deliberate and expert design to defend against them. To identify that subset, it will be helpful to briefly characterize the range of threats to the data center. Data center threats can be classified into two broad categories, depending on whether they are in the realm of IT software and networking (digital threats) or in the realm of the data center’s physical support infrastructure (physical threats).
Introduction
Dynamic Power Variations in Data Centers and Network Rooms
Related resource White Paper 43
What are distributed physical threats?
Monitoring Physical Threats in the Data Center
Schneider Electric – Data Center Science Center White Paper 102 Rev 3 3
Digital threats Digital threats are such things as hackers, viruses, network bottlenecks, and other accidental or malicious assaults on the security or flow of data. Digital threats have a high profile in the industry and the press, and most data centers have robust and actively maintained systems, such as firewalls and virus checkers, to defend against them. White Paper 101, Fundamental Principles of Network Security, reviews the basic safeguards against digital threats. Digital threats are not the subject of this paper. Physical threats Physical threats to IT equipment include such things as power and cooling problems, human error or malice, fire, leaks, and air quality. Some of these, including threats related to power and some related to cooling and fire are routinely monitored by built-in capabilities of power, cooling, and fire suppression devices. For example, UPS systems monitor power quality, load, and battery health; PDUs monitor circuit loads; cooling units monitor input and output temperatures and filter status; fire suppression systems – the ones that are required by building codes – monitor the presence of smoke or heat. Such monitoring typically follows well understood protocols automated by software systems that aggregate, log, interpret, and display the information. Threats monitored in this way, by pre-engineered functionality designed into the equipment, do not require any special user expertise or planning in order to be effectively managed, as long as the monitoring and interpretation systems are well engineered. These automatically-monitored physical threats are a critical part of a compre-hensive management system, but are not the subject of this paper. However, certain kinds of physical threats in the data center – and they are serious ones – do not present the user with pre-designed, built-in monitoring solutions. For example, the threat of poor humidity levels can be anywhere in the data center, so the number and placement of humidity sensors is an important consideration in managing that threat. Such threats can potentially be distributed anywhere throughout the data center, at variable locations that are particular to room layout and equipment positioning. The distributed physical threats covered by this paper fall into these general categories: • Air quality threats to IT equipment (temperature, humidity)
• Liquid leaks
• Human presence or unusual activity
• Air quality threats to personnel (foreign airborne substances)
• Smoke and fire from data center hazards1
Figure 1 illustrates the distinction between digital and physical threats, and the further distinction in physical threats between those with pre-engineered equipment-based pow-er/cooling monitoring and – the subject of this paper – distributed physical threats that require assessment, decisions, and planning to determine the type, location, and number of monitor-ing sensors. It is this latter type of physical threat that may risk neglect because of lack of knowledge and expertise in designing an effective monitoring strategy.
1 Basic room smoke/fire detection required by building codes is governed by specific legal and safety
regulations, and is not the subject of this paper. This paper covers supplemental smoke detection particular to hazards in the data center, beyond what is required by building codes.
Fundamental Principles of Network Security
Related resource White Paper 101

Monitoring Physical Threats in the Data Center
Schneider Electric – Data Center Science Center White Paper 102 Rev 3 4
Table 1 summarizes distributed physical threats, their impact on the data center, and the types of sensors used to monitor them.
Figure 1 Threats to the data center

Monitoring Physical Threats in the Data Center
Schneider Electric – Data Center Science Center White Paper 102 Rev 3 5
Threat Definition Impact on data center Types of sensors
Air temperature Room, rack, and equipment air temperature
Equipment failure and reduced equipment life span from temperature above specification and/or drastic temperature changes
Temperature sensors
Humidity Room and rack relative humidity at specific temperature
Equipment failure from static electricity buildup at low humidity points Condensation formation at high humidity points
Humidity sensors
Liquid leaks Water or coolant leaks Liquid damage to floors, cabling and equipment Indication of CRAC problems
Rope leak sensors Spot leak sensors
Human error and personnel access
Unintentional wrongdoing by personnel Unauthorized and/or forced entry into the data center with malicious intent
Equipment damage and data loss Equipment downtime Theft and sabotage of equipment
Digital video cameras Motion sensors Door contacts Glass-break sensors Vibration sensors
Smoke / Fire Electrical or material fire Equipment failure Loss of assets and data
Supplemental smoke sensors
Hazardous airborne contaminants
Airborne chemicals such as hydrogen from batteries and particles such as dust
Dangerous situation for personnel and/or UPS unreliability and failure from release of hydrogen Equipment failure from increased static electricity and clogging of filters/fans from dust buildup
Chemical / hydrogen sensors Dust sensors
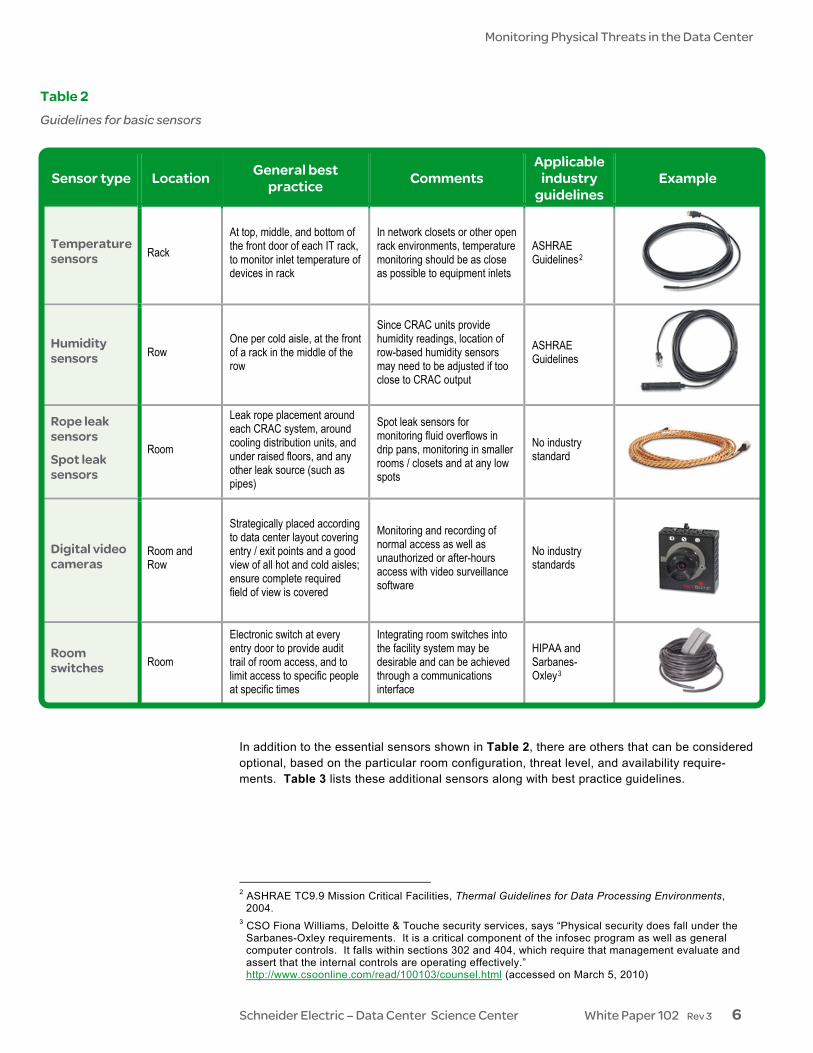
Various types of sensors can be used to provide early warning of trouble from the threats described above. While the specific type and number of sensors may vary depending upon budget, threat risk, and the business cost of a breach, there is a minimum essential set of sensors that makes sense for most data centers. Table 2 shows guidelines for this basic recommended set of sensors.
Table 1 Distributed physical threats
Sensor placement
Monitoring Physical Threats in the Data Center
Schneider Electric – Data Center Science Center White Paper 102 Rev 3 6
Sensor type Location General best practice Comments
Applicable industry
guidelines Example
Temperature sensors Rack
At top, middle, and bottom of the front door of each IT rack, to monitor inlet temperature of devices in rack
In network closets or other open rack environments, temperature monitoring should be as close as possible to equipment inlets
ASHRAE Guidelines2
Humidity sensors Row
One per cold aisle, at the front of a rack in the middle of the row
Since CRAC units provide humidity readings, location of row-based humidity sensors may need to be adjusted if too close to CRAC output
ASHRAE Guidelines
Rope leak sensors
Spot leak sensors
Room
Leak rope placement around each CRAC system, around cooling distribution units, and under raised floors, and any other leak source (such as pipes)
Spot leak sensors for monitoring fluid overflows in drip pans, monitoring in smaller rooms / closets and at any low spots
No industry standard
Digital video cameras
Room and Row
Strategically placed according to data center layout covering entry / exit points and a good view of all hot and cold aisles; ensure complete required field of view is covered
Monitoring and recording of normal access as well as unauthorized or after-hours access with video surveillance software
No industry standards
Room switches Room
Electronic switch at every entry door to provide audit trail of room access, and to limit access to specific people at specific times
Integrating room switches into the facility system may be desirable and can be achieved through a communications interface
HIPAA and Sarbanes-Oxley3
In addition to the essential sensors shown in Table 2, there are others that can be considered optional, based on the particular room configuration, threat level, and availability require-ments. Table 3 lists these additional sensors along with best practice guidelines.
2 ASHRAE TC9.9 Mission Critical Facilities, Thermal Guidelines for Data Processing Environments,
2004. 3 CSO Fiona Williams, Deloitte & Touche security services, says “Physical security does fall under the
Sarbanes-Oxley requirements. It is a critical component of the infosec program as well as general computer controls. It falls within sections 302 and 404, which require that management evaluate and assert that the internal controls are operating effectively.” http://www.csoonline.com/read/100103/counsel.html (accessed on March 5, 2010)
Table 2 Guidelines for basic sensors

Monitoring Physical Threats in the Data Center
Schneider Electric – Data Center Science Center White Paper 102 Rev 3 7
Sensor type Location General best practice Comments
Applicable industry
guidelines Example
Supplemental smoke sensors
Rack
Rack level “very early smoke detection" (VESD) to provide advanced warning of problems in highly critical areas or areas without dedicated smoke sensors4
When rack-level supplemental smoke detection exceeds budget, placing VESD on the input of each CRAC provides some degree of early warning
No industry standards
Chemical / hydrogen sensors
Room
When VRLA batteries are located in the data center, it is not necessary to place hydrogen sensors in the room because they do not release hydrogen in normal operation (as wet cell batteries do)
Wet cell batteries in a separate battery room are subject to special code requirements
Draft IEEE / ASHRAE Guide5
Motion sensors
Room and Row
Used when budget constraints don’t allow for digital camera installation, which is best practice (see Table 2)
Motion sensors are a lower cost alternative to digital video cameras for monitoring human activity
No industry standards
Rack switches Rack
In high traffic data centers, electronic switches on the front and rear door of every rack to provide audit trail of access and to limit critical equipment access to specific people at specific times
Integrating rack switches into the facility system may be desirable and can be achieved through a communications interface
HIPPA and Sarbanes-Oxley
Vibration sensors Rack
In high traffic data centers, vibration sensor in each rack to detect unauthorized installation or removal of critical equipment
Vibration sensors in each rack can also be used to sense when people move racks
No industry standards
Glass-break sensors Room
Glass-break sensor on every data center window (either external, or internal to hallway or room)
Best if used in conjunction with video surveillance cameras
No industry standards
4 Assumes the existence of a separate fire detection system to meet building codes 5 IEEE/ASHRAE, Guide for the Ventilation and Thermal Management of Stationary Battery Installations,
Draft out for ballot later in 2006
Table 3 Guidelines for additional, situation-dependent sensors
Monitoring Physical Threats in the Data Center
Schneider Electric – Data Center Science Center White Paper 102 Rev 3 8
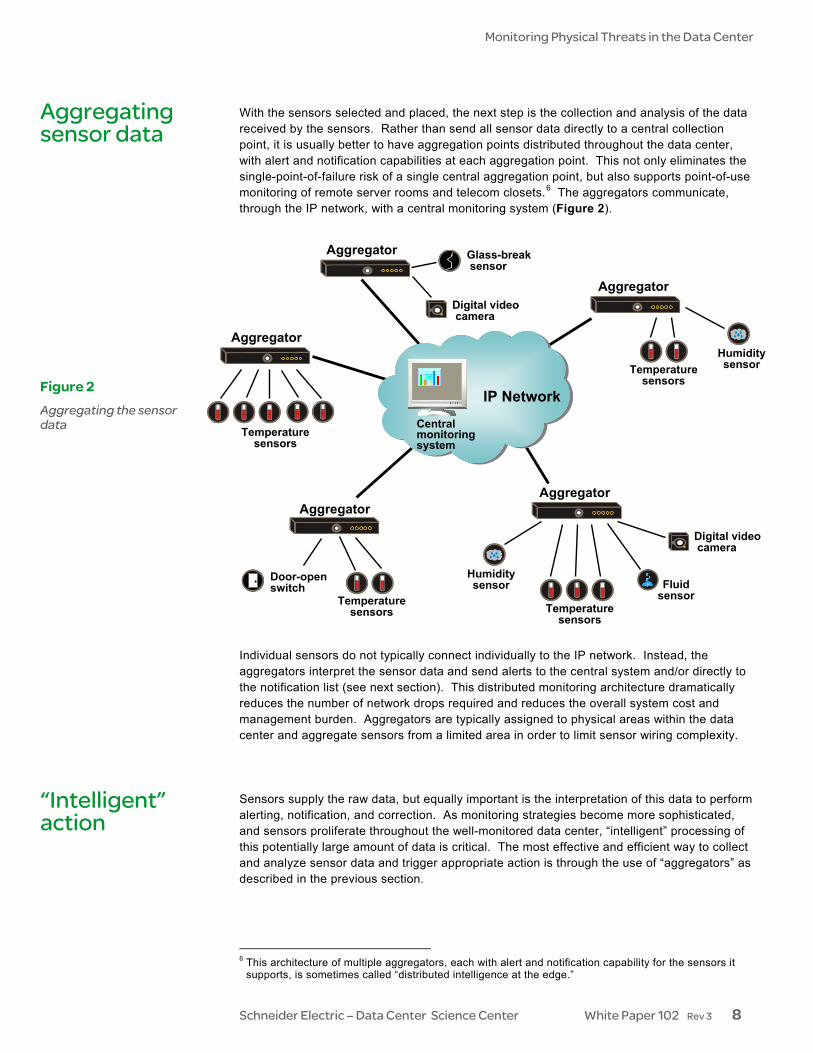
With the sensors selected and placed, the next step is the collection and analysis of the data received by the sensors. Rather than send all sensor data directly to a central collection point, it is usually better to have aggregation points distributed throughout the data center, with alert and notification capabilities at each aggregation point. This not only eliminates the single-point-of-failure risk of a single central aggregation point, but also supports point-of-use monitoring of remote server rooms and telecom closets.6 The aggregators communicate, through the IP network, with a central monitoring system (Figure 2). Individual sensors do not typically connect individually to the IP network. Instead, the aggregators interpret the sensor data and send alerts to the central system and/or directly to the notification list (see next section). This distributed monitoring architecture dramatically reduces the number of network drops required and reduces the overall system cost and management burden. Aggregators are typically assigned to physical areas within the data center and aggregate sensors from a limited area in order to limit sensor wiring complexity. Sensors supply the raw data, but equally important is the interpretation of this data to perform alerting, notification, and correction. As monitoring strategies become more sophisticated, and sensors proliferate throughout the well-monitored data center, “intelligent” processing of this potentially large amount of data is critical. The most effective and efficient way to collect and analyze sensor data and trigger appropriate action is through the use of “aggregators” as described in the previous section.
6 This architecture of multiple aggregators, each with alert and notification capability for the sensors it
supports, is sometimes called “distributed intelligence at the edge.”
Aggregating sensor data
..
Aggregator Glass-break sensor
Digital video camera
Temperaturesensors
Humiditysensor
Door-openswitch Fluid
sensor
Aggregator
AggregatorAggregator
Aggregator
Temperaturesensors
Temperaturesensors Temperature
sensors
Digital video camera
IP Network
Centralmonitoringsystem
Humiditysensor
Figure 2 Aggregating the sensor data
“Intelligent” action
Monitoring Physical Threats in the Data Center
Schneider Electric – Data Center Science Center White Paper 102 Rev 3 9
It is essential to be able to filter, correlate, and evaluate the data to determine the best course of action when out-of-bounds events occur. Effective action means alerting the right people, via the right method, with the right information. Action is taken in one of three ways: • Alerting on out-of-bounds conditions that could threaten specific devices, racks, or the
data center as a whole
• Automatic action based on specified alerts and thresholds
• Analysis and reporting to facilitate improvements, optimization, and fault / failure measurements
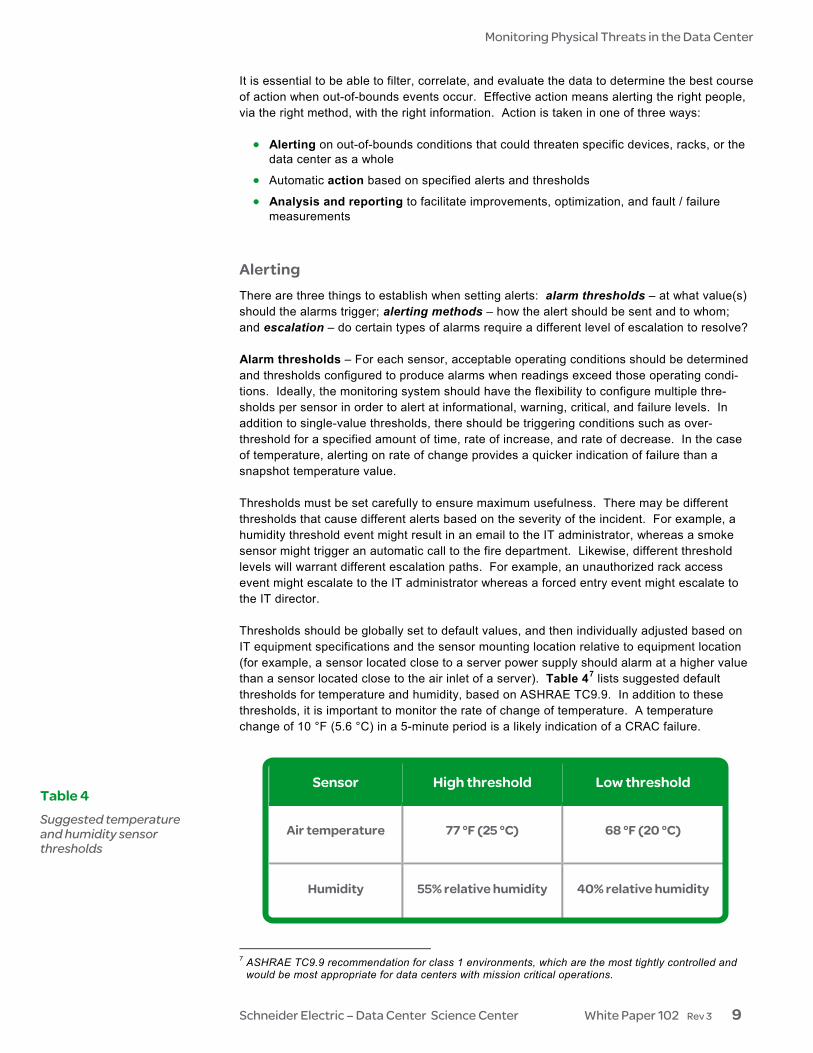
Alerting There are three things to establish when setting alerts: alarm thresholds – at what value(s) should the alarms trigger; alerting methods – how the alert should be sent and to whom; and escalation – do certain types of alarms require a different level of escalation to resolve? Alarm thresholds – For each sensor, acceptable operating conditions should be determined and thresholds configured to produce alarms when readings exceed those operating condi-tions. Ideally, the monitoring system should have the flexibility to configure multiple thre-sholds per sensor in order to alert at informational, warning, critical, and failure levels. In addition to single-value thresholds, there should be triggering conditions such as over-threshold for a specified amount of time, rate of increase, and rate of decrease. In the case of temperature, alerting on rate of change provides a quicker indication of failure than a snapshot temperature value. Thresholds must be set carefully to ensure maximum usefulness. There may be different thresholds that cause different alerts based on the severity of the incident. For example, a humidity threshold event might result in an email to the IT administrator, whereas a smoke sensor might trigger an automatic call to the fire department. Likewise, different threshold levels will warrant different escalation paths. For example, an unauthorized rack access event might escalate to the IT administrator whereas a forced entry event might escalate to the IT director. Thresholds should be globally set to default values, and then individually adjusted based on IT equipment specifications and the sensor mounting location relative to equipment location (for example, a sensor located close to a server power supply should alarm at a higher value than a sensor located close to the air inlet of a server). Table 47 lists suggested default thresholds for temperature and humidity, based on ASHRAE TC9.9. In addition to these thresholds, it is important to monitor the rate of change of temperature. A temperature change of 10 °F (5.6 °C) in a 5-minute period is a likely indication of a CRAC failure.
7 ASHRAE TC9.9 recommendation for class 1 environments, which are the most tightly controlled and
would be most appropriate for data centers with mission critical operations.
Sensor High threshold Low threshold
Air temperature 77 °F (25 °C) 68 °F (20 °C)
Humidity 55% relative humidity 40% relative humidity
Table 4 Suggested temperature and humidity sensor thresholds
Monitoring Physical Threats in the Data Center
Schneider Electric – Data Center Science Center White Paper 102 Rev 3 10
Alerting methods – Alert information can be dispatched in a variety of different ways such as email, SMS text messages, SNMP traps, and posts to HTTP servers. It is important that the alerting systems be flexible and customizable so that the right amount of information is successfully delivered to the intended recipient. Alert notifications should include information such as the user-defined name of the sensor, sensor location, and date/time of alarm. Alert escalation – Some alarms may require immediate attention. An intelligent monitoring system should be able to escalate specific alarms to higher levels of authority if the issue is not resolved within a specified amount of time. Alert escalation helps to ensure that problems are addressed on a timely basis, before small issues cascade into larger issues. The following are examples of both useful and not-so-useful alerts: Temperature sensor #48 is over threshold – Not very useful since it doesn’t indicate where sensor #48 is located Web server X is in danger of overheating – More useful since the specific server is identified Door sensor has been activated – Not very useful since the specific door was not identified Door X at location Y has been opened, and a picture of the person opening the door was captured – Very useful since it includes the door identification, door location, and a photo-graph of the incident Acting on data Collecting sensor data is only the first step, and if the data center manager relies on manual response alone, the data will not be leveraged to maximum advantage. There are systems available that act automatically based on user-specified alerts and thresholds. In order to implement such “smart” automation, the following must be assessed: Alert actions – Based on the severity level of an alert, what automated actions should take place? These automated actions could be personnel notifications, or they could be corrective actions such as triggering dry contact points to turn on or off devices such as fans or pumps. Ongoing real-time visibility of sensor data – The ability to view individual sensor “snap-shot” readings is a basic requirement. However, the ability to view individual sensor trends in real time provides a much better “picture” of the situation. Interpretation of these trends allows administrators to detect broader issues and correlate data from multiple sensors. Alerting systems should provide more than just basic threshold violation notifications. For example, some monitoring systems allow administrators to include additional data with the alerts. This additional data might be captured video, recorded audio, graphs, and maps. A rich alerting system of this type allows administrators to make more informed decisions because of the contextual data included with the alert. In some cases, too much information may need to be distilled to what is useful. For example, in a high-traffic data center, it would be a nuisance to have an alert every time there was motion in the data center. There may be instances where certain information is blocked out or “masked” in the interest of security. For example, a video including the view of a keyboard could block out individuals typing pass-words. The following are examples of “intelligent” interpretation and action: • On a temperature threshold breach, automatically turn on a fan or CRAC
• Remotely provide access to specific racks with electronic door locks, based on whose face is on real-time video surveillance

Monitoring Physical Threats in the Data Center
Schneider Electric – Data Center Science Center White Paper 102 Rev 3 11
• When water is detected in a remote data center, automatically turn on a sump pump
• When motion is detected in the data center after normal hours of operation, automatical-ly capture video and alert the security guards
• When a glass break is detected after hours, notify security guards and sound audible alarm
• When a door switch indicates that a rack door has been open for more than 30 minutes (indicating the door was not closed properly) send alarm to administrator to check the door
Analysis and reporting Intelligent monitoring systems should include not only short term trending of sensor data, but also long term historical data as well. Best-of-breed monitoring systems should have access to sensor readings from weeks, months, or even years past and provide the ability to produce graphs and reports of this data. The graphs should be able to present multiple types of sensors on the same report for comparison and analysis. The reports should be able to provide low, high, and average sensor readings in the selected time frame across various groups of sensors. Long term historical sensor information can be used in a variety of ways – for example, to illustrate that the data center is at capacity not because of physical space, but due to inadequate cooling. Such information could be used to extrapolate future trends as more and more equipment is added to a data center, and could help predict when the data center will reach capacity. Long term trending analysis could be used at the rack level to compare how equipment from different manufacturers in different racks produce more heat or run cooler, which may influence future purchases. Sensor readings captured by the monitoring system should be exportable to industry-standard formats, enabling the data to be used in off-the-shelf as well as custom reporting and analysis programs. While the specification and design of a threat monitoring system may appear complex, the process can be automated with data center design tools such as APC’s InfraStruXure Designer. Design tools such as this allow the user to input a simple list of preferences, and can automatically locate the appropriate number of sensors and aggregation devices. Summary reports provide parts lists and installation instructions for the recommended sensors. These data center design tools use algorithms and established rules based on best practices and industry standards to recommend specific configurations based on density, room layout, room access policies, and user-specific monitoring requirements. For example, the following user-specified preferences might influence the design of the threat monitoring system, based on the level of data center traffic and access: • High traffic / access – If the data center is accessed by many individuals, each with
different applications and functions in the data center, the design tool would suggest rack switches on every rack to allow access only to individuals needing access to the respective racks.
• Low traffic / access – If the data center is accessed by a select few individuals, each with responsibility for all data center functions, the design tool would not suggest rack switches to control access to separate racks; rather, a room door switch would be suffi-cient to limit access to the room by other individuals.
Design method

Monitoring Physical Threats in the Data Center
Schneider Electric – Data Center Science Center White Paper 102 Rev 3 12
A sample data center layout is shown in Figure 3, illustrating where monitoring devices would be located based on the best practices described in this paper. Safeguarding against distributed physical threats is crucial to a comprehensive security strategy. While the placement and methodology of sensing equipment requires assessment, decision, and design, best practices and design tools are available to assist in effective sensor deployment. In addition to proper type, location, and number of sensors, software systems must also be in place to manage the collected data and provide logging, trend analysis, intelligent alert notifications, and automated corrective action where possible. Understanding the techniques for monitoring distributed physical threats enables the IT administrator to fill critical gaps in overall data center security, and to keep physical security aligned with changing data center infrastructure and availability goals.
Conclusion
Sample sensor layout
Figure 3 Sample sensor layout
Special thanks to Christian Cowan and Chris Gaskins for authoring the original content of this white paper.
Acknowledgements

Monitoring Physical Threats in the Data Center
Schneider Electric – Data Center Science Center White Paper 102 Rev 3 13
Dynamic Power Variations in Data Centers and Network Rooms White Paper 43
Fundamental Principles of Network Security White Paper 101
Resources Click on icon to link to resource
tools.apc.com
Browse all TradeOff Tools™
Browse all white papers whitepapers.apc.com
For feedback and comments about the content of this white paper: Data Center Science Center [email protected] If you are a customer and have questions specific to your data center project: Contact your Schneider Electric representative
Contact us