Redalyc.Hydrogeologic monitoring of the Paraíba do Sul ... · monitoring of the Paraíba do Sul...
28
Ambiente & Água - An Interdisciplinary Journal of Applied Science ISSN: 1980-993X [email protected] Universidade de Taubaté Brasil Nobile Diniz, Hélio; Galina, Márcia Helena; dos Santos Targa, Marcelo; Teixeira Batista, Getulio; de Figueiredo Lindenberg, Mariuza Hydrogeologic monitoring of the Paraíba do Sul river floodplain area subject to sand mining in the Tremembé municipality, SP, Brazil Ambiente & Água - An Interdisciplinary Journal of Applied Science, vol. 6, núm. 3, 2011, pp. 43-69 Universidade de Taubaté Taubaté, Brasil Available in: http://www.redalyc.org/articulo.oa?id=92821301003 How to cite Complete issue More information about this article Journal's homepage in redalyc.org Scientific Information System Network of Scientific Journals from Latin America, the Caribbean, Spain and Portugal Non-profit academic project, developed under the open access initiative
Transcript of Redalyc.Hydrogeologic monitoring of the Paraíba do Sul ... · monitoring of the Paraíba do Sul...

Ambiente & Água - An Interdisciplinary Journal
of Applied Science
ISSN: 1980-993X
Universidade de Taubaté
Brasil
Nobile Diniz, Hélio; Galina, Márcia Helena; dos Santos Targa, Marcelo; Teixeira Batista, Getulio; de
Figueiredo Lindenberg, Mariuza
Hydrogeologic monitoring of the Paraíba do Sul river floodplain area subject to sand mining in the
Tremembé municipality, SP, Brazil
Ambiente & Água - An Interdisciplinary Journal of Applied Science, vol. 6, núm. 3, 2011, pp. 43-69
Universidade de Taubaté
Taubaté, Brasil
Available in: http://www.redalyc.org/articulo.oa?id=92821301003
How to cite
Complete issue
More information about this article
Journal's homepage in redalyc.org
Scientific Information System
Network of Scientific Journals from Latin America, the Caribbean, Spain and Portugal
Non-profit academic project, developed under the open access initiative

Revista Ambiente & Água - An Interdisciplinary Journal of Applied Science: v. 6, n. 3, 2011.
ISSN = 1980-993X – doi:10.4136/1980-993X www.ambi-agua.net
E-mail: [email protected] Tel.: (12) 3625-4212
Hydrogeologic monitoring of the Paraíba do Sul river floodplain area subject to sand mining in the Tremembé municipality, SP, Brazil
(http://dx.doi.org/10.4136/ambi-agua.740)
Hélio Nobile Diniz1; Márcia Helena Galina1; Marcelo dos Santos Targa2; Getulio Teixeira Batista2;
Mariuza de Figueiredo Lindenberg2
1Instituto Geológico do Estado de São Paulo – IG/SMA, São Paulo, SP
e-mail: [email protected]; e-mail: [email protected];
2Universidade de Taubaté, Taubaté, SP e-mail: [email protected];
e-mail: [email protected]; e-mail: [email protected]
ABSTRACT To characterize the geological, hydrogeological, hydrochemical, and hydrobacterial
aspects of the surface and groundwater in the floodplain of the Paraíba do Sul river in Tremembé municipality, the water levels of the Quaternary sedimentary aquifer experimental site was monitored based on four wells and eight associated piezometers with daily measures of water levels in continuous operation since December 3, 2009. In addition, data from a modular weather station in operation since March 2010 and data from the quality of surface water and groundwater have been analyzed in the period between March 2010 and March 2011. The water balance between April 2010 and March 2011 was estimated to verify the periods of water deficiency and excess. Data loggers installed in the piezometers enabled daily groundwater levels monitoring to establish the influence of the Paraíba do Sul river in the water levels of the Quaternary sedimentary aquifer and also they allowed the determination of the water loss to the atmosphere. A hydrogeological model with simplified equations, based on hydraulics parameters obtained in the wells pump tests, was implemented to calculate the amount of daily evapotranspiration and the average distance of the water loss from the wells to the atmosphere. An evaporation rate of 83.4 m3/h from the open-pit sand mine located at 212.2 m and of 89.2 m3/h for the one at 885.0 m average distance from the monitoring wells were observed. Chemical and bacteriological analysis involving multiple parameters were performed in the period from March 2010 to March 2011 in groundwater collected in wells, in the open-pit mines and in the waters of the Paraíba do Sul river. The results allowed to observe the influences of the Paraíba do Sul river as well as the contamination from fertilizers and pesticides from the agriculture practiced in the floodplain area on the quality of the groundwater.
Keywords: Quaternary sedimentary aquifer; floodplain; monitoring; piezometers.
DINIZ, H. N.; GALINA, M. H.; TARGA, M. S.; BATISTA G. T.; LINDENBERG, M. F. Hydrogeologic monitoring of the Paraíba do Sul river floodplain area subject to sand mining in the Tremembé municipality, SP, Brazil. Ambi-Agua, Taubaté, v. 6, n. 3, p. 43-69, 2011. (http://dx.doi.org/10.4136/ambi-agua.740)
44
Monitoramento hidrogeológico da área da várzea do rio Paraíba do Sul sujeita à extração de areia, no município de Tremembé, SP, Brasil
RESUMO Por meio de uma estação experimental de monitoramento dos níveis d´água do aquífero
sedimentar quaternário formada por 4 poços e 8 piezômetros associados, com medidas de níveis d´água diários, em operação desde 3 de dezembro de 2009, além de uma estação meteorológica modular em operação desde março de 2010, e análises mensais da qualidade das águas superficiais e subterrâneas no período entre março de 2010 e março de 2011, permitiram caracterizar, sob o aspecto geológico, hidrogeológico, hidroquímico, bacteriológico e hidroclimático, as águas superficiais e subterrâneas da várzea do rio Paraíba do Sul, no município de Tremembé. Um balanço hidroclimático que mostra os períodos de deficiência e excedente hídrico foi realizado para o período de abril de 2010 e março de 2011. O monitoramento diário dos piezômetros possibilitou estabelecer as influências do rio Paraíba do Sul nos níveis d´água do aquífero sedimentar quaternário e, também, dimensionar a perda d´água subterrânea por evopotranspiração nas cavas abertas para mineração de areia na área da várzea. Um modelo hidrogeológico com equações simplificadas, com base em parâmetros hidrodinâmicos obtidos em testes de vazão, foi dimensionado para cálculo da quantidade de evapotranspiração e da distância média de onde ocorre essa perda de água. Foi feita a análise das vazões médias para as cavas situadas a 212,2 m e 885,0 m de distância dos poços monitorados. Análises químicas e bacteriológicas, englobando diversos parâmetros, foram efetuadas mensalmente para o período de março de 2010 a março de 2011, nas águas dos poços, das cavas e do rio Paraíba do Sul. Os resultados obtidos foram comparados e as influências do rio Paraíba do Sul na qualidade das águas superficiais e subterrâneas foi estabelecida, assim como a contaminação oriunda dos fertilizantes e defensivos agrícolas utilizados na área da várzea do rio Paraíba do Sul.
Palavras-chave: aquífero sedimentar quaternário; várzea do Paraíba do Sul; monitoramento; piezômetros.
1. INTRODUCTION
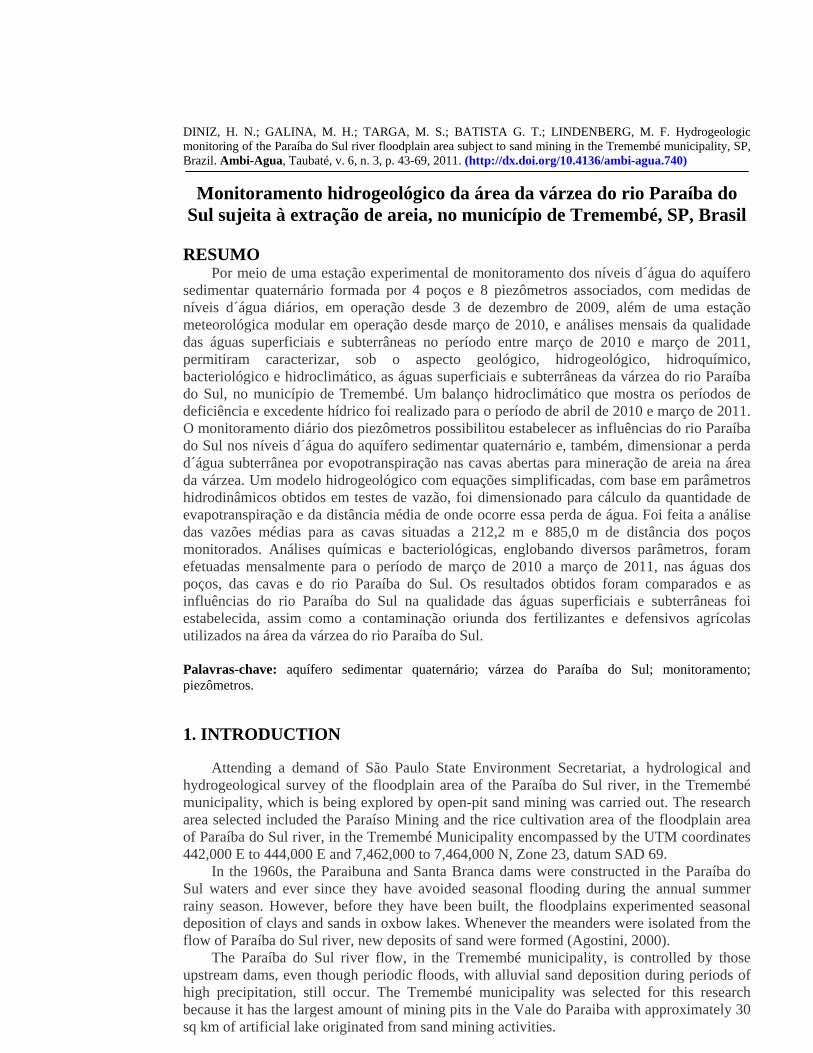
Attending a demand of São Paulo State Environment Secretariat, a hydrological and hydrogeological survey of the floodplain area of the Paraíba do Sul river, in the Tremembé municipality, which is being explored by open-pit sand mining was carried out. The research area selected included the Paraíso Mining and the rice cultivation area of the floodplain area of Paraíba do Sul river, in the Tremembé Municipality encompassed by the UTM coordinates 442,000 E to 444,000 E and 7,462,000 to 7,464,000 N, Zone 23, datum SAD 69.
In the 1960s, the Paraibuna and Santa Branca dams were constructed in the Paraíba do Sul waters and ever since they have avoided seasonal flooding during the annual summer rainy season. However, before they have been built, the floodplains experimented seasonal deposition of clays and sands in oxbow lakes. Whenever the meanders were isolated from the flow of Paraíba do Sul river, new deposits of sand were formed (Agostini, 2000).
The Paraíba do Sul river flow, in the Tremembé municipality, is controlled by those upstream dams, even though periodic floods, with alluvial sand deposition during periods of high precipitation, still occur. The Tremembé municipality was selected for this research because it has the largest amount of mining pits in the Vale do Paraiba with approximately 30 sq km of artificial lake originated from sand mining activities.

DINIZ, H. N.; GALINA, M. H.; TARGA, M. S.; BATISTA G. T.; LINDENBERG, M. F. Hydrogeologic monitoring of the Paraíba do Sul river floodplain area subject to sand mining in the Tremembé municipality, SP, Brazil. Ambi-Agua, Taubaté, v. 6, n. 3, p. 43-69, 2011. (http://dx.doi.org/10.4136/ambi-agua.740)
45
Figure 1. Location of the research area, installed wells, automatic weather station and the position of the cross section A-B.
For sampling the floodplain of the Paraíba do Sul river groundwaters, five shallow wells
were drilled. Next to each well, two piezometers were drilled to serve as groundwater levels point of observation during the pump tests conducted in the wells for determination of the Quaternary sedimentary aquifer transmissivity and storage coefficient. Later, these piezometers were used to monitor the water table level. Surveys conducted in the area for mineral exploration of sands deposits performed by the Paraíso Mining, involved 170 perforations. The analyses revealed that the soil consists of black organic clay with an average depth of 2 m, minimum of 0 and 6.9 m maximum, being 0.6 to 3.4 m clay layer depths the most frequent. Below this layer, Quaternary clayey sand deposits that are white-yellowish at the top occur, becoming fine sand grayish at the base, with an average thickness of 6.4 m, minimum 0.5 m and 9.6 m maximum, occurring mostly between 5 m and 7.8 m. There is evidence that these top deposits constituted of fluvial and lacustrine clayey sand have been formed in climate colder and drier than present conditions.
A compact weather station was installed due to the necessity of hydroclimatic monitoring, which is absent in the area. Furthermore, surface and underground water use by the sand mining activities is considerable especially due to the high rates of evaporation (Reis et al. 2006a, 2006b).
2. MATERIAL AND METHODS
The methodological procedures involved the construction and installation of equipments, laboratorial analyses and office work. Analysis of surface water infiltration, assessment of physical indices, knowledge of the standard penetration resistance (SPT), drilling to collect
DINIZ, H. N.; GALINA, M. H.; TARGA, M. S.; BATISTA G. T.; LINDENBERG, M. F. Hydrogeologic monitoring of the Paraíba do Sul river floodplain area subject to sand mining in the Tremembé municipality, SP, Brazil. Ambi-Agua, Taubaté, v. 6, n. 3, p. 43-69, 2011. (http://dx.doi.org/10.4136/ambi-agua.740)
46
samples, discharge pump tests in wells and monitoring of water levels in the Quaternary sedimentary aquifer were performed using data logers in the installed piezometers. Monthly water quality analyses in wells, rivers and open-pit sand mine were performed during one year, in the period between March 2010 and March 2011.
2.1. Hydroclimatic monitoring In order to obtain the water balance, a compact weather station, NovaLynx™ was
installed in the foodplain of Paraíba do Sul river area located near the Paradise Mining headquarters, on Kanegai road, 2501, at Rio Verde neighbourhood, Tremembé municipality (Figure 1).
The installed equipments consisted of a rain gauge, model 260-7852, a temperature and humidity meter, model 225-THT-1, a barometric pressure meter, model 110-WS-16BP, a net solar radiation, model 240-8110 and a sunshine hours logger, model 240-CSD3.
The hydro-climatic measurements began on 20 February 2010. The equipments were calibrated to collect data hourly. For data storage, a datalogger NovaLynx™ model 195-WS-16 was installed, capable of registering data from all installed equipments. The readings of digital equipments were downloaded monthly, via RS232C cable installed in portable PC running on Windows XP™. The data logger was installed in a concrete box of dimensions 0.6 x 0.6 x 0.6 m, and had a metallic door to access controls.
Power supply (110 V) was furnished by the Paraíso Mining Company. To ensure continuous operation, a battery coupled to a no-break for 48 hours uninterruptible power supply of continuous operation was installed with surge protectors in order to avoid damages on the equipments. The weather station was properly grounded to prevent burning by atmospheric lightning.
2.2. Wells and piezometers monitoring Four wells were drilled in 2009 and cased with geomechanical PVC pipes of 4"in
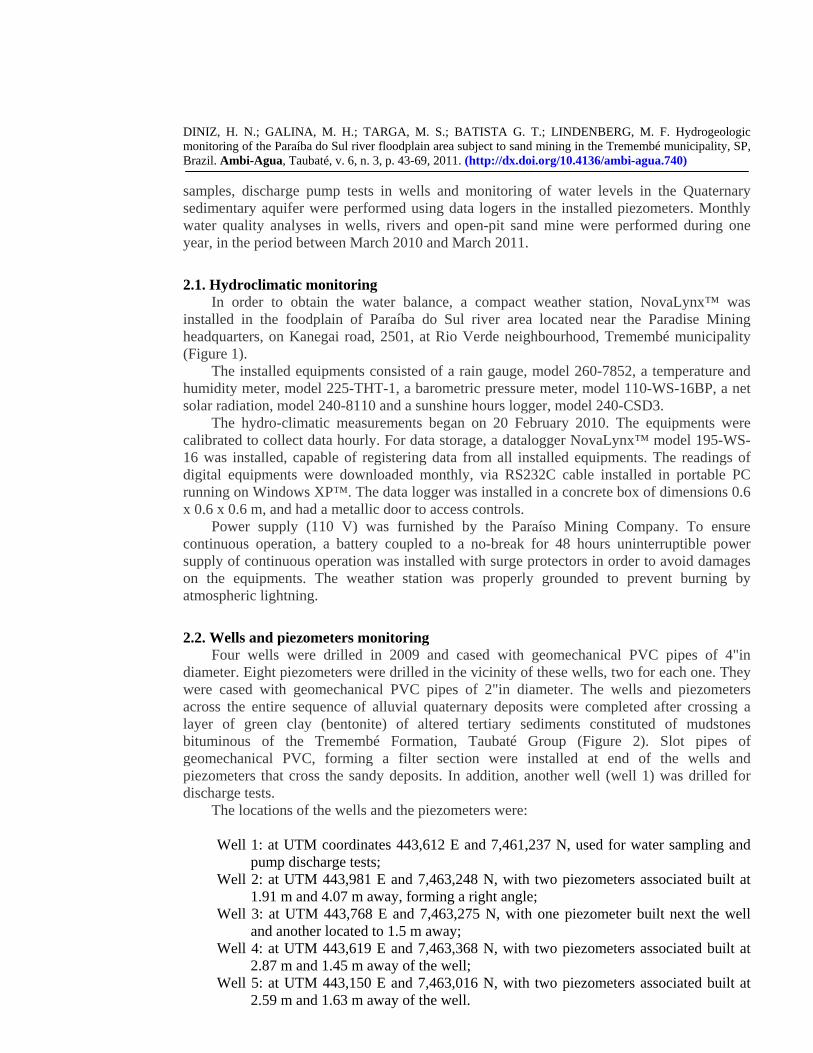
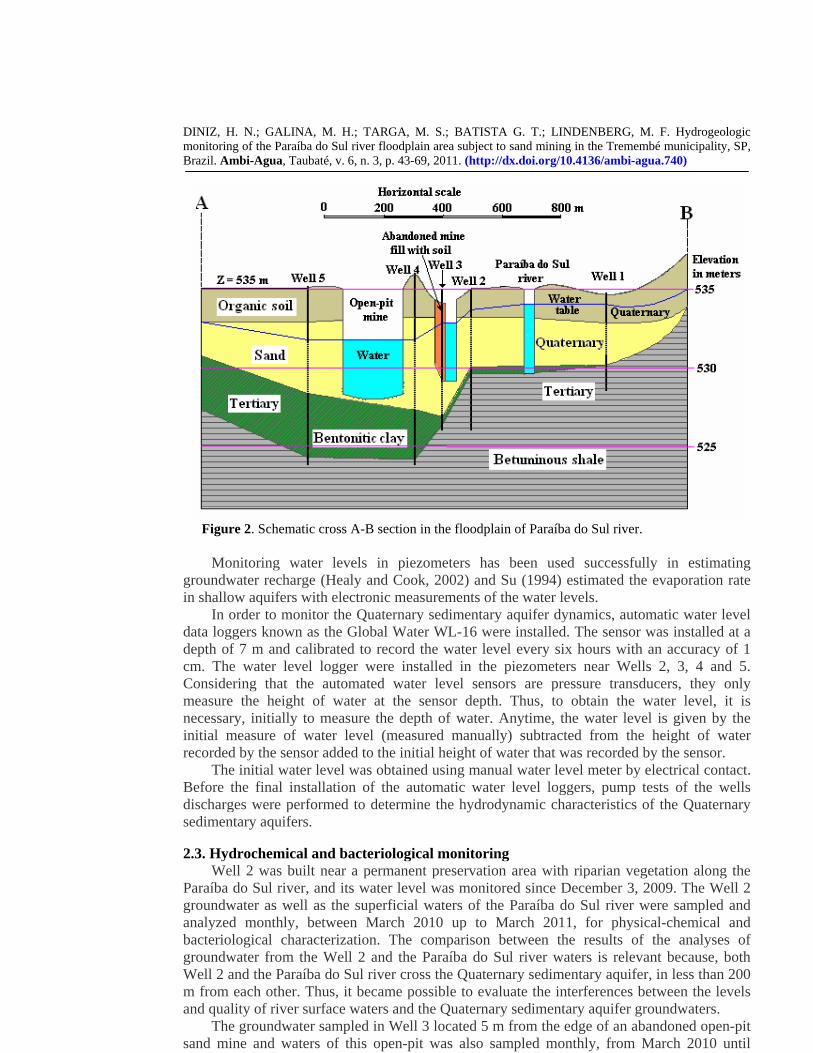
diameter. Eight piezometers were drilled in the vicinity of these wells, two for each one. They were cased with geomechanical PVC pipes of 2"in diameter. The wells and piezometers across the entire sequence of alluvial quaternary deposits were completed after crossing a layer of green clay (bentonite) of altered tertiary sediments constituted of mudstones bituminous of the Tremembé Formation, Taubaté Group (Figure 2). Slot pipes of geomechanical PVC, forming a filter section were installed at end of the wells and piezometers that cross the sandy deposits. In addition, another well (well 1) was drilled for discharge tests.
The locations of the wells and the piezometers were:
Well 1: at UTM coordinates 443,612 E and 7,461,237 N, used for water sampling and pump discharge tests;
Well 2: at UTM 443,981 E and 7,463,248 N, with two piezometers associated built at 1.91 m and 4.07 m away, forming a right angle;
Well 3: at UTM 443,768 E and 7,463,275 N, with one piezometer built next the well and another located to 1.5 m away;
Well 4: at UTM 443,619 E and 7,463,368 N, with two piezometers associated built at 2.87 m and 1.45 m away of the well;
Well 5: at UTM 443,150 E and 7,463,016 N, with two piezometers associated built at 2.59 m and 1.63 m away of the well.
DINIZ, H. N.; GALINA, M. H.; TARGA, M. S.; BATISTA G. T.; LINDENBERG, M. F. Hydrogeologic monitoring of the Paraíba do Sul river floodplain area subject to sand mining in the Tremembé municipality, SP, Brazil. Ambi-Agua, Taubaté, v. 6, n. 3, p. 43-69, 2011. (http://dx.doi.org/10.4136/ambi-agua.740)
47
Figure 2. Schematic cross A-B section in the floodplain of Paraíba do Sul river.
Monitoring water levels in piezometers has been used successfully in estimating
groundwater recharge (Healy and Cook, 2002) and Su (1994) estimated the evaporation rate in shallow aquifers with electronic measurements of the water levels.
In order to monitor the Quaternary sedimentary aquifer dynamics, automatic water level data loggers known as the Global Water WL-16 were installed. The sensor was installed at a depth of 7 m and calibrated to record the water level every six hours with an accuracy of 1 cm. The water level logger were installed in the piezometers near Wells 2, 3, 4 and 5. Considering that the automated water level sensors are pressure transducers, they only measure the height of water at the sensor depth. Thus, to obtain the water level, it is necessary, initially to measure the depth of water. Anytime, the water level is given by the initial measure of water level (measured manually) subtracted from the height of water recorded by the sensor added to the initial height of water that was recorded by the sensor.
The initial water level was obtained using manual water level meter by electrical contact. Before the final installation of the automatic water level loggers, pump tests of the wells discharges were performed to determine the hydrodynamic characteristics of the Quaternary sedimentary aquifers. 2.3. Hydrochemical and bacteriological monitoring
Well 2 was built near a permanent preservation area with riparian vegetation along the Paraíba do Sul river, and its water level was monitored since December 3, 2009. The Well 2 groundwater as well as the superficial waters of the Paraíba do Sul river were sampled and analyzed monthly, between March 2010 up to March 2011, for physical-chemical and bacteriological characterization. The comparison between the results of the analyses of groundwater from the Well 2 and the Paraíba do Sul river waters is relevant because, both Well 2 and the Paraíba do Sul river cross the Quaternary sedimentary aquifer, in less than 200 m from each other. Thus, it became possible to evaluate the interferences between the levels and quality of river surface waters and the Quaternary sedimentary aquifer groundwaters.
The groundwater sampled in Well 3 located 5 m from the edge of an abandoned open-pit sand mine and waters of this open-pit was also sampled monthly, from March 2010 until

DINIZ, H. N.; GALINA, M. H.; TARGA, M. S.; BATISTA G. T.; LINDENBERG, M. F. Hydrogeologic monitoring of the Paraíba do Sul river floodplain area subject to sand mining in the Tremembé municipality, SP, Brazil. Ambi-Agua, Taubaté, v. 6, n. 3, p. 43-69, 2011. (http://dx.doi.org/10.4136/ambi-agua.740)
48
March 2011, for physical-chemical and bacteriological characterization. There is a derivation channel from the Piracuama river (located about 1.5 km to the east) which runs throughout the entire area of irrigated rice fields of the Crozariol farm and discharges to the abandoned open-pit sand mine during irrigation or flood events. The waters of this channel were sampled monthly from December 2010 until March 2011.
The Well 4 is located on the side of a secondary road near the main Paraíso Mining sand pit. The Well 4 groundwater and the waters from the open-pit sand mine, located nearby, were sampled monthly between March 2010 and March 2011. Comparisons of hydrochemical and bacteriological data from these waters are relevant to establish the connection between the Quaternary sedimentary aquifer and in the sand extraction activity.
Some analyses were done during the water sampling in the field using the multiparametric Horiba W-22XD equipment including: pH, temperature, conductivity, turbidity, dissolved oxygen, depth, total dissolved solids and redox potential. Other analyses including total and fecal coliforms, and heterotrophic bacteria were analyzed in the Applied Biological Research Environment Laboratory of the University of Taubaté, associated with the Graduate Program in Environmental Sciences. Other parameters such as COD, BOD, total phosphorus, chloride, nitrate, nitrite, ammoniacal nitrogen, sulfate and total iron were analyzed in the Water Laboratory of the Department of the Civil Engineering of the Taubaté University. In addition, a complete set of analyses of samples collected in February 11, 2010 to attend the Brazilian Ministry of Health Regulation 518/2004 was performed at the state company responsible for water quality and sewage of São Paulo State named SABESP under contract.
3. RESULTS AND DISCUSSION 3.1. Hydroclimatic characterization
Daily rainfall data, weekly average wind speed, temperature and humidity in the period from April, 2010 to March, 2011 are presented in Figure 3.
There are two different periods, one with dry months, corresponding to autumn and winter seasons and another corresponding to a wet season during spring and summer, with maximum precipitation in summer. From August to November, the average wind speeds are higher than in other months, when the humidity is lower. Lower average temperatures occur from May to August as compared with other months. These observations are consistent with the observations of Folhes and Fisch (2006) for Taubaté municipality, a nearby municipality.
The water balance, comprising one year of continuous meteorological observations, between April of 2010 and March of 2011 (Tables 1 and 2; Figure 4) was used as input to calculate the potential evapotranspiration by the Penman modified method (Penman, 1948; Pereira et al., 1977). The actual evapotranspiration estimation was based on the Thorntwaite method as described by D´Angiolella and Vasconcellos (2002). Recorded hourly data of temperature, wind speed, relative humidity and sunshine were transformed into monthly averages. Rainfall data were recorded hourly but they were reduced to monthly totals, as well as the potential evaporation estimated using the Penman modified method.

DINIZ, H. N.; GALINA, M. H.; TARGA, M. S.; BATISTA G. T.; LINDENBERG, M. F. Hydrogeologic monitoring of the Paraíba do Sul river floodplain area subject to sand mining in the Tremembé municipality, SP, Brazil. Ambi-Agua, Taubaté, v. 6, n. 3, p. 43-69, 2011. (http://dx.doi.org/10.4136/ambi-agua.740)
49
1/4/20
10
15/4/
2010
29/4/
2010
13/5/
2010
27/5/
2010
10/6/
2010
24/6/
2010
8/7/20
10
22/7/
2010
5/8/20
10
19/8/
2010
2/9/20
10
16/9/
2010
30/9/
2010
14/10
/2010
28/10
/2010
11/11
/2010
25/11
/2010
9/12/2
010
23/12
/2010
6/1/20
11
20/1/
2011
3/2/20
11
17/2/
2011
3/3/20
11
17/3/
2011
31/3/
2011
0102030405060708090
100110120
P
reci
pita
tion
(mm
)
Date
6
7
8
Week
wee
kly
mea
n W
S (m
/s)
50
60
70
80
90
100
Week
wee
kly
mea
n hu
mity
(%)
1/4/20
10
15/4/
2010
29/4/
2010
13/5/
2010
27/5/
2010
10/6/
2010
24/6/
2010
8/7/20
10
22/7/
2010
5/8/20
10
19/8/
2010
2/9/20
10
16/9/
2010
30/9/
2010
14/10
/2010
28/10
/2010
11/11
/2010
25/11
/2010
9/12/2
010
23/12
/2010
6/1/20
11
20/1/
2011
3/2/20
11
17/2/
2011
3/3/20
11
17/3/
2011
31/3/
2011
15
20
25
30
Week
wee
kly m
ean
tem
p (o C)
Figure 3. Daily measurements of precipitation and weekly average of wind speed, natural moisture and temperature weekly at the Paraíso Mining area in Tremembé municipality.
The soil in the period of April to October, 2010 was dry and experimented lack of water.
In this period, the actual evaporation of lakes and open-pit sand mine became equal to the potential evaporation. Thus, subtracting the potential evaporation value from the total precipitation value, gives 345.6 mm, which is the actual evaporation from the free water surfaces.
DINIZ, H. N.; GALINA, M. H.; TARGA, M. S.; BATISTA G. T.; LINDENBERG, M. F. Hydrogeologic monitoring of the Paraíba do Sul river floodplain area subject to sand mining in the Tremembé municipality, SP, Brazil. Ambi-Agua, Taubaté, v. 6, n. 3, p. 43-69, 2011. (http://dx.doi.org/10.4136/ambi-agua.740)
50
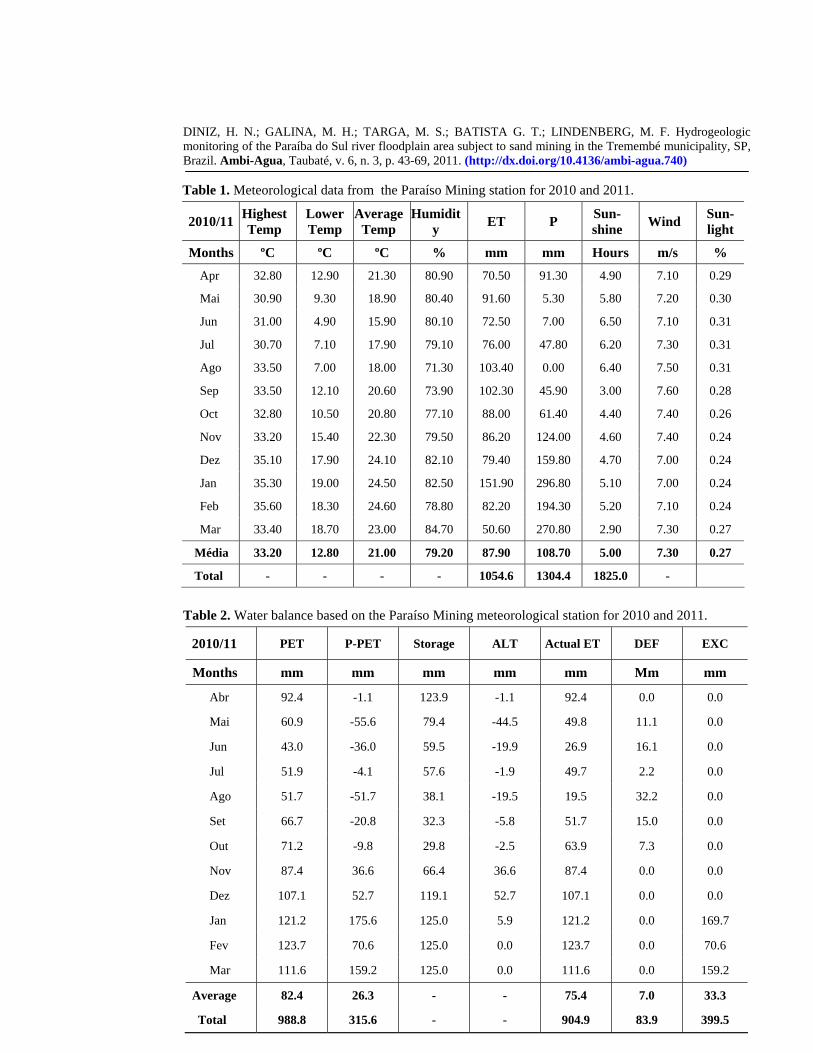
Table 1. Meteorological data from the Paraíso Mining station for 2010 and 2011.
2010/11 Highest Temp
Lower Temp
Average Temp
Humidity ET P Sun-
shine Wind Sun-light
Months ºC ºC ºC % mm mm Hours m/s % Apr 32.80 12.90 21.30 80.90 70.50 91.30 4.90 7.10 0.29
Mai 30.90 9.30 18.90 80.40 91.60 5.30 5.80 7.20 0.30
Jun 31.00 4.90 15.90 80.10 72.50 7.00 6.50 7.10 0.31
Jul 30.70 7.10 17.90 79.10 76.00 47.80 6.20 7.30 0.31
Ago 33.50 7.00 18.00 71.30 103.40 0.00 6.40 7.50 0.31
Sep 33.50 12.10 20.60 73.90 102.30 45.90 3.00 7.60 0.28
Oct 32.80 10.50 20.80 77.10 88.00 61.40 4.40 7.40 0.26
Nov 33.20 15.40 22.30 79.50 86.20 124.00 4.60 7.40 0.24
Dez 35.10 17.90 24.10 82.10 79.40 159.80 4.70 7.00 0.24
Jan 35.30 19.00 24.50 82.50 151.90 296.80 5.10 7.00 0.24
Feb 35.60 18.30 24.60 78.80 82.20 194.30 5.20 7.10 0.24
Mar 33.40 18.70 23.00 84.70 50.60 270.80 2.90 7.30 0.27
Média 33.20 12.80 21.00 79.20 87.90 108.70 5.00 7.30 0.27
Total - - - - 1054.6 1304.4 1825.0 - Table 2. Water balance based on the Paraíso Mining meteorological station for 2010 and 2011.
2010/11 PET P-PET Storage ALT Actual ET DEF EXC
Months mm mm mm mm mm Mm mm
Abr 92.4 -1.1 123.9 -1.1 92.4 0.0 0.0
Mai 60.9 -55.6 79.4 -44.5 49.8 11.1 0.0
Jun 43.0 -36.0 59.5 -19.9 26.9 16.1 0.0
Jul 51.9 -4.1 57.6 -1.9 49.7 2.2 0.0
Ago 51.7 -51.7 38.1 -19.5 19.5 32.2 0.0
Set 66.7 -20.8 32.3 -5.8 51.7 15.0 0.0
Out 71.2 -9.8 29.8 -2.5 63.9 7.3 0.0
Nov 87.4 36.6 66.4 36.6 87.4 0.0 0.0
Dez 107.1 52.7 119.1 52.7 107.1 0.0 0.0
Jan 121.2 175.6 125.0 5.9 121.2 0.0 169.7
Fev 123.7 70.6 125.0 0.0 123.7 0.0 70.6
Mar 111.6 159.2 125.0 0.0 111.6 0.0 159.2
Average 82.4 26.3 - - 75.4 7.0 33.3
Total 988.8 315.6 - - 904.9 83.9 399.5

DINIZ, H. N.; GALINA, M. H.; TARGA, M. S.; BATISTA G. T.; LINDENBERG, M. F. Hydrogeologic monitoring of the Paraíba do Sul river floodplain area subject to sand mining in the Tremembé municipality, SP, Brazil. Ambi-Agua, Taubaté, v. 6, n. 3, p. 43-69, 2011. (http://dx.doi.org/10.4136/ambi-agua.740)
51
Water balance in Paraíba do Sul river floodplain area
-100
-50
0
50
100
150
200
Apr Mai Jun Jul Aug Sep Oct Nov Dez Jan Feb Mar
month
mm
Deficit Withdrawal Replacement Surplus
Figure 4. Water balance in soil with 125 mm of field capacity from April 2010 to March 2011.
Water supplies resulted from the total precipitation from part of December and from January to March 2011. This water infiltrates into the soil and is either stored in the Quaternary sedimentary aquifer or used for irrigation of cultivated areas or lost by the evapotranspiration processes of native forests and grasslands. Especially in this period, water evaporated also from the soil.
The precipitation from mid-April 2010 until mid-October 2010 in the floodplain area of the Paraíba do Sul river, estimated at the Paraíso Mining meteorological station was low. The water balance showed 83.9 mm of water deficiency in the soil for that period. The evaporation reached 516.3 mm from the artificial lakes formed by the open-pit sand mine. This corresponds to 516,300 m3 of water per square kilometer of the open-pit sand mine. This is a value compatible with that found by Diniz et al. (2010), of 500,000 m3 per square kilometer per year estimated based on stream flow historical data, precipitation and evaporation of the Piracuama river basin, located nearby the study area. In this study the evaporation values were directly observed.
The estimated water surplus between October 2010 and March 2011 was 399.5 mm and the precipitation exceeded the evaporation in 568.8 mm. Therefore, the total evaporated is fully compensated by rain fall on the reservoir formed by artificial lakes due to the sand mining.
3.2. Fluctuations in water levels of the Quaternary sedimentary aquifer
The geologic analysis obtained during the drilling of Well 2 showed a gray clay soil up to 0.7 m deep. From this depth up to 2 meters, white yellowish clayey sand occurs; between 2 to 5.5 m medium to very coarse sand (Quaternary Period) occurs; between 5.5 to 6 m, green bentonite, an alteration product of shale clayey (Tertiary Period) appears; 6 to 6.5 m, occurs a clayey shale; and between 6.5 to 12 m, green bentonite appears again.
In the piezometer, located at 4.1 m far from the Well 2, an automatic water level gauge was installed and operated since December 3, 2009. The equipment was calibrated for hourly measurements until February 11, 2010. It was observed that measures taken every six hours were sufficient to detect any changes in the Quaternary sedimentary aquifer water level, therefore, the equipment was recalibrated to register data for this time period from that date on.
DINIZ, H. N.; GALINA, M. H.; TARGA, M. S.; BATISTA G. T.; LINDENBERG, M. F. Hydrogeologic monitoring of the Paraíba do Sul river floodplain area subject to sand mining in the Tremembé municipality, SP, Brazil. Ambi-Agua, Taubaté, v. 6, n. 3, p. 43-69, 2011. (http://dx.doi.org/10.4136/ambi-agua.740)
52
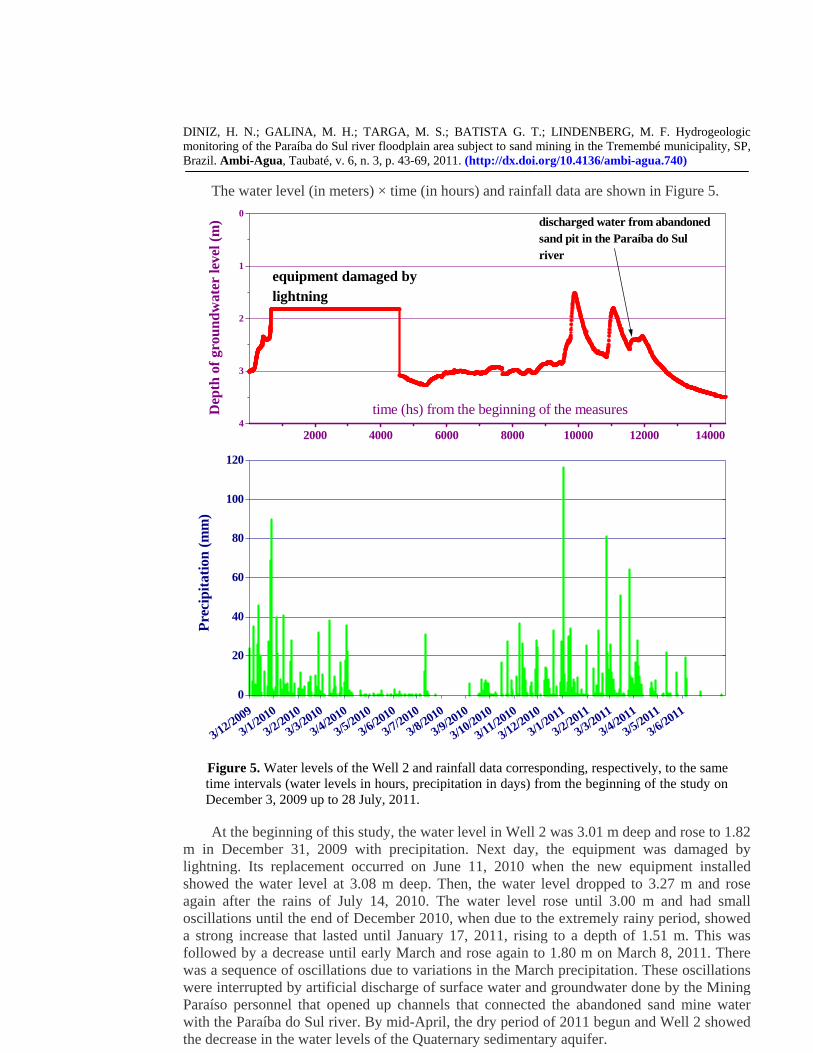
The water level (in meters) × time (in hours) and rainfall data are shown in Figure 5.
2000 4000 6000 8000 10000 12000 140004
3
2
1
0discharged water from abandonedsand pit in the Paraíba do Sulriver
equipment damaged bylightning
Dep
th o
f gro
undw
ater
leve
l (m
)
time (hs) from the beginning of the measures
3/12/2009
3/1/2010
3/2/2010
3/3/2010
3/4/2010
3/5/2010
3/6/2010
3/7/2010
3/8/2010
3/9/2010
3/10/2010
3/11/2010
3/12/2010
3/1/2011
3/2/2011
3/3/2011
3/4/2011
3/5/2011
3/6/20110
20
40
60
80
100
120
Pre
cipi
tatio
n (m
m)
Figure 5. Water levels of the Well 2 and rainfall data corresponding, respectively, to the same time intervals (water levels in hours, precipitation in days) from the beginning of the study on December 3, 2009 up to 28 July, 2011.
At the beginning of this study, the water level in Well 2 was 3.01 m deep and rose to 1.82
m in December 31, 2009 with precipitation. Next day, the equipment was damaged by lightning. Its replacement occurred on June 11, 2010 when the new equipment installed showed the water level at 3.08 m deep. Then, the water level dropped to 3.27 m and rose again after the rains of July 14, 2010. The water level rose until 3.00 m and had small oscillations until the end of December 2010, when due to the extremely rainy period, showed a strong increase that lasted until January 17, 2011, rising to a depth of 1.51 m. This was followed by a decrease until early March and rose again to 1.80 m on March 8, 2011. There was a sequence of oscillations due to variations in the March precipitation. These oscillations were interrupted by artificial discharge of surface water and groundwater done by the Mining Paraíso personnel that opened up channels that connected the abandoned sand mine water with the Paraíba do Sul river. By mid-April, the dry period of 2011 begun and Well 2 showed the decrease in the water levels of the Quaternary sedimentary aquifer.

DINIZ, H. N.; GALINA, M. H.; TARGA, M. S.; BATISTA G. T.; LINDENBERG, M. F. Hydrogeologic monitoring of the Paraíba do Sul river floodplain area subject to sand mining in the Tremembé municipality, SP, Brazil. Ambi-Agua, Taubaté, v. 6, n. 3, p. 43-69, 2011. (http://dx.doi.org/10.4136/ambi-agua.740)
53
Five meters away from the abandoned open-pit sand mine, at the Well 3 site, a piezometer, installed at 1.5 m from the well, has been monitored since March 12, 2010 (Figure 6). The geological log of the Well 3 indicated that there was a landfill constituted by sandy-silty soil until 5.5 meters of depth. This landfill is over imposed to the Quaternary deposits constituted of coarse to very fine sand, between 5.5 and 8 m deep, which was not removed during sand extraction of the open-pit mining activities. Between 8 and 8.5 m green clays (bentonite) appear. They are an alteration product of the clay and Tertiary shale weathering, situated beneath of the Quaternary sand deposits.
2000 4000 6000 8000 100003
2
1
0 Recession due to evaporationincreased in the lake of theabandoned open pit mine
Changes in groundwater flowby fluctuations in the waterof the Paraíba do Sul river
Paraíba do Sul river of thesand mining open pit,abandoned
water discharge of thesand mine open pit, abandoned
Damaged equipment
Rise in water levelscaused by discharge ofthe Piracuama riverchannel water in the openpit sand mining, abandoned
Gro
undw
ater
dee
p (m
)
time (hs)
12/3/
2010
2/4/20
10
23/4/
2010
14/5/
2010
4/6/20
10
25/6/
2010
16/7/
2010
6/8/20
10
27/8/
2010
17/9/
2010
8/10/2
010
29/10
/2010
19/11
/2010
10/12
/2010
31/12
/2010
21/1/
2011
11/2/
2011
4/3/20
11
25/3/
2011
15/4/
2011
0102030405060708090
100110120
Pre
cipi
tatio
n (m
m)
Figure 6. Groundwater levels and precipitation data for the Well 3 from the beginning of the study on December 3, 2009 up to April 4, 2011.
The water levels of the Well 3 (Quaternary sedimentary aquifer) are strongly influenced by water fluctuations in the open-pit sand mining by water discharge from water use by the Paraíso Mining activities and farmers during irrigated rice field operations (Figure 6).
It can be observed by the analysis of Figure 6, that since March 2010 until mid-April 2010, the water levels of the Quaternary sedimentary aquifer remain constant probably due to a balance between evapotranspiration and rainfall. From mid-April until mid-July of 2010 water levels fall at a constant rate due to evaporation from the lake of the abandoned open-pit mine and also due to groundwater flow towards active pits that are subject to direct evaporation during the following dry period.
After the rains of July 14, 2010 water levels in Well 3 rose again until it reached a plateau situated around 1.9 m level, which oscillated until the month of November 2010. These oscillations are probably due to water entering the aquifer from the flow of the Paraíba do Sul river, subject to fluctuations in water levels controlled by the Santa Branca dam management located upstream.

DINIZ, H. N.; GALINA, M. H.; TARGA, M. S.; BATISTA G. T.; LINDENBERG, M. F. Hydrogeologic monitoring of the Paraíba do Sul river floodplain area subject to sand mining in the Tremembé municipality, SP, Brazil. Ambi-Agua, Taubaté, v. 6, n. 3, p. 43-69, 2011. (http://dx.doi.org/10.4136/ambi-agua.740)
54
In November, the water level of the Quaternary sedimentary aquifer at the site of Well 3 reflected the rise of water level due to the release of water from the Piracuama river channel resulted from the canals managed by farmers for flooding irrigated rice fields. In mid-December, 2010 until mid-January, 2011, the equipment did not show variations in water levels due to clayey material that clogged the sensors at the bottom of the piezometer, even though variations might have occurred. The equipment was replaced in early February, 2011 and begun to record the fluctuations in water levels. A rise in water levels was registered on February 28, 2011 due to the opening of a ditch by the miners to release water from the active open-pit sand mine which overflowed due to the large influx of water from the Quaternary sedimentary aquifer.
On March 18, 2011, with the purpose of reducing the water levels of the abandoned open-pit sand mine, which also had overflowed, the miners opened up another trench, connecting this abandoned mine directly to Paraíba do Sul river and the water levels returned to back down in the abandoned mine as in the Well 3, as well (Figure 6).
3.2.1. Hydrodynamic modeling based on observations of water level fluctuations of the Quaternary sedimentary aquifer
An analysis of hydrographs obtained from piezometers to evaluate shallow aquifer recharge has been reported by Raj (2004). Similarly, water levels monitoring proved to be an adequate concept for the floodplain of the Paraíba do Sul river hydrodynamics analysis. The Quaternary sedimentary aquifer type in the location of Well 2 behaves as a confined aquifer (Diniz et al., 2010). The geological profile indicates that there is a layer of clay organic soil, impermeable, up to 0.7 m deep, followed by loamy white-yellowish sands up to 2 m, fine to coarse sand up to 5.5 m, and green clay (bentonite) up to 12 m deep. The transmissivity value, reported by Diniz et al. (2010), for the layer between 2 and 5.5 m was 15.5 m2/h and the storage coefficient equal to 0.032.
Based on Jacob (1940), the groundwater drawdown of a piezometer located near a well that is being pumped is given by Equation 1.
⎟⎟⎠
⎞⎜⎜⎝
⎛=
SrtT
TQs 2
25.2log4
3.2π
[1]
where, s = drawdown (m), Q = discharge rate (m3/h), T = transmissivity (m2/h), t = time (h),
r = distance between the piezometer and the point of groundwater discharge (m) and S = storage coefficient (dimensionless).
The observed decrease in the piezometer associated with Well 2 between January 18 and
February 17, 2011 (Figure 7) is similar to the drawdown of the water level in one piezometer that is lowering due to the pumping from a well nearby. Nonetheless, there is no pumping in the Quaternary sedimentary aquifer, but it is influenced by open-pit mines located nearby that experience evaporation (loss to the atmosphere). These caves cross the aquifer laterally, allowing horizontal flow of groundwater, causing a similar pumping effect.
Jacob's expression (1940) can be rewritten (Equation 2), keeping all parameters constant, except the drawdown (s) and time (t).
s = (value1) × log[(value2) × t] [2] where:
s = observed drawdown or demotion (in meters); t = time determined from the beginning of the drawdown (in hours);

DINIZ, H. N.; GALINA, M. H.; TARGA, M. S.; BATISTA G. T.; LINDENBERG, M. F. Hydrogeologic monitoring of the Paraíba do Sul river floodplain area subject to sand mining in the Tremembé municipality, SP, Brazil. Ambi-Agua, Taubaté, v. 6, n. 3, p. 43-69, 2011. (http://dx.doi.org/10.4136/ambi-agua.740)
55
value1 (value of the constant 1) = Q/4π × T, where Q = total flow from evaporative free surfaces by the lakes formed in the open-pit mines and T = Quaternary sedimentary aquifer transmissivity; value2 (value of the constant 2) = 2.25 T /r2 S, where r = average distance of the piezometer to points of discharge of the aquifer, in meters, and S = storage coefficient of the Quaternary sedimentary aquifer.
5000 6000 7000 8000 9000 10000 11000 120004
3
2
1
0
P2
P1
time equal to 9,956 hs
water level equal to 1.66 m
water level equal to 2.60 m
time equal to 10,486 hs
time equal to 9,890 hs
water level equal to 1.51 m
Dep
ht o
f the
wat
er le
vel (
m)
time (hs) from the beginning of measurements
11/6/2010
2/7/2010
23/7/2010
13/8/2010
3/9/2010
24/9/2010
15/10/2010
5/11/2010
26/11/2010
17/12/2010
7/1/2011
28/1/2011
18/2/2011
11/3/2011
1/4/2011
22/4/20110
20
40
60
80
100
120
Pre
cipi
tatio
n da
ily (m
m)
Figure 7. Water levels and rainfall data for the piezometer associated with Well 2 from the beginning of the study on June 11, 2010 up to April 22, 2011.
The peak in Figure 7, corresponds to the water level of 1.51 m that was reached at 9890
hours, since the beginning of the water level measurements in the Well 2. Using two points in Figure 7, one at the beginning of the drawdown, P1 (1.66 m and 9956 hours, in day 21/01/2011 at 16 pm) and P2 (2.6 m and 10 486 hours, in day 12/02/2011 at 13 pm), and applying the Equation 2, result in two equations with two unknown terms, as follows:
s = (value1) × log[(value2) × t] ⇒ (1.66–1.51) = (value1) × log[(value2) × (9956-9890)] ⇒ 0.15 = (value1) × log[(value2) × 66]

DINIZ, H. N.; GALINA, M. H.; TARGA, M. S.; BATISTA G. T.; LINDENBERG, M. F. Hydrogeologic monitoring of the Paraíba do Sul river floodplain area subject to sand mining in the Tremembé municipality, SP, Brazil. Ambi-Agua, Taubaté, v. 6, n. 3, p. 43-69, 2011. (http://dx.doi.org/10.4136/ambi-agua.740)
56
s = (value1) × log[(value2) × t] ⇒ (2.6–1.51) = (value1) × log[(value2) × (10486-9890)] ⇒ 1.09 = (value1) × log[(value2) × 596]
Solving these equations with two unknown terms, it results in:
value1 = 0.985 and value2 = 0.0215 value1 = 2.3 Q/4πT = 0.985 ⇒ Q = 0.985×4π×15.5/2.3 ⇒ Q = 83.4 m3/h (discharge rate from the water springs or subtracted from the aquifer by evaporation in the open-pit sand mines) value2 = 2.25 T/r2 S = 0.0215 ⇒ r2 = 2.25×15.5/(0.036×0.0215) ⇒ r2 = 45048 ⇒ r = 212.2 m (average distance where the discharges occur, which can correspond to places where evaporation occur on the free water surfaces of the open-pit sand mines). The Well 4 was built within a walking distance from the activities of the open-pit sand
mines in the Paraíso mining, next to a road in the Crozariol farm. The site was land filled with a gray-brown clay silty soil up to 3 m in depth, from 3 to 4 m, the Quaternary sediments have a yellow-white color silty sand, from 4 to 5 m, whitish red clayey sand, from 5 to 9.5 m, fine to medium Quaternary sedimentary sand of light gray color, from 9.5 to 13 m clay green (bentonite) occurs as altered products from clays and Tertiary bituminous shale. From 13 m depth down to the end of the drilling (15 m), there is Tertiary clayey bituminous shale of the Tremembé Formation, Taubaté Group.
An automatic water level meter was installed in a piezometer located at 2.87 m from the Well 4, and the water level was monitored since January 6, 2010. After the rains of early 2010, which ended on April 9, this piezometric levels showed a long period of drawdown, which lasted until July 14, 2010, when heavy rains occurred. The concepts of hydrodynamics of the aquifer can be applied for this period of drawdown and knowing that at the Well 4 site, the Quaternary sedimentary aquifer behaves as a confined aquifer type (Diniz et al., 2010) with values of transmissivity of the 30 m2/h and storage coefficient equal to 2×10⁻⁴.
Analogous to the Well 2 piezometer, the simplified equation proposed by Jacob (1940) to determine the hydrodynamic parameters of the Quaternary sedimentary aquifer, for the piezometric near the Well 4 site drawdown data was applied. In Equation 1 formulation, the water lost to the atmosphere in open pit mines, will be treated similarly to the water withdrawn by a pumped well. Probably, in this case, the subtraction from the aquifer water (water flow) is due to the evaporation in the open-pit sand mines.
In the same fashion, the drawback observed in piezometer of Well 4, in the period between April 9 and July 23, 2010 (Figure 8), is similar to the drawdown of the water level of a piezometric which experiences a water level decrease due to the pumping from a nearby well. In the case of Quaternary sedimentary aquifer, there is no pumping, but the water loss is due to the evaporation of the open-pit mines located nearby, as these caves cross the aquifer laterally, there is a horizontal flow of groundwater, causing an effect similar to pumping.
Applying Jacob (1940) equation to the data of piezometer associated with Well 4, as done for the Well 2, Equation 3 can be stated as:
s = (value3) × log[(value4) × t] [3]
and; s = observed drawdown or demotion (in meters); t = time determined from the beginning of the drawdown (in hours);
DINIZ, H. N.; GALINA, M. H.; TARGA, M. S.; BATISTA G. T.; LINDENBERG, M. F. Hydrogeologic monitoring of the Paraíba do Sul river floodplain area subject to sand mining in the Tremembé municipality, SP, Brazil. Ambi-Agua, Taubaté, v. 6, n. 3, p. 43-69, 2011. (http://dx.doi.org/10.4136/ambi-agua.740)
57
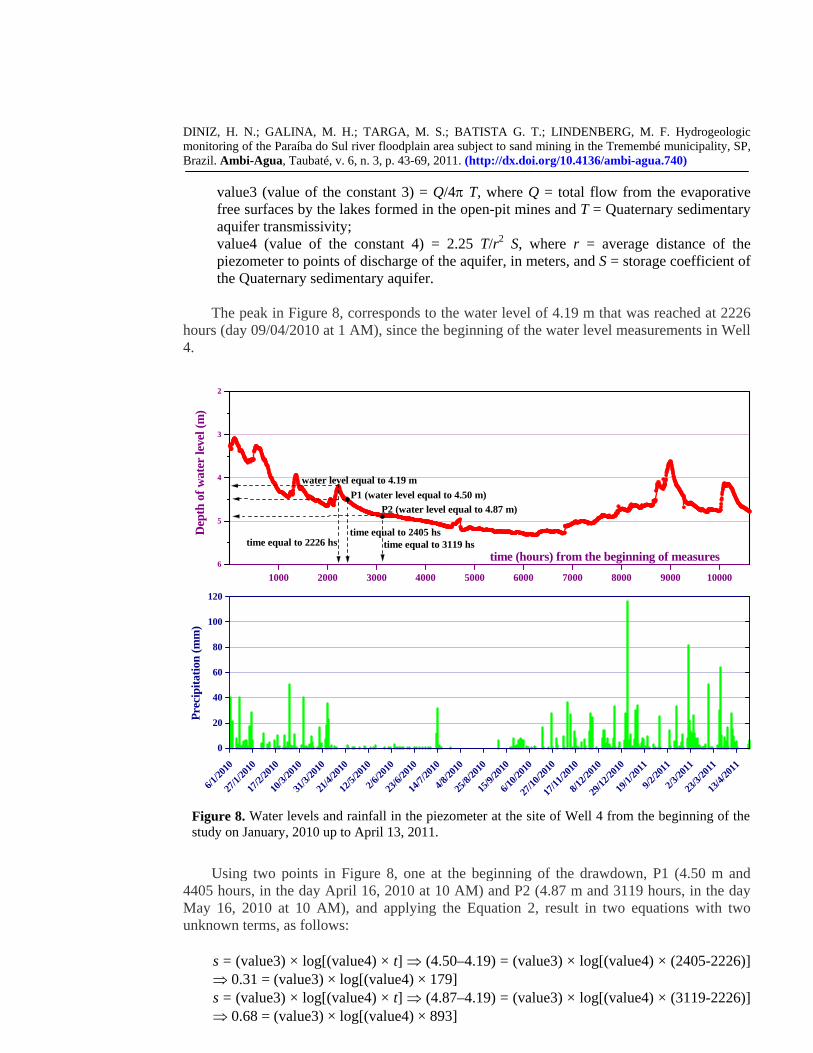
value3 (value of the constant 3) = Q/4π T, where Q = total flow from the evaporative free surfaces by the lakes formed in the open-pit mines and T = Quaternary sedimentary aquifer transmissivity; value4 (value of the constant 4) = 2.25 T/r2 S, where r = average distance of the piezometer to points of discharge of the aquifer, in meters, and S = storage coefficient of the Quaternary sedimentary aquifer.
The peak in Figure 8, corresponds to the water level of 4.19 m that was reached at 2226 hours (day 09/04/2010 at 1 AM), since the beginning of the water level measurements in Well 4.
1000 2000 3000 4000 5000 6000 7000 8000 9000 100006
5
4
3
2
..
time equal to 3119 hs
P2 (water level equal to 4.87 m)P1 (water level equal to 4.50 m)
time equal to 2405 hs
water level equal to 4.19 m
time equal to 2226 hs
Dep
th o
f wat
er le
vel (
m)
time (hours) from the beginning of measures
6/1/20
10
27/1/
2010
17/2/
2010
10/3/
2010
31/3/
2010
21/4/
2010
12/5/
2010
2/6/20
10
23/6/
2010
14/7/
2010
4/8/20
10
25/8/
2010
15/9/
2010
6/10/2
010
27/10
/2010
17/11
/2010
8/12/2
010
29/12
/2010
19/1/
2011
9/2/20
11
2/3/20
11
23/3/
2011
13/4/
2011
0
20
40
60
80
100
120
Pre
cipi
tatio
n (m
m)
Figure 8. Water levels and rainfall in the piezometer at the site of Well 4 from the beginning of the study on January, 2010 up to April 13, 2011.
Using two points in Figure 8, one at the beginning of the drawdown, P1 (4.50 m and
4405 hours, in the day April 16, 2010 at 10 AM) and P2 (4.87 m and 3119 hours, in the day May 16, 2010 at 10 AM), and applying the Equation 2, result in two equations with two unknown terms, as follows:
s = (value3) × log[(value4) × t] ⇒ (4.50–4.19) = (value3) × log[(value4) × (2405-2226)] ⇒ 0.31 = (value3) × log[(value4) × 179] s = (value3) × log[(value4) × t] ⇒ (4.87–4.19) = (value3) × log[(value4) × (3119-2226)] ⇒ 0.68 = (value3) × log[(value4) × 893]
DINIZ, H. N.; GALINA, M. H.; TARGA, M. S.; BATISTA G. T.; LINDENBERG, M. F. Hydrogeologic monitoring of the Paraíba do Sul river floodplain area subject to sand mining in the Tremembé municipality, SP, Brazil. Ambi-Agua, Taubaté, v. 6, n. 3, p. 43-69, 2011. (http://dx.doi.org/10.4136/ambi-agua.740)
58
Again, solving these two equations with two unknown terms, it results in:
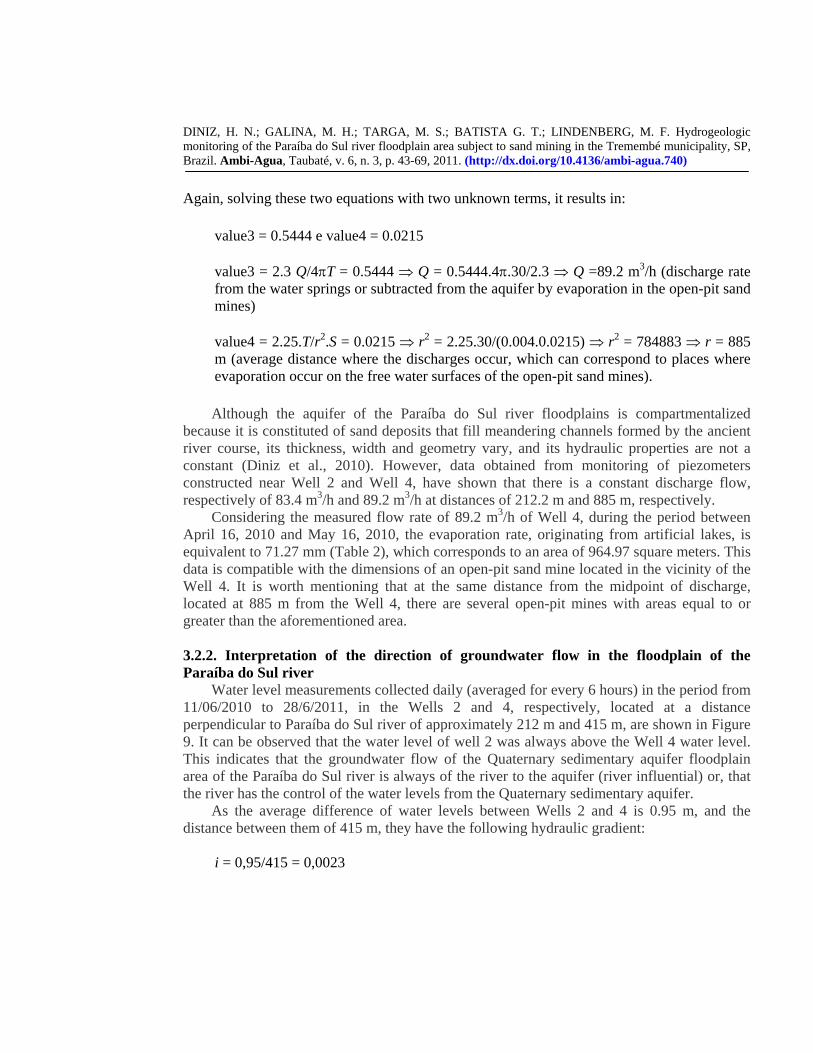
value3 = 0.5444 e value4 = 0.0215 value3 = 2.3 Q/4πT = 0.5444 ⇒ Q = 0.5444.4π.30/2.3 ⇒ Q =89.2 m3/h (discharge rate from the water springs or subtracted from the aquifer by evaporation in the open-pit sand mines) value4 = 2.25.T/r2.S = 0.0215 ⇒ r2 = 2.25.30/(0.004.0.0215) ⇒ r2 = 784883 ⇒ r = 885 m (average distance where the discharges occur, which can correspond to places where evaporation occur on the free water surfaces of the open-pit sand mines). Although the aquifer of the Paraíba do Sul river floodplains is compartmentalized
because it is constituted of sand deposits that fill meandering channels formed by the ancient river course, its thickness, width and geometry vary, and its hydraulic properties are not a constant (Diniz et al., 2010). However, data obtained from monitoring of piezometers constructed near Well 2 and Well 4, have shown that there is a constant discharge flow, respectively of 83.4 m3/h and 89.2 m3/h at distances of 212.2 m and 885 m, respectively.
Considering the measured flow rate of 89.2 m3/h of Well 4, during the period between April 16, 2010 and May 16, 2010, the evaporation rate, originating from artificial lakes, is equivalent to 71.27 mm (Table 2), which corresponds to an area of 964.97 square meters. This data is compatible with the dimensions of an open-pit sand mine located in the vicinity of the Well 4. It is worth mentioning that at the same distance from the midpoint of discharge, located at 885 m from the Well 4, there are several open-pit mines with areas equal to or greater than the aforementioned area.
3.2.2. Interpretation of the direction of groundwater flow in the floodplain of the Paraíba do Sul river
Water level measurements collected daily (averaged for every 6 hours) in the period from 11/06/2010 to 28/6/2011, in the Wells 2 and 4, respectively, located at a distance perpendicular to Paraíba do Sul river of approximately 212 m and 415 m, are shown in Figure 9. It can be observed that the water level of well 2 was always above the Well 4 water level. This indicates that the groundwater flow of the Quaternary sedimentary aquifer floodplain area of the Paraíba do Sul river is always of the river to the aquifer (river influential) or, that the river has the control of the water levels from the Quaternary sedimentary aquifer.
As the average difference of water levels between Wells 2 and 4 is 0.95 m, and the distance between them of 415 m, they have the following hydraulic gradient:
i = 0,95/415 = 0,0023

DINIZ, H. N.; GALINA, M. H.; TARGA, M. S.; BATISTA G. T.; LINDENBERG, M. F. Hydrogeologic monitoring of the Paraíba do Sul river floodplain area subject to sand mining in the Tremembé municipality, SP, Brazil. Ambi-Agua, Taubaté, v. 6, n. 3, p. 43-69, 2011. (http://dx.doi.org/10.4136/ambi-agua.740)
59
11/6/
2010
11/7/
2010
11/8/
2010
11/9/
2010
11/10
/2010
11/11
/2010
11/12
/2010
11/1/
2011
11/2/
2011
11/3/
2011
11/4/
2011
11/5/
2011
4,5
4,0
3,5
3,0
2,5
2,0
1,5
well 4well 2
Dep
th o
f wat
er le
vel (
m)
Date
11/6/
2010
11/7/
2010
11/8/
2010
11/9/
2010
11/10
/2010
11/11
/2010
11/12
/2010
11/1/
2011
11/2/
2011
11/3/
2011
11/4/
2011
11/5/
2011
0
20
40
60
80
100
120
Pre
cipi
tatio
n (m
m)
Date
Figure 9. Daily water levels of Wells 2 and 4, referred to a zero datum equal to the mouth of the casing tube of Well 2 and precipitation data of the floodplain area of the Paraíba do Sul river, in Tremembé municipality.
3.3. Physical-chemical and bacteriological analysis of the surface waters and groundwater 3.3.1. Comparisons between the water quality of the Well 2 and Paraíba do Sul river
The comparison between the waters from Well 2 and of the Paraíba do Sul river are relevant because they cross the Quaternary aquifer, at a distance less than 200 m. Therefore, the chemical and quality characteristics of surface water interfere on the groundwater on the site (Table 3).
The analyses of pH and Eh are indicative that there is interference between the Quaternary sedimentary aquifer on the Well 2 site and the surface waters of the Paraíba do Sul river. The similarity between the results of the analyses of these parameters shows that there is a mixture between groundwater and surface water and this interference propagates throughout the Quaternary sedimentary aquifer.

DINIZ, H. N.; GALINA, M. H.; TARGA, M. S.; BATISTA G. T.; LINDENBERG, M. F. Hydrogeologic monitoring of the Paraíba do Sul river floodplain area subject to sand mining in the Tremembé municipality, SP, Brazil. Ambi-Agua, Taubaté, v. 6, n. 3, p. 43-69, 2011. (http://dx.doi.org/10.4136/ambi-agua.740)
60
Table 3. Bacteriological, physical and chemical analyses of water samples from Well 2 and Paraíba do Sul river surface waters.
Sampling Dates
2010 2011 PARAMETERS Mar 25
Apr 13
May 11
Jun 15
Jul 27
Ago10
Sep 10
Oct 19
Nov 24
Dez 7
Fev 1
Mar15
pH 5.54 5.98 6.09 6.12 6.05 5.97 6.02 5.96 6.04 6.03 5.42 pH 5.75 6.64 6.32 6.16 6.42 6.54 6.36 6.04 6.20 6.22 6.20 5.97 Conductivity 18.0 18.0 12.19 12.30 26.0 27.0 29.0 27.0 11.0 11.0 11 Conductivity 9.0 13.0 21.50 23.70 13.0 15.0 15.0 11.0 6.0 4.0 6.0 4 Turbidity (NTU) 460 57 9.56 100 69 23 74 120 340 150 97 Turbidity (NTU) 110 120 35.7 39 130 76 75 85 78 72 64 66 Temp (°C) 22.7 23.3 22.8 21.5 22.5 22.3 22.2 21.9 22.1 22.0 23 Temp (°C) 26.5 22.8 21.5 17.7 19.2 19.2 20.4 21.6 24.1 24.7 25.7 24.7 TDS (g/L) 0.11 0.12 0.15 0.17 0.28 0.21 0.22 0.07 0.07 0.07 TDS (g/L) 0.06 0.09 0.10 0.08 0.10 0.09 0.07 0.04 0.03 0.04 0.03 Eh -130 -40 -50 -63 -85 -75 -113 -104 -102 -126 -194 Eh 67 42 140 116 98 140 30 -5 141 71 41 12 Cl- (mg/L) 18.7 28.84 25.44 59.52 145.5 187 277.6 218.5
Cl- (mg/L) 20.44 32.96 33.92 46.96 28.13 21.67 30.49 34.2 COD (mg/L) 22.44 19.71 9.15 19.15 24.96 15.46 0.00 19.87 21.50 20.61 COD (mg/L) 11.10 10.67 13.37 9.15 14.42 13.44 8.10 14.40 7.36 19.71 9.86 BOD (mg/L) 0 0 0 0 0 0 2.2 0 BOD (mg/L) 3.8 2.2 2.2 1.6 2.0 1.2 1.6 0.6 NO3
- (mg/L) 0 0 0 0 0 0 0 0.11 0.11 0 0 NO3
- (mg/L) 0.17 0.34 0.37 0.35 0.33 0.36 0.26 0.01 0.34 0.35 0.3 NO2
- (mg/L) 0.02 0.02 0.02 0 0 0.06 0 0 0 0 0 NO2
- (mg/L) 0.02 0.03 0.02 0.04 0.20 0.02 0.02 0.04 0.04 0.02 NH4
- (mg/L) 1.01 0.20 0.20 0.18 0.15 2.36 1.25 2.45 2.85 2.70 2.85 NH4
- (mg/L) 0.05 0.06 0.00 0.05 0.00 0.13 0.21 0.32 0.34 0.27 0.26 SO4
- (mg/L) 20.00 0.00 0.00 15.77 1.89 1.29 0.38 1.78 0 SO4
- (mg/L) 0.00 0.00 0.00 6.06 1.22 1.52 0.18 0.60 0.39 Fe (mg/L) 1.25 1.20 2.40 2.50 0.69 12.10 10.8 Fe (mg/L) 0.23 0.23 0.23 0.23 2.30 0.29 0.31 0.41 0.33 P-tot (mg/L) 0.47 0.47 0.45 0.16 0.32 0.20 0.38 0.40 0.00 0.43 0.49 P-tot (mg/L) 0.14 0.11 0.15 0.04 0.27 0.11 0.15 0.00 0.21 0.34 0.21 TOTCOL (MPN/100mL) 0 13 13 23 13 40 14 14 180 TOTCOL (MPN/100mL) 13000 540000 540000 22000 49000 5400 1700 1600 13000
FCC (MPN/100mL) 2 0 0 0 0 0 7.8 13 0 11 13 FCC (MPN/100mL) 4.5 33 4000 220 14000 9200 11000 1400 2 23 7900 GHB (UFC/mL) 370 140 260 1200 170 120 640 170 120 160 1000
GHB (UFC/mL) >5700 >5700 >5700 >5700 >5700 >5700 >5700 >5700 1900 >5700 >5700
Time sampling 10:50 10:23 10:35 10:06 9:47 12:08 9:51 11:47 11:20 Time sampling 9:35 9:30 9:40 9:48 9:28 9:16 9:15 11:30 9:08
Note: no color represents the parameters analyzed for Well 2 and in light blue the Paraíba do Sul river results.

DINIZ, H. N.; GALINA, M. H.; TARGA, M. S.; BATISTA G. T.; LINDENBERG, M. F. Hydrogeologic monitoring of the Paraíba do Sul river floodplain area subject to sand mining in the Tremembé municipality, SP, Brazil. Ambi-Agua, Taubaté, v. 6, n. 3, p. 43-69, 2011. (http://dx.doi.org/10.4136/ambi-agua.740)
61
Another valid comparison is between the chemical parameters (chlorides, ammonia nitrogen and total phosphorus) analyzed in Well 2 and Paraíba do Sul river. It was verified that after the period of agricultural fertilizer application, held between August and September 2010, the levels of ammonia increased probably due to the application of urea with liming (Araújo et al., 2011). The ammonia slowly seeps into the aquifer, primarily from the dissolution caused by the rains of October, in 2010, increasing the concentration in the subsequent rainy period.
Andrade et al. (2010) showed that the fertilization of the soil using urea and NPK in the floodplain area of the Paraíba do Sul river occurs between September and November.
The pH remains constant during the dry season and decreases with the onset of the rainy season, mainly from December 2010, decreasing significantly in both aqueous system, of the Well 2 groundwater and Paraíba do Sul river (Table 3). The decrease in pH reduces the aqueous environment and it allows a greater amount of dissolved iron ions.
The chlorides of the Paraíba do Sul river waters have their origin in the consumption of salt by the population and dumping of untreated domestic sewage. In the Quaternary sedimentary aquifer groundwater, at the Well 2 site, their origin is derived from the infiltration from the Paraíba do Sul river water and organochlorine pesticides applied during rice germination in the months of October and November, 2010. The infiltration and contamination with pesticides is higher in the rainy months that follow this application.
Total phosphorus does not have a significant concentration in the Paraíba do Sul river or in Quaternary sedimentary aquifer at the Well 2 site. Its level varies but are very low and follow the same trend both in the river and in the groundwater. The similarity of the contents of this parameter can also reveal a strong indication of mixing of waters of the Paraíba do Sul river with groundwaters of the Quaternary sedimentary aquifer throughout 2010.
Biochemical Oxygen Demand had some annual variation at Well 2 and Paraíba do Sul river waters had similar variation for this parameter. Biochemical Oxygen Demand of five days and Chemical Oxygen Demand are parameters with little annual variation in both the Paraíba do Sul river, as in the Quaternary sedimentary aquifer waters.
The Biochemical Oxygen Demand of five days fluctuates randomly in the Paraíba do Sul river and Well 2, but the in groundwater its value is usually higher than in the river. It has no consistent relationship with the water level fluctuations or climatic periods.
The amount of total coliforms in the Paraíba do Sul river (ranged between 100,000 and 1,000,000 for each 100 mL) is higher during the dry season and had a significant decrease with the onset of the rainy season of 2010 (ranged between 1,000 and 10,000 per 100 mL). In the groundwater sampled at Well 2 site, the quantity fluctuated between 0 to 180 per 100 mL.
The E-coli were absent at Well 2, in the dry season of 2010 and were present only in amounts smaller than 12 per 100 mL, after the rains that begun in October, 2010. However, in the Paraíba do Sul river their number may reach 10,000 per 100 mL, being larger in the dry season in as much as they have an inverse relationship with temperature and precipitation.
3.3.2. Comparisons between the water quality at Well 3, open-pit inactive mine, and discharge channel of rice irrigation
Results of bacteriological and chemical analysis of water samples at the Well 3, at an inactive open-pit mine and at the entrance of a rice irrigation discharge channel are given in Table 4.

DINIZ, H. N.; GALINA, M. H.; TARGA, M. S.; BATISTA G. T.; LINDENBERG, M. F. Hydrogeologic monitoring of the Paraíba do Sul river floodplain area subject to sand mining in the Tremembé municipality, SP, Brazil. Ambi-Agua, Taubaté, v. 6, n. 3, p. 43-69, 2011. (http://dx.doi.org/10.4136/ambi-agua.740)
62
Table 4. Results of chemical analysis performed with water samples from Well 3, inactive open-pit mine and channel's mouth of the Piracuama river.
Dates of samples collect and results 2010 2011 PARÂMETERS
25/3 13/4 11/5 15/6 27/7 10/8 10/9 19/10 24/11 7/12 1/2 15/3 pH 5.67 6.02 5.95 6.06 6.11 5.76 5.83 5.82 5.86 5.90 5.90 5.25 pH 6.00 6.15 5.73 6.00 5.82 5.60 6.28 6.03 5.45 5.85 5.90 5.78 pH 6.29 6.05 5.91 Conductivity (mS/m) 21.0 26.0 17.42 16.18 19.0 21.0 22.0 21.0 9.0 9.0 11.0 8 Conductivity (mS/m) 12.0 14.0 19.18 28.80 15.0 10.0 12.0 7.0 3.0 2.0 4.0 3 Conductivity (mS/m) 2.0 5.0 3 Turbidity (NTU) 170 53 26 180 220 170 210 160 230 89 50 78 Turbidity (NTU) 260 100 61 91 650 330 250 120 62 26 65 93 Turbidity (NTU) 23 83 250 Temp (°C) 21.6 22.0 21.4 20.2 20.8 20.8 20.8 20.7 21.1 20.8 22.1 23.1 Temp (°C) 29.0 23.7 21.3 17.0 18.8 18.1 20.1 20.2 24.3 27.8 27.9 26.3 Temp (°C) 26.8 26.6 27 TDS (g/L) 0.13 0.17 0.13 0.12 0.14 0.15 0.14 0.06 0.06 0.08 0.06 TDS (g/L) 0.07 0.09 0.12 0.07 0.06 0.08 0.05 0.02 0.01 0.04 0.02 TDS (g/L) 0.01 0.03 0.02 Eh -79 16 -42 -59 -102 -83 -152 -151 -82 -98 -205 -146 Eh -71 -61 -180 -195 -199 -54 -124 -120 -42 19 -247 -65 Eh 36 41 68 Cl- (mg/L) 19.14 32.44 26.5 56.26 55.29 208.3 232.1 237.5 Cl- (mg/L) 23.05 35.02 35.51 44.17 22.79 21.25 29.58 28.03 Cl- (mg/L) 24.22 23.21 24.7 COD (mg/L) 13.67 6.10 12.51 22.53 27.81 29.23 28.42 19.50 27.20 19.14 31.74 20.61 COD (mg/L) 21.50 17.66 17.25 60.19 44.35 40.70 39.74 16.80 23.92 17.92 20.83 COD (mg/L) 13.98 34.56 46.59 BOD (mg/L) 0 0 0 0 2.0 0 0 0 BOD (mg/L) 0 0 0 0 0 0 0 0 BOD (mg/L) 1.8 1.00 NO3
- (mg/L) 0 0 0 0 0 0 0 0.06 0.07 0 0 NO3
- (mg/L) 0.09 0.12 0.06 0.17 0.00 0.22 0.00 0.02 0.08 0.00 0 NO3
- (mg/L) 0.05 0.00 1.21 NO2
- (mg/L) 0.02 0.04 0 0 0 0 0 0 0 0 0.00 NO2
- (mg/L) 0.00 0.03 0 0 0 0 0 0 0 0 0 NO2
- (mg/L) 0.00 0.00 0 NH4
- (mg/L) 3.04 0.30 0.00 0.21 0.15 3.26 2.25 3.25 8.50 3.55 3.85 NH4
- (mg/L) 0.03 0.08 0.26 0 0 0.69 o 0.10 0.19 0.13 0.07 NH4
- (mg/L) 0.2 0.15 0.1 SO4
- (mg/L) 0 0 0 5.05 1.03 0.23 0 13.50 0.47 SO4
- (mg/L) 0 0 0 0 1.06 0.98 0 0.38 0.54 SO4
- (mg/L) 0.09 0.00 0.49 Fe (mg/L) 1.20 1.20 2.40 2.50 1.33 1.11 0.49 7.2 Fe (mg/L) 0.25 0.24 0.23 0.23 2.30 0.40 0.36 0.27 0.13 Fe (mg/L) 0,41 0,52 0,12 P-tot (mg/L) 0,44 0,30 0,72 0,54 0,38 0,54 0,47 0,68 0,14 0,14 0,59 P-tot (mg/L) 0,13 0,09 0,13 0,20 0,25 0,34 0,08 0,00 0,11 0,08 0,23 P-tot (mg/L) 0,02 0,32 0,21 TOTCOL (MPN/100mL) 0 13 13 23 13 40 14 14 68 TOTCOL (MPN/100mL) 13000 540000 540000 22000 49000 5400 1700 1600 790 TOTCOL (MPN/100mL) 1400 240 260 FCC (MPN/100mL) 2 0 0 0 0 0 7,8 13 0 11 45 FCC (MPN/100mL) 4,5 33 4000 220 14000 9200 11000 1400 2 23 610 FCC (MPN/100mL) 110 100 130 GHB (UFC/mL) 370 140 260 1200 170 120 640 170 120 160 340 GHB (UFC/mL) >5700 >5700 >5700 >5700 >5700 >5700 >5700 >5700 1900 >5700 >5700 GHB (UFC/mL) >5700 4200 >5700 Time of sampling 10:50 10:23 10:35 10:06 9:47 12:08 9:51 11:47 12:05 Time of sampling 9:35 9:30 9:40 9:48 9:28 9:16 9:15 11:30 12:00 Time of sampling 10:30 12:40 12:30
Note: Data of Well 3 are not highlighted, light blue color refers to hydrochemical parameters of the inactive sand mine, and green to the parameters of the mouth of the diversion channel of the Piracuama river used in rice crop irrigation.

DINIZ, H. N.; GALINA, M. H.; TARGA, M. S.; BATISTA G. T.; LINDENBERG, M. F. Hydrogeologic monitoring of the Paraíba do Sul river floodplain area subject to sand mining in the Tremembé municipality, SP, Brazil. Ambi-Agua, Taubaté, v. 6, n. 3, p. 43-69, 2011. (http://dx.doi.org/10.4136/ambi-agua.740)
63
The values found for the analyzed parameters are different for Well 3, the inactive mine, and channel entrance from Piracuama river. There is great interference between these waters of diverse nature (Quaternary sedimentary aquifer, rainwater and river) due to their proximity (5 m distance between the edge of the inactive mine and Well 3). Therefore, the physico-chemical and bacteriological characteristics of Well 3 groundwater should be compared with the inactive open-pit sand mine and the mouth of the channel in the Piracuama river. A proper comparison can be made based on the physical parameters of these waters (pH, Eh and dissolved metals) as a function of the collection period. In March and April, 2010, when there were a large amount of rainfall in the area of the floodplain of the Paraíba do Sul river it corresponded to a period in which the inactive sand mine maintainen a balance between the input quantities from rain and output of water due to evapotranspiration. Under these conditions there is a tendency for both the pH and the Eh towards neutrality due the water supply from rains.
At the end of April, the water levels of the sedimentary aquifer at the Well 3 site began to fall, following the artificial lake levels formed by the inactive sand mine. The water from the Quaternary sedimentary aquifer has a negative oxide-reducer potential caused by the absence of dissolved atmospheric oxygen (the aquifer is confined by a layer of clayey, organic, waterproof soil, with an average thickness of 0.7 m). The water of the artificial lake formed by the inactive mine also has a similar reducing environment behavior of the aquifer and becomes, in the following dryer months, increasingly reductive, but in this case, this increase is caused by the swampy environment where there are many roots of dead plant that consume the available oxygen. A reducing environment favors an increase in dissolved metals by ionization, and therefore, the waters of the Well 3 have a proportionately larger amount of iron ions due to a more negative Eh than the waters of the artificial lake (Table 4).
Since November, 2010, there is a gradual increase in rainfall and the trend of the Eh and pH is inverted, since the increase of rain water makes the environment less reducer because there is a greater balance of the hydrogenic potential in this water. This also causes a decrease in the dissolved iron content in the aquifer and in the inactive mine.
In the samples collected on February 1, 2011, there was an unexpected increase of reducing conditions in the inactive mine due to Eh. At that day, the inactive mine was interconnected with other inactive mines, a technique used by the miner to increase the discharge of water to the Paraíba do Sul river. This procedure decreased the dissolved oxygen in the inactive caves because of the increasing in oxygen consumption due to the mobilization of organic matter (roots and plants) from the bottom of the inactive sand mine.
Therefore, in February, 2011, reducing environment prevails for both the inactive open-pit mine and Quaternary sedimentary aquifer at Well 3 site. Consistently, the following month March, 2011, the iron ionic content has increased significantly in both places.
Conductivity is a parameter that indicates the amount of total dissolved solids in a solution. The relationship between conductivity (in mS/m) and total dissolved solids (in mg/L) resulted in a correlation coefficient of 0.15 for Well 3 groundwater, while for the inactive open-pit mine it was equal to 0.19 and for the waters at the mouth of the channel in Piracuama river it was 0.17.
The average temperature of the groundwater in Well 3 site was 21.3 °C (12 samples) with standard deviation of 0.8°C, indicating that there is little annual variation. The waters of the inactive mine are in direct contact with the atmosphere and therefore, they have an average temperature slightly higher (22.9 °C) and a standard deviation of 4.2°C, indicating greater annual variation. The correlation of these parameters for the waters of the estuary of the channel in Piracuama river was not considered because of the short sampling period (only 3 months).
DINIZ, H. N.; GALINA, M. H.; TARGA, M. S.; BATISTA G. T.; LINDENBERG, M. F. Hydrogeologic monitoring of the Paraíba do Sul river floodplain area subject to sand mining in the Tremembé municipality, SP, Brazil. Ambi-Agua, Taubaté, v. 6, n. 3, p. 43-69, 2011. (http://dx.doi.org/10.4136/ambi-agua.740)
64
Another necessary comparison is between the chemical parameters (chlorides, ammonia nitrogen and phosphate) that were analyzed in the Well 3 groundwater, the water of inactive sand mine and the mouth of the channel in Piracuama river.
The chlorides can have two origins in the case of groundwater and surface water in the floodplain of the Paraíba do Sul river. They either come from wastewater (consumption of salt by the population that is discharged into the rivers as untreated sewage) or from organochlorine pesticides used in the rice during the growing season.
In the waters of inactive sand mine, the levels of chloride vary little because in this case it comes from the waters of the channel in Piracuama river where the load of untreated domestic sewage originating from rural districts in the municipality of Pindamonhangaba and Tremembé are launched. In the aquifer near the inactive mine, the water levels increased sharply after periods of intense rains, and the same occurs in the inactive mine, raising the suspicion that this increase is due to the infiltration of rainwater organochlorine pesticides load that have been released into the soil during the germination of rice, in October and November, 2010.
Ammonia nitrogen originates in fertilizers used during the liming of the soil, applied just before the planting of rice in the months of August and September. During the dry season, beginning on April, the amount is insignificant in both, Well 3 and inactive open-pit mine, as shown in Table 4. As the water of the channel in Piracuama river is diverted for irrigation of rice, from the month of October on, there is an increased level of ammonia nitrogen in groundwater of the sedimentary aquifer while in the mouth of the river channel and in inactive open-pit mine it remains constant. This indicates that the urea (ammonium nitrate) used in fertilization, dissolved in irrigation water infiltrates into the aquifer, in the rice fields areas.
Agriculture is recognized (Canter et al., 1987) as a potential source of groundwater contamination. The oxidation of ammonia, from urea fertilizer in an aerobic biological process, turns it in nitrite, by the action of the bacteria group Nitrosomonas and, ultimately, into nitrate by the Nitrobacter group (Chapelle, 2001).
As the movement of surface water and groundwater in the area of the floodplain of the Paraíba do Sul river is very fast, a large part of ammonia is not oxidized, resulting in low levels of nitrite and nitrate.
The hardness, i.e. the content of calcium and magnesium in samples collected in March, 2011, ranged from 50 and 70 mg/L in the Quaternary sedimentary aquifer, while in surface waters, the values varied from 6 to 17 mg/L indicating an accumulation from fertilization with dolomitic limestone before planting, which is usually applied in August and September. Likewise, the amount of calcium varied between 2 and 58 mg/L in groundwater and between 5 and 10 mg/L in surface waters. The magnesium content corroborates these results, ranging from 8 to 68 mg/L in groundwater, and between 1 and 7 mg/L in surface waters.
The total Phosphorus analyzed is mainly composed of phosphate from agricultural fertilizers used in the rice cultivation. The content in Well 3 was always greater than in the inactive open-pit mine because there is consumption of phosphorus by macrophytes that develop in inactive mines, while in the groundwater it is cumulative. In rainy months, the total phosphorus content decreases in both underground (aquifer) and surface (inactive open-pit mine). Carmo (2007) found values up to 16% of contribution of total phosphorus coming from groundwater, in ponds fed by groundwater in western São Paulo State.
Levels of sulfates shown in Table 3 are related to the action of Desulfovibrio, a genus of Gram negative sulfate-reducing bacteria which reduced sulfate in the waters and turned it into sulphidric acid (volatile) that causes bad odors in paludal environment (Manahan, 2005). In waters where H2S is produced, the sediments become dark due to FeS formation and this occurs in the organic clays of the floodplain of the Paraíba do Sul river.
DINIZ, H. N.; GALINA, M. H.; TARGA, M. S.; BATISTA G. T.; LINDENBERG, M. F. Hydrogeologic monitoring of the Paraíba do Sul river floodplain area subject to sand mining in the Tremembé municipality, SP, Brazil. Ambi-Agua, Taubaté, v. 6, n. 3, p. 43-69, 2011. (http://dx.doi.org/10.4136/ambi-agua.740)
65
There was dilution of total dissolved solids levels in all analyzed environment (Tables 3 and 4). This fact decreases their concentration due to the contribution of atmospheric water during the rainy season which occurred from November 2010 to March 2011.
Biochemical Oxygen Demand showed little annual variation in Well 3. In this case, the BOD was related to the probable existence of bacteria in the groundwater aquifer. However, for inactive open-pit mine, the variation was greater and it had a peak after heavy rains of July 14, 2010, decreasing gradually in the remainder of 2010 until early 2011.
Another noteworthy relationship is among Chemical Oxygen Demand, Total and Fecal Coliforms content. The amount of total coliforms varied slightly in Well 3, being insignificant. In the inactive open-pit mine, where water levels follow the groundwater levels (Well 3) there was an increase in the number of total coliforms in line with the decrease in water level between April and July, 2010. From November, 2010, there was the contribution of water from the diversion from the channel in Piracuama river and from the rainwater and then, the number gradually decreased, associated with the increased amount of water coming from these external sources into the surface waters of the inactive mines.
The fecal coliforms are also very significant in the groundwater (Well 3). However, in the inactive open-pit mine, their number increased with the dry season (winter) and decreased in the rainy season (summer). It has an inverse relationship with temperature (increases as the water temperature decreases) and a direct relation with the amount of precipitation (it increases with rainfall).
3.3.3. Comparisons between the water quality in Well 4 and active open-pit mine The groundwater at Well 4 and the waters of a nearby active mine were sampled monthly
between March, 2010 to March, 2011, for physical-chemical and bacteriological analyses. The comparison between the analyses of waters from Well 4 and the active mine (Table 5) is relevant because, even though the Quaternary sedimentary aquifer have a typical behavior at the Well 4 site, the waters that emerge from the active sand mine, located in a close distance that varied from 20 m to 200 m over the period of sampling collection, are from the aquifer. In this case, it must be considered that the active mining operation is dynamic and the distance from Well 4 varied in that period. Also, rice had been cultivated for a long period nearby Well 4 and stopped just before the advance of the open-pit sand mining.
Comparison shows a good correlation between the Well 4 and active open-pit mine waters regarding the amount of dissolved metals (Iron) and the physical parameters of these waters (Eh, pH) (Table 4). An environment that is more acid and reducer has greater amount of dissolved metals (Marques et al., 2010).
The pH of both, Well 4 and open-pit mine active waters had small oscillations in the dry season and decreased during the rainy season, mainly from December, 2010, indicating an increase in water acidity. The Eh values remained oscillating but were always positive indicating an oxidizing environment for the active open-pit mine, and preferably with negative values (reducing environment) for groundwater (Well 4). In the groundwater (Well 4), the average value of Eh was -55 mV and in the active open-pit mine was +144 mV. The standard deviation of 40, for the groundwater (Well 4) and 70, for the waters in the active mine, show that there was annual variation in the electron content of aqueous solutions.
The behavior of the chlorides, sulfates and phosphates was well diversified, and although the amount of chlorides are similar for both waters, for the month of December, 2010, there was an increasing in concentration in the groundwater, probably associated with the use of pesticides (organochlorine) that infiltrated in the free areas of the Quaternary sedimentary aquifer (Bouman et al., 2002). The levels of sulfates were always small, both in the groundwater (Well 4) and in the open-pit mine. The phosphate ion was frequently higher in groundwater, probably due to infiltration of fertilizers used in the rice fields.

DINIZ, H. N.; GALINA, M. H.; TARGA, M. S.; BATISTA G. T.; LINDENBERG, M. F. Hydrogeologic monitoring of the Paraíba do Sul river floodplain area subject to sand mining in the Tremembé municipality, SP, Brazil. Ambi-Agua, Taubaté, v. 6, n. 3, p. 43-69, 2011. (http://dx.doi.org/10.4136/ambi-agua.740)
66
Table 5. Chemical analysis of water samples from Well 4 and active sand mine. Sampling Dates
2010 2011 PARAMETERS
Mar 25
Apr 13
May 11
Jun 15
Jul 27
Ago 10
Sep 10
Oct 19
Nov 24
Dez 7
Fev 1
Mar15
pH 5.60 6.04 5.82 6.20 6.07 5.77 5.50 5.87 5.73 5.89 6.29 pH 5.78 6.47 5.35 5.14 5.29 4.45 5.67 4.79 4.42 4.97 4.72 4.13 Conductivity (mS/m) 15.0 19.0 9.64 22.8 17.0 17.0 17.0 16 7.0 7.0 10
Conductivity (mS/m) 10.0 18.0 22.7 26.3 10.0 12.0 18.0 14.0 11.0 5.0 5.0 5
Turbidity (NTU) 38 27.6 63 380 630 290 580 450 280 83
Turbidity (NTU) 620 540 420 340 440 370 370 310 54 14 250 180
Temp (°C) 22.5 22.9 22.0 20.6 22.7 22.6 22.6 22.4 22.2 22.2 24.4 Temp (°C) 27.4 23.0 21.9 17.3 19.6 19.4 21.3 21.9 25.1 27.2 26.7 26.9 TDS (g/L) 0.10 0.13 0.12 0.11 0.11 0.10 0.16 0.05 0.05 0.02 TDS (g/L) 0.07 0.12 0.20 0.07 0.07 0.19 0.09 0.07 0.03 0.03 0.03 Eh -72 39 -2 -61 -54 -67 -113 -72 -63 -82 -83 Eh 103 97 235 194 158 208 47 11 211 143 122 194 Cl- 18.7 28.32 28.62 19.53 24.73 199.7 31.83 Cl- 17.83 32.55 30.21 52.08 24.25 23.8 22.75 21.85 COD (mg/L) 0.40 21.34 10.21 5.28 5.38 12.67 4.42 12.00 11.78 8.06 COD (mg/L) 14.20 25.39 19.36 14.43 7.39 13.06 9.94 8.40 3.68 13.57 4.93 BOD (mg/L) 0 0 0 0.4 0 0 0 BOD (mg/L) 5.2 0.8 6.2 4.4 3.2 1.8 1.7 1.6 NO3
- (mg/L) 0.04 0.06 0 0 0 0 0 0.09 0.06 0.12 NO3
- (mg/L) 0.16 0.53 0.43 0.21 0.19 0.35 0.03 0.06 0.03 0.11 0.12 NO2
- (mg/L) 0 0.02 0 0 0 0 0 0 0 0.04 NO2
- (mg/L) 0 0.11 0 0 0 0 0 0 0 0 0 NH4
- (mg/L) 0 0.02 0 0 0 0 0 0 0 0 NH4
- (mg/L) 0.28 0.26 0 0 0 0.06 0 0.05 0.13 0.09 0.09 SO4
- (mg/L) 0 0 0 3.68 1.32 1.02 0.09 0.00 SO4
- (mg/L) 0 0 0 11.08 1.86 1.86 0.28 0.76 0.67 Fe (mg/L) 1.25 0.50 2.40 2.5 1.39 1.43 0.39 Fe (mg/L) 0.23 0.23 0.22 0.23 2.30 0.10 0.06 0.13 0.04 P-tot (mg/L) 0.49 0.39 0.64 0.04 0.42 0.02 0.47 0.35 0.19 0.35 P-tot (mg/L) 0.31 0.21 0.25 0.07 0.18 0.17 0.13 0 0 0.28 0.22 TOTCOL (MPN/100mL) 17 7.8 7.8 1.8 2 330 4.5 220 TOTCOL (MPN/100mL 1300 47000 54000 92000 7900 70000 450 3500 17 FCC (MPN/100mL) 4 1.8 1.8 1.8 1.8 1.8 1.8 31 0 12 FCC (MPN/100mL) 1.8 4.5 400 110 11 9200 490 4000 2 210 12
GHB (UFC/mL) 390 90 310 120 100 68 170 390 270 810 GHB (UFC/mL) 3000 >5700 >5700 >5700 >5700 >5700 >5700 >5700 430 >5700 300 Time sampling 10:21 10:40 9:40 10:20 10:40 12:03 10:11 12:20 Time sampling 9:14 9:30 9:28 9:20 9:01 9:00 9:00 9:56 10:00
Note: Well 4 results have no background color and the active sand mine results are highlighted in light blue.
DINIZ, H. N.; GALINA, M. H.; TARGA, M. S.; BATISTA G. T.; LINDENBERG, M. F. Hydrogeologic monitoring of the Paraíba do Sul river floodplain area subject to sand mining in the Tremembé municipality, SP, Brazil. Ambi-Agua, Taubaté, v. 6, n. 3, p. 43-69, 2011. (http://dx.doi.org/10.4136/ambi-agua.740)
67
As might be expected, the BOD is lower in groundwater (Well 4) than in the active open-pit mine, and in another hand, the amount of total and thermal tolerant coliforms are higher in the of the open-pit mine waters.
4. CONCLUSIONS
The analysis of meteorological data in the period between April, 2010 and March, 2011 shows that there are two different climatic periods in the area of the floodplain of the Paraíba do Sul river, a dry season which runs from April to October and a wet season between November and March. The weekly average wind speed is always higher in winter than in other seasons of the year. The natural moisture as well as weekly average temperatures behavior varied along the year, but had the lowest values during the winter.
The water balance shows that the period between April and October, 2010 had water deficit in the soil profile, but a recovery occurred in the months of November and December. From mid-December, 2010 to March, 2011, the soil profile had water surplus.
Measurements of groundwater levels and parameter characteristics in five different spots in the floodplain area showed that there was influence of the surface waters of the Paraíba do Sul river, as well as of the waters of active and abandoned open-pit mines, on the groundwater of the sedimentary Quaternary aquifer. Results revealed that the Paraíba do Sul river is an influential river and controls the levels and the groundwater flow. In addition, the existence of active and abandoned open-pit mine intercepting the aquifer allows loss of water by evaporation to the atmosphere, in a similar way that pumping of wells withdraws water from the aquifer. Formulas currently used in hydrogeology were implemented and allowed the interpretation of the aquifer hydrograph in order to estimate the loss of water to the atmosphere caused by evapotranspiration in the floodplain area.
Based on the implemented model for the interpretation of the hydrograph of Wells 2 and 4, it could be concluded that in the area of the Crozariol farm, the water loss by evapotranspiration in the open-pit sand mines, located at distances between 212.2 and 885.0 m of the wells (Well 2 and Well 4) ranges between 83,4 e 89,2 m3/h.
The analysis of various parameters of surface water and groundwater showed that the waters of the Paraíba do Sul river supplies the Quaternary sedimentary aquifer. Nevertheless, in general, the river, the active open-pit sand mine and the irrigation channels for rice cropping form an oxidizing environment, while the inactive open-pit sand mine and Quaternary sedimentary aquifer have a reducing environment, and consequently, a larger amount of metal ions dissolved.
The amount of ammonia is higher in groundwater and this reflects the infiltration of fertilizers used in rice fields in the Quaternary sedimentary aquifer. The amount of chlorides is also higher in these waters as a result of infiltration of organochlorines used as pesticides.
5. ACKNOWLEDGE
The authors acknowledge the material, personnel and financial support for this research from FAPESP - Research Support Foundation of the São Paulo State, Process 2008/05400-9, from the Geological Institute of the São Paulo State, from the Environmental Sciences Program of the University of Taubaté and from the Environment Secretariat of Tremembé Municipality.

DINIZ, H. N.; GALINA, M. H.; TARGA, M. S.; BATISTA G. T.; LINDENBERG, M. F. Hydrogeologic monitoring of the Paraíba do Sul river floodplain area subject to sand mining in the Tremembé municipality, SP, Brazil. Ambi-Agua, Taubaté, v. 6, n. 3, p. 43-69, 2011. (http://dx.doi.org/10.4136/ambi-agua.740)
68
6. REFERENCES
AGOSTINI, M. D. Dinâmica do uso da terra na planície aluvionar do Rio Paraíba do Sul - Município de Taubaté. 2000. 115 f. Dissertação (Mestrado em Ciências Ambientais) - Universidade de Taubaté, Taubaté, 2000.
ANDRADE, M. H.; SOUZA, C. F.; VARALLO, A. C. T.; PERES, J. G. Impactos da produção do arroz inundado na qualidade da água do rio Paraíba do Sul - trecho Taubaté, SP, Brasil. Revista Ambiente & Água, Taubaté, v. 5, n. 1, p. 114-133, 2010. http://dx.doi.org/10.4136/ambi-agua.124
ARAÚJO, P. P.; OLIVEIRA, F. de A.; CAVALCANTE, I. N.; QUEIROZ, J. C. B.; CARNEIRO, B. S.; TANCREDI, A. C. F. N. S. Classificação hidroquímica e contaminação por nitrato no aquífero livre Barreiras na bacia do rio Capitão Pocinho, região do médio rio Guamá, na Amazônia oriental. Revista Ambiente & Água, Taubaté, v. 6, n. 2, p. 266-281, 2011. http://dx.doi.org/10.4136/ambi-agua.199
BOUMAN, B. A. M.; CASTAÑEDA, A. R.; BHUIYAN, S. I. Nitrate and pesticide contamination of groundwater under rice-based cropping systems: past and current evidence from the Philippines. Agriculture Ecosystems and Environment, London, v. 92, p. 185-199, 2002. http://dx.doi.org/10.1016/S0167-8809(01)00297-3
CANTER, L. W.; KNOX, R. C; FAIRCHILD, D. M. Ground water quality protection. Michigan: Lewis Publishers, 1987. 562 p.
CARMO, C. F. Influência do aqüífero freático na dinâmica de nutrientes (nitrogênio e fósforo) em lagoas com diferentes características hidrodinâmicas. 2007. 257 f. Tese (Doutorado em Engenharia Ambiental) - Escola de Engenharia de São Carlos, São Carlos, 2007.
CHAPELLE, F. Ground-water microbiology and geochemistry. New York: Wiley, 2001. 477 p.
D’ANGIOLELLA, G. L. B.; VASCONCELLOS, V. L. D. Cálculo do balanço hídrico climatológico com diferentes métodos para estimativa da evapotranspiração potencial, em planilhas ExcelTM. In: CONGRESSO BRASILEIRO DE METEOROLOGIA, 12., 2002, Foz do Iguaçu. Anais... Foz do Iguaçu, 2002
DINIZ, H. N.; GALINA, M. H.; BATISTA, G. T.; TARGA, M. S. Hidrogeologia da Várzea do rio Paraíba do Sul: estudo de caso em uma área de mineração no município de Tremembé, SP, Brasil. Revista Ambiente & Água, Taubaté, v. 5, n. 3, p. 76-107, 2010. http://dx.doi.org/10.4136/ambi-agua.155
FOLHES, M. T.; FISCH, G. Caracterização climática e estudo de tendências nas séries temporais de temperatura do ar e precipitação em Taubaté (SP). Revista Ambiente & Água, Taubaté, v. 1, n. 1, p. 61-71, 2006. http://dx.doi.org/10.4136/ambi-agua.6
HEALY, R. W.; COOK, P. G. Using groundwater levels to estimate recharge. Hydrogeology Journal, Heidelberg, v. 10, n. 1, p. 91-109, 2002. http://dx.doi.org/10.1007/s10040-001-0178-0
JACOB, C. E. On the flow of water in an elastic artesian aquifer. In: AMERICAN GEOPHYSICAL UNION TRANSACTIONS, 22., 1940, Washington. Proceedings… Washington, 1940. p. 574-586. Part 2.

DINIZ, H. N.; GALINA, M. H.; TARGA, M. S.; BATISTA G. T.; LINDENBERG, M. F. Hydrogeologic monitoring of the Paraíba do Sul river floodplain area subject to sand mining in the Tremembé municipality, SP, Brazil. Ambi-Agua, Taubaté, v. 6, n. 3, p. 43-69, 2011. (http://dx.doi.org/10.4136/ambi-agua.740)
69
MANAHAN, S. E. Environmental chemistry. 8th. Ed. Boca Raton: CRC Press, 2005. 783p.
MARQUES, E. D.; SELLA, S. M.; BIDONE, E. D.; SILVA-FILHO, E. V. Geochemical behavior and dissolved species control in acid sand pit lakes, Sepetiba sedimentary basin, Rio de Janeiro, SE – Brazil. Journal of South American Earth Sciences, London, v. 30, n. 3-4, p. 176-188, December 2010. http://dx.doi.org/10.1016/j.jsames.2010.04.003
PENMAN, H. L. Natural evaporation from open water, bare soil and grass. Proc. Roy. Soc. Acad., London, v. 193, n. 1032, p. 120-145, 1948.
PEREIRA, A. R.; VILLA NOVA, N. A.; SEDIYAMA, G. C. Evapotranspiração. Piracicaba: FEALQ, 1977. 183p.
RAJ, P. Classification and interpretation of piezometer well hydrographs in parts of southeastern peninsular India. Environmental Geology, Berlin, v. 46, n. 6-7, p.808-819, 2004. http://dx.doi.org/10.1007/s00254-004-1031-2
REIS, B. J.; BATISTA, G. T.; TARGA, M. S.; CATELANI, C. S. Desenvolvimento de um banco de dados georreferenciados para a avaliação de atividades minerarias da planície aluvial do rio Paraíba do Sul. Revista de Biociências, Taubaté, v. 12, n. 1-2, p. 34-42, 2006a.
REIS, B. J.; BATISTA, G. T.; TARGA, M. S.; CATELANI, C. S. Influência das cavas de extração de areia no balanço hídrico do vale do Paraíba do Sul. Revista Escola de Minas, Ouro Preto, MG, v. 59, n. 4, p. 391-396, 2006b.
SU, N. A formula for computation of time-varying recharge of groundwater. Journal of Hydrology, Amsterdam, v. 160, n. 1-4, p. 123-135, 1994. http://dx.doi.org/10.1016/0022-1694(94)90037-X