Introduction to Islam in Britain Introduction to Islam in Britain.
Forest Research Annual Report and Accounts 2003–200466
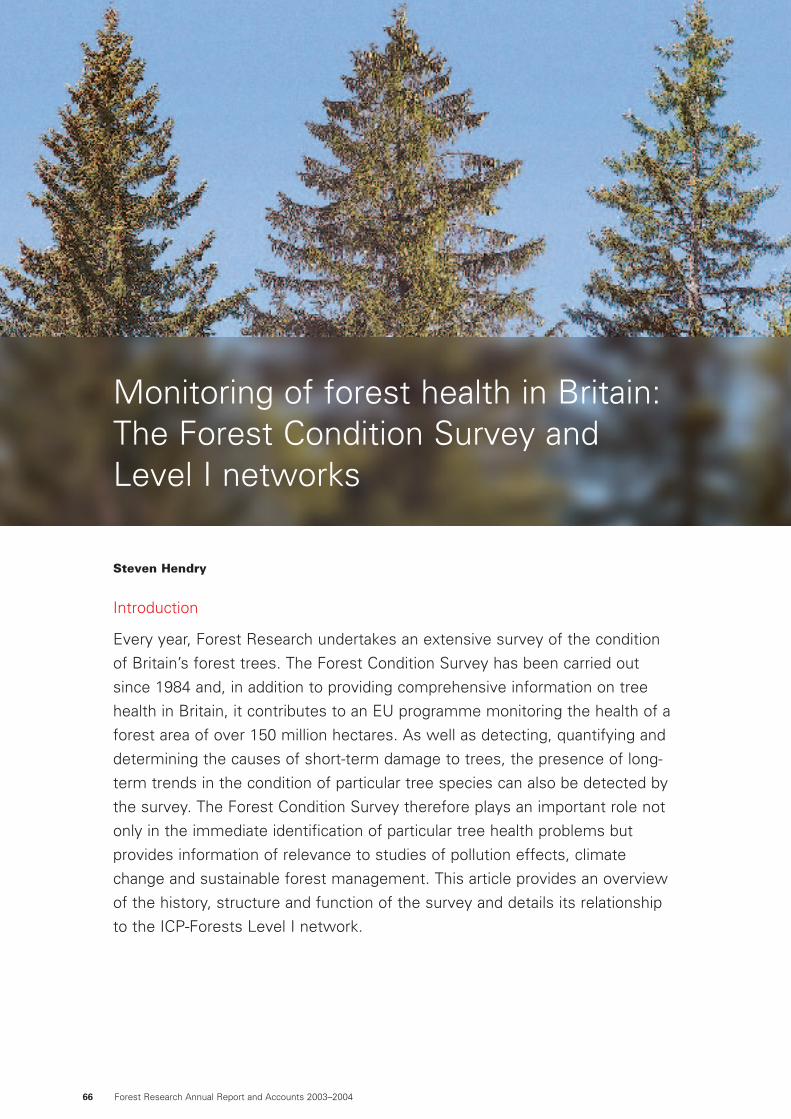
Monitoring of forest health in Britain:The Forest Condition Survey and Level I networks
Introduction
Every year, Forest Research undertakes an extensive survey of the condition
of Britain’s forest trees. The Forest Condition Survey has been carried out
since 1984 and, in addition to providing comprehensive information on tree
health in Britain, it contributes to an EU programme monitoring the health of a
forest area of over 150 million hectares. As well as detecting, quantifying and
determining the causes of short-term damage to trees, the presence of long-
term trends in the condition of particular tree species can also be detected by
the survey. The Forest Condition Survey therefore plays an important role not
only in the immediate identification of particular tree health problems but
provides information of relevance to studies of pollution effects, climate
change and sustainable forest management. This article provides an overview
of the history, structure and function of the survey and details its relationship
to the ICP-Forests Level I network.
Steven Hendry
BackgroundIn the mid-1970s, reports of declining forest
health began to emanate from Central Europe.
Initially, these reports did not cause undue
concern since they mainly related to the
condition of European silver fir (Abies alba), a
species which was known to have suffered
periodic declines for at least the previous 100
years (Wachter, 1978). However, by the early
1980s accounts of new and widespread damage
to Norway spruce and a number of broadleaved
species were being received from Germany and
other central European countries. The scale and
development of the forest damage which was
apparently occurring in Europe prompted many
countries to establish national surveys in order
to assess the condition of their own forests.
The Forestry Commission initiated the first survey
of forest health in Britain in 1984, assessing the
condition of Sitka spruce, Norway spruce and
Scots pine (Binns et al., 1985). By 1987, the
programme had been expanded to include oak
and beech and the age range of the trees
assessed in the survey had been widened to
incorporate older crops of the coniferous species.
Plots were also established on private land to
increase the survey’s geographical coverage and
to provide a more representative sample of
British forests (Innes and Boswell, 1987).
Forest decline was linked with air pollution by
certain scientists and foresters during the 1980s.
Concern over atmospheric pollution had already
given rise to the Convention on Long-Range
Transboundary Air Pollution (CLRTAP) in 1979
and, under its auspices, an International Co-
operative Programme on Assessment and
Monitoring of Air-Pollution Effects on Forests
(ICP-Forests) was set up in 1985. In co-operation
with the European Commission (EC), which
introduced legislation requiring member states
to undertake forest health monitoring
programmes in 1986 (Regulation EEC No.
3528/86), an extensive network of forest
monitoring plots (the Level I network) was
established. By 2002, 17 countries from outwith
the EU and 15 EU member states including the
United Kingdom were contributing to an ICP-
Forests Level I network consisting of
approximately 132 000 trees located in 5900
plots and representing a forest area of over 150
million hectares (Lorenz et al., 2003).
The Level I survey was designed to provide
accurate information on changes in the extent,
distribution and symptoms of forest damage
occurring at a European scale. However, to
obtain sufficient data to allow the identification
of trends in forest condition at a national level
many countries, including Britain, established
and retained networks of plots at a higher
density than that required for the Level I survey.
The survey protocols followed by individual
countries, although sharing many of the
assessments laid out in the ICP-Forests manual
(Anon., 1998), also differed according to national
requirements (Innes, 1990). This article provides
a detailed account of the structure and function
of the annual Forest Condition Survey (FCS)
carried out in Britain and details its relationship
to the ICP-Forests Level I network.
Forest Research Annual Report and Accounts 2003–2004 67
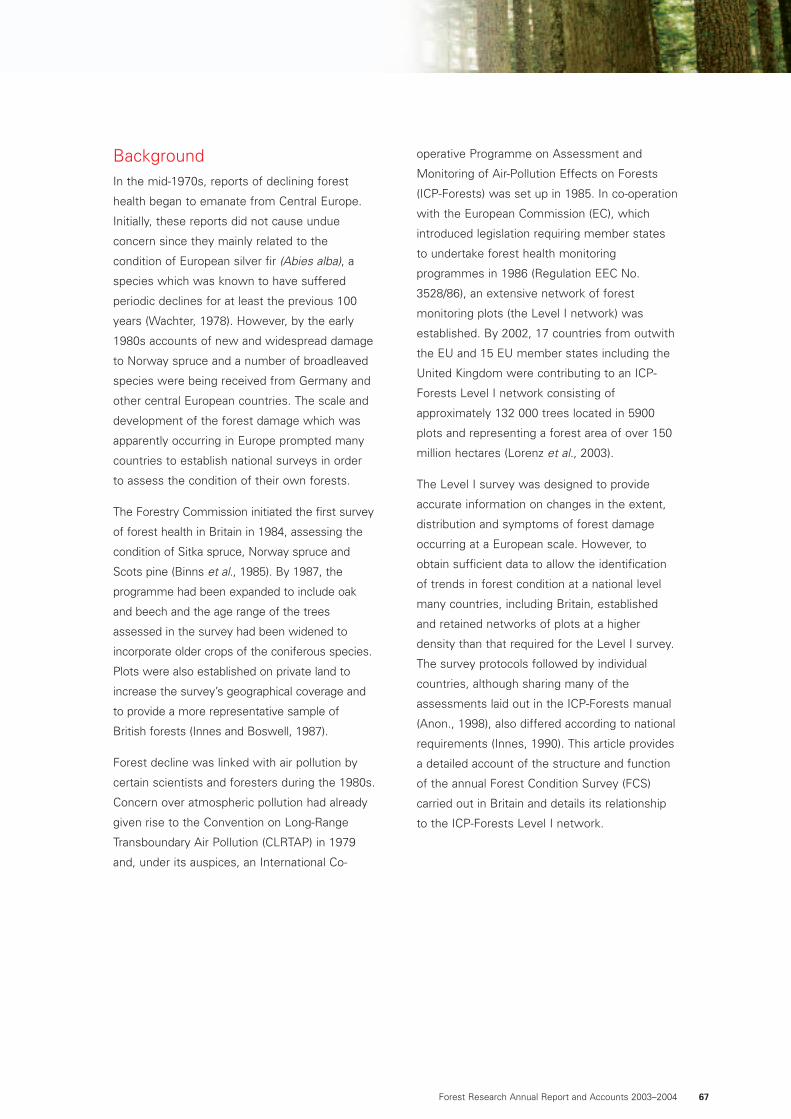
Overview of the Forest ConditionSurveyThe current Forest Condition Survey is based
upon the assessment of five tree species:
Norway spruce, Sitka spruce, Scots pine, oak
and beech. Each year, between late June and
September, the condition of approximately 8400
trees distributed across a network of 350
permanent monitoring plots is determined
(Figure 1). Plots consist of 24 trees located in
four sub-plots of six trees and, depending upon
the species assessed, between 29 and 33
features indicative of condition are scored for
each tree. The feature of greatest interest is an
assessment of crown density: an estimate of
the degree of transparency of the crown which
is used as an index of tree condition.
Reductions in crown density are estimated in
5% classes by reference either to a standard set
of photographs of ‘ideal’ trees (Innes, 1990) or
to ‘instant’ photographs of individual local
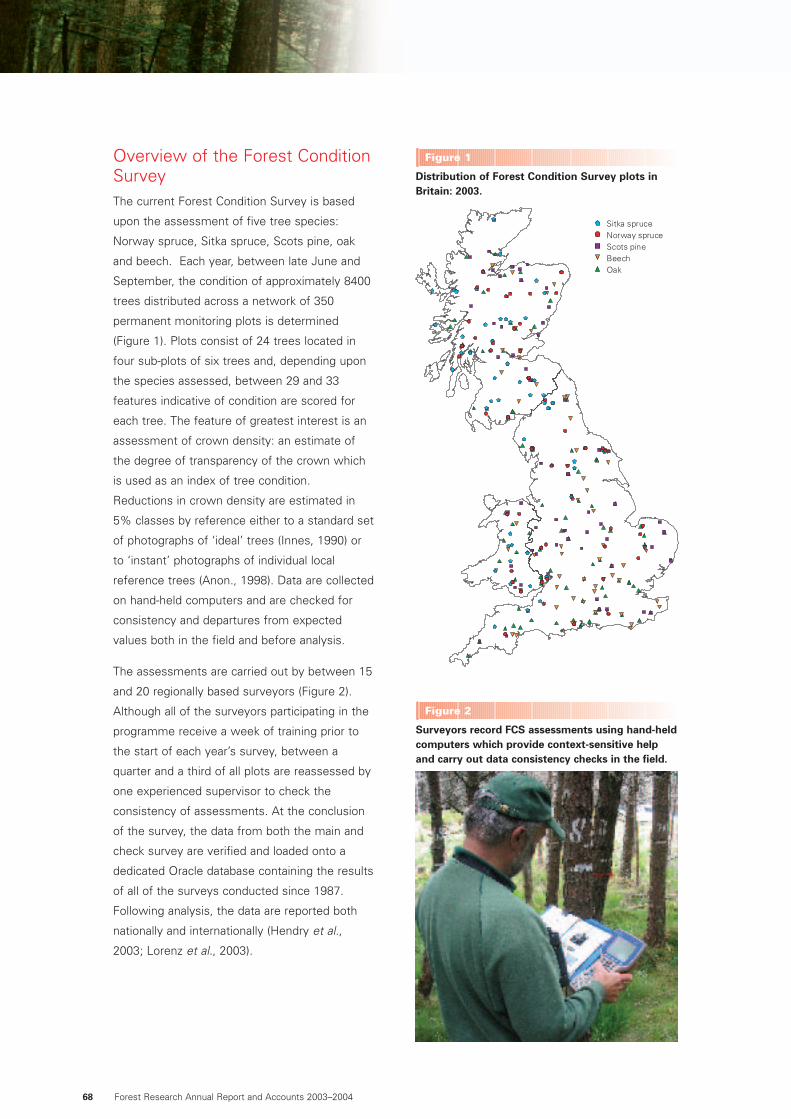
reference trees (Anon., 1998). Data are collected
on hand-held computers and are checked for
consistency and departures from expected
values both in the field and before analysis.
The assessments are carried out by between 15
and 20 regionally based surveyors (Figure 2).
Although all of the surveyors participating in the
programme receive a week of training prior to
the start of each year’s survey, between a
quarter and a third of all plots are reassessed by
one experienced supervisor to check the
consistency of assessments. At the conclusion
of the survey, the data from both the main and
check survey are verified and loaded onto a
dedicated Oracle database containing the results
of all of the surveys conducted since 1987.
Following analysis, the data are reported both
nationally and internationally (Hendry et al.,
2003; Lorenz et al., 2003).
Forest Research Annual Report and Accounts 2003–200468
Sitka spruceNorway spruceScots pineBeechOak
Distribution of Forest Condition Survey plots inBritain: 2003.
Figure 1
Surveyors record FCS assessments using hand-heldcomputers which provide context-sensitive helpand carry out data consistency checks in the field.
Figure 2
Forest Research Annual Report and Accounts 2003–2004 69
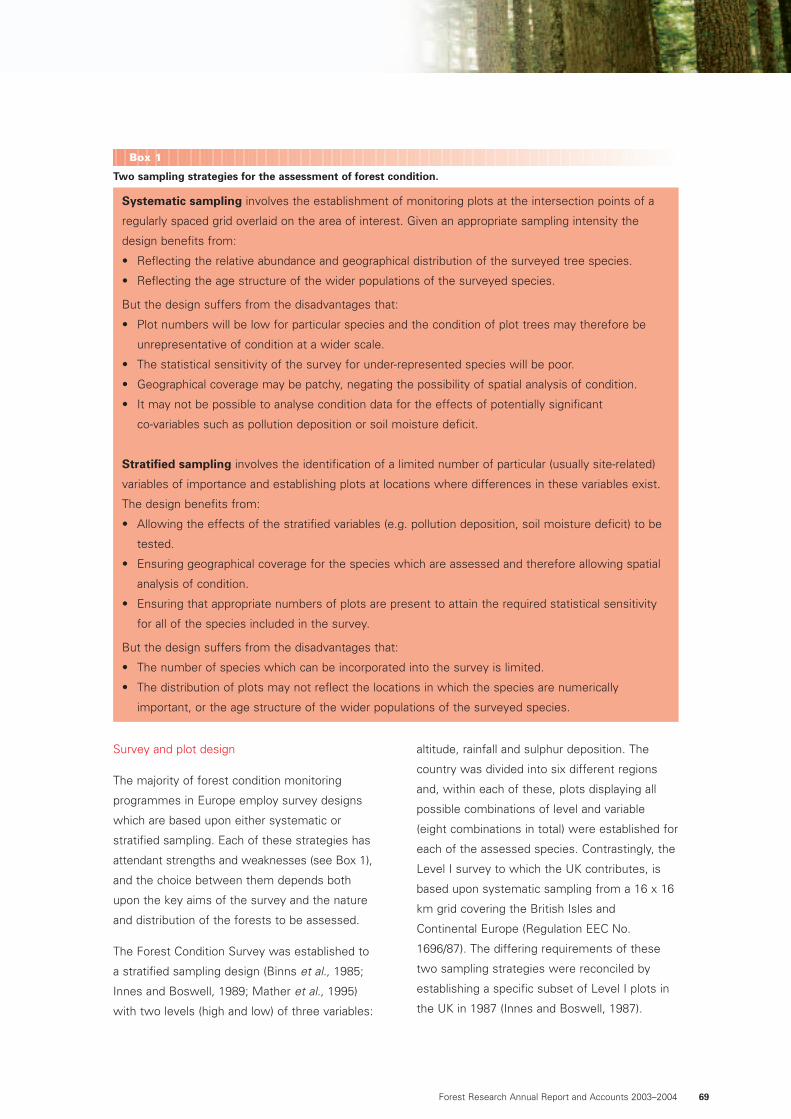
Two sampling strategies for the assessment of forest condition.
Box 1
Systematic sampling involves the establishment of monitoring plots at the intersection points of a
regularly spaced grid overlaid on the area of interest. Given an appropriate sampling intensity the
design benefits from:
• Reflecting the relative abundance and geographical distribution of the surveyed tree species.
• Reflecting the age structure of the wider populations of the surveyed species.
But the design suffers from the disadvantages that:
• Plot numbers will be low for particular species and the condition of plot trees may therefore be
unrepresentative of condition at a wider scale.
• The statistical sensitivity of the survey for under-represented species will be poor.
• Geographical coverage may be patchy, negating the possibility of spatial analysis of condition.
• It may not be possible to analyse condition data for the effects of potentially significant
co-variables such as pollution deposition or soil moisture deficit.
Stratified sampling involves the identification of a limited number of particular (usually site-related)
variables of importance and establishing plots at locations where differences in these variables exist.
The design benefits from:
• Allowing the effects of the stratified variables (e.g. pollution deposition, soil moisture deficit) to be
tested.
• Ensuring geographical coverage for the species which are assessed and therefore allowing spatial
analysis of condition.
• Ensuring that appropriate numbers of plots are present to attain the required statistical sensitivity
for all of the species included in the survey.
But the design suffers from the disadvantages that:
• The number of species which can be incorporated into the survey is limited.
• The distribution of plots may not reflect the locations in which the species are numerically
important, or the age structure of the wider populations of the surveyed species.
Survey and plot design
The majority of forest condition monitoring
programmes in Europe employ survey designs
which are based upon either systematic or
stratified sampling. Each of these strategies has
attendant strengths and weaknesses (see Box 1),
and the choice between them depends both
upon the key aims of the survey and the nature
and distribution of the forests to be assessed.
The Forest Condition Survey was established to
a stratified sampling design (Binns et al., 1985;
Innes and Boswell, 1989; Mather et al., 1995)
with two levels (high and low) of three variables:
altitude, rainfall and sulphur deposition. The
country was divided into six different regions
and, within each of these, plots displaying all
possible combinations of level and variable
(eight combinations in total) were established for
each of the assessed species. Contrastingly, the
Level I survey to which the UK contributes, is
based upon systematic sampling from a 16 x 16
km grid covering the British Isles and
Continental Europe (Regulation EEC No.
1696/87). The differing requirements of these
two sampling strategies were reconciled by
establishing a specific subset of Level I plots in
the UK in 1987 (Innes and Boswell, 1987).
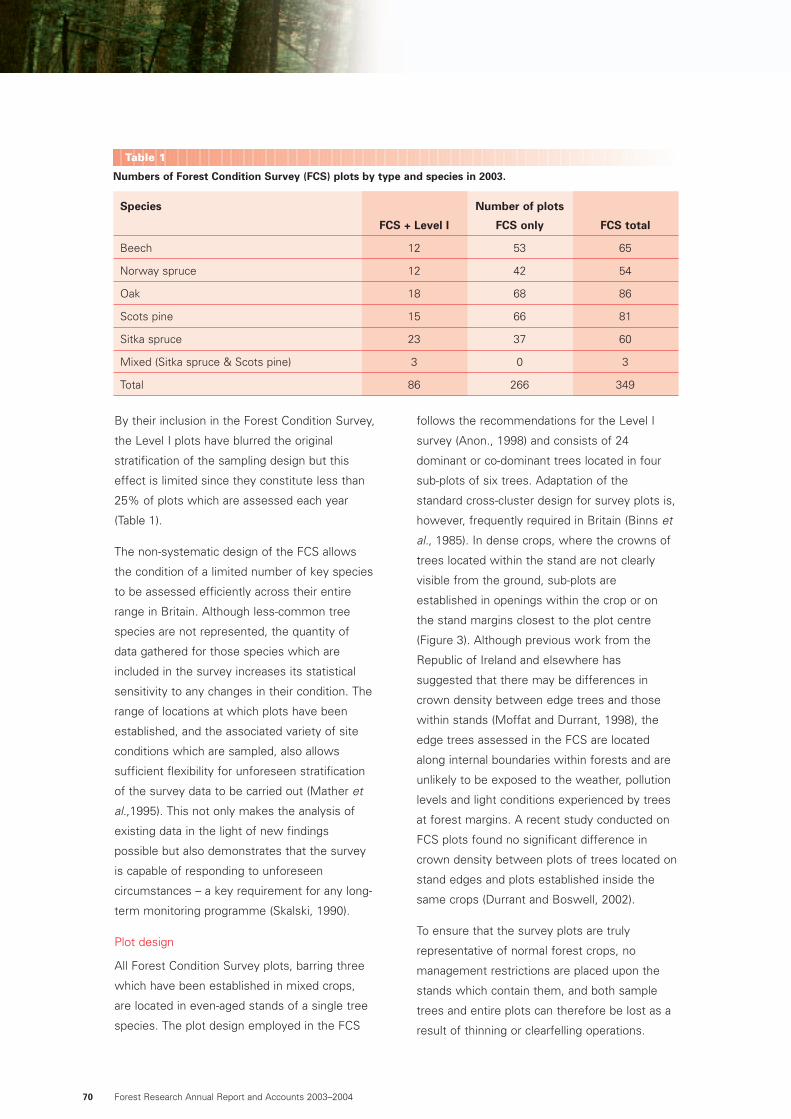
By their inclusion in the Forest Condition Survey,
the Level I plots have blurred the original
stratification of the sampling design but this
effect is limited since they constitute less than
25% of plots which are assessed each year
(Table 1).
The non-systematic design of the FCS allows
the condition of a limited number of key species
to be assessed efficiently across their entire
range in Britain. Although less-common tree
species are not represented, the quantity of
data gathered for those species which are
included in the survey increases its statistical
sensitivity to any changes in their condition. The
range of locations at which plots have been
established, and the associated variety of site
conditions which are sampled, also allows
sufficient flexibility for unforeseen stratification
of the survey data to be carried out (Mather et
al.,1995). This not only makes the analysis of
existing data in the light of new findings
possible but also demonstrates that the survey
is capable of responding to unforeseen
circumstances – a key requirement for any long-
term monitoring programme (Skalski, 1990).
Plot design
All Forest Condition Survey plots, barring three
which have been established in mixed crops,
are located in even-aged stands of a single tree
species. The plot design employed in the FCS
follows the recommendations for the Level I
survey (Anon., 1998) and consists of 24
dominant or co-dominant trees located in four
sub-plots of six trees. Adaptation of the
standard cross-cluster design for survey plots is,
however, frequently required in Britain (Binns et
al., 1985). In dense crops, where the crowns of
trees located within the stand are not clearly
visible from the ground, sub-plots are
established in openings within the crop or on
the stand margins closest to the plot centre
(Figure 3). Although previous work from the
Republic of Ireland and elsewhere has
suggested that there may be differences in
crown density between edge trees and those
within stands (Moffat and Durrant, 1998), the
edge trees assessed in the FCS are located
along internal boundaries within forests and are
unlikely to be exposed to the weather, pollution
levels and light conditions experienced by trees
at forest margins. A recent study conducted on
FCS plots found no significant difference in
crown density between plots of trees located on
stand edges and plots established inside the
same crops (Durrant and Boswell, 2002).
To ensure that the survey plots are truly
representative of normal forest crops, no
management restrictions are placed upon the
stands which contain them, and both sample
trees and entire plots can therefore be lost as a
result of thinning or clearfelling operations.
Forest Research Annual Report and Accounts 2003–200470
Numbers of Forest Condition Survey (FCS) plots by type and species in 2003.
Table 1
Species Number of plots
FCS + Level I FCS only FCS total
Beech 12 53 65
Norway spruce 12 42 54
Oak 18 68 86
Scots pine 15 66 81
Sitka spruce 23 37 60
Mixed (Sitka spruce & Scots pine) 3 0 3
Total 86 266 349
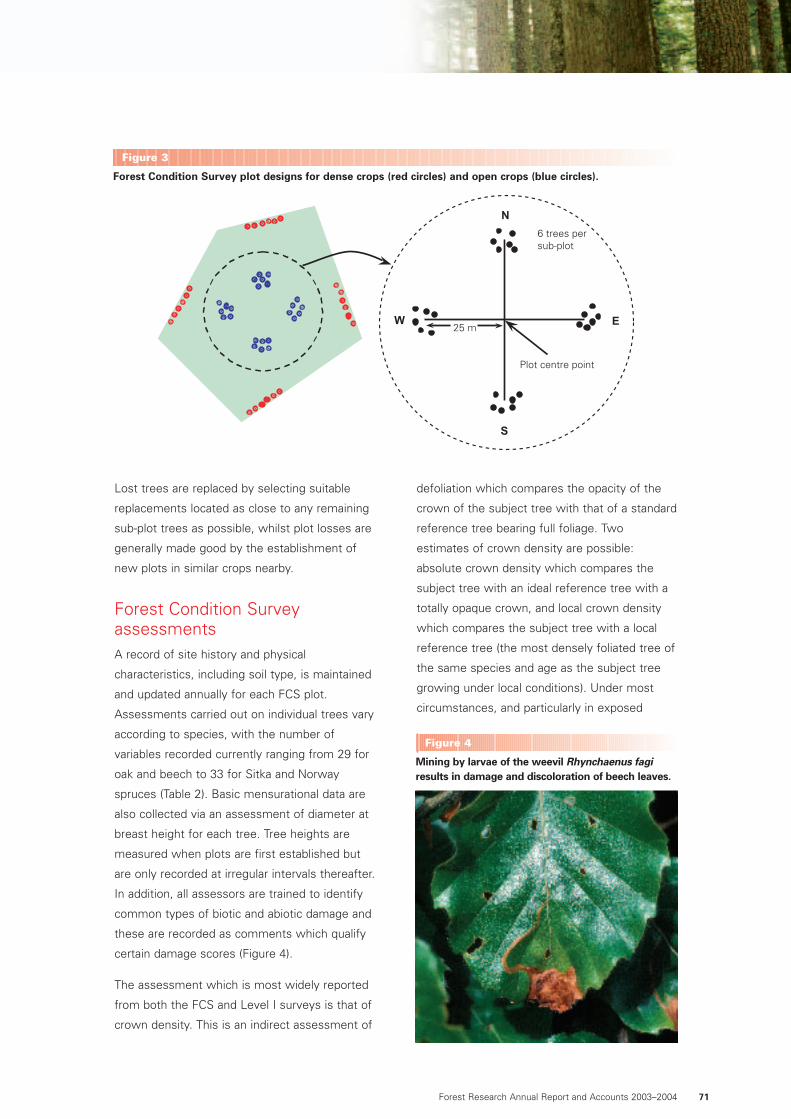
Lost trees are replaced by selecting suitable
replacements located as close to any remaining
sub-plot trees as possible, whilst plot losses are
generally made good by the establishment of
new plots in similar crops nearby.
Forest Condition SurveyassessmentsA record of site history and physical
characteristics, including soil type, is maintained
and updated annually for each FCS plot.
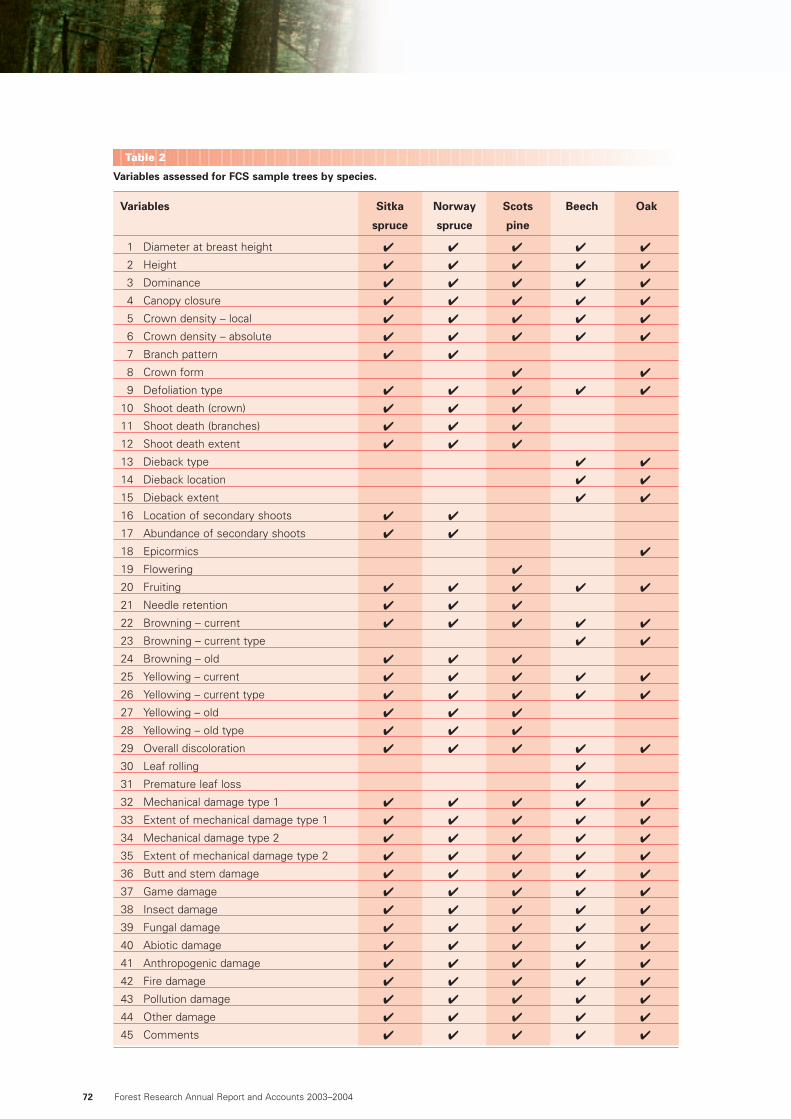
Assessments carried out on individual trees vary
according to species, with the number of
variables recorded currently ranging from 29 for
oak and beech to 33 for Sitka and Norway
spruces (Table 2). Basic mensurational data are
also collected via an assessment of diameter at
breast height for each tree. Tree heights are
measured when plots are first established but
are only recorded at irregular intervals thereafter.
In addition, all assessors are trained to identify
common types of biotic and abiotic damage and
these are recorded as comments which qualify
certain damage scores (Figure 4).
The assessment which is most widely reported
from both the FCS and Level I surveys is that of
crown density. This is an indirect assessment of
defoliation which compares the opacity of the
crown of the subject tree with that of a standard
reference tree bearing full foliage. Two
estimates of crown density are possible:
absolute crown density which compares the
subject tree with an ideal reference tree with a
totally opaque crown, and local crown density
which compares the subject tree with a local
reference tree (the most densely foliated tree of
the same species and age as the subject tree
growing under local conditions). Under most
circumstances, and particularly in exposed
Forest Research Annual Report and Accounts 2003–2004 71
6 trees persub-plot
25 m
Plot centre point
Forest Condition Survey plot designs for dense crops (red circles) and open crops (blue circles).
Figure 3
Mining by larvae of the weevil Rhynchaenus fagiresults in damage and discoloration of beech leaves.
Figure 4
Forest Research Annual Report and Accounts 2003–200472
Variables assessed for FCS sample trees by species.
Table 2
Variables Sitka Norway Scots Beech Oak
spruce spruce pine
1 Diameter at breast height 4 4 4 4 4
2 Height 4 4 4 4 4
3 Dominance 4 4 4 4 4
4 Canopy closure 4 4 4 4 4
5 Crown density – local 4 4 4 4 4
6 Crown density – absolute 4 4 4 4 4
7 Branch pattern 4 4
8 Crown form 4 4
9 Defoliation type 4 4 4 4 4
10 Shoot death (crown) 4 4 4
11 Shoot death (branches) 4 4 4
12 Shoot death extent 4 4 4
13 Dieback type 4 4
14 Dieback location 4 4
15 Dieback extent 4 4
16 Location of secondary shoots 4 4
17 Abundance of secondary shoots 4 4
18 Epicormics 4
19 Flowering 4
20 Fruiting 4 4 4 4 4
21 Needle retention 4 4 4
22 Browning – current 4 4 4 4 4
23 Browning – current type 4 4
24 Browning – old 4 4 4
25 Yellowing – current 4 4 4 4 4
26 Yellowing – current type 4 4 4 4 4
27 Yellowing – old 4 4 4
28 Yellowing – old type 4 4 4
29 Overall discoloration 4 4 4 4 4
30 Leaf rolling 4
31 Premature leaf loss 4
32 Mechanical damage type 1 4 4 4 4 4
33 Extent of mechanical damage type 1 4 4 4 4 4
34 Mechanical damage type 2 4 4 4 4 4
35 Extent of mechanical damage type 2 4 4 4 4 4
36 Butt and stem damage 4 4 4 4 4
37 Game damage 4 4 4 4 4
38 Insect damage 4 4 4 4 4
39 Fungal damage 4 4 4 4 4
40 Abiotic damage 4 4 4 4 4
41 Anthropogenic damage 4 4 4 4 4
42 Fire damage 4 4 4 4 4
43 Pollution damage 4 4 4 4 4
44 Other damage 4 4 4 4 4
45 Comments 4 4 4 4 4
Forest Research Annual Report and Accounts 2003–2004 73
areas, the local reference tree does not possess
a totally opaque crown and therefore represents
a less stringent standard for comparison than an
ideal reference tree. Between 1984 and 1992
only absolute crown density was assessed as
part of the Forest Condition Survey but since
1993 local crown density has also been
determined to harmonise with the survey
protocols employed by most other countries
contributing to the Level I monitoring
programme.
A local crown density assessment might be
seen as providing a more realistic impression of
a tree’s condition because it takes into account
factors such as tree age and exposure which will
affect the crown condition of even the healthiest
trees in a particular locality. However, because
trees in different areas of the country are being
compared with reference trees in different
states of defoliation, direct comparisons of local
crown density scores between plots can be
misleading. The relative condition of trees in
different localities can only be determined if the
condition of the local reference trees for each
plot are known (Redfern and Boswell, 2004).
Absolute crown density scores do not suffer
from similar problems of interpretation because
all trees are assessed with reference to a
common standard. The condition of trees in
different locations or at different times can
therefore be directly compared.
The function of many of the FCS assessments is
to qualify the crown density scores which are
obtained for each tree. In some cases, low
crown density scores can be directly attributed
to certain causes, e.g. to mechanical damage
such as breakage of branches by wind or snow,
resulting in gaps within the tree’s crown. In
many instances, however, it is necessary to
examine the change in crown density of a
species, plot or individual tree and to relate this
to changes in other attributes in order to identify
potential cause(s) of defoliation. For example, a
decrease in the mean crown density of a
species between one year and the next may be
related to an increase in damage from
defoliating insects (Box 2).
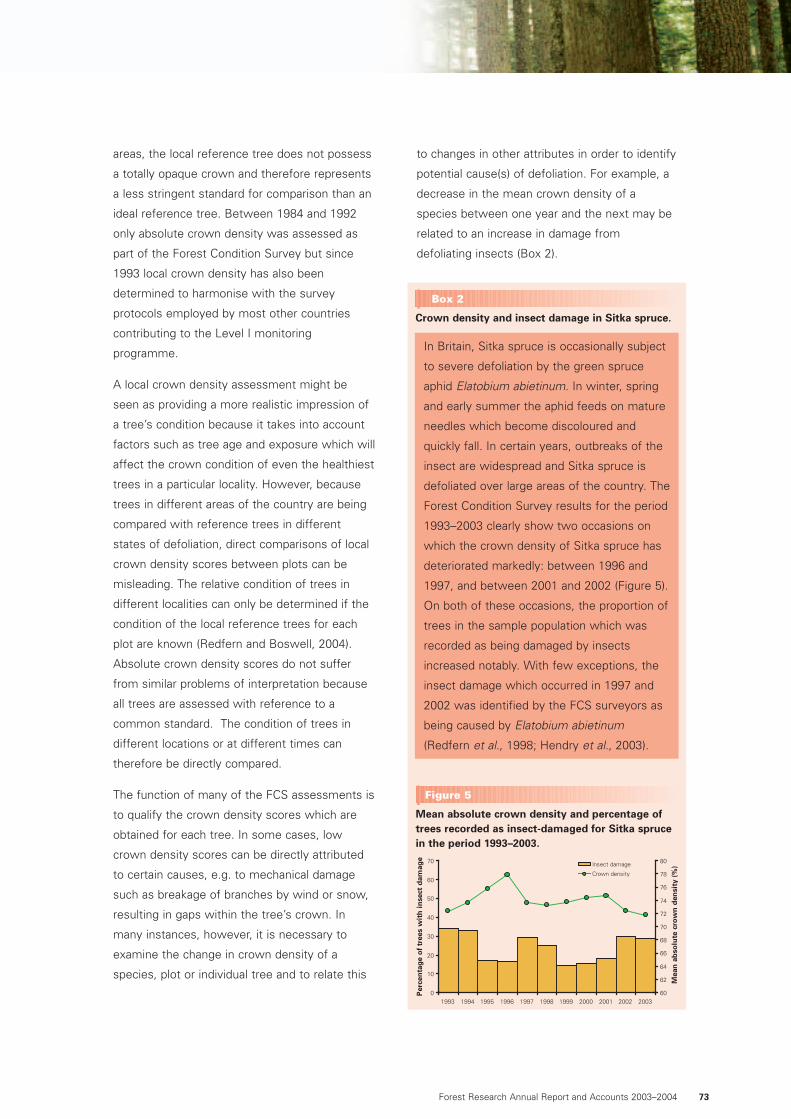
Crown density and insect damage in Sitka spruce.
Box 2
In Britain, Sitka spruce is occasionally subject
to severe defoliation by the green spruce
aphid Elatobium abietinum. In winter, spring
and early summer the aphid feeds on mature
needles which become discoloured and
quickly fall. In certain years, outbreaks of the
insect are widespread and Sitka spruce is
defoliated over large areas of the country. The
Forest Condition Survey results for the period
1993–2003 clearly show two occasions on
which the crown density of Sitka spruce has
deteriorated markedly: between 1996 and
1997, and between 2001 and 2002 (Figure 5).
On both of these occasions, the proportion of
trees in the sample population which was
recorded as being damaged by insects
increased notably. With few exceptions, the
insect damage which occurred in 1997 and
2002 was identified by the FCS surveyors as
being caused by Elatobium abietinum
(Redfern et al., 1998; Hendry et al., 2003).
0
10
20
30
40
50
60
70
1993 1994 1995 1996 1997 1998 1999 2000 2001 2002 2003
Per
cen
tag
e o
f tr
ees
wit
h i
nse
ct d
amag
e
60
62
64
66
68
70
72
74
76
78
80
Mea
n a
bso
lute
cro
wn
den
sity
(%
)Insect damage
Crown density
Mean absolute crown density and percentage oftrees recorded as insect-damaged for Sitka sprucein the period 1993–2003.
Figure 5
The connectivity surveyThe assessments which are made during forest
condition monitoring exercises are subject to
human error. Appropriate checking of the quality
of survey assessments is therefore essential if
recorded differences in crown density and other
variables are to be ascribed to differences in the
condition of the assessed trees rather than
differences in the accuracy and consistency of
the assessments themselves.
The importance of quality assurance was
recognised at the inception of the FCS (Binns et
al., 1985) and the first check or ‘connectivity’
survey to determine the nature and extent of
any assessor bias was implemented in 1985
(Binns et al., 1986). Considerable differences
were initially detected between the scores
which different surveyors allocated to the same
trees and improvements in both survey
procedures and surveyor training were instigated
to address this problem (Innes, 1993). Greater
accuracy was also introduced into the
connectivity survey by comparing the surveyors’
results with those of a single experienced
assessor rather than relying upon the inter-
comparison of scores obtained by the surveyors
themselves (Innes and Boswell, 1987).
Since 1995, the FCS connectivity survey has
involved the re-assessment of between a quarter
and a third of all survey plots by a single
experienced assessor (the standard observer).
Individual plots are assessed simultaneously but
independently by both the standard observer and
the surveyor being tested, thus ensuring that the
appearance of the trees and the conditions under
which they are viewed are the same for both
assessors. Differences in the scores obtained by
the standard observer and the surveyor therefore
reflect differences only in their respective
assessments of the condition of the trees.
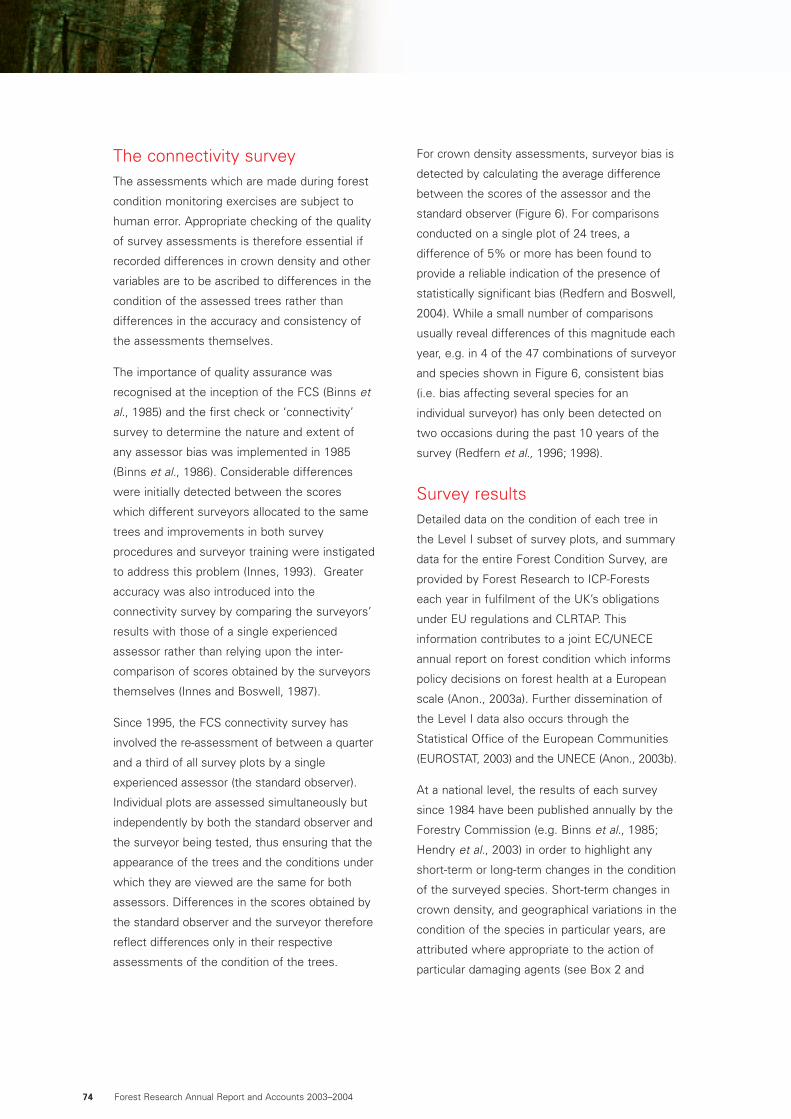
For crown density assessments, surveyor bias is
detected by calculating the average difference
between the scores of the assessor and the
standard observer (Figure 6). For comparisons
conducted on a single plot of 24 trees, a
difference of 5% or more has been found to
provide a reliable indication of the presence of
statistically significant bias (Redfern and Boswell,
2004). While a small number of comparisons
usually reveal differences of this magnitude each
year, e.g. in 4 of the 47 combinations of surveyor
and species shown in Figure 6, consistent bias
(i.e. bias affecting several species for an
individual surveyor) has only been detected on
two occasions during the past 10 years of the
survey (Redfern et al., 1996; 1998).
Survey resultsDetailed data on the condition of each tree in
the Level I subset of survey plots, and summary
data for the entire Forest Condition Survey, are
provided by Forest Research to ICP-Forests
each year in fulfilment of the UK’s obligations
under EU regulations and CLRTAP. This
information contributes to a joint EC/UNECE
annual report on forest condition which informs
policy decisions on forest health at a European
scale (Anon., 2003a). Further dissemination of
the Level I data also occurs through the
Statistical Office of the European Communities
(EUROSTAT, 2003) and the UNECE (Anon., 2003b).
At a national level, the results of each survey
since 1984 have been published annually by the
Forestry Commission (e.g. Binns et al., 1985;
Hendry et al., 2003) in order to highlight any
short-term or long-term changes in the condition
of the surveyed species. Short-term changes in
crown density, and geographical variations in the
condition of the species in particular years, are
attributed where appropriate to the action of
particular damaging agents (see Box 2 and
Forest Research Annual Report and Accounts 2003–200474
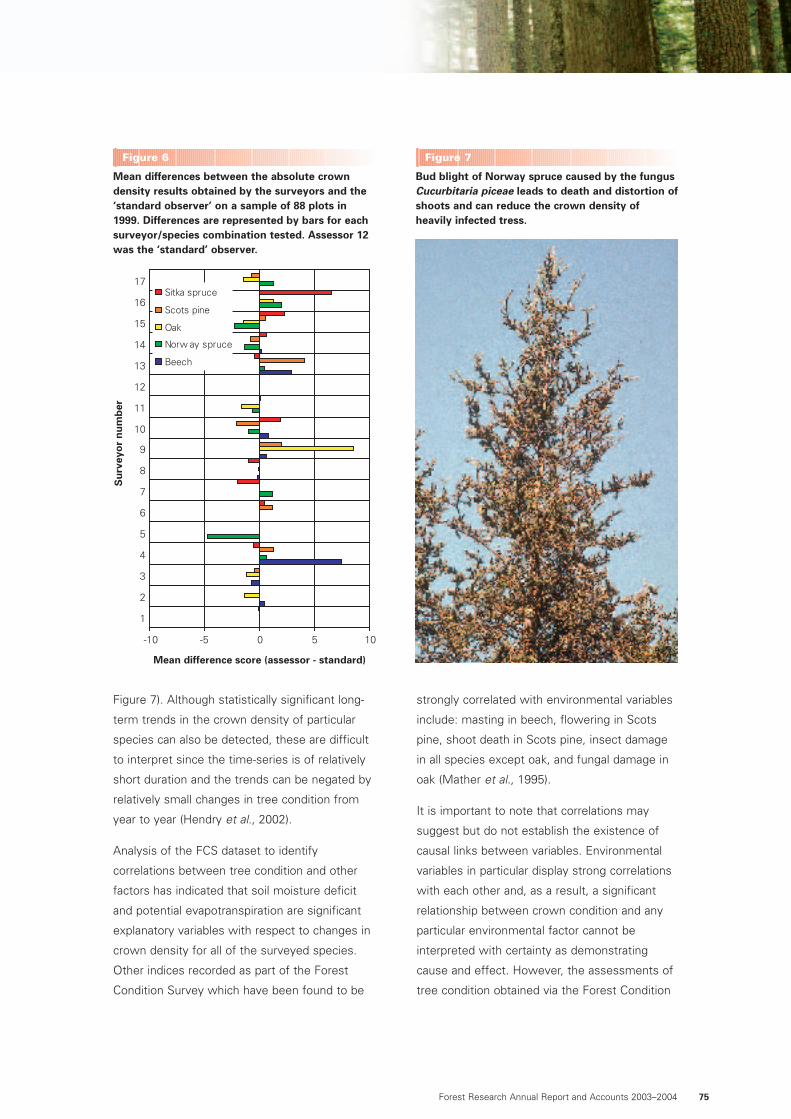
Figure 7). Although statistically significant long-
term trends in the crown density of particular
species can also be detected, these are difficult
to interpret since the time-series is of relatively
short duration and the trends can be negated by
relatively small changes in tree condition from
year to year (Hendry et al., 2002).
Analysis of the FCS dataset to identify
correlations between tree condition and other
factors has indicated that soil moisture deficit
and potential evapotranspiration are significant
explanatory variables with respect to changes in
crown density for all of the surveyed species.
Other indices recorded as part of the Forest
Condition Survey which have been found to be
strongly correlated with environmental variables
include: masting in beech, flowering in Scots
pine, shoot death in Scots pine, insect damage
in all species except oak, and fungal damage in
oak (Mather et al., 1995).
It is important to note that correlations may
suggest but do not establish the existence of
causal links between variables. Environmental
variables in particular display strong correlations
with each other and, as a result, a significant
relationship between crown condition and any
particular environmental factor cannot be
interpreted with certainty as demonstrating
cause and effect. However, the assessments of
tree condition obtained via the Forest Condition
Forest Research Annual Report and Accounts 2003–2004 75
-10 -5 0 5 10
Sitka spruce
Scots pine
Oak
Norw ay spruce
Beech
Su
rvey
or
nu
mb
er
Mean difference score (assessor - standard)
1
2
3
4
5
6
7
8
9
10
11
12
13
14
15
16
17
Mean differences between the absolute crowndensity results obtained by the surveyors and the‘standard observer’ on a sample of 88 plots in1999. Differences are represented by bars for eachsurveyor/species combination tested. Assessor 12was the ‘standard’ observer.
Figure 6
Bud blight of Norway spruce caused by the fungusCucurbitaria piceae leads to death and distortion ofshoots and can reduce the crown density ofheavily infected tress.
Figure 7
Survey can provide compelling evidence that
certain factors are not responsible for changes in
tree condition and can indicate those variables
which may be influencing long-term trends in
forest health and which therefore require further
study. In order to establish cause–effect
relationships in such cases, a different and more
intensive approach to forest monitoring is
required. Such an approach is adopted in the EU
Level II programme established in 1994 (EC
Regulation 1091/94), which consists of a
restricted network of plots across Europe,
including 20 in Great Britain, at which detailed
tree condition and environmental monitoring is
conducted (Durrant, 2000). Thus, a
complementary system of extensive monitoring
via the Forest Condition Survey/Level I network
and intensive monitoring via the Level II network
ensures that changes in the condition of British
forests are both detected and investigated at
appropriate scales
ConclusionsThe Forest Condition Survey, including its Level I
component, provides a national overview of
forest health in Great Britain. Focussing on a key
selection of forest tree species over a wide
geographical range, the survey continues to
gather a unique time series of forest health data.
This information not only fulfils the UK’s
international obligations to provide data on forest
condition and indicators of sustainable forestry
(Anon., 2001) but also supports national forestry
policy, the UK Forestry Standard (Anon., 2004)
and the UK Woodland Assurance Scheme
(Anon., 2000). Whilst originally established to
address the potential effects of air pollution on
forests, the Forest Condition Survey remains
responsive to changing requirements for data on
tree health.
ReferencesAnon. (1998). Manual on methods and criteria
for harmonized sampling, assessment,
monitoring and analysis of the effects of air
pollution on forests, 4th edn. UNECE/EC,
Hamburg and Brussels.
Anon. (2000). Certification Standard for the UK
Woodland Assurance Scheme. UKWAS Steering
Group. Forestry Commission, Edinburgh.
Anon. (2001). UK indicators of sustainable
forestry. Forestry Commission/Northern Ireland
Forest Service. Forestry Commission,
Edinburgh.
Anon. (2003a). The condition of forests in
Europe - 2003 executive report. UNECE/EC,
Geneva and Brussels.
Anon. (2003b). State of Europe’s forests 2003.
MCPFE/UNECE. Ministerial Conference on the
Protection of Forests in Europe. Liaison Office,
Vienna.
Anon. (2004). The UK Forestry Standard - the
government’s approach to sustainable forestry.
Forestry Commission, Edinburgh.
Binns, W.O., Redfern, D.B., Rennolls, K. and
Betts, A.J.A. (1985). Forest health and air
pollution 1984 survey. Forestry Commission
Research and Development Paper 142. Forestry
Commission, Edinburgh.
Binns, W.O., Redfern, D.B., Boswell, R. and
Betts, A.J.A. (1986). Forest health and air
pollution 1985 survey. Forestry Commission
Research and Development Paper 147. Forestry
Commission, Edinburgh.
Durrant, D. (2000). Environmental monitoring in
British forests. Forestry Commission Information
Note 37. Forestry Commission, Edinburgh.
Durrant, D. and Boswell, R. (2002). Comparison
of crown density assessments on trees within
the stand and on ride edges within the forest.
Forest Ecology and Management 157, 1–6.
Forest Research Annual Report and Accounts 2003–200476
Forest Research Annual Report and Accounts 2003–2004 77
EUROSTAT (2003). Forestry statistics - data
1990-2002. Publication no. KS-59-04-306-EN-N.
Office for Official Publications of the European
Communities, Luxembourg.
Hendry, S.J., Boswell, R.C. and Proudfoot, J.C.
(2002). Forest condition 2001. Forestry
Commission Information Note 46. Forestry
Commission, Edinburgh.
Hendry, S.J., Boswell, R.C. and Proudfoot, J.C.
(2003). Forest condition 2002. Forestry
Commission Information Note 51. Forestry
Commission, Edinburgh.
Innes, J.L. (1990). Assessment of tree condition.
Forestry Commission Field Book 12. HMSO,
London.
Innes, J.L. (1993). Forest health: its assessment
and status. CAB International, Wallingford.
Innes, J.L. and Boswell, R.C. (1987). Forest
health surveys 1987. Part 1: Results. Forestry
Commission Bulletin 74. HMSO, London.
Innes, J.L. and Boswell, R.C. (1989). Monitoring
of forest condition in the United Kingdom.
Forestry Commission Bulletin 88. HMSO,
London.
Lorenz, M., Mues, V., Becher, G., Müller-
Edzards, C., Luyssaert, S., Raitio, H. Fürst, A.
and Langouche, D. (2003). Forest condition in
Europe - results of the 2002 large-scale survey.
UNECE/EC, Geneva and Brussels.
Mather, R., Freer-Smith, P. and Savill, P. (1995).
Analysis of the changes in forest condition in
Britain: 1989 to 1992. Forestry Commission
Bulletin 116. HMSO, London.
Moffat, A. and Durrant, D. (1998). European
programme for the intensive monitoring of
forest ecosystems - the Level II network. In:
Forest Research Annual Report and Accounts
1997–1998. The Stationery Office, Edinburgh.
Redfern, D.B. and Boswell, R.C. (2004).
Assessment of crown condition in forest trees:
comparison of methods, sources of variation and
observer bias. Forest Ecology and Management
188, 149–160.
Redfern, D., Boswell, R. and Proudfoot, J.
(1996). Forest condition 1995. Forestry
Commission Research Information Note 282.
Forestry Commission, Edinburgh.
Redfern, D.B., Boswell, R.C. and Proudfoot, J.C.
(1998). Forest condition 1997. Forestry
Commission Information Note 4. Forestry
Commission, Edinburgh.
Regulation EEC No. 3528/86 (1986). Council
Regulation (EEC) No. 3528/86 of 17 November
1986 on the protection of the Community’s
forests against atmospheric pollution. Official
Journal L 326, 21/11/1986, 2–4.
Regulation EEC No. 1696/87 (1987).
Commission Regulation (EEC) No. 1696/87 of 10
June 1987 laying down certain detailed rules for
the implementation of Council Regulation (EEC)
No. 3528/86 on the protection of the
Community’s forests against atmospheric
pollution (inventories, network, reports). Official
Journal L 161, 22/06/1987, 1–22.
Regulation EEC No. 1091/94 (1994). Council
Regulation (EEC) No. 1091/94 of 29 April 1994
laying down certain detailed rules for the
implementation of Council Regulation (EEC) No.
3528/86 on the protection of the Community’s
forests against atmospheric pollution. Official
Journal L 125, 18/05/1994,1–44.
Skalski, J.R. (1990). A design for long-term
status and trends monitoring. Journal of
Environmental Management 30, 139–144.
Wachter, A. (1978). Deutschprachige Literatur
zum Weißtannensterben (1930-1978). Zeitschrift
für Pflanzenpathologie und Pflanzenschutz 85,
361–381.