Monitoring of Algal Growth Using their Intrinsic … of Algal Growth Using their Intrinsic...
5
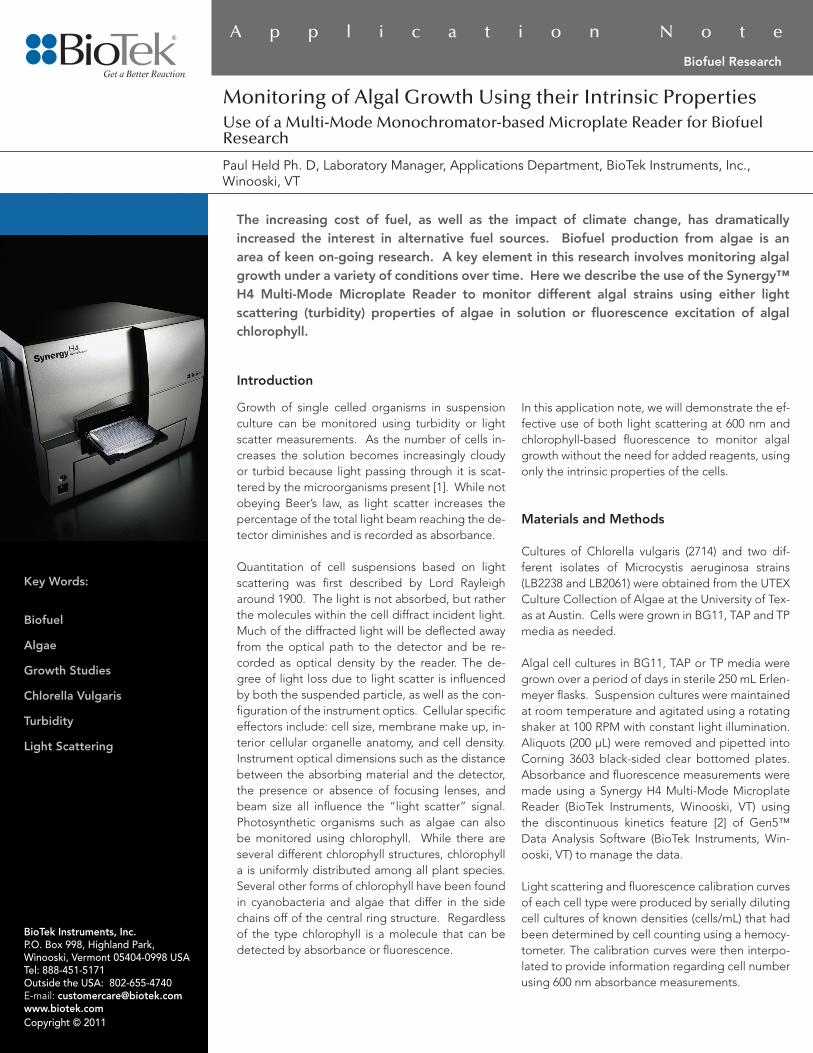
Monitoring of Algal Growth Using their Intrinsic Properties Use of a Multi-Mode Monochromator-based Microplate Reader for Biofuel Research A p p l i c a t i o n N o t e The increasing cost of fuel, as well as the impact of climate change, has dramatically increased the interest in alternative fuel sources. Biofuel production from algae is an area of keen on-going research. A key element in this research involves monitoring algal growth under a variety of conditions over time. Here we describe the use of the Synergy™ H4 Multi-Mode Microplate Reader to monitor different algal strains using either light scattering (turbidity) properties of algae in solution or fluorescence excitation of algal chlorophyll. Biofuel Research Introduction Growth of single celled organisms in suspension culture can be monitored using turbidity or light scatter measurements. As the number of cells in- creases the solution becomes increasingly cloudy or turbid because light passing through it is scat- tered by the microorganisms present [1]. While not obeying Beer’s law, as light scatter increases the percentage of the total light beam reaching the de- tector diminishes and is recorded as absorbance. Quantitation of cell suspensions based on light scattering was first described by Lord Rayleigh around 1900. The light is not absorbed, but rather the molecules within the cell diffract incident light. Much of the diffracted light will be deflected away from the optical path to the detector and be re- corded as optical density by the reader. The de- gree of light loss due to light scatter is influenced by both the suspended particle, as well as the con- figuration of the instrument optics. Cellular specific effectors include: cell size, membrane make up, in- terior cellular organelle anatomy, and cell density. Instrument optical dimensions such as the distance between the absorbing material and the detector, the presence or absence of focusing lenses, and beam size all influence the “light scatter” signal. Photosynthetic organisms such as algae can also be monitored using chlorophyll. While there are several different chlorophyll structures, chlorophyll a is uniformly distributed among all plant species. Several other forms of chlorophyll have been found in cyanobacteria and algae that differ in the side chains off of the central ring structure. Regardless of the type chlorophyll is a molecule that can be detected by absorbance or fluorescence. In this application note, we will demonstrate the ef- fective use of both light scattering at 600 nm and chlorophyll-based fluorescence to monitor algal growth without the need for added reagents, using only the intrinsic properties of the cells. Materials and Methods Cultures of Chlorella vulgaris (2714) and two dif- ferent isolates of Microcystis aeruginosa strains (LB2238 and LB2061) were obtained from the UTEX Culture Collection of Algae at the University of Tex- as at Austin. Cells were grown in BG11, TAP and TP media as needed. Algal cell cultures in BG11, TAP or TP media were grown over a period of days in sterile 250 mL Erlen- meyer flasks. Suspension cultures were maintained at room temperature and agitated using a rotating shaker at 100 RPM with constant light illumination. Aliquots (200 µL) were removed and pipetted into Corning 3603 black-sided clear bottomed plates. Absorbance and fluorescence measurements were made using a Synergy H4 Multi-Mode Microplate Reader (BioTek Instruments, Winooski, VT) using the discontinuous kinetics feature [2] of Gen5™ Data Analysis Software (BioTek Instruments, Win- ooski, VT) to manage the data. Light scattering and fluorescence calibration curves of each cell type were produced by serially diluting cell cultures of known densities (cells/mL) that had been determined by cell counting using a hemocy- tometer. The calibration curves were then interpo- lated to provide information regarding cell number using 600 nm absorbance measurements. BioTek Instruments, Inc. P.O. Box 998, Highland Park, Winooski, Vermont 05404-0998 USA Tel: 888-451-5171 Outside the USA: 802-655-4740 E-mail: [email protected] www.biotek.com Copyright © 2011 Paul Held Ph. D, Laboratory Manager, Applications Department, BioTek Instruments, Inc., Winooski, VT Key Words: Biofuel Algae Growth Studies Chlorella Vulgaris Turbidity Light Scattering
Transcript of Monitoring of Algal Growth Using their Intrinsic … of Algal Growth Using their Intrinsic...
Monitoring of Algal Growth Using their Intrinsic Properties Use of a Multi-Mode Monochromator-based Microplate Reader for Biofuel Research
A p p l i c a t i o n N o t e
The increasing cost of fuel, as well as the impact of climate change, has dramatically increased the interest in alternative fuel sources. Biofuel production from algae is an area of keen on-going research. A key element in this research involves monitoring algal growth under a variety of conditions over time. Here we describe the use of the Synergy™ H4 Multi-Mode Microplate Reader to monitor different algal strains using either light scattering (turbidity) properties of algae in solution or fluorescence excitation of algal chlorophyll.
Biofuel Research
Introduction
Growth of single celled organisms in suspension culture can be monitored using turbidity or light scatter measurements. As the number of cells in-creases the solution becomes increasingly cloudy or turbid because light passing through it is scat-tered by the microorganisms present [1]. While not obeying Beer’s law, as light scatter increases the percentage of the total light beam reaching the de-tector diminishes and is recorded as absorbance.
Quantitation of cell suspensions based on light scattering was first described by Lord Rayleigh around 1900. The light is not absorbed, but rather the molecules within the cell diffract incident light. Much of the diffracted light will be deflected away from the optical path to the detector and be re-corded as optical density by the reader. The de-gree of light loss due to light scatter is influenced by both the suspended particle, as well as the con-figuration of the instrument optics. Cellular specific effectors include: cell size, membrane make up, in-terior cellular organelle anatomy, and cell density. Instrument optical dimensions such as the distance between the absorbing material and the detector, the presence or absence of focusing lenses, and beam size all influence the “light scatter” signal. Photosynthetic organisms such as algae can also be monitored using chlorophyll. While there are several different chlorophyll structures, chlorophyll a is uniformly distributed among all plant species. Several other forms of chlorophyll have been found in cyanobacteria and algae that differ in the side chains off of the central ring structure. Regardless of the type chlorophyll is a molecule that can be detected by absorbance or fluorescence.
In this application note, we will demonstrate the ef-fective use of both light scattering at 600 nm and chlorophyll-based fluorescence to monitor algal growth without the need for added reagents, using only the intrinsic properties of the cells.
Materials and Methods
Cultures of Chlorella vulgaris (2714) and two dif-ferent isolates of Microcystis aeruginosa strains (LB2238 and LB2061) were obtained from the UTEX Culture Collection of Algae at the University of Tex-as at Austin. Cells were grown in BG11, TAP and TP media as needed.
Algal cell cultures in BG11, TAP or TP media were grown over a period of days in sterile 250 mL Erlen-meyer flasks. Suspension cultures were maintained at room temperature and agitated using a rotating shaker at 100 RPM with constant light illumination. Aliquots (200 µL) were removed and pipetted into Corning 3603 black-sided clear bottomed plates. Absorbance and fluorescence measurements were made using a Synergy H4 Multi-Mode Microplate Reader (BioTek Instruments, Winooski, VT) using the discontinuous kinetics feature [2] of Gen5™ Data Analysis Software (BioTek Instruments, Win-ooski, VT) to manage the data.
Light scattering and fluorescence calibration curves of each cell type were produced by serially diluting cell cultures of known densities (cells/mL) that had been determined by cell counting using a hemocy-tometer. The calibration curves were then interpo-lated to provide information regarding cell number using 600 nm absorbance measurements.
BioTek Instruments, Inc.P.O. Box 998, Highland Park, Winooski, Vermont 05404-0998 USATel: 888-451-5171 Outside the USA: 802-655-4740 E-mail: [email protected] www.biotek.comCopyright © 2011
Paul Held Ph. D, Laboratory Manager, Applications Department, BioTek Instruments, Inc., Winooski, VT
Key Words:
Biofuel
Algae
Growth Studies
Chlorella Vulgaris
Turbidity
Light Scattering
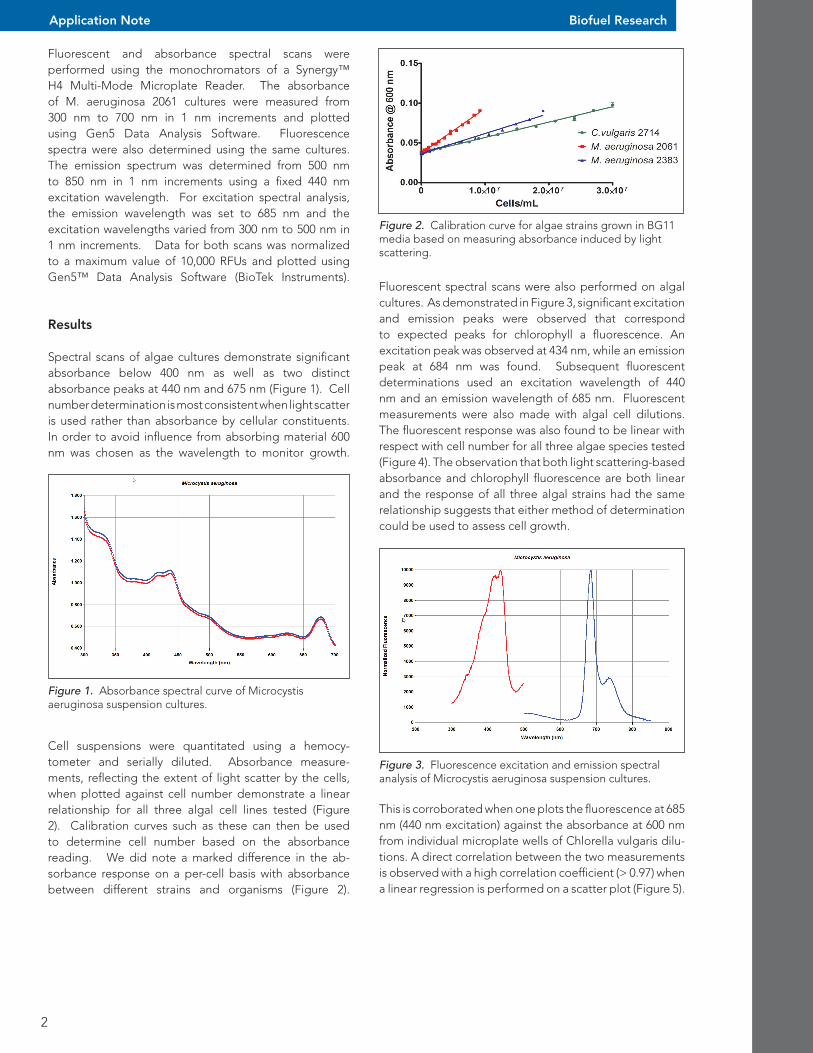
Fluorescent spectral scans were also performed on algal cultures. As demonstrated in Figure 3, significant excitation and emission peaks were observed that correspond to expected peaks for chlorophyll a fluorescence. An excitation peak was observed at 434 nm, while an emission peak at 684 nm was found. Subsequent fluorescent determinations used an excitation wavelength of 440 nm and an emission wavelength of 685 nm. Fluorescent measurements were also made with algal cell dilutions. The fluorescent response was also found to be linear with respect with cell number for all three algae species tested (Figure 4). The observation that both light scattering-based absorbance and chlorophyll fluorescence are both linear and the response of all three algal strains had the same relationship suggests that either method of determination could be used to assess cell growth.
2
Application Note
Fluorescent and absorbance spectral scans were performed using the monochromators of a Synergy™ H4 Multi-Mode Microplate Reader. The absorbance of M. aeruginosa 2061 cultures were measured from 300 nm to 700 nm in 1 nm increments and plotted using Gen5 Data Analysis Software. Fluorescence spectra were also determined using the same cultures. The emission spectrum was determined from 500 nm to 850 nm in 1 nm increments using a fixed 440 nm excitation wavelength. For excitation spectral analysis, the emission wavelength was set to 685 nm and the excitation wavelengths varied from 300 nm to 500 nm in 1 nm increments. Data for both scans was normalized to a maximum value of 10,000 RFUs and plotted using Gen5™ Data Analysis Software (BioTek Instruments).
Results
Spectral scans of algae cultures demonstrate significant absorbance below 400 nm as well as two distinct absorbance peaks at 440 nm and 675 nm (Figure 1). Cell number determination is most consistent when light scatter is used rather than absorbance by cellular constituents. In order to avoid influence from absorbing material 600 nm was chosen as the wavelength to monitor growth.
Biofuel Research
Figure 2. Calibration curve for algae strains grown in BG11 media based on measuring absorbance induced by light scattering.
Figure 1. Absorbance spectral curve of Microcystis aeruginosa suspension cultures.
Cell suspensions were quantitated using a hemocy-tometer and serially diluted. Absorbance measure-ments, reflecting the extent of light scatter by the cells, when plotted against cell number demonstrate a linear relationship for all three algal cell lines tested (Figure 2). Calibration curves such as these can then be used to determine cell number based on the absorbance reading. We did note a marked difference in the ab-sorbance response on a per-cell basis with absorbance between different strains and organisms (Figure 2).
Figure 3. Fluorescence excitation and emission spectral analysis of Microcystis aeruginosa suspension cultures.
This is corroborated when one plots the fluorescence at 685 nm (440 nm excitation) against the absorbance at 600 nm from individual microplate wells of Chlorella vulgaris dilu-tions. A direct correlation between the two measurements is observed with a high correlation coefficient (> 0.97) when a linear regression is performed on a scatter plot (Figure 5).
3
Application Note Biofuel Research
Figure 4. Calibration curves for algal strains grown in BG11 media based on fluorescence excitation of chlorophyll.
These data suggest that under the constant light illu-mination growth conditions used for these experiments either 600 nm absorbance based light scatter or fluores-cence based chlorophyll determinations can potentially be used to monitor algal culture growth in suspension.
Figure 5. Correlation between absorbance and fluorescence measurements of Chlorella vulgaris dilutions.
When the growth of different algal strains in BG11 media is compared using absorbance at 600 nm in conjunction with the cell calibration curve strain to strain differences are observed (Figure 6). All three strains exhibit clas-sical sigmoidal shaped growth patterns. An initial lag phase after inoculation where cells are adapting to the new environment and growing slowly, which is followed by a log-phase were cells are rapidly growing and di-viding and as nutrients become scarce and metabolic by-products increase the cells enter a stationary phase.
As demonstrated in Figure 6 aliquots of all three strains increased in 600 nm absorbance until reaching stationary or plateau phase at approximately 10 days. C. vulgaris and M. aeruginosa 2383 resulted in very similar absorbance values, while M. aeruginosa 2061 plateaus at cell densities about one third of the other two strains of algae (Figure 6).
When fluorescence is measured in the same cultures a dif-ferent pattern of cell growth than what was seen with ab-sorbance is observed. As shown in Figure 7 cell density of the green algae C. vulgaris appeared to increase rapidly with little evidence of a lag phase. M. aeruginosa 2383 re-quired a significantly longer period of time to reach maxi-mal levels, while M. aeruginosa 2061 lagged behind even after 15 days. Despite the patterns being significantly dif-ferent the basic relationship between the three strains was similar. M. aeruginosa 2061 signal for both absorbance and fluorescence was significantly less than the other two strains at the end of 15 days, while the maximal levels of M. aeruginosa 2383 and C. vulgaris were similar (Figure 7).
Figure 6. Comparison of cell number from different algal strains grown in BG11 media.
Figure 7. Comparison of fluorescence of Algal strains grown in BG11 media.
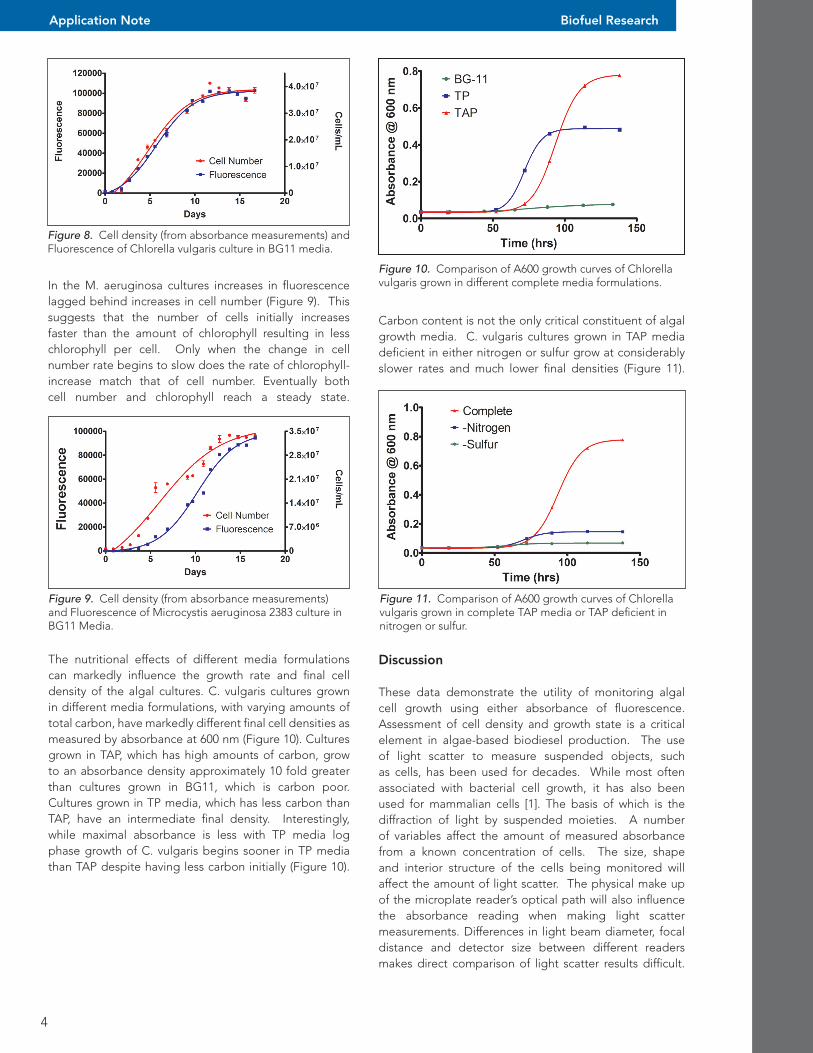
When cell number and fluorescence from the same cultures are plotted together and compared differ-ences between the strains become apparent. With C. vulgaris cultures increases in chlorophyll as measured by fluorescence closely parallel increases in cell num-ber as interpolated from 600 nm absorbance (Figure 8). This suggests that the amount of chlorophyll per cell remains relatively constant through the growth cycle.
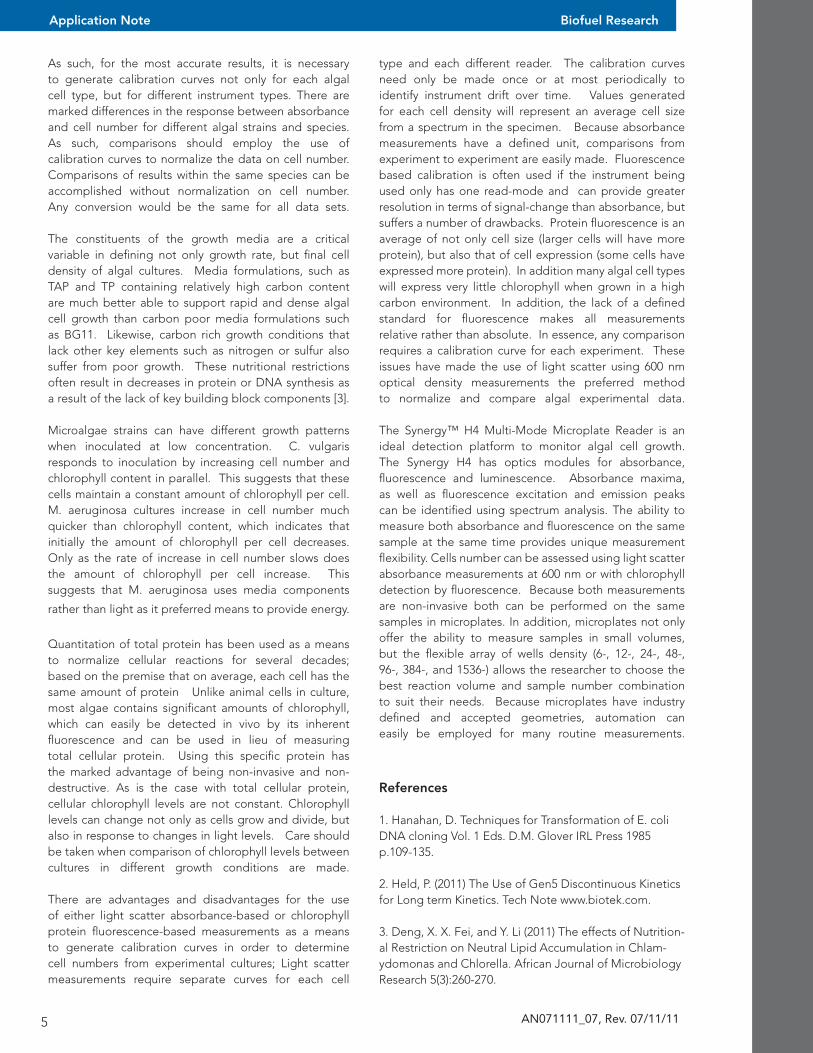
The nutritional effects of different media formulations can markedly influence the growth rate and final cell density of the algal cultures. C. vulgaris cultures grown in different media formulations, with varying amounts of total carbon, have markedly different final cell densities as measured by absorbance at 600 nm (Figure 10). Cultures grown in TAP, which has high amounts of carbon, grow to an absorbance density approximately 10 fold greater than cultures grown in BG11, which is carbon poor. Cultures grown in TP media, which has less carbon than TAP, have an intermediate final density. Interestingly, while maximal absorbance is less with TP media log phase growth of C. vulgaris begins sooner in TP media than TAP despite having less carbon initially (Figure 10).
4
Application Note Biofuel Research
Figure 8. Cell density (from absorbance measurements) and Fluorescence of Chlorella vulgaris culture in BG11 media.
In the M. aeruginosa cultures increases in fluorescence lagged behind increases in cell number (Figure 9). This suggests that the number of cells initially increases faster than the amount of chlorophyll resulting in less chlorophyll per cell. Only when the change in cell number rate begins to slow does the rate of chlorophyll-increase match that of cell number. Eventually both cell number and chlorophyll reach a steady state.
Figure 9. Cell density (from absorbance measurements) and Fluorescence of Microcystis aeruginosa 2383 culture in BG11 Media.
Figure 10. Comparison of A600 growth curves of Chlorella vulgaris grown in different complete media formulations.
Carbon content is not the only critical constituent of algal growth media. C. vulgaris cultures grown in TAP media deficient in either nitrogen or sulfur grow at considerably slower rates and much lower final densities (Figure 11).
Figure 11. Comparison of A600 growth curves of Chlorella vulgaris grown in complete TAP media or TAP deficient in nitrogen or sulfur.
Discussion
These data demonstrate the utility of monitoring algal cell growth using either absorbance of fluorescence. Assessment of cell density and growth state is a critical element in algae-based biodiesel production. The use of light scatter to measure suspended objects, such as cells, has been used for decades. While most often associated with bacterial cell growth, it has also been used for mammalian cells [1]. The basis of which is the diffraction of light by suspended moieties. A number of variables affect the amount of measured absorbance from a known concentration of cells. The size, shape and interior structure of the cells being monitored will affect the amount of light scatter. The physical make up of the microplate reader’s optical path will also influence the absorbance reading when making light scatter measurements. Differences in light beam diameter, focal distance and detector size between different readers makes direct comparison of light scatter results difficult.
type and each different reader. The calibration curves need only be made once or at most periodically to identify instrument drift over time. Values generated for each cell density will represent an average cell size from a spectrum in the specimen. Because absorbance measurements have a defined unit, comparisons from experiment to experiment are easily made. Fluorescence based calibration is often used if the instrument being used only has one read-mode and can provide greater resolution in terms of signal-change than absorbance, but suffers a number of drawbacks. Protein fluorescence is an average of not only cell size (larger cells will have more protein), but also that of cell expression (some cells have expressed more protein). In addition many algal cell types will express very little chlorophyll when grown in a high carbon environment. In addition, the lack of a defined standard for fluorescence makes all measurements relative rather than absolute. In essence, any comparison requires a calibration curve for each experiment. These issues have made the use of light scatter using 600 nm optical density measurements the preferred method to normalize and compare algal experimental data.
The Synergy™ H4 Multi-Mode Microplate Reader is an ideal detection platform to monitor algal cell growth. The Synergy H4 has optics modules for absorbance, fluorescence and luminescence. Absorbance maxima, as well as fluorescence excitation and emission peaks can be identified using spectrum analysis. The ability to measure both absorbance and fluorescence on the same sample at the same time provides unique measurement flexibility. Cells number can be assessed using light scatter absorbance measurements at 600 nm or with chlorophyll detection by fluorescence. Because both measurements are non-invasive both can be performed on the same samples in microplates. In addition, microplates not only offer the ability to measure samples in small volumes, but the flexible array of wells density (6-, 12-, 24-, 48-, 96-, 384-, and 1536-) allows the researcher to choose the best reaction volume and sample number combination to suit their needs. Because microplates have industry defined and accepted geometries, automation can easily be employed for many routine measurements.
References
1. Hanahan, D. Techniques for Transformation of E. coli DNA cloning Vol. 1 Eds. D.M. Glover IRL Press 1985 p.109-135.
2. Held, P. (2011) The Use of Gen5 Discontinuous Kinetics for Long term Kinetics. Tech Note www.biotek.com.
3. Deng, X. X. Fei, and Y. Li (2011) The effects of Nutrition-al Restriction on Neutral Lipid Accumulation in Chlam-ydomonas and Chlorella. African Journal of Microbiology Research 5(3):260-270.
5
Application Note
As such, for the most accurate results, it is necessary to generate calibration curves not only for each algal cell type, but for different instrument types. There are marked differences in the response between absorbance and cell number for different algal strains and species. As such, comparisons should employ the use of calibration curves to normalize the data on cell number. Comparisons of results within the same species can be accomplished without normalization on cell number. Any conversion would be the same for all data sets.
The constituents of the growth media are a critical variable in defining not only growth rate, but final cell density of algal cultures. Media formulations, such as TAP and TP containing relatively high carbon content are much better able to support rapid and dense algal cell growth than carbon poor media formulations such as BG11. Likewise, carbon rich growth conditions that lack other key elements such as nitrogen or sulfur also suffer from poor growth. These nutritional restrictions often result in decreases in protein or DNA synthesis as a result of the lack of key building block components [3].
Microalgae strains can have different growth patterns when inoculated at low concentration. C. vulgaris responds to inoculation by increasing cell number and chlorophyll content in parallel. This suggests that these cells maintain a constant amount of chlorophyll per cell. M. aeruginosa cultures increase in cell number much quicker than chlorophyll content, which indicates that initially the amount of chlorophyll per cell decreases. Only as the rate of increase in cell number slows does the amount of chlorophyll per cell increase. This suggests that M. aeruginosa uses media components
rather than light as it preferred means to provide energy.
Quantitation of total protein has been used as a means to normalize cellular reactions for several decades; based on the premise that on average, each cell has the same amount of protein Unlike animal cells in culture, most algae contains significant amounts of chlorophyll, which can easily be detected in vivo by its inherent fluorescence and can be used in lieu of measuring total cellular protein. Using this specific protein has the marked advantage of being non-invasive and non-destructive. As is the case with total cellular protein, cellular chlorophyll levels are not constant. Chlorophyll levels can change not only as cells grow and divide, but also in response to changes in light levels. Care should be taken when comparison of chlorophyll levels between cultures in different growth conditions are made.
There are advantages and disadvantages for the use of either light scatter absorbance-based or chlorophyll protein fluorescence-based measurements as a means to generate calibration curves in order to determine cell numbers from experimental cultures; Light scatter measurements require separate curves for each cell
Biofuel Research
AN071111_07, Rev. 07/11/11


![Difração de Raios-X [7]€¦ · 11> Diffractometer Bragg-Brentano geometry (Primary monochromator) (Secondary monochromator) Bragg’s Law 12> • For parallel planes of atoms,](https://static.fdocuments.us/doc/165x107/5f1df254a656886cb012e66b/difrao-de-raios-x-7-11-diffractometer-bragg-brentano-geometry-primary.jpg)


