Monitoring and Evaluation Report - IFC
21
1 Project: Biodiversity and Cocoa farming: Ghana Case Biodiversity Rapid Assessment Methodologies Monitoring and Evaluation Report 3 rd September 2013 Written by Sandra Oliveira, Jessica Raneri and Stephan Weise
Transcript of Monitoring and Evaluation Report - IFC

1
Project: Biodiversity and Cocoa farming: Ghana Case
Biodiversity Rapid Assessment Methodologies
Monitoring and Evaluation Report
3rd September 2013
Written by Sandra Oliveira, Jessica Raneri and Stephan Weise

2
Contents
1. Monitoring and Evaluation Phase - Introduction .................................................................. 3
2. Analysis .................................................................................................................................. 4
A. Descriptive statistics of main parameters ......................................................................... 4
B. Analysis of differences (initial – audited) .......................................................................... 4
C. Significance of differences ................................................................................................ 4
D. Differences in Diameter at Breast Height (dbh) ............................................................... 4
E. Shade level ........................................................................................................................ 5
F. Land Use Type.................................................................................................................... 5
G. Farmers’ data .................................................................................................................... 5
H. Selection of Plots .............................................................................................................. 6
3. Results ................................................................................................................................... 6
A. Descriptive statistics of main parameters ......................................................................... 6
B. Analysis of differences ...................................................................................................... 7
C. Significance of the differences ........................................................................................ 10
D. Differences in dbh ........................................................................................................... 11
E. Shade level ...................................................................................................................... 12
F. Land Use Types ................................................................................................................ 14
G. Farmers’ data .................................................................................................................. 16
4. Monitoring and Evaluation of the Process .......................................................................... 18
A. Species identification monitoring ............................................................................... 18
B. RBA Training - protocol monitoring ............................................................................ 19
C. Surveyor feedback ....................................................................................................... 19
D. Summary ..................................................................................................................... 20
5. Main conclusions ................................................................................................................. 20

3
1. Monitoring and Evaluation Phase - Introduction The project “Biodiversity and Cocoa farming: Ghana Case” intends to develop a method for a rapid assessment of biodiversity in cocoa farms in Ghana. It is integrated in the framework of Armajaro’s Traceability and Mapping System (TMS), which currently collects information on production, farm practices and farmers’ socio-economic profiles.
After the selection of the most suitable Rapid Biodiversity Assessment (RBA) methodology during the Calibration and Testing Phases, the Monitoring and Evaluation phase intended to confirm the accuracy of the method selected and the quality of the data obtained. The selected method was applied initially to 4000 farms, spread over several regions and districts in Ghana; from these, a sample of ca. 10%, spread over 5 regions, was randomly selected for auditing, which consisted in applying the method a second time, with a different Surveyor repeating the same procedure. The data was subsequently recollected for each of the audit farms and included the Farmers (species) form, Biodiversity form and the Original TMS form.
This allowed for the assessment of: - if there were differences between the original and audited data - if these differences were statistically significant - if there were differences between regions - if there was data bias related to the Surveyor - if the method was replicable by a different Surveyor
It is important to note that, despite instructions to recollect data using the Original TMS form on audited farms, it appears that this data was not recollected, as it was never received by Bioversity International. In addition, waypoints taken when plots are set were not identified in the shapefiles as separate to the waypoints taken for mapping the farm during initial data collection; shapefiles were not received for audited data as this is part of the TMS form. These data limitations lead to restrictions in the assessment of if the method was replicable by a different Surveyor on the same farm (plot selection) and distribution of plots in relation to total farm area and size. After data screening, a total sample of 403 audited farms was obtained for biodiversity data, with the following representation by region: Ashanti – 133 farms; Brong Ahafo – 48 farms; Central – 14 farms; Eastern – 73 farms; Western – 135 farms. Due to the smaller sample size of Brong Ahafo and Central regions, these were joined together (n=62 farms), thus the comparison was done for 4 regions instead of 5. This report presents the comparison of the results between the initial and audited data for these farms, focusing on the differences and similarities of the data obtained from both samples, rather than the values of the parameters, a matter that will be covered in a different report.

4
2. Analysis The data obtained corresponds to a paired sample, i.e., since the same procedure was applied to the same farms, the initial and audited samples cannot be considered independent. Each of the 403 farms has two observations for each parameter, obtained at a different time using the same method. For this reason, the statistical method applied to compare the samples was the Wilcoxon test, a non-parametric alternative that assesses whether both sample mean ranks differ, and which does not require the data to be normally distributed. The sample size is the same throughout the farms, thus no transformation (per ha) is required for the comparison.
A. Descriptive statistics of main parameters First, descriptive statistics for both the initial and audited data collected using the Biodiversity form are presented, for each of the following parameters:
- number of trees - number of species - number of dead trees - number of palm trees - number of banana/plantain (represented as banana)
B. Analysis of differences (initial – audited) Afterwards, the difference between the initial and the audited data for each parameter is analyzed, by the mean, maximum and minimum difference obtained, assessing as well potential outliers (extreme values that deviate from the mean), which represent particular farms where the difference is higher than normal and may indicate specific issues related to the farm itself.
C. Significance of differences The Wilcoxon test was then applied to each parameter individually, comparing the initial and the audited data for all the farms. The results are then summarized in tables.
D. Differences in Diameter at Breast Height (dbh) The number of trees in each dbh range in the initial and audited data was compared by calculating the Wilcoxon test, for each dbh range individually, in order to verify if there were differences in the size of trees recorded between the 2 samples. These differences were also analyzed at farm level, to obtain the number of farms where differences between initial and audited data were found, for each dbh range.
5
E. Shade level The shade pattern was analyzed by the number of trees and palm trees. The comparison of the shade pattern between the initial and audited data was done by classifying the number of trees in 4 different levels and comparing both samples, with the Wilcoxon test and the proportion of each class. The shade levels obtained with the initial data were also analyzed in view of the shade pattern collected with the TMS form; the shade pattern is classified in 4 different levels and it is recorded based on the perception of the Surveyor, who estimates by observation the number of trees (per ha) in the farm. It was not possible to repeat this analysis with the audited data as shade pattern is collected with the TMS form, for which this data was not received.
F. Land Use Type Land use diversity, described as the number of land use types adjacent to the farm, was compared by calculating the Wilcoxon test between the number of land uses types recorded as present around the farm for the initial and the audited data. This parameter was assessed for 392 farms as 11 farms could not be matched between initial and audited data.
Afterwards, to assess the most common land use types found overall, the proportion of each land use type was calculated, by counting the number of times each land use type was recorded as present in the farms, divided by the total number of farms. These values were then compared for each sample and disaggregated by Region, which can provide indication on the environmental context of the farms.
G. Farmers’ data
The farmers’ data was first analyzed by comparing the number of species collected from the initial and the audited data, at the farm level, as well as the number of trees per species. The Wilcoxon test was applied to all the farms to assess if the differences were significant. This parameter was assessed for 399 farms as 4 farms could not be matched between initial and audited data. Plots of the proportion of trees by species uses and by native/exotic species were also produced, and the data disaggregated by region.
To assess the consistency of the farmers’ data in relation to the sampled data, the numbers of banana/plantain and oil palm trees were also compared, for each sample. The number of banana and palm were first calculated per ha, by dividing the number of banana and palm by the size of the plots (0.08 ha) and the farmers data by dividing the number of banana and palm by the farm area in ha.

6
H. Selection of Plots
This phase was designed to assess the reproducibility and reliability of the RBA method which includes the ability of the Surveyors to follow the protocol outlined, which would mean that the plots are set in the same, if not similar areas on the farm.
As described in the introduction, Surveyors were required to recollect data for the Biodiversity, Farmer and standard TMS form (which include mapping the farm and registering the waypoints for where the plots are set). Unfortunately, Bioversity did not receive the TMS data for the audited farms, which means that no analysis was possible regarding the reproducibility of the plots positions by different Surveyors on the same farms.
In addition, the shapefiles that were received for the initial data collected did not allow for differentiations between waypoints on the border of the farm, and which waypoints represent where the plots were taken despite training being given to Surveyors to rename the points on the Garmin.
3. Results
A. Descriptive statistics of main parameters
Table 1 – Main statistics from initial and audited data collected using the Biodiversity form, referring to all the farms (n=403)
Overall, the basic statistical indicators are similar between the initial and audited data. The audited data presents slightly lower values, more relevant for the mean of species and the maximum of dead trees. The maximum values for trees, palm and banana are rather high, indicating the potential existence of outliers, i.e., farms with a marked higher number for these parameters.
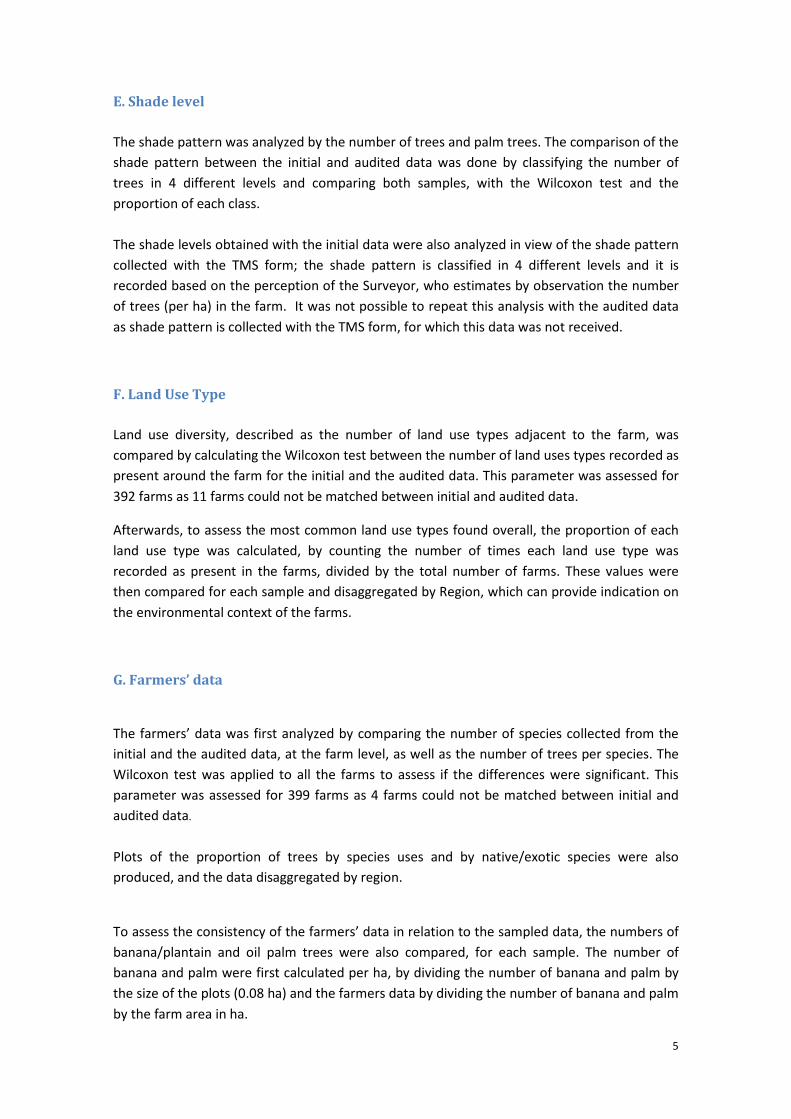
The figures below show the boxplot of the parameters for the initial data and the audited data; the box represents the distribution of the middle 50 percent of the data. The whiskers represent the minimum and maximum values of the observations, up to a maximum of 1.5 x the interquartile range and the individual dots represent the farms with values above this limit (potential outliers). For the initial data, species have the lowest number of farms with outliers. Banana and palm, on the other hand, have the highest number of farms above the 1.5
Stats trees species dead trees palm bananaMean 4.797 3.62 0.4839 1.551 3.097Min 0 0 0 0 0Max 25 14 14 24 41Median 4 3 0 0 0
Mean 4.516 2.868 0.3151 1.315 2.725Min 0 0 0 0 0Max 20 12 6 20 30Median 4 3 0 0 0
Initial data
Audited data
7
interquartile range limit, indicating that the distribution of palm trees and banana is highly variable among farms, since both parameters showed a median of 0 (at least half the farms have zero palm and banana). The same pattern is visible for the audited data, although the number of potential outliers is lower than for the initial data.
Fig. 1 - Box plot of the parameters from the Biodiversity form, for the initial data (left) and audited data (right).
The whiskers represent the minimum and maximum values of the observations, up to a maximum of 1.5 x the interquartile range and the individual dots represent the farms with values above this limit (potential outliers).
B. Analysis of differences
The difference in value between the initial and the audited data was calculated for each parameter individually, at a farm level. Positive values mean the initial value is higher than the audited value, whereas negative values mean that the audited value is higher than the initial value. The mean values of the differences between initial and audited data were:
Trees – 0.28; species - 0.75; dead trees – 0.17; banana – 0.37; palm -0.24
These results were then disaggregated by Region. Graphs of the mean and maximum differences (positive and negative) found for each parameter per Region are presented below.

8
Fig. 2 – Mean difference (top), maximum positive (bottom left) and maximum negative (bottom right) differences between initial and audited data, for number of trees, number of species and number of dead trees.
Regarding the mean difference between initial and audited data for all the farms, species is the parameter with the higher differences, while number of trees has the lowest. The maximum positive difference was found for number of trees in all the Regions, particularly for Western region (20 trees). For species and dead trees, Western is also the region with the highest difference.
During the analysis of the parameter ‘number of trees’, it was noted that a systematic error exists which requires that the parameter be revised. This error was not noted earlier due to the smaller sample size that was used while developing the Presentation and Analysis report.

9
Fig. 3 – Mean difference (top), maximum positive (bottom left) and maximum negative (bottom right) differences between initial and audited data, for oil palm trees and banana/plantain.
In relation to oil palm, the Western region shows the highest difference value, whereas for banana it’s the Eastern region. The maximum positive difference found was 38 for banana in Eastern region and 18 for palm in the Western region, whereas the maximum negative difference (audited data with higher values than initial data) was found for Ashanti region for both banana (-29) and palm (-19).

10
C. Significance of the differences The values obtained for the initial and audited data were then compared by means of the Wilcoxon test, to assess if the differences between the 2 samples are significant (Table 2).
Table 2 – Results of the Wilcoxon test for each parameter and all the farms (n=403)
Signif.* indicates if the value obtained is significant or not, measured by the p-value; if the p-value is below 0.05, the differences are significant.
Overall, the difference between number of trees, number of banana and number of palm are not significant. For number of species and dead trees, however, the difference between the initial and audited data are significant, indicating potential issues with the procedure. Between Regions, no significant differences were found (p-value >0.125 for all parameters). The analysis of the data showed the existence of farms whose values deviate from the mean of the dataset (outliers – cf. Fig. 1), for both the initial and the audited samples. These values may result from the particular characteristics of the farm itself, or may be due to errors of data capture and entry.
To verify if these extreme values affect the distribution of the data, these farms were removed from the data, for each parameter individually, and the Wilcoxon test applied again. The results show that removing the extreme values does not affect the results of the test, with species and dead trees showing again significant differences among both datasets (species: V= 27911, p-value <0.0001; dead trees: V= 930.5, p-value= 0.00266).
Considering these results, another attempt was done to understand the reason for these significant differences for species and dead trees; the farms that showed a higher difference between them were analyzed in view of the Surveyors’ distribution and the Region. For species, the farms with a difference of 4 species or more between the initial and the audited data were analyzed (n=36); these farms were surveyed by 15 different Surveyors for the initial data, 42% of these farms by the same Surveyor (code 20). The experience level of this Surveyor was not able to be validated in time for this report. The initial data shows higher values of species than the audited data, which may indicate an additional need for species identification training in relation to species identification by the Surveyors. Regarding the distribution by Regions, 37% of the differences in species between initial and audited data were found in the Western region followed by Brong Ahafo & Central regions (31%). The differences may also result from particular characteristics of the farms (size, location, etc.), and from errors in data entry from the automatic scanning procedure which uploads data from the forms directly into the TMS system, which could not be verified for this assessment.
Wilcoxon test V p-value Signif.*Trees 25085 0.8653 NoSpecies 30888 <0.0001 YesDead trees 1331.5 0.0015 YesBanana 5726 0.0989 NoPalm 3419 0.1963 No

11
In relation to dead trees, the farms with a difference of 3 dead trees or more between the initial and the audited data were analyzed (n=10); 50% of these farms were from the Western region and the distribution of the Surveyors is rather homogeneous (there is not a single Surveyor surveying many farms). These differences can also be related to data collection or data entry issues, since most of the values presented for the initial data are substantially higher than the average of the sample (e.g. 14, 10, 9 dead trees found within the 4 sample plots, against the average of 0.5 dead trees for the initial sample). If this is not the case, then these farms may have been facing diseases on their non-cocoa trees, or farmers were killing (debarking) them at a larger pace than usual, both issues are very important to follow-up.
The number of dead trees found in the sample plots was analyzed against the number of dead trees provided by the farmers, to assess if higher number of dead trees in the sample plots would correspond to higher numbers in the whole farm. The Pearson statistical test showed that, for the initial data, there is a correlation of 0.371 between the number of dead trees provided by the farmers and the ones found in the sample plots, while for the audited data the value is 0.385. There are also few cases where dead trees were recorded by the Surveyors during the sampling; however, the farmers indicated the absence of dead trees within the farm when collecting data with the Farmer’s form. This may indicate a discrepancy in the definition of a dead tree for farmers and Surveyors, which should be investigated further.
D. Differences in dbh The number of trees in each dbh range in the initial and audited data was compared by calculating the Wilcoxon test, per dbh range. The results show that there are significant differences between some of the dbh ranges, namely the 2 smallest ones and some of the highest ones. It is important to note that, since there are ties and many zeros in the data, the p-values of the Wilcoxon test for the range 90-100 cm should be interpreted with caution. Most of the trees recorded are concentrated in the lowest dbh ranges. The table below provides an overview of the results obtained for each dbh range.
It should be noted that the location of the sample plots will affect the results of dbh, which are analyzed without any transformation per ha, as solid assumptions cannot be made regarding extrapolation of dbh values for the whole farm. As previously mentioned, the location of the sample plots in the initial and audited data could not be verified as this data was not decipherable from the shapefiles that were received for the initial data and were not received at all for the audited data.

12
Table 3 – Results of the Wilcoxon test for each dbh range and all the farms (n=403)
Regarding the differences at farm level, the majority of farms were found to have no difference between the initial and audited data for all dbh ranges, at a higher level for the largest dbh classes (Table 4). In the lowest dbh range, 30% of the farms show higher number of trees for the initial sample, while for the following range there are 27% of farms where the audited sample showed higher number of trees in relation to the initial sample (negative difference).
Table 4 – Proportion of farms with negative differences (negative diff), positive differences (positive diff) and no difference (no diff) between initial and audited data, per dbh range
E. Shade level
The number of trees, including palm trees, is used as criterion to classify shade levels (Table 5). For both initial and audited data, shade classes were attributed based on the correspondent number of trees per ha in each farm, as per the table below. The Wilcoxon test was applied to test the differences in shade classification and they were found to be not significant at 95% level (V = 451.5, p-value = 0.068). This result is somewhat expected, since the number of trees – the basis to analyze shade level, was also found to be not significant between the initial and the audited samples.
Shade Level Number of trees Biodiv Number of trees TMS Heavier Shade ≥ 22 trees /ha ≥ 21 trees /ha Moderate Shade 14 -21 trees /ha 11 - 20 trees/ha Lighter Shade 1 -13 trees /ha 1-10 trees/ha No Shade 0 trees /ha 0 trees/ha
Table 5 – Classification of shade levels based on calculation (Biodiv) and observation (TMS) of number of trees
Wilcoxon test V p-value Signif.*dbh10_20cm 10843.5 <0.001 Yesdbh20_30cm 6514 0.029 Yesdbh30_40cm 9309.5 0.192 Nodbh40_50cm 3255.5 0.182 Nodbh50_60cm 2222.5 0.970 Nodbh60_70cm 1351 0.180 Nodbh70_80cm 1373 0.002 Yesdbh80_90cm 420 <0.001 Yesdbh90_100cm 196 0.164 Nodbh100cm_more 1339.5 <0.001 Yes
Initial - Audited dbh10_20 dbh20_30 dbh30_40 dbh40_50 dbh50_60 dbh60_70 dbh70_80 dbh80_90 dbh90_100 dbh100_mNeg diff 0.11 0.27 0.21 0.17 0.12 0.10 0.15 0.13 0.05 0.03No diff 0.59 0.56 0.55 0.70 0.77 0.80 0.77 0.83 0.92 0.86Pos diff 0.30 0.18 0.25 0.13 0.11 0.09 0.07 0.04 0.03 0.11

13
Regarding the correspondence between the biodiversity data and the TMS visual estimation of shade pattern, the number of trees per ha calculated from the initial data were weighted by farm area, since the estimation made by the Surveyors for TMS is done on a farm level and based on their visual perception of shade within the farm. Analysis was not possible for the audited data as shade pattern is collected on the TMS form which was not recollected as planned.
The Wilcoxon test revealed significant differences (V = 15, p-value < 0.001). Table 6 shows the proportion of shade levels estimated from TMS data in relation to the classes calculated from biodiversity data. The first column on the left and the first row below TMS classes title, show the proportion of each class for all farms for biodiversity data and TMS data, respectively. Each other cell represents the proportion of that TMS class that falls in each biodiversity class.
Overall, it is visible the difference in the proportion of heavier shade for biodiversity data (76%), whereas TMS estimated as heavy shade only 2.5% of the farms. In more detail, 91%of the farms classified by TMS as “Under light shade” correspond to the biodiversity class “No shade”; 80% of the “Under light shade” from TMS were classified as “Lighter shade” in biodiversity classes. The main difference relies on the proportion of heavier shade from the initial data, with 77% of these farms being classified as “Under light shade” by TMS. This result suggests either an underestimation of shade by TMS or an overestimation by the biodiversity data. This under/overestimation may be related to the fact that, in the number of trees collected for biodiversity, all fruit trees (like mangoes, citrus, among others) and palm trees are considered, while the visual estimation of shade pattern depends mainly on the experience of the Surveyor and relies on a subjective interpretation of the farm’s type and context.
Table 6 – Proportion of shade levels from TMS in relation to the classes from Biodiversity data.
In order to verify if the inclusion of the lowest dbh ranges in tree count had any effect on the results for shade levels, the number of trees per ha was re-calculated with only the trees recorded for dbh above 30 cm, and the shade classes were redistributed for the initial data. The Wilcoxon test revealed, again, significant differences between the classification of TMS and biodiversity shade levels. However, by excluding the trees of the lowest dbh ranges from the biodiversity data, the proportion of farms classified as “No shade” increased from 5.7% to 21.6%, while the farms classified as heavier shade decreased from 75.7% to 54.3%, changes that are directly related to the use of number of trees as a classifier of shade levels.
1.74 78.66 15.88 2.48% Biodiv classes Full sun plantation Under light shade Under moderate shade Under heavy shade
5.71 No shade 0.00 91.30 8.70 0.0011.17 Lighter shade 4.44 80.00 13.33 0.007.44 Moderate shade 3.33 83.33 10.00 0.0075.68 Heavier shade 1.31 77.05 17.38 3.28
TMS classes (%)

14
F. Land Use Types Diversity of land use types was found to be similar between the initial and the audited data (Wilcoxon test: V = 75.5, p-value = 0.69). The proportion of times the different land use types are found adjacent to the farms is also very similar between both samples, with “Cocoa field” being the most common land use type found adjacent to the cocoa farms, and “Forest” the least common (fig. 4 ). The maximum number of land user types found was 4 and the minimum was 1.
Fig. 4 – Proportion of land cover types in initial and audited data registered across all farms (n=392)
When disaggregating the data by Region (Table 7), it can be seen that the proportion of each land cover type is very similar between the initial and audited samples which could indicate that the diversity of the land use types is similar across the different Regions. It can also be seen that “Forest” and “Other land use” only occur in the Western region, and “Stream” shows higher values for this region than for the others.

15
Table 7 – Proportion of land cover types in initial and audited data, per Region
The assessment of land uses adjacent to cocoa farms is influenced by the distribution of land use types within the country or regions and by the location of the farms. As a reference, a landcover map of Ghana is presented below, showing the distribution of land cover types for the year 2000 within the country, based on satellite images from the vegetation sensor of SPOT 4. The cocoa farms surveyed during this assessment are represented in red on the figure of the right. Nearly all of them are located on the “Mosaic Forest /Croplands” category of the landcover map. It is noticeable the larger concentration of closed evergreen forest patches in the Western Region in relation to the other regions, which explains the higher likelihood of finding forest adjacent to farms in this region.
Fig. 5 – Land cover map of Ghana (left), Regions where Cocoa farms sampled circled in red (right)
Map Reference: The Land Cover Map for Africa in the Year 2000. P. Mayaux, E. Bartholomeu, A. Cabral, M. Cherlet, P. Defourny, A. Di Gregorio, O. Diallo, M. Massart, A. Nonguierma, J.-F. Pekel, C. Pretorius, C. Vancutsem, M. Vasconcelos. GLC2000 database, European Commission, Joint Research Centre, 2003. Available from http://bioval.jrc.ec.europa.eu/products/glc2000/products.php (last accessed on 1st September 2013.
Annual food crops
Other perennial
crops
Cocoa field
ForestBush
fallowSwamp Stream
Other land use
Ashanti 19.48 2.25 58.05 0.00 16.85 0.00 3.37 0.00Brong Ahafo & Central 14.14 1.01 65.66 0.00 13.13 3.03 3.03 0.00Eastern 11.67 4.17 68.33 0.00 11.67 0.00 4.17 0.00Western 8.36 2.39 53.43 2.39 15.82 4.48 8.36 4.78Ashanti 19.10 2.25 57.68 0.00 17.60 0.00 3.37 0.00Brong Ahafo & Central 15.15 1.01 61.62 0.00 14.14 3.03 5.05 0.00Eastern 11.67 5.00 65.83 0.00 13.33 0.00 4.17 0.00Western 8.06 2.99 54.03 1.49 16.72 4.18 7.76 4.78
Initial
Audited

16
G. Farmers’ data The results of the Wilcoxon test reveal that the differences in number of species between the 2 samples are not significant at 95% level (V = 1317, p-value = 0.1014). Further analysis revealed that at least 50% of the farms showed no difference in number of species recorded by the farmers (median = 0), the mean difference was -0.125 and the maximum difference found was -15 species (with the audited data showing higher values for number of species). In relation to the number of trees per each species, the differences were also not significant at 95% level (V = 292204721, p-value = 0.0785). In relation to abundance, significant differences were found for some of the species, namely Oil palm, Besi, Yaya, Kyankyeren, Kakapenpen and Wama, which means that the number of trees recorded for these species vary significantly between the initial and the audited samples. Unknown species were also found significantly different regarding their abundance. The most abundant species (with higher number of trees) are, by descendant order, banana/plantain, oil palm, orange/citrus, avocado and sesemasa, in both initial and audited data, whereas the least common are Nyamkumabeye and Ananseaya. The distribution of trees by primary use is also very similar between the original and audited data, as well as the proportion of native and exotic species (Fig. 6).
Fig. 6 – Proportion of trees by primary use (left) and by native/exotic species (right) in initial and audited data (n=399)
To assess the type of species existing in the farm regarding primary use, the abundance data (number of trees per species) was excluded and only the presence of the species was considered. The values are very similar between the initial and audited samples. Timber species are the most used (41%), followed closely by edible species (38%), while medicinal species are the least present (10%).

17
The disaggregation by region shows a similar pattern between the initial and the audited samples, both for primary uses and native/exotic assessment. All regions show a higher proportion of timber trees except Ashanti where edible trees are more common, and a higher proportion of exotic trees. This suggests that the method of collecting species and abundance data utilizing the farmers form can produce similar results when used on the same farm (and is therefore reliable) and that the situation is similar across different regions.
Fig. 7 – Proportion of trees by primary use per Region, for initial data (left) and audited data (right) (n=399)
Fig. 8 – Proportion of trees by native & exotic species per Region, for initial data (left) and audited data (right) (n=399)
In relation to banana/plantain and palm trees, results show that both initial and audited data show significant differences between the farmers’ data and the sampled data collected using the biodiversity form (p-values<0.0001, for banana and palm). Further analysis revealed, however, that at least 75% of the farms (3rd quartile) have a difference of zero between the

18
farmers and the sampled data. This means that the significance of the test is associated with a small number of farms, where the number of banana and palm are higher (or smaller) than average. The same was found for dead trees, with the significant differences between the farmers and the sampled data being derived from a small number of farms.
These results may be related to the fact that banana and plantain are purposely planted to provide shade for young cocoa trees, thus their location within the farm is specifically chosen by the farmer. Depending on the size of the farm and its age, the capture of banana/plantain data may be affected by the location of the sample plots. Moreover, when the number of banana and oil palm found within the plots is rather high, it may indicate data collection or entry issues that should be verified.
4. Monitoring and Evaluation of the Process
The data for 10,250 farms will be collected using the RBA methodology. In order to monitor and evaluate the process, a system was established to ensure the ongoing back stopping of the training and data collection process, to allow for the correction of any observed errors or issues and also to evaluate the rigor of the method’s protocol.
Field surveyors were assessed by the lead trainers on two subjects one month after the completion of the training: the application of the biodiversity rapid assessment method and the species identification. In addition, field surveyors had the opportunity to give personal feedback.
The feedback received will be used to better understand the data, protocol related data issues and/or make recommendations for adjustments to future applications of the RBA.
A. Species identification monitoring
Local species expert Seth Nuamah was hired and tasked to follow up in the field and assess Surveyors between one week and one month after they received the RBA method training. The assessor was instructed to visit at least 3 surveyors per day in the field and complete an evaluation form regarding the Surveyor’s capability to correctly identify new species.
Due to logistical and resource restrains, the species consultant was not able to follow up each of the Surveyors, but managed to evaluate 34% (12) Surveyors.
From the Surveyors that were evaluated, it was found that they were able to correctly identify new species between 81-100% of the time, without having difficulty in identifying any species in particular. All Surveyors responded that they were able to identify species that they had already seen on the farm, which is important to ensure that species are not re-counted. However, the results obtained from the analysis of the data collected using the RBA method, would indicate that there is an over estimation of species. During RBA and Species training, Surveyors were advised to record on their personal notepads, or on the species form which species they had seen within the plots in order to decrease the margin of error. However, this recommendation may need to be reviewed and a specific method developed in order to assist

19
with correct identification of new species. During the on-field follow up, the local species expert gave additional instructions to the Surveyors which included taking photos or samples of the trees for which uncertainty existed, in order to assist with the correct identification of new species. Final feedback from Seth Nuamah suggests that additional in-office species training would be useful to further improve Surveyor’s ability to correctly identify new species.
A positive observation that was recorded during the on-field follow up was that Surveyors are now teaching the farmers how to identify the species on their farms. This is in important outcome of this training process as it shows the knowledge and skills that are developed during the training of the Surveyors are being diffused and reaching farmers.
B. RBA Training - protocol monitoring
Each trainer was asked to complete an evaluation form after following up with each Surveyor on the field a month after initial RBA training. The Trainer was to ensure that Surveyors were following the RBA protocol and to correct any mistakes observed. Unfortunately, only a single feedback form was provided by the lead Trainer instead of one for each day Surveyors were monitored on field. To complete information obtain by this form, the lead Trainer was contacted by email in order to further evaluate the Trainer’s perspective of the Surveyor’s (as a group) ability to accurately carry out the RBA procedure.
From this feedback, it is understood that the Trainers are confident with the Surveyor’s knowledge and execution of the RBA methodology and that no additional methodological training is needed. There was observation made regarding the ability of a few individual Surveyors to illicit species information from the farmers, it is recommended that individual follow up and additional support is provided to these Surveyors to ensure that species related data is collected correctly.
C. Surveyor feedback
When Surveyors returned to the Armajaro office after a month on the field, a debrief was conducted by the lead Trainer, followed by Surveyors completing an individual evaluation form in order to obtain comments and gauge if any problems or issues existed. Thereafter, informal communication was maintained on a weekly basis to allow for feedback and to follow up issues raised in the first meeting.
37 Surveyors participated in the collection of Biodiversity data on the 400 farms. From this, 40.5% (15) provided feedback after one month of collecting the data. The Surveyors were of varied experience levels regarding the current TMS data collection protocol and the RBA methodology. Existing Armajaro Surveyors were trained only in the biodiversity method (some had already been trained in December 2012 during the Calibration and Testing Phases of this project, others before the collection of data for this phase), while new Surveyors were hired and trained in both the TMS and RBA method.
All Surveyors that provided feedback felt that the RBA methodology was easy to follow, that it was uncomplicated to select where to set the plots and that the tools provided where adequate and convenient to manage in order to complete the field work. In addition, 97% of
20
Surveyors were satisfied with the level of support provided by the farmer whilst setting the plots and collecting biodiversity related data.
While 80% of Surveyors were confident that they were able to easily identify new species, 20% did not agree. All but one Surveyor that provided feedback felt that farmers had the capacity to provide accurate species information regarding the species identification and to assist with the compilation of the species form. Feedback from the Surveyors highlight concern regarding the illiteracy of farmers, however this should not impact the collection of the data as the Surveyors are instructed to verbally ask the Famers what species they have on farm and record the answer directly on the form and if necessary, they can run through the list verbally to prompt the farmer. It is suggested that the Surveyor’s role in asking and recording data is reinforced in future training and follow up sessions to eliminate concern regarding the quality of data collected if farmers are illiterate. In addition, two Surveyors identified that there was some confusion while trying to keep track of species that were seen on farm (also outside of the plot) while mapping the farm in order to validate the information provided by the farmers for the Species Form (species that are present on farm).
All except for 2 Surveyors felt that they were able to effectively overcome any problems that they encountered on-field so that it did not affect the quality or results of the data collection process. Only 14% of Surveyors experiences numerous problems on field.
D. Summary
The monitoring system that has been developed to ensure that Surveyors are correctly implanting the RBA methodology was useful in identifying that additional Species training would be useful to help improve the reliability of the species related data collected by the farmers. However, following consultation with the Local Species Expert, it was advised that Surveyors would improve their skills and ability to identify new species over time.
During this monitoring and evaluation process, only 34% of Surveyors were followed up on the field. It is recommended that all Surveyors receive on field follow up by both the Species Training and the RBA methods Trainer and that all Surveyors provide an individual feedback form.
5. Main conclusions
For most of the parameters assessed, the differences between the initial and the audited data are not significant
Number of trees, banana and palm are not significantly different between the initial and audited samples
The ‘number of trees’ parameter needs to be revised in order to overcome the systematic error discovered during the analysis on a larger sample size
21
Number of species and number of dead trees are significantly different between the samples
Species: The initial data shows higher values of species than the audited data; the distribution of the Surveyors may indicate an additional need for training in relation to species identification
Dead trees: differences likely related to data collection or entry issues, values for some farms are substantially higher than average (14, 10, 9 dead trees found within the 4 sample plots). If this is not the case, then these farms may have been facing diseases on their non-cocoa trees, or farmers are killing (debarking) them at a larger pace than usual, both issues being very important to follow-up
The distribution of oil palm trees and banana is highly variable among farms, for the biodiversity data
Regional patterns were found to be not significant for all the parameters (number of species, number of trees, number of dead trees, number of banana/plantain and number of oil palm)
Shade classification is not significantly different between the samples. On the contrary, sampled shade classes are significantly different from the TMS classification. This under/overestimation may be related to the fact that all fruit trees (like mangoes, citrus, among others) and palm trees are considered in the biodiversity data, while for visual estimation of shade pattern, it’s the subjective interpretation and the experience of the Surveyor that define shade pattern overall for the farm
Diversity of land use types is similar between samples; “Cocoa field” is the most common land use type found adjacent to the cocoa farms, and “Forest” the least common. Slight differences were found among regions
For data collected using the farmers’ form, differences in number of species and number of trees per species (abundance) between the 2 samples are not significant overall. However, in relation to abundance recorded by species, significant differences were found for some of the species, such as Oil palm, Besi and Yaya
The distribution of trees by primary use and the proportion of native and exotic species are very similar between the original and audited data, as well as among Regions
Significant differences were found between the banana, palm and dead trees provided by the farmers and by sampling using the biodiversity form. These differences derive from a small number of farms, since at least 75% of the farms showed no difference
The differences found may also result from particular characteristics of the farms (size, location, etc.), and from errors in data entry from the automatic scanning procedure, which should be verified.