
Monitor: US labour market: downside risk to December … · Labour productivity is running...
10
Important disclosures and certifications are contained from page 9 of this report. www.danskeresearch.com Investment Research — General Market Conditions Job report preview We expect non-farm payrolls to show an increase of 195,000 in December, below the consensus estimate at 240,000. The expectation of a weaker number in December is due mainly to the very strong reading in November at 321,000. Our trend model points to 235,000. However, non-farm payrolls are volatile and a strong number last time points towards a bit weaker number this month. Furthermore, the fall in ISM figures supports the December number being less than the average for the past six months (258,000). We experienced a significant fall in the December non-farm payroll from 274,000 in November 2013 to 84,000 in December 2013. Once again, we forecast the unemployment rate will stay unchanged at 5.8% (consensus 5.7%) as we look for a rise in the labour force to compensate for robust employment. However, the trend in unemployment is clearly down and we could very well hit the Fed’s long-term unemployment rate of 5.4% as early as Q2. Hourly earnings should also be followed closely, as this is one of the key indicators for judging how much the US labour market is tightening. Recently there have been signs of rising wage growth after a long period of low wage pressure. The Employment Cost Index has shown stronger momentum and the hourly earnings in the job report rose 0.4% m/m in November. We look for a rise of 0.2% m/m in December in line with consensus. General conditions and outlook We look for employment growth to average 260,000 per month over the next year, which is not far from the current pace. Job growth has been supported by a combination of strong GDP growth and low labour productivity over the past two quarters. Looking ahead, we expect economic activity to continue to support a further healing of the labour market as we look for GDP growth at 3.0% next year. Labour productivity is running considerably below potential and we expect the gap to close gradually over coming years. This implies that higher activity is needed to keep job growth at its current level in coming quarters. With continued employment gains above the long-term pace, the labour market will continue to tighten. The U6 unemployment measure has fallen closer to normal levels and the short-term unemployment rate has reached low levels. The participation rate has continued lower contrary to expectations that people would return to the labour market as job opportunities improved. Part of the decline is due to demographic factors but this cannot explain the whole decline. We continue to look for the first hike from the Fed in June, as the Fed is moving closer to the full employment target and the gradual tightening of the labour market is set to increase medium-term price pressure. 6 January 2015 Danske Bank forecasts (November) Source: Macrobond Financial, Danske Bank Markets calculations Weaker non-farm payroll in December due to pay-back from strong November number Source: Macrobond Financial, BLS Closing in on the Fed’s NAIRU estimate Source: Macrobond Financial, BLS Chief Analyst Allan von Mehren +45 45128055 [email protected] Assistant Analyst Louise Randrup Noe [email protected] Monitor US labour market: downside risk to December payrolls DB Consensus Prior Non-farm Payrolls 195 240 321 -Private 175 230 314 -Manufacturing - 15 28 -Service - - 266 -Construction - - 20 -Mining and logging - - 0 -Government 20 10 7 Unemployment rate 5,8% 5,7% 5,8%
Transcript of Monitor: US labour market: downside risk to December … · Labour productivity is running...

Important disclosures and certifications are contained from page 9 of this report. www.danskeresearch.com
Investment Research — General Market Conditions
Job report preview
We expect non-farm payrolls to show an increase of 195,000 in December, below
the consensus estimate at 240,000. The expectation of a weaker number in
December is due mainly to the very strong reading in November at 321,000. Our
trend model points to 235,000. However, non-farm payrolls are volatile and a strong
number last time points towards a bit weaker number this month. Furthermore, the fall
in ISM figures supports the December number being less than the average for the past
six months (258,000). We experienced a significant fall in the December non-farm
payroll from 274,000 in November 2013 to 84,000 in December 2013.
Once again, we forecast the unemployment rate will stay unchanged at 5.8%
(consensus 5.7%) as we look for a rise in the labour force to compensate for
robust employment. However, the trend in unemployment is clearly down and we
could very well hit the Fed’s long-term unemployment rate of 5.4% as early as Q2.
Hourly earnings should also be followed closely, as this is one of the key
indicators for judging how much the US labour market is tightening. Recently
there have been signs of rising wage growth after a long period of low wage pressure.
The Employment Cost Index has shown stronger momentum and the hourly earnings
in the job report rose 0.4% m/m in November. We look for a rise of 0.2% m/m in
December in line with consensus.
General conditions and outlook
We look for employment growth to average 260,000 per month over the next
year, which is not far from the current pace. Job growth has been supported by a
combination of strong GDP growth and low labour productivity over the past two
quarters. Looking ahead, we expect economic activity to continue to support a further
healing of the labour market as we look for GDP growth at 3.0% next year. Labour
productivity is running considerably below potential and we expect the gap to close
gradually over coming years. This implies that higher activity is needed to keep job
growth at its current level in coming quarters.
With continued employment gains above the long-term pace, the labour market
will continue to tighten. The U6 unemployment measure has fallen closer to normal
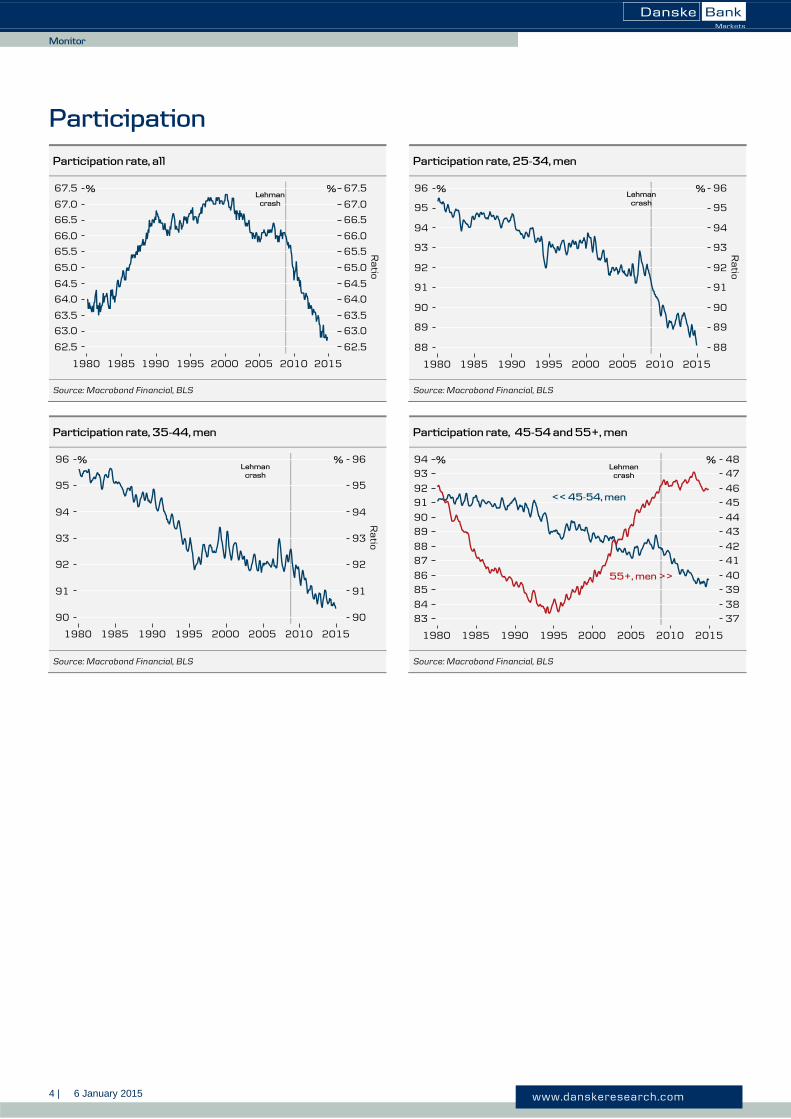
levels and the short-term unemployment rate has reached low levels. The participation
rate has continued lower contrary to expectations that people would return to the
labour market as job opportunities improved. Part of the decline is due to
demographic factors but this cannot explain the whole decline.
We continue to look for the first hike from the Fed in June, as the Fed is moving
closer to the full employment target and the gradual tightening of the labour market is
set to increase medium-term price pressure.
Source: Macrobond and own calculations
6 January 2015
Danske Bank forecasts (November)
Source: Macrobond Financial, Danske Bank
Markets calculations
Weaker non-farm payroll in December
due to pay-back from strong
November number
Source: Macrobond Financial, BLS
Closing in on the Fed’s NAIRU estimate
Source: Macrobond Financial, BLS
Chief Analyst Allan von Mehren +45 45128055 [email protected] Assistant Analyst Louise Randrup Noe [email protected]
Monitor
US labour market: downside risk to December payrolls
DB Consensus Prior
Non-farm Payrolls 195 240 321
-Private 175 230 314
-Manufacturing - 15 28
-Service - - 266
-Construction - - 20
-Mining and logging - - 0
-Government 20 10 7
Unemployment rate 5,8% 5,7% 5,8%

2 | 6 January 2015 www.danskeresearch.com
Mon
itor
Monitor
Models and leading indicators
Payrolls model ISM employment and US non-farm payrolls
Source: Macrobond Financial, Danske Bank Markets calculations Source: Macrobond Financial, ISM, BLS
Initial jobless claims Small business hiring plans next 3 months
Source: Macrobond Financial, US Department of Labor Source: Macrobond Financial, NFIB
Wage pressure and unemployment rate Worker confidence and unemployment rate
Source: Macrobond Financial, Danske Bank Markets calculations Source: Macrobond Financial

3 | 6 January 2015 www.danskeresearch.com
Mon
itor
Monitor
Unemployment measures
Unemployment rate Unemployment decomposed by duration
Source: Macrobond Financial, BLS Source: Macrobond Financial, BLS
Long-term unemployment rate Short-term unemployment rate
Source: Macrobond Financial, BLS Source: Macrobond Financial, BLS
Long-term unemployment as % of total unemployed Marginally attached workers
Source: Macrobond Financial, BLS Source: Macrobond Financial, BLS
4 | 6 January 2015 www.danskeresearch.com
Mon
itor
Monitor
Participation
Participation rate, all Participation rate, 25-34, men
Source: Macrobond Financial, BLS Source: Macrobond Financial, BLS
Participation rate, 35-44, men Participation rate, 45-54 and 55+, men
Source: Macrobond Financial, BLS Source: Macrobond Financial, BLS

5 | 6 January 2015 www.danskeresearch.com
Mon
itor
Monitor
Employment measures
Non-farm payroll ADP private payrolls
Source: Macrobond Financial Source: Macrobond Financial
Part-time employed for economic reasons Employment to population ratio
Source: Macrobond Financial, BLS Source: Macrobond Financial, BLS

6 | 6 January 2015 www.danskeresearch.com
Mon
itor
Monitor
Wage growth and inflation
PCE core inflation remains well below Fed target Hourly earnings, production and non-supervisory
Source: Macrobond Financial, BEA Source: Macrobond Financial, BLS
Fundamentals support higher wage growth Worker confidence is slowly rising – will wages follow?
Source: Macrobond Financial, BLS Source: Macrobond Financial, Conference Board, BLS
7 | 6 January 2015 www.danskeresearch.com
Mon
itor
Monitor
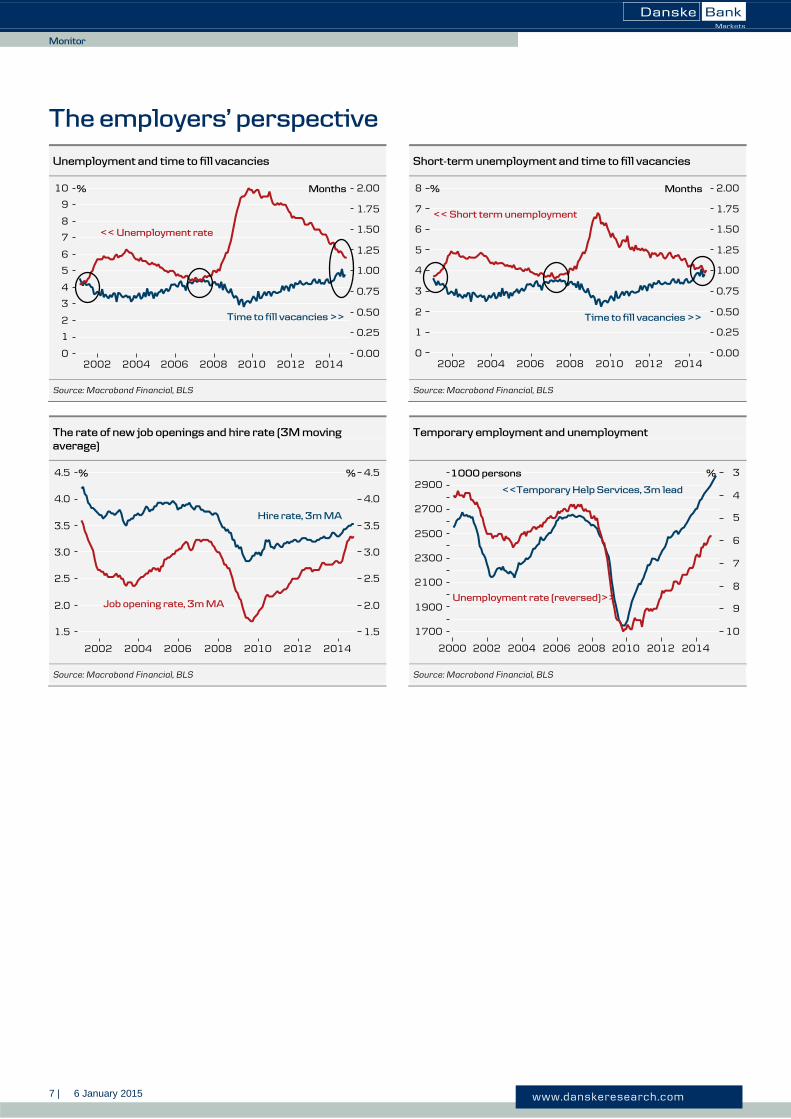
The employers’ perspective
Unemployment and time to fill vacancies Short-term unemployment and time to fill vacancies
Source: Macrobond Financial, BLS Source: Macrobond Financial, BLS
The rate of new job openings and hire rate (3M moving
average)
Temporary employment and unemployment
Source: Macrobond Financial, BLS Source: Macrobond Financial, BLS

8 | 6 January 2015 www.danskeresearch.com
Mon
itor
Monitor
US labour market in one chart
Signs of labour market improvements in leading indicators while utilisation still lags (outward moves indicate stronger labour
market)
Note: The figure shows the level of tightness of different US labour market key figures at different times, compared with the level of the same figures in December 2004
(index=100). Counter cyclical figures (unemployment rate, jobless claims, job availability, U-6 UR, work part time for economic reasons) are inverted, thus the higher
index (the further from the middle) the better (tighter) is the state of the labour market. The dark blue line correspond to the level of December 2004.
Source: BLS (JOLTS), Macrobond Financial
Jobless claims
Time to f ill vacancies
Temporary help service
Job openings rate
Hire rate
Hiring plans
Job availability
Quits
ISM employment index
U-6 marginally attached workers
Unemployment rate
Work part time for economic reasons
Dec 2004 October 2012 October 2013 October 2014
Utilization
Confidence
Employer
behavior
Leading
indicators
Utilization
Confidence
Employer
behavior
Leading
indicators
Leading indicators
continue to suggest
better labour market
conditions.
Employer behaviour
is improving slightly
compared with
previous years.
Confidence is moving
towards baseline
scenario. ISM
employment is
actually a little better.
Slack indicators have
not followed the
positive signs from
the unemployment
rate.

9 | 6 January 2015 www.danskeresearch.com
Mon
itor
Monitor
Disclosures
This research report has been prepared by Danske Bank Markets, a division of Danske Bank A/S (‘Danske
Bank’). The authors of this research report are Allan Von Mehren, Chief Analyst, and Louise Randrup Noe,
Assistant Analyst.
Analyst certification
Each research analyst responsible for the content of this research report certifies that the views expressed in this
research report accurately reflect the research analyst’s personal view about the financial instruments and issuers
covered by the research report. Each responsible research analyst further certifies that no part of the compensation
of the research analyst was, is or will be, directly or indirectly, related to the specific recommendations expressed
in the research report.
Regulation
Danske Bank is authorised and subject to regulation by the Danish Financial Supervisory Authority and is subject
to the rules and regulation of the relevant regulators in all other jurisdictions where it conducts business. Danske
Bank is subject to limited regulation by the Financial Conduct Authority and the Prudential Regulation Authority
(UK). Details on the extent of the regulation by the Financial Conduct Authority and the Prudential Regulation
Authority are available from Danske Bank on request.
The research reports of Danske Bank are prepared in accordance with the Danish Society of Financial Analysts’
rules of ethics and the recommendations of the Danish Securities Dealers Association.
Conflicts of interest
Danske Bank has established procedures to prevent conflicts of interest and to ensure the provision of high-
quality research based on research objectivity and independence. These procedures are documented in Danske
Bank’s research policies. Employees within Danske Bank’s Research Departments have been instructed that any
request that might impair the objectivity and independence of research shall be referred to Research Management
and the Compliance Department. Danske Bank’s Research Departments are organised independently from and do
not report to other business areas within Danske Bank.
Research analysts are remunerated in part based on the overall profitability of Danske Bank, which includes
investment banking revenues, but do not receive bonuses or other remuneration linked to specific corporate
finance or debt capital transactions.
Financial models and/or methodology used in this research report
Calculations and presentations in this research report are based on standard econometric tools and methodology
as well as publicly available statistics for each individual security, issuer and/or country. Documentation can be
obtained from the authors on request.
Risk warning
Major risks connected with recommendations or opinions in this research report, including a sensitivity analysis
of relevant assumptions, are stated throughout the text.
Date of first publication
See the front page of this research report for the date of first publication.
General disclaimer This research has been prepared by Danske Bank Markets (a division of Danske Bank A/S). It is provided for
informational purposes only. It does not constitute or form part of, and shall under no circumstances be
considered as, an offer to sell or a solicitation of an offer to purchase or sell any relevant financial instruments
(i.e. financial instruments mentioned herein or other financial instruments of any issuer mentioned herein and/or
options, warrants, rights or other interests with respect to any such financial instruments) (‘Relevant Financial
Instruments’).
The research report has been prepared independently and solely on the basis of publicly available information that
Danske Bank considers to be reliable. While reasonable care has been taken to ensure that its contents are not
untrue or misleading, no representation is made as to its accuracy or completeness and Danske Bank, its affiliates
and subsidiaries accept no liability whatsoever for any direct or consequential loss, including without limitation
any loss of profits, arising from reliance on this research report.
The opinions expressed herein are the opinions of the research analysts responsible for the research report and
reflect their judgement as of the date hereof. These opinions are subject to change, and Danske Bank does not
10 | 6 January 2015 www.danskeresearch.com
Mon
itor
Monitor
undertake to notify any recipient of this research report of any such change nor of any other changes related to the
information provided in this research report.
This research report is not intended for retail customers in the United Kingdom or the United States.
This research report is protected by copyright and is intended solely for the designated addressee. It may not be
reproduced or distributed, in whole or in part, by any recipient for any purpose without Danske Bank’s prior
written consent.
Disclaimer related to distribution in the United States This research report is distributed in the United States by Danske Markets Inc., a U.S. registered broker-dealer
and subsidiary of Danske Bank, pursuant to SEC Rule 15a-6 and related interpretations issued by the U.S.
Securities and Exchange Commission. The research report is intended for distribution in the United States solely
to ‘U.S. institutional investors’ as defined in SEC Rule 15a-6. Danske Markets Inc. accepts responsibility for this
research report in connection with distribution in the United States solely to ‘U.S. institutional investors’.
Danske Bank is not subject to U.S. rules with regard to the preparation of research reports and the independence
of research analysts. In addition, the research analysts of Danske Bank who have prepared this research report are
not registered or qualified as research analysts with the NYSE or FINRA but satisfy the applicable requirements
of a non-U.S. jurisdiction.
Any U.S. investor recipient of this research report who wishes to purchase or sell any Relevant Financial
Instrument may do so only by contacting Danske Markets Inc. directly and should be aware that investing in non-
U.S. financial instruments may entail certain risks. Financial instruments of non-U.S. issuers may not be
registered with the U.S. Securities and Exchange Commission and may not be subject to the reporting and
auditing standards of the U.S. Securities and Exchange Commission.


![September 2011The downside of external-debt reduction 1 THE DOWNSIDE OF EXTERNAL-DEBT REDUCTION Paul Beckerman* *Independent consultant [paul.beckerman@gmail.com].](https://static.fdocuments.us/doc/165x107/56649db55503460f94aa607f/september-2011the-downside-of-external-debt-reduction-1-the-downside-of-external-debt.jpg)


