
MoneyTreeTM India Report Q2 2015 - pwc.in · (Quikr) and furniture (Urban Ladder). E-commerce...
24
www.pwc.com/globalmoneytree www.pwc.in PricewaterhouseCoopers India Pvt Ltd MoneyTree TM India Report Q2 2015 Technology Institute This special report provides summary results of Q2 ’14, Q1 ’15, and Q2 ’15. Data provided by Venture Intelligence
Transcript of MoneyTreeTM India Report Q2 2015 - pwc.in · (Quikr) and furniture (Urban Ladder). E-commerce...
www.pwc.com/globalmoneytree www.pwc.in
PricewaterhouseCoopers India Pvt Ltd
MoneyTreeTM India Report Q2 2015
Technology Institute
This special report provides summary results of Q2 ’14, Q1 ’15, and Q2 ’15.
Data provided by Venture Intelligence
PwC MoneyTreeTM India Report – Q2 ’15 2
Table of contents
1. Overview 3 2 Analysis of PE investments 5
Total equity investments 5 Investments by industry 6 Investments by stage of development 8 Investments by region 9 Top 20 PE deals 10
3. Analysis of PE exits 11 Total PE exits 11 Exits by industry 12 Exits by type 13 Top five PE exits 14
4. Active PE firms 15 5. Sector focus: IT & ITeS sector 16
Total PE investments 17 Investments by stage of development 19 Investments by region 20 Investments by subsector 21 PE exits in the sector 22
6. Definitions 23 Contacts 24
PwC MoneyTreeTM India Report – Q2 ’15 3
1. Overview
Bouyancy is back In Q2 2015, the momentum of private equity (PE) has continued in India with investments worth 4.3 billion USD, one of the strongest performances in several quarters. Beyond investments, it has been an impressive quarter for exits by Indian PE, which stood at 3.5 billion USD.
The technology sector contributed over 1.7 billion USD in investments, mainly aided by the 440 million USD buyout by Baring Asia and the 400 million USD investments in cab aggregator Ola Cabs by a group of investors led by SoftBank and Tiger Global. E-commerce and e-services continued to contribute the most significant component of technology PE investments, and this is unlikely to change in the near future.
Pharmaceuticals and healthcare was the second highest contributor, with Temasek investing 293 million USD in Sun Pharma and 151 million USD in Glenmark, followed by a 203 million USD investment by Capital International in Mankind Pharma.
The financial services and manufacturing sectors were among the top four sectors, owing respectively to Apax Partners’ investment of 383 million USD in Shriram City Union Finance and a 315 million USD buyout of Crompton Greaves by Temasek and Advent together.
Energy found a place in the top five as well, with deals worth 369 million USD. Increased interest in renewables as well as equipment manufacturers helped a surge in investments in the sector.
This sudden spurt in activity has been aided mainly by a good number of secondary transactions, which is a healthy sign of a maturing PE market.
PwC MoneyTreeTM India Report – Q2 ’15 4
We expect the buoyancy to continue in the second half of the year—in the short term, e-commerce, IT and life sciences deal activity is expected to carry on irrespective of the domestic economic situation. There seems to be some positive news on the domestic front too—the Reserve Bank of India has cut rates thrice over the last year, and looks set to keep them at the lower levels for the time being. However, concerns around the monsoons continue; this can impact the domestic economy and uncertainty is probable in the global markets as the US Fed is likely to raise rates later this year.
Sanjeev Krishan Private Equity and Transaction Services Leader PwC India
PwC MoneyTreeTM India Report – Q2 ’15 5
2. Analysis of PE investments
Total equity investments in PE-backed companies
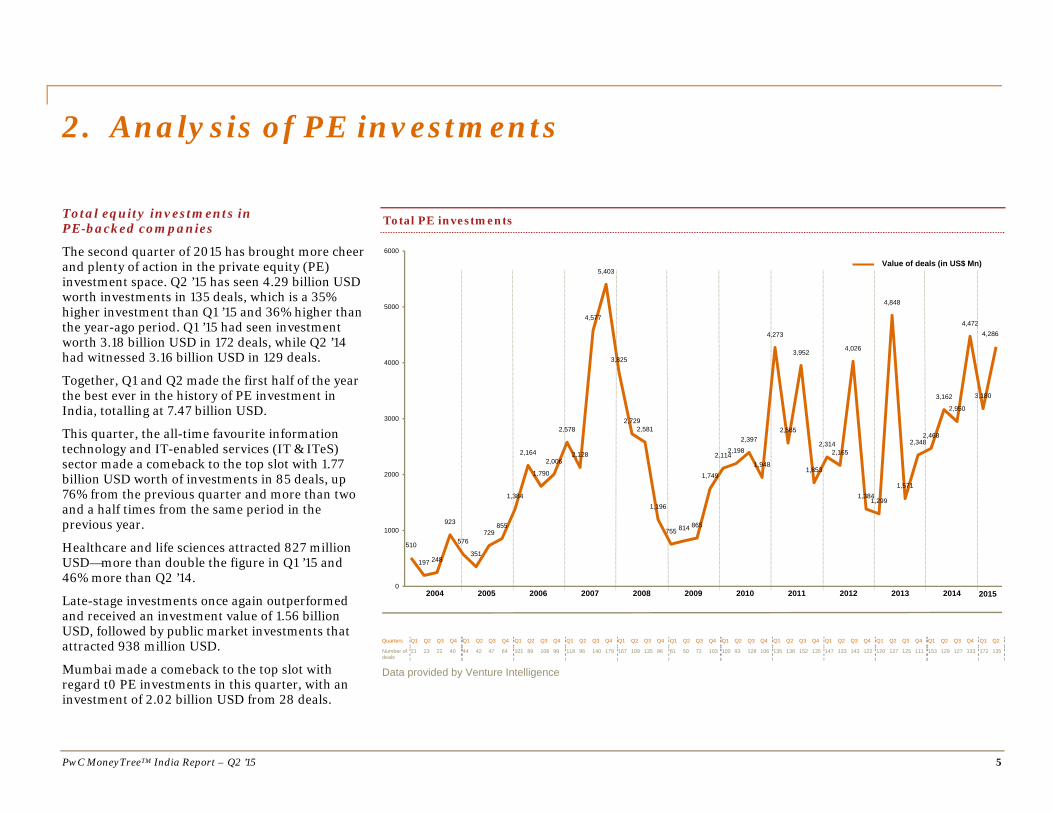
The second quarter of 2015 has brought more cheer and plenty of action in the private equity (PE) investment space. Q2 ’15 has seen 4.29 billion USD worth investments in 135 deals, which is a 35% higher investment than Q1 ’15 and 36% higher than the year-ago period. Q1 ’15 had seen investment worth 3.18 billion USD in 172 deals, while Q2 ’14 had witnessed 3.16 billion USD in 129 deals.
Together, Q1 and Q2 made the first half of the year the best ever in the history of PE investment in India, totalling at 7.47 billion USD.
This quarter, the all-time favourite information technology and IT-enabled services (IT & ITeS) sector made a comeback to the top slot with 1.77 billion USD worth of investments in 85 deals, up 76% from the previous quarter and more than two and a half times from the same period in the previous year.
Healthcare and life sciences attracted 827 million USD—more than double the figure in Q1 ’15 and 46% more than Q2 ’14.
Late-stage investments once again outperformed and received an investment value of 1.56 billion USD, followed by public market investments that attracted 938 million USD.
Mumbai made a comeback to the top slot with regard t0 PE investments in this quarter, with an investment of 2.02 billion USD from 28 deals.
Total PE investments
Quarters Q1 Q2 Q3 Q4 Q1 Q2 Q3 Q4 Q1 Q2 Q3 Q4 Q1 Q2 Q3 Q4 Q1 Q2 Q3 Q4 Q1 Q2 Q3 Q4 Q1 Q2 Q3 Q4 Q1 Q2 Q3 Q4 Q1 Q2 Q3 Q4 Q1 Q2 Q3 Q4 Q1 Q2 Q3 Q4 Q1 Q2
Number of deals
21 23 22 40 44 42 47 64 101 89 108 99 118 96 140 179 167 109 135 86 81 50 72 103 100 93 128 106 135 138 152 135 147 133 143 122 120 127 125 111 153 129 127 133 172 135
Data provided by Venture Intelligence
510
197 248
923
576
351
729855
1,384
2,164
1,790
2,006
2,578
2,128
4,577
5,403
3,825
2,7292,581
1,196
755 814 865
1,749
2,1142,198
2,397
1,948
4,273
2,565
3,952
1,853
2,3142,165
4,026
1,3841,299
4,848
1,571
2,3482,468
3,162
2,950
4,472
3,180
4,286
0
1000
2000
3000
4000
5000
6000
Value of deals (in US$ Mn)
2006 2007 2008 2009 2010 2011 2012 2013 2014 20152004 2005
Analysis of private equity investments
PwC MoneyTreeTM India Report – Q2 ’15 6
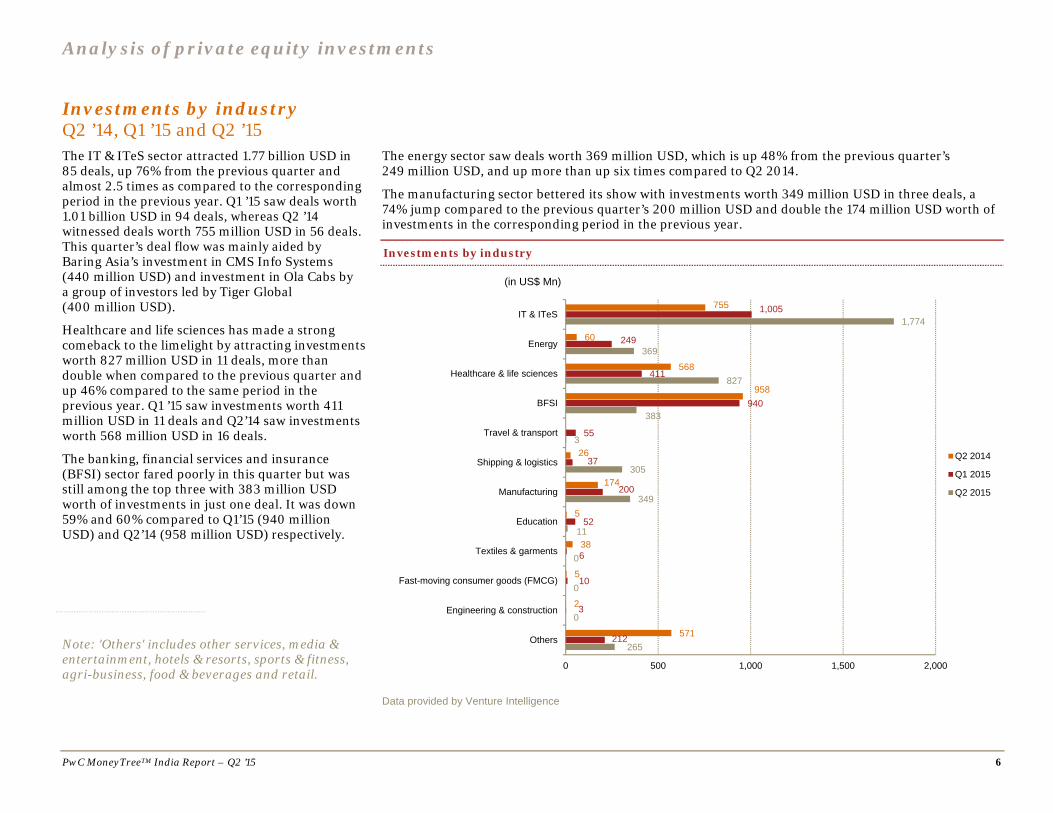
Investments by industry Q2 ’14, Q1 ’15 and Q2 ’15The IT & ITeS sector attracted 1.77 billion USD in 85 deals, up 76% from the previous quarter and almost 2.5 times as compared to the corresponding period in the previous year. Q1 ’15 saw deals worth 1.01 billion USD in 94 deals, whereas Q2 ’14 witnessed deals worth 755 million USD in 56 deals. This quarter’s deal flow was mainly aided by Baring Asia’s investment in CMS Info Systems (440 million USD) and investment in Ola Cabs by a group of investors led by Tiger Global (400 million USD).
Healthcare and life sciences has made a strong comeback to the limelight by attracting investments worth 827 million USD in 11 deals, more than double when compared to the previous quarter and up 46% compared to the same period in the previous year. Q1 ’15 saw investments worth 411 million USD in 11 deals and Q2’14 saw investments worth 568 million USD in 16 deals.
The banking, financial services and insurance (BFSI) sector fared poorly in this quarter but was still among the top three with 383 million USD worth of investments in just one deal. It was down 59% and 60% compared to Q1’15 (940 million USD) and Q2’14 (958 million USD) respectively.
The energy sector saw deals worth 369 million USD, which is up 48% from the previous quarter’s 249 million USD, and up more than up six times compared to Q2 2014.
The manufacturing sector bettered its show with investments worth 349 million USD in three deals, a 74% jump compared to the previous quarter’s 200 million USD and double the 174 million USD worth of investments in the corresponding period in the previous year.
Investments by industry
Data provided by Venture Intelligence
755
60
568
958
26
174
5
38
5
2
571
1,005
249
411
940
55
37
200
52
6
10
3
212
1,774
369
827
383
3
305
349
11
0
0
0
265
0 500 1,000 1,500 2,000
IT & ITeS
Energy
Healthcare & life sciences
BFSI
Travel & transport
Shipping & logistics
Manufacturing
Education
Textiles & garments
Fast-moving consumer goods (FMCG)
Engineering & construction
Others
(in US$ Mn)
Q2 2014
Q1 2015
Q2 2015
Note: 'Others' includes other services, media & entertainment, hotels & resorts, sports & fitness, agri-business, food & beverages and retail.
Analysis of private equity investments
PwC MoneyTreeTM India Report – Q2 ’15 7
‘We have seen yet another quarter of PE investments dominated by the IT & ITeS sector. Baring Asia's buyout of CMS Info Systems, which provides ATM-related cash management services, was the biggest tech deal this quarter. E-commerce continues to be very attractive to the PE/VC community and a majority of the investments are in the growth and late stages (follow-on rounds) and predominantly in niche segments like travel (Ola), classifieds (Quikr) and furniture (Urban Ladder). E-commerce ancillary companies in logistics, such as Ecom Express and Delhivery, also raked in big money.’ Sandeep Ladda Technology Leader, PwC India
‘There is enhanced interest in the laboratory diagnostics space. With a growth of over 20% CAGR, the sector is the fastest growing segment in the healthcare space. The large players have aggressive plans in the domestic as well as the international market. We expect robust deal activity in the space, catalysed by the fact that the leading players are going in for an IPO.’ Rana Mehta Healthcare Leader, PwC India
‘While the appetite for quality large deals remains—as demonstrated by the Shriram City Union deal with Apax—the broader deals picture in BFSI remains a bit subdued. There is interest in the fin-tech segments such as payment processing, online marketplaces for new services/products and those kinds with interesting business models.’
Bharti Gupta Ramola Financial Services Leader, PwC India
Analysis of private equity investments
PwC MoneyTreeTM India Report – Q2 ’15 8
Investments by stage of development Q2 ’14, Q1 ’15 and Q2 ’15
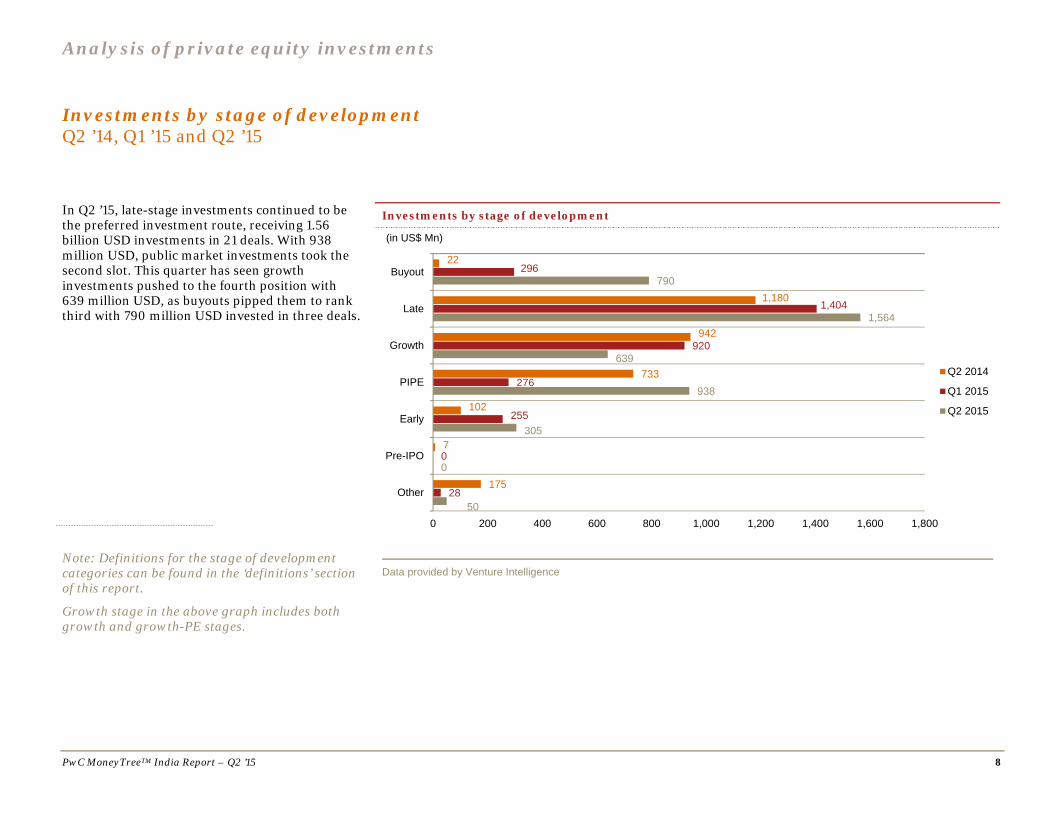
In Q2 ’15, late-stage investments continued to be the preferred investment route, receiving 1.56 billion USD investments in 21 deals. With 938 million USD, public market investments took the second slot. This quarter has seen growth investments pushed to the fourth position with 639 million USD, as buyouts pipped them to rank third with 790 million USD invested in three deals.
Investments by stage of development
Data provided by Venture Intelligence
22
1,180
942
733
102
7
175
296
1,404
920
276
255
0
28
790
1,564
639
938
305
0
500 200 400 600 800 1,000 1,200 1,400 1,600 1,800
Buyout
Late
Growth
PIPE
Early
Pre-IPO
Other
(in US$ Mn)
Q2 2014
Q1 2015
Q2 2015
Note: Definitions for the stage of development categories can be found in the ‘definitions’ section of this report.
Growth stage in the above graph includes both growth and growth-PE stages.
Analysis of private equity investments
PwC MoneyTreeTM India Report – Q2 ’15 9
Investments by region Q2 ’14, Q1 ’15 and Q2 ’15
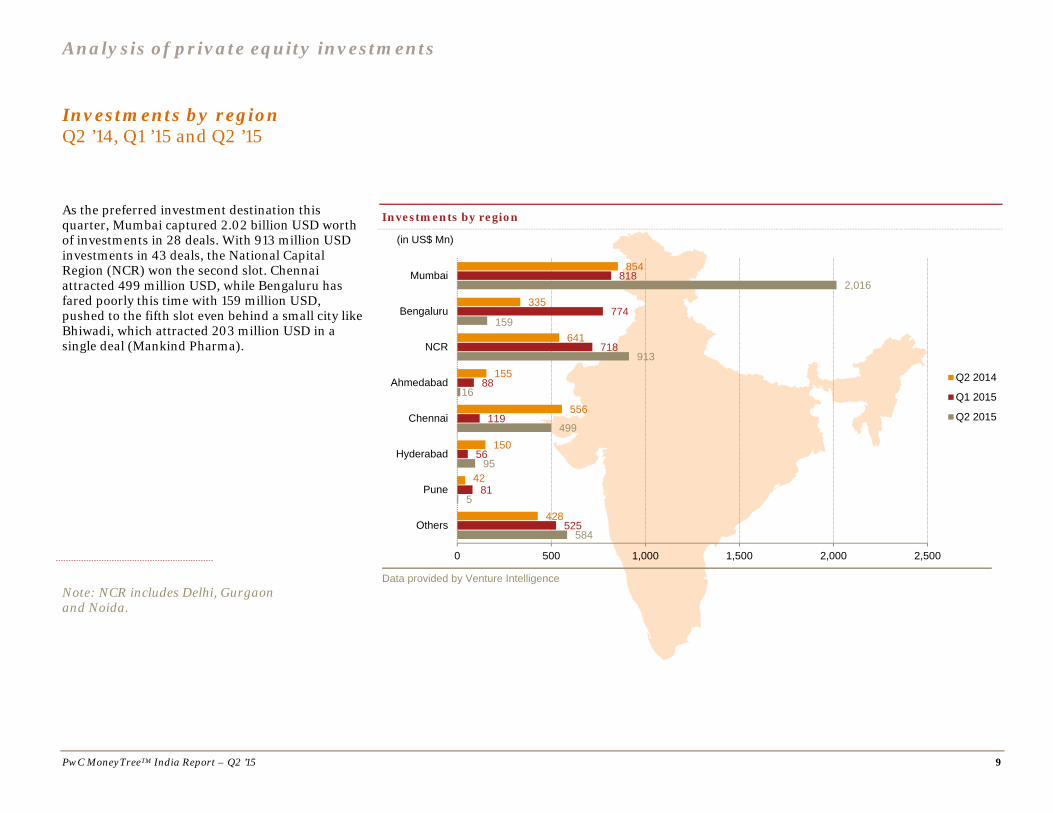
As the preferred investment destination this quarter, Mumbai captured 2.02 billion USD worth of investments in 28 deals. With 913 million USD investments in 43 deals, the National Capital Region (NCR) won the second slot. Chennai attracted 499 million USD, while Bengaluru has fared poorly this time with 159 million USD, pushed to the fifth slot even behind a small city like Bhiwadi, which attracted 203 million USD in a single deal (Mankind Pharma).
Investments by region
Data provided by Venture Intelligence
584
5
95
499
16
913
159
2,016
525
81
56
119
88
718
774
818
428
42
150
556
155
641
335
854
0 500 1,000 1,500 2,000 2,500
Others
Pune
Hyderabad
Chennai
Ahmedabad
NCR
Bengaluru
Mumbai
(in US$ Mn)
Q2 2014
Q1 2015
Q2 2015
Note: NCR includes Delhi, Gurgaon and Noida.
Analysis of private equity investments
PwC MoneyTreeTM India Report – Q2 ’15 10
Top 20 PE deals Q2 ’15
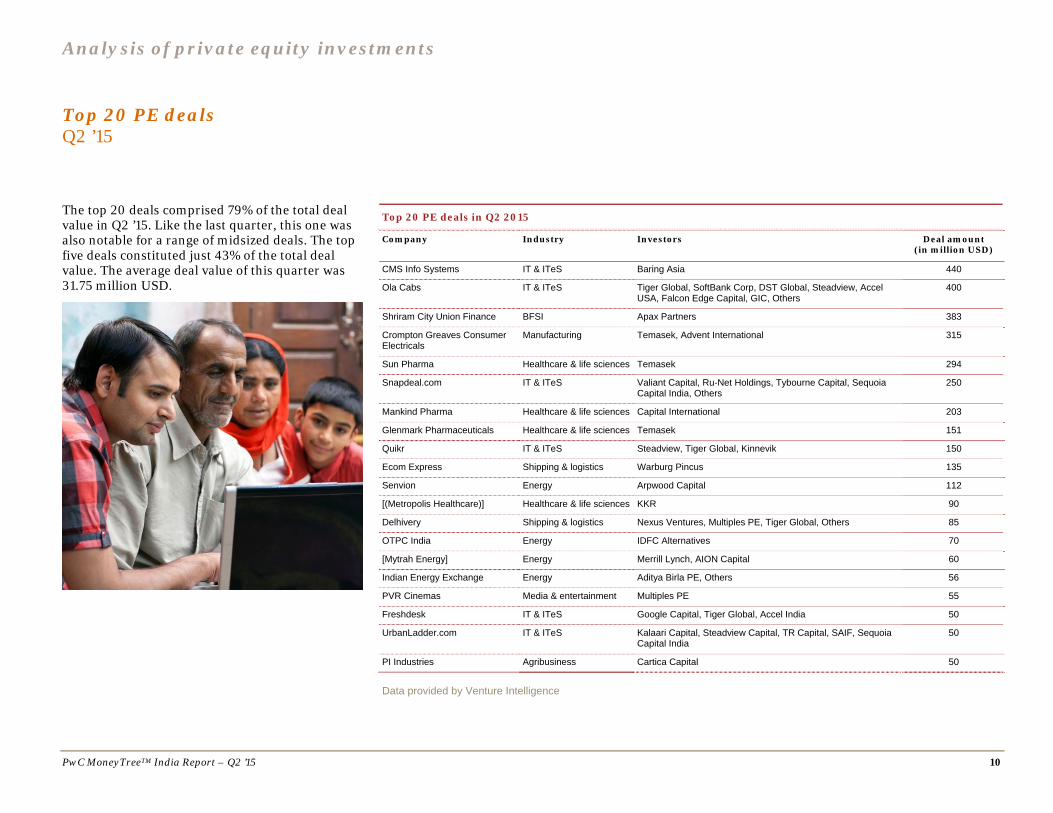
The top 20 deals comprised 79% of the total deal value in Q2 ’15. Like the last quarter, this one was also notable for a range of midsized deals. The top five deals constituted just 43% of the total deal value. The average deal value of this quarter was 31.75 million USD.
Top 20 PE deals in Q2 2015
Company Industry Investors Deal amount (in million USD)
CMS Info Systems IT & ITeS Baring Asia 440
Ola Cabs IT & ITeS Tiger Global, SoftBank Corp, DST Global, Steadview, Accel USA, Falcon Edge Capital, GIC, Others
400
Shriram City Union Finance BFSI Apax Partners 383
Crompton Greaves Consumer Electricals
Manufacturing Temasek, Advent International 315
Sun Pharma Healthcare & life sciences Temasek 294
Snapdeal.com IT & ITeS Valiant Capital, Ru-Net Holdings, Tybourne Capital, Sequoia Capital India, Others
250
Mankind Pharma Healthcare & life sciences Capital International 203
Glenmark Pharmaceuticals Healthcare & life sciences Temasek 151
Quikr IT & ITeS Steadview, Tiger Global, Kinnevik 150
Ecom Express Shipping & logistics Warburg Pincus 135
Senvion Energy Arpwood Capital 112
[(Metropolis Healthcare)] Healthcare & life sciences KKR 90
Delhivery Shipping & logistics Nexus Ventures, Multiples PE, Tiger Global, Others 85
OTPC India Energy IDFC Alternatives 70
[Mytrah Energy] Energy Merrill Lynch, AION Capital 60
Indian Energy Exchange Energy Aditya Birla PE, Others 56
PVR Cinemas Media & entertainment Multiples PE 55
Freshdesk IT & ITeS Google Capital, Tiger Global, Accel India 50
UrbanLadder.com IT & ITeS Kalaari Capital, Steadview Capital, TR Capital, SAIF, Sequoia Capital India
50
PI Industries Agribusiness Cartica Capital 50
Data provided by Venture Intelligence
PwC MoneyTreeTM India Report – Q2 ’15 11
3. Analysis of PE exits
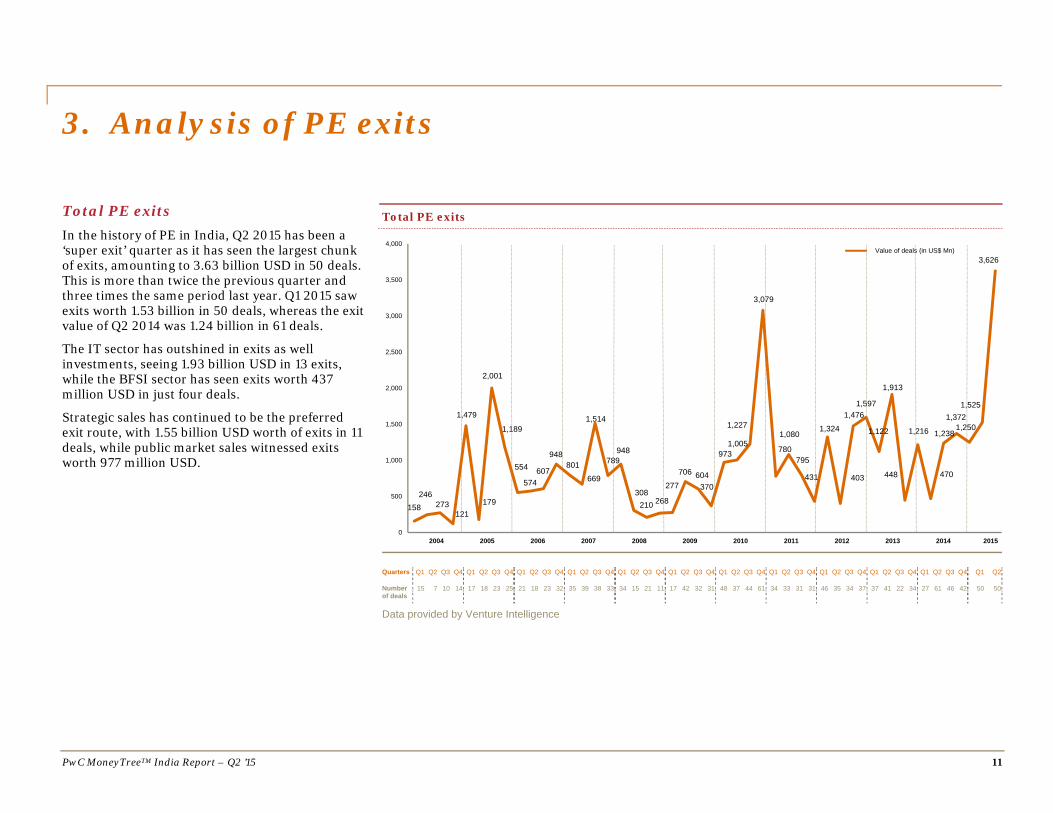
Total PE exits In the history of PE in India, Q2 2015 has been a ‘super exit’ quarter as it has seen the largest chunk of exits, amounting to 3.63 billion USD in 50 deals. This is more than twice the previous quarter and three times the same period last year. Q1 2015 saw exits worth 1.53 billion in 50 deals, whereas the exit value of Q2 2014 was 1.24 billion in 61 deals.
The IT sector has outshined in exits as well investments, seeing 1.93 billion USD in 13 exits, while the BFSI sector has seen exits worth 437 million USD in just four deals.
Strategic sales has continued to be the preferred exit route, with 1.55 billion USD worth of exits in 11 deals, while public market sales witnessed exits worth 977 million USD.
Total PE exits
Quarters Q1 Q2 Q3 Q4 Q1 Q2 Q3 Q4 Q1 Q2 Q3 Q4 Q1 Q2 Q3 Q4 Q1 Q2 Q3 Q4 Q1 Q2 Q3 Q4 Q1 Q2 Q3 Q4 Q1 Q2 Q3 Q4 Q1 Q2 Q3 Q4 Q1 Q2 Q3 Q4 Q1 Q2 Q3 Q4 Q1 Q2
Number of deals
15 7 10 14 17 18 23 25 21 18 23 32 35 39 38 33 34 15 21 11 17 42 32 31 48 37 44 61 34 33 31 31 46 35 34 37 37 41 22 34 27 61 46 42 50 50
Data provided by Venture Intelligence
158246
273121
1,479
179
2,001
1,189
554
574607
948801
669
1,514
789948
308210 268
277
706 604370
9731,005
1,227
3,079
780
1,080
795
431
1,324
403
1,4761,597
1,122
1,913
448
1,216
470
1,238
1,3721,250
1,525
3,626
0
500
1,000
1,500
2,000
2,500
3,000
3,500
4,000Value of deals (in US$ Mn)
2004 2006 2007 2008 2009 2010 2011 2012 2013 2014 20152005
Analysis of PE exits
PwC MoneyTreeTM India Report – Q2 ’15 12
Exits by industry Q2 ’14, Q1 ’15 and Q2 ’15
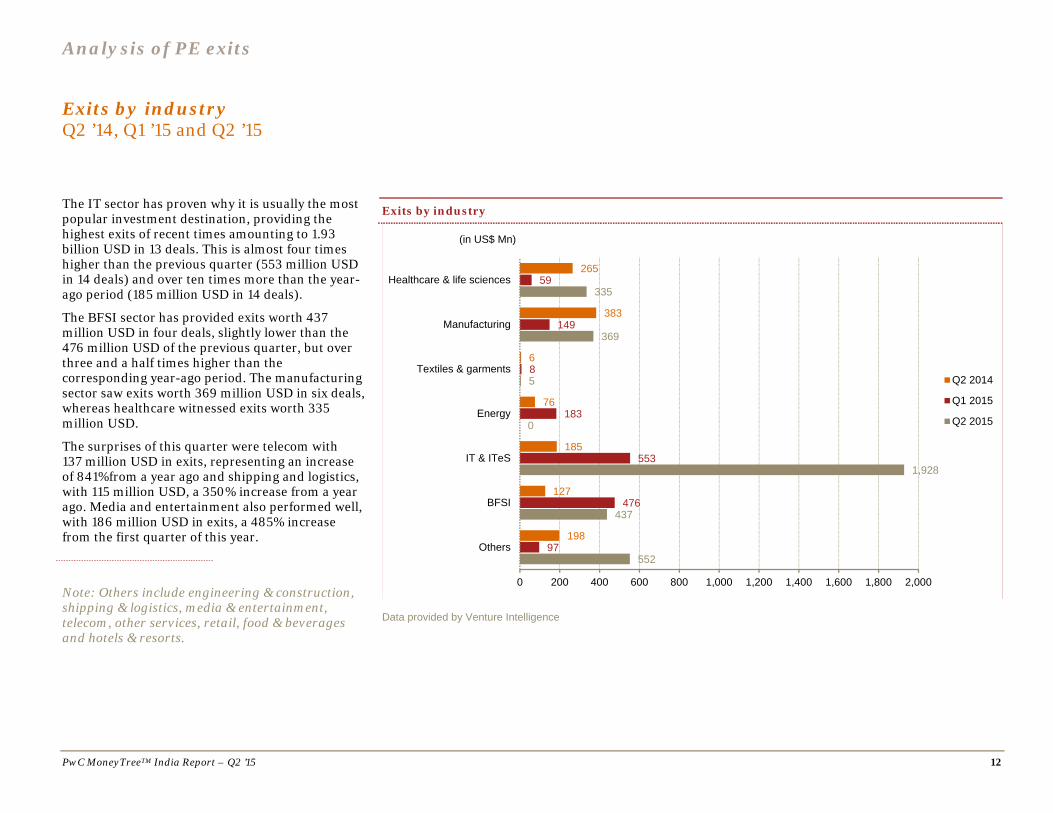
The IT sector has proven why it is usually the most popular investment destination, providing the highest exits of recent times amounting to 1.93 billion USD in 13 deals. This is almost four times higher than the previous quarter (553 million USD in 14 deals) and over ten times more than the year-ago period (185 million USD in 14 deals).
The BFSI sector has provided exits worth 437 million USD in four deals, slightly lower than the 476 million USD of the previous quarter, but over three and a half times higher than the corresponding year-ago period. The manufacturing sector saw exits worth 369 million USD in six deals, whereas healthcare witnessed exits worth 335 million USD.
The surprises of this quarter were telecom with 137 million USD in exits, representing an increase of 841%from a year ago and shipping and logistics, with 115 million USD, a 350% increase from a year ago. Media and entertainment also performed well, with 186 million USD in exits, a 485% increase from the first quarter of this year.
Exits by industry
Data provided by Venture Intelligence
552
437
1,928
0
5
369
335
97
476
553
183
8
149
59
198
127
185
76
6
383
265
0 200 400 600 800 1,000 1,200 1,400 1,600 1,800 2,000
Others
BFSI
IT & ITeS
Energy
Textiles & garments
Manufacturing
Healthcare & life sciences
(in US$ Mn)
Q2 2014
Q1 2015
Q2 2015
Note: Others include engineering & construction, shipping & logistics, media & entertainment, telecom, other services, retail, food & beverages and hotels & resorts.
Analysis of PE exits
PwC MoneyTreeTM India Report – Q2 ’15 13
Exits by type Q2 ’14, Q1 ’15 and Q2 ’15
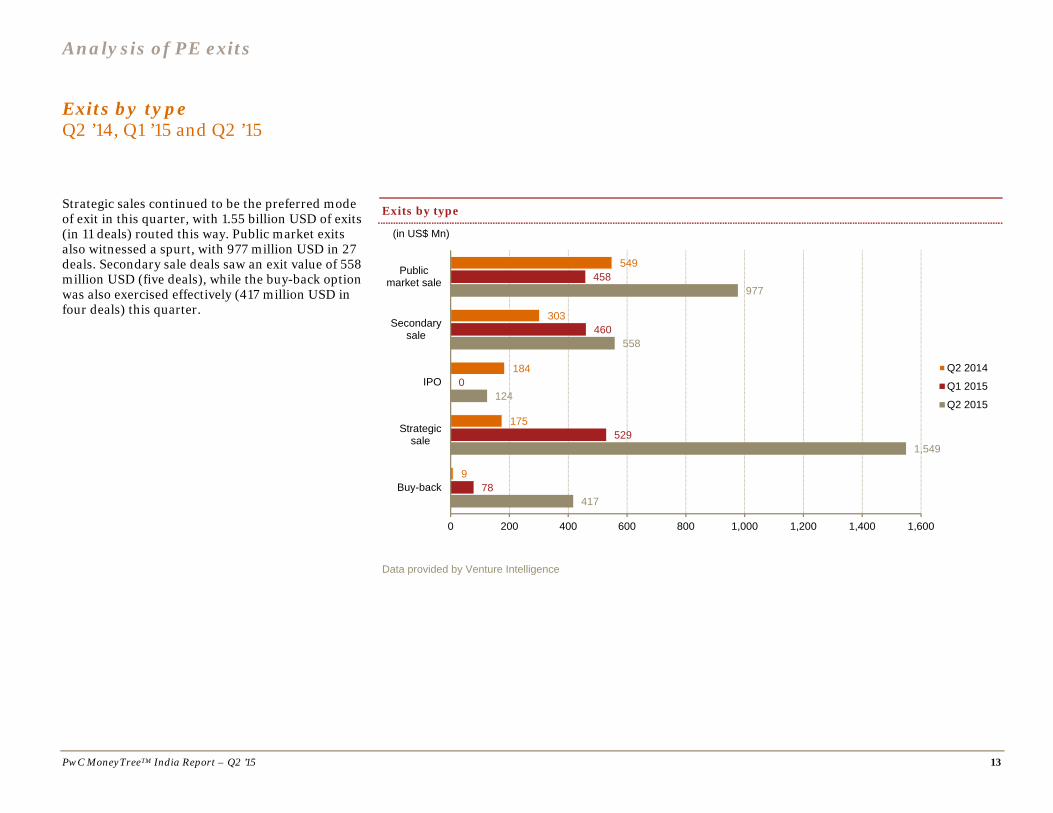
Strategic sales continued to be the preferred mode of exit in this quarter, with 1.55 billion USD of exits (in 11 deals) routed this way. Public market exits also witnessed a spurt, with 977 million USD in 27 deals. Secondary sale deals saw an exit value of 558 million USD (five deals), while the buy-back option was also exercised effectively (417 million USD in four deals) this quarter.
Exits by type
Data provided by Venture Intelligence
417
1,549
124
558
977
78
529
0
460
458
9
175
184
303
549
0 200 400 600 800 1,000 1,200 1,400 1,600
Buy-back
Strategicsale
IPO
Secondarysale
Publicmarket sale
(in US$ Mn)
Q2 2014
Q1 2015
Q2 2015
Analysis of PE exits
PwC MoneyTreeTM India Report – Q2 ’15 14
Top five PE exits Q2 ’15
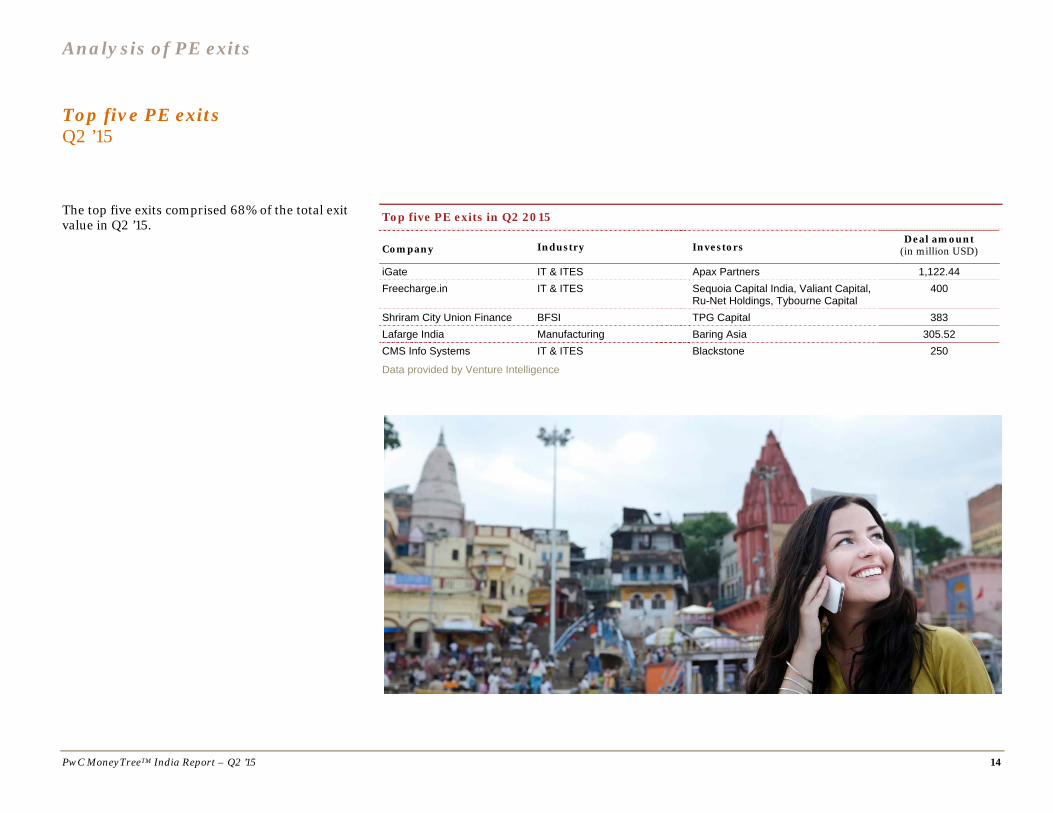
The top five exits comprised 68% of the total exit value in Q2 ’15.
Top five PE exits in Q2 2015
Company Industry Investors Deal amount
(in million USD)
iGate IT & ITES Apax Partners 1,122.44
Freecharge.in IT & ITES Sequoia Capital India, Valiant Capital, Ru-Net Holdings, Tybourne Capital
400
Shriram City Union Finance BFSI TPG Capital 383
Lafarge India Manufacturing Baring Asia 305.52
CMS Info Systems IT & ITES Blackstone 250
Data provided by Venture Intelligence
PwC MoneyTreeTM India Report – Q2 ’15 15
4. Active PE firms
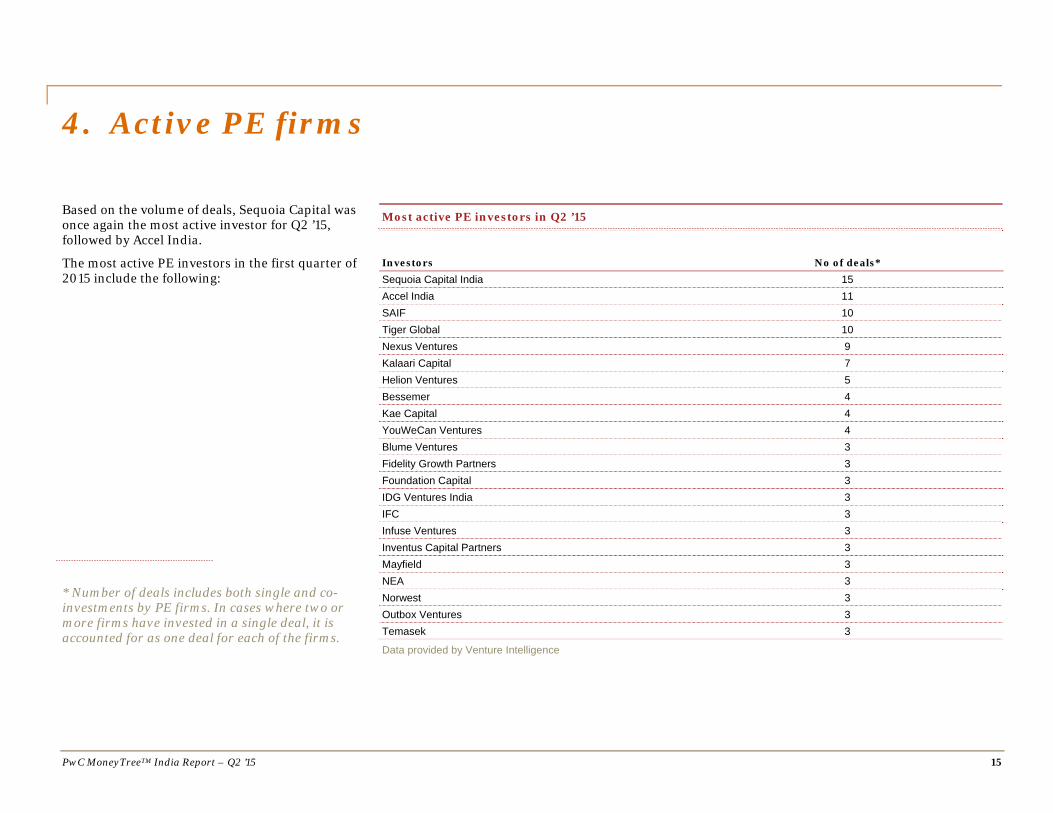
Based on the volume of deals, Sequoia Capital was once again the most active investor for Q2 ’15, followed by Accel India.
The most active PE investors in the first quarter of 2015 include the following:
Most active PE investors in Q2 ’15
Investors No of deals* Sequoia Capital India 15
Accel India 11
SAIF 10
Tiger Global 10
Nexus Ventures 9
Kalaari Capital 7
Helion Ventures 5
Bessemer 4
Kae Capital 4
YouWeCan Ventures 4
Blume Ventures 3
Fidelity Growth Partners 3
Foundation Capital 3
IDG Ventures India 3
IFC 3
Infuse Ventures 3
Inventus Capital Partners 3
Mayfield 3
NEA 3
Norwest 3
Outbox Ventures 3
Temasek 3
Data provided by Venture Intelligence
* Number of deals includes both single and co-investments by PE firms. In cases where two or more firms have invested in a single deal, it is accounted for as one deal for each of the firms.

PwC MoneyTreeTM India Report – Q2 ’15 16
5. Sector focus The past year has seen numerous PE firms invest in companies in emerging technologies and e-commerce. There has been a significant uptick in the overall volume of transactions and we expect more of these types of deals, driven by the strong prospects in the technology industry. India is poised to become the world's second-largest internet market after China. A huge proportion of the population, especially millennials, are leapfrogging the computer era and directly embracing smartphones. Digital is changing the rules of customer engagement in India as the availability of affordable smartphones and wireless internet is fostering the growth of a new breed of digital-savvy consumers who demand personalised and seamless experiences. The proliferation of emerging technologies like social, mobile and cloud applications is having a significant impact on consumer expectations in India. This proliferation has increased the number of digital touchpoints that organisations must address. Indian entrepreneurs are using this consumer shift to disrupt existing business and revenue models. Born-digital firms like Flipkart and Big Basket are reshaping customer experiences and expectations, and disrupting the Indian retail industry in the process. Companies like Ola Cabs and Zomato are solving real business issues in travel and hospitality and have become an essential part of day-to-day functioning. While the majority of existing businesses in India have a digital strategy in place, these strategies simply bolt digital onto the existing business model. However, to achieve a complete transformation, businesses will have to rethink their business models and place digital at the core. We expect this trend to continue with more firms investing in newer technologies. Smart machines are expected to usher in a new era of digital transformation with wearables, advanced robotics, 3D printing, virtual personal assistants and smart advisors evolving rapidly. Customer experience is the key to success in the growth of internet businesses and we expect to see significant product investment from companies in improving the customer experience and consumer engagement. Sandeep Ladda Technology Leader PwC India
Sector focus: IT & ITeS
PwC MoneyTreeTM India Report – Q2 ’15 17
Total PE investments
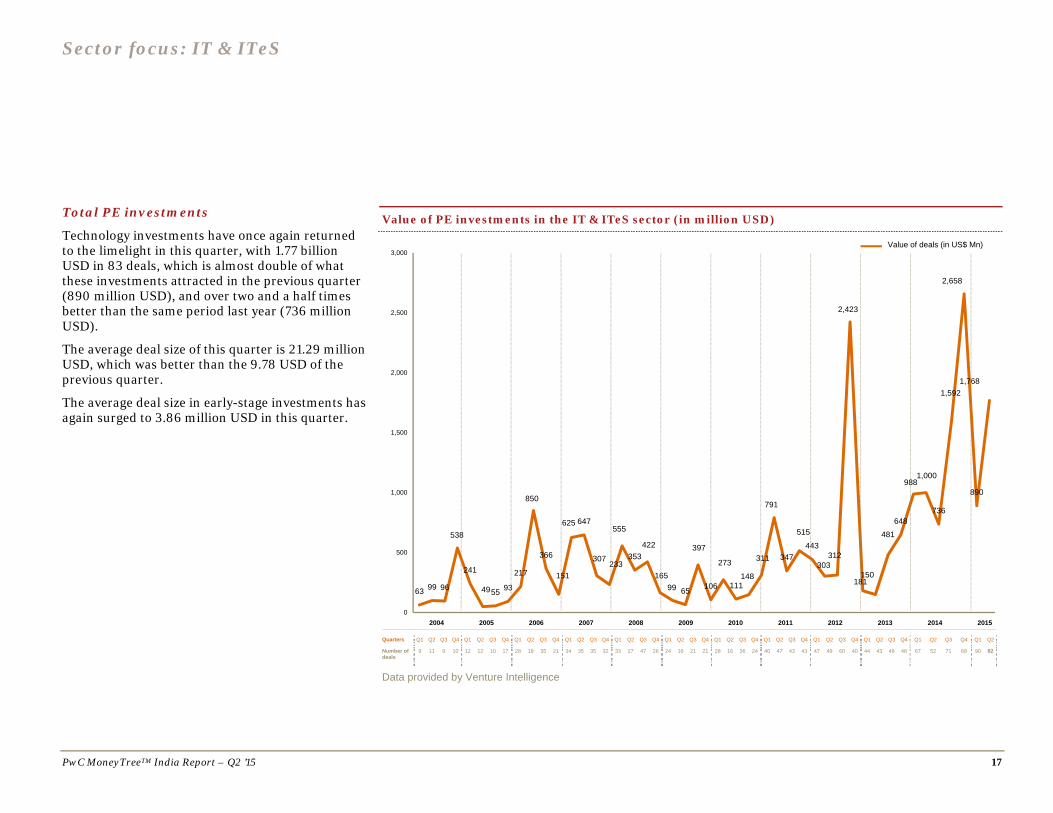
Technology investments have once again returned to the limelight in this quarter, with 1.77 billion USD in 83 deals, which is almost double of what these investments attracted in the previous quarter (890 million USD), and over two and a half times better than the same period last year (736 million USD).
The average deal size of this quarter is 21.29 million USD, which was better than the 9.78 USD of the previous quarter.
The average deal size in early-stage investments has again surged to 3.86 million USD in this quarter.
Value of PE investments in the IT & ITeS sector (in million USD)
Quarters Q1 Q2 Q3 Q4 Q1 Q2 Q3 Q4 Q1 Q2 Q3 Q4 Q1 Q2 Q3 Q4 Q1 Q2 Q3 Q4 Q1 Q2 Q3 Q4 Q1 Q2 Q3 Q4 Q1 Q2 Q3 Q4 Q1 Q2 Q3 Q4 Q1 Q2 Q3 Q4 Q1 Q2 Q3 Q4 Q1 Q2
Number of deals
9 11 9 10 12 12 10 17 28 18 35 21 34 35 35 32 33 27 47 26 24 16 21 21 28 16 36 24 40 47 43 43 47 49 60 40 44 43 48 48 67 52 71 68 90 82
Data provided by Venture Intelligence
63 99 96
538
241
4955 93
217
850
366
151
625 647
307233
555
353422
16599 65
397
106
273
111148
311
791
347
515
443
303312
2,423
181150
481
648
9881,000
736
1,592
2,658
890
1,768
0
500
1,000
1,500
2,000
2,500
3,000Value of deals (in US$ Mn)
2004 2006 2007 2008 2009 2010 2011 2012 2013 2014 20152005
Sector focus: IT & ITeS
PwC MoneyTreeTM India Report – Q2 ’15 18
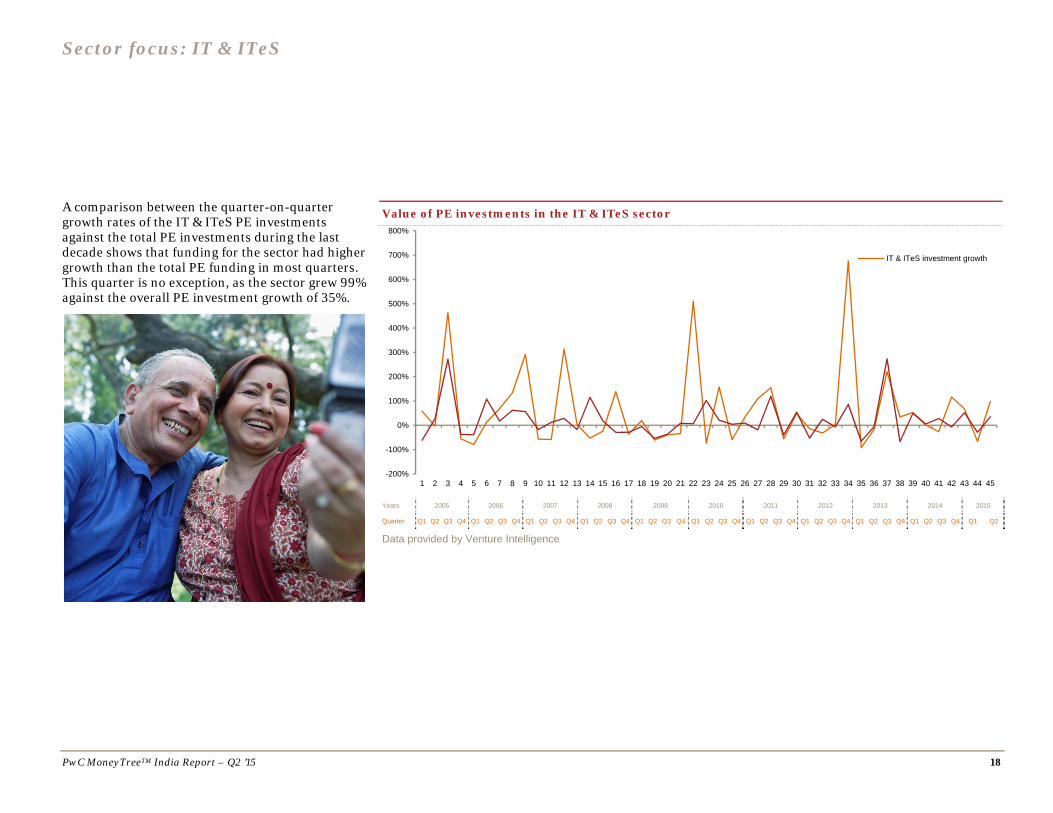
A comparison between the quarter-on-quarter growth rates of the IT & ITeS PE investments against the total PE investments during the last decade shows that funding for the sector had higher growth than the total PE funding in most quarters. This quarter is no exception, as the sector grew 99% against the overall PE investment growth of 35%.
Value of PE investments in the IT & ITeS sector
Years 2005 2006 2007 2008 2009 2010 2011 2012 2013 2014 2015
Quarter Q1 Q2 Q3 Q4 Q1 Q2 Q3 Q4 Q1 Q2 Q3 Q4 Q1 Q2 Q3 Q4 Q1 Q2 Q3 Q4 Q1 Q2 Q3 Q4 Q1 Q2 Q3 Q4 Q1 Q2 Q3 Q4 Q1 Q2 Q3 Q4 Q1 Q2 Q3 Q4 Q1 Q2
Data provided by Venture Intelligence
-200%
-100%
0%
100%
200%
300%
400%
500%
600%
700%
800%
1 2 3 4 5 6 7 8 9 10 11 12 13 14 15 16 17 18 19 20 21 22 23 24 25 26 27 28 29 30 31 32 33 34 35 36 37 38 39 40 41 42 43 44 45
IT & ITeS investment growth
Sector focus: IT & ITeS
PwC MoneyTreeTM India Report – Q2 ’15 19
Investments by stage of development Q2 ’14, Q1 ’15 and Q2 ’15
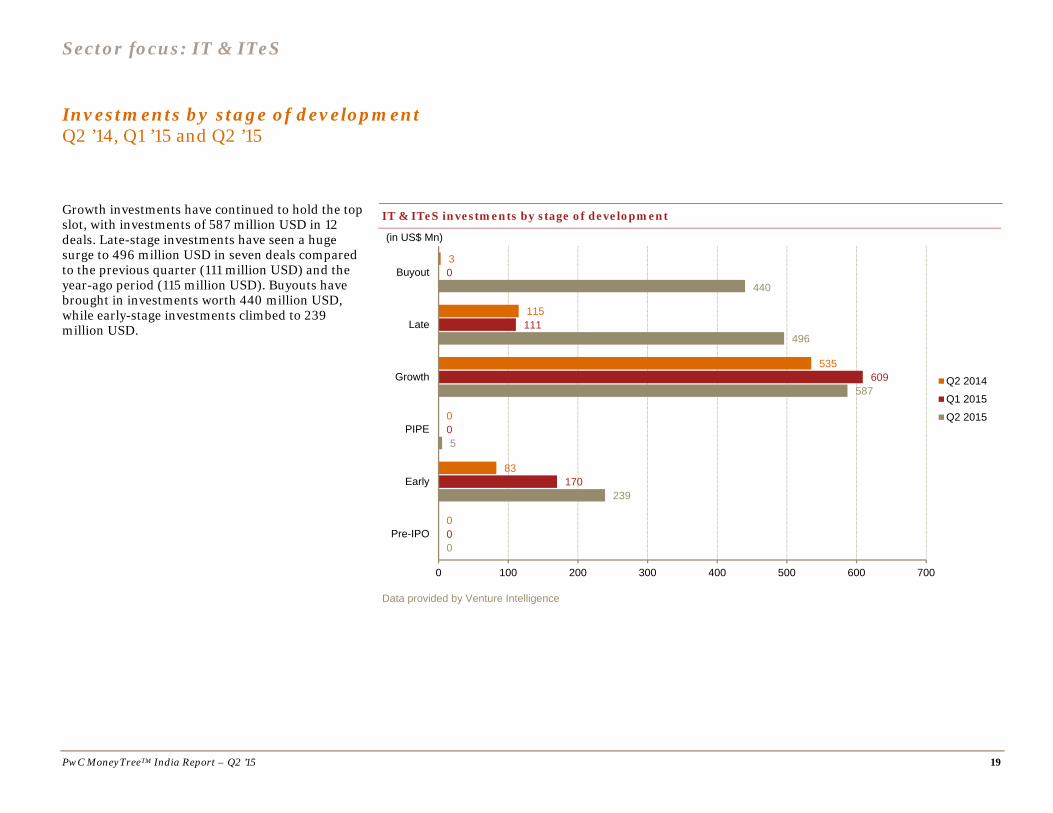
Growth investments have continued to hold the top slot, with investments of 587 million USD in 12 deals. Late-stage investments have seen a huge surge to 496 million USD in seven deals compared to the previous quarter (111 million USD) and the year-ago period (115 million USD). Buyouts have brought in investments worth 440 million USD, while early-stage investments climbed to 239 million USD.
IT & ITeS investments by stage of development
Data provided by Venture Intelligence
0
239
5
587
496
440
0
170
0
609
111
0
0
83
0
535
115
3
0 100 200 300 400 500 600 700
Pre-IPO
Early
PIPE
Growth
Late
Buyout
(in US$ Mn)
Q2 2014
Q1 2015
Q2 2015
Sector focus: IT & ITeS
PwC MoneyTreeTM India Report – Q2 ’15 20
Investments by region Q2 ’14, Q1 ’15 and Q2 ’15
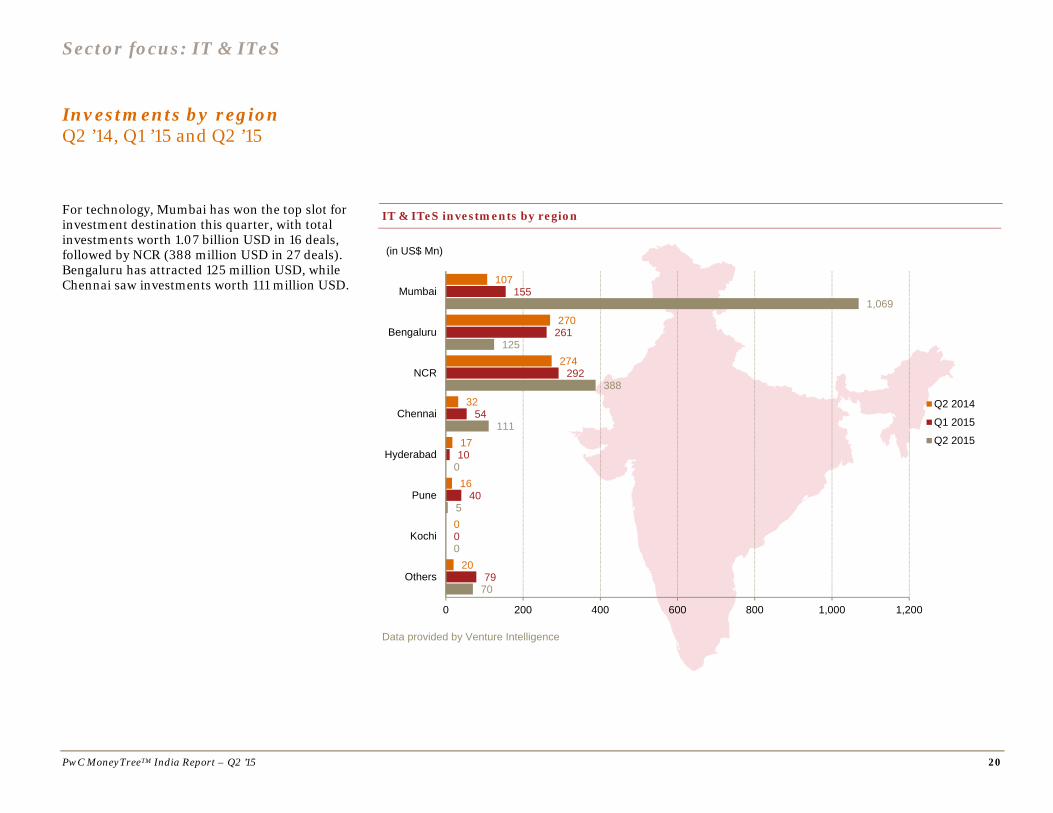
For technology, Mumbai has won the top slot for investment destination this quarter, with total investments worth 1.07 billion USD in 16 deals, followed by NCR (388 million USD in 27 deals). Bengaluru has attracted 125 million USD, while Chennai saw investments worth 111 million USD.
IT & ITeS investments by region
Data provided by Venture Intelligence
70
0
5
0
111
388
125
1,069
79
0
40
10
54
292
261
155
20
0
16
17
32
274
270
107
0 200 400 600 800 1,000 1,200
Others
Kochi
Pune
Hyderabad
Chennai
NCR
Bengaluru
Mumbai
(in US$ Mn)
Q2 2014
Q1 2015
Q2 2015
Sector focus: IT & ITeS
PwC MoneyTreeTM India Report – Q2 ’15 21
Investments by subsector Q2 ’14, Q1 ’15 and Q2 ’15
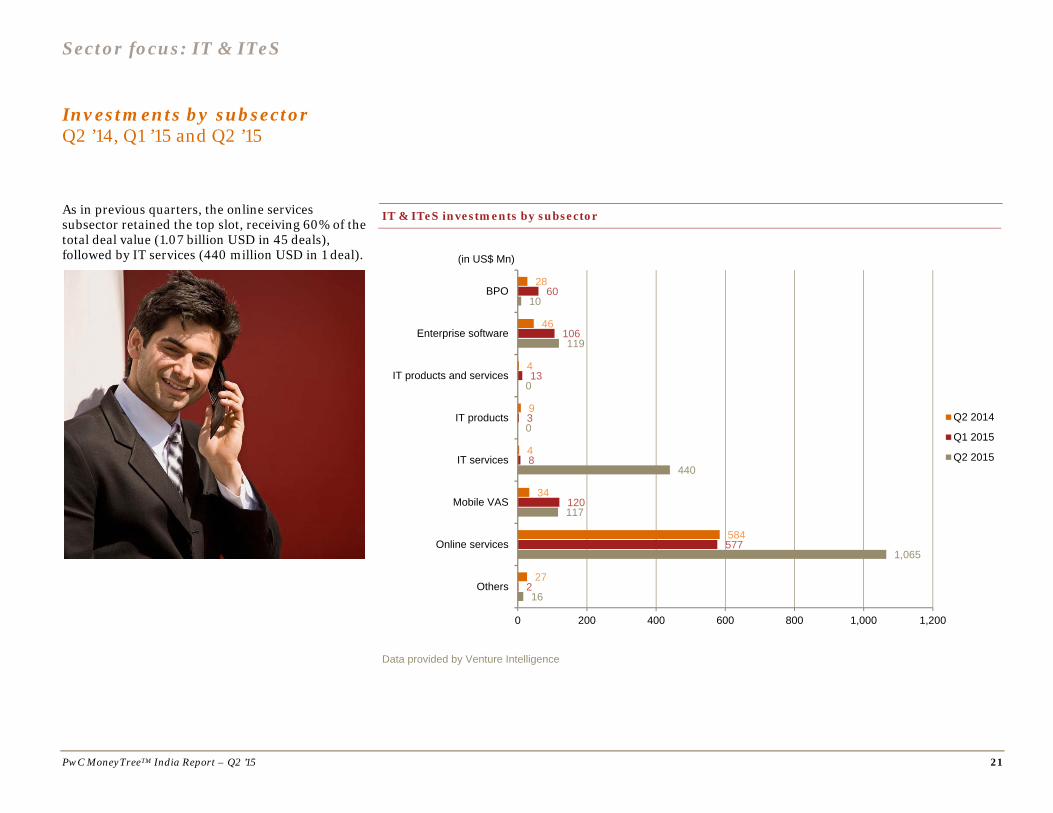
As in previous quarters, the online services subsector retained the top slot, receiving 60% of the total deal value (1.07 billion USD in 45 deals), followed by IT services (440 million USD in 1 deal).
IT & ITeS investments by subsector
Data provided by Venture Intelligence
28
46
4
9
4
34
584
27
60
106
13
3
8
120
577
2
10
119
0
0
440
117
1,065
16
0 200 400 600 800 1,000 1,200
BPO
Enterprise software
IT products and services
IT products
IT services
Mobile VAS
Online services
Others
(in US$ Mn)
Q2 2014
Q1 2015
Q2 2015
Sector focus: IT & ITeS
PwC MoneyTreeTM India Report – Q2 ’15 22
PE exits in the sector Q1 ’14, Q4 ’14 and Q1 ’15
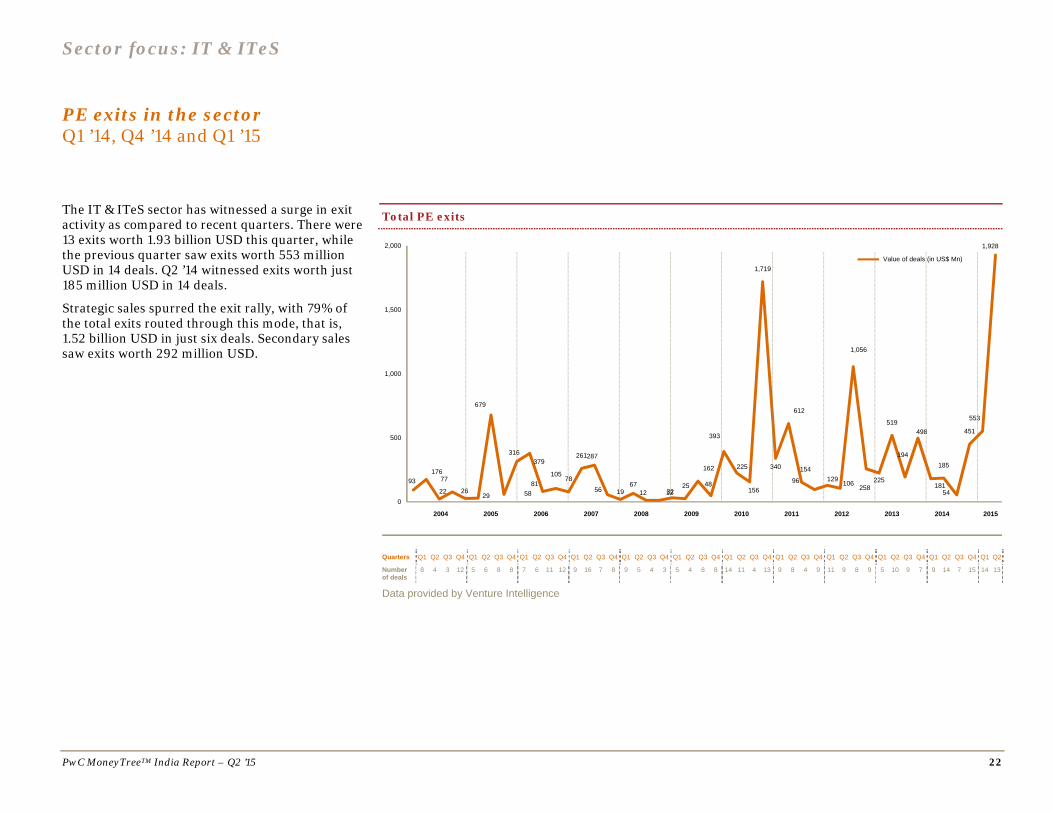
The IT & ITeS sector has witnessed a surge in exit activity as compared to recent quarters. There were 13 exits worth 1.93 billion USD this quarter, while the previous quarter saw exits worth 553 million USD in 14 deals. Q2 ’14 witnessed exits worth just 185 million USD in 14 deals.
Strategic sales spurred the exit rally, with 79% of the total exits routed through this mode, that is, 1.52 billion USD in just six deals. Secondary sales saw exits worth 292 million USD.
Total PE exits
Quarters Q1 Q2 Q3 Q4 Q1 Q2 Q3 Q4 Q1 Q2 Q3 Q4 Q1 Q2 Q3 Q4 Q1 Q2 Q3 Q4 Q1 Q2 Q3 Q4 Q1 Q2 Q3 Q4 Q1 Q2 Q3 Q4 Q1 Q2 Q3 Q4 Q1 Q2 Q3 Q4 Q1 Q2 Q3 Q4 Q1 Q2
Numberof deals
8 4 3 12 5 6 8 8 7 6 11 12 9 16 7 8 9 5 4 3 5 4 8 8 14 11 4 13 9 8 4 9 11 9 8 9 5 10 9 7 9 14 7 15 14 13
Data provided by Venture Intelligence
93176
22
77
2629
679
58
316379
81105
78
261287
56 1967
12 123225
162
48
393
225
156
1,719
340
612
154
96 129 106
1,056
258225
519
194
498
181
185
54
451
553
1,928
0
500
1,000
1,500
2,000
Value of deals (in US$ Mn)
2004 2006 2007 2008 2009 2010 2011 2012 2013 2014 20152005
PwC MoneyTreeTM India Report – Q2 ’15 23
6. Definitions
Stages of development
Early stage: This refers to the first or second round of institutional investments in companies that adhere to the following:
Less than five years old Not part of a larger business group Investment is less than 20 million USD
Growth stage: This refers to investments of less than 20 million USD. Also, investments meeting the following criteria are considered to be in the growth stage:
Third or fourth round funding of institutional investments
First or second round of institutional investments in companies that are more than 5 years old and less than 10 years old or spin-outs from larger businesses
Growth stage PE: This includes the following:
First or second round of investments worth 20 million USD or more
Third or fourth round funding in companies that are more than 5 years old and less than 10 years old, or subsidiaries or spin-outs from larger businesses
Fifth or sixth round of institutional investments
Late stage: This comprises the following:
Investment in companies that are a decade old Seventh or later round of institutional
investments
PIPEs: The following constitute PIPEs:
PE investments in publicly listed companies via preferential allotments or private placements
Acquisition of shares by PE firms via the secondary market
Buyout: This is an acquisition of controlling stake via purchase of stakes of existing shareholders.
Buyout–large: This includes buyout deals of 100 million USD or more in value.
Other: This includes PE investments in special purpose vehicle (SPV) or project-level investments.
Types of PE exits
Buy-back: This includes the purchase of PE or VC investors’ equity stakes by either the investee company or its founders or promoters.
Strategic sale: This includes the sale of PE or VC investors’ equity stakes (or the entire investee company itself) to a third-party company (which is typically a larger company in the same sector).
Secondary sale: Any purchase of PE or VC investors’ equity stakes by another PE or VC investors constitutes secondary sale.
Public market sale: This includes the sale of PE or VC investors’ equity stakes in a listed company through the public market.
Initial public offering (IPO): This includes the sale of PE or VC investors’ equity stake in an unlisted company through its first public offering of stock.
PwC MoneyTreeTM India Report – Q2 ’15
PricewaterhouseCoopers and Venture Intelligence have taken responsible steps to ensure that the information contained in the MoneyTreeTM report has been obtained from reliable sources. However, neither of the parties can warrant the ultimate validity of the data obtained. Results are updated periodically. Therefore, all data is subject to change at any time. Before making any decision or taking any action, you should consult a competent professional adviser.
©2015 PwC. All rights reserved. PwC refers to the PwC network and/or one or more of its member firms, each of which is a separate legal entity.
Please see pwc.com/structure for further details. This content is for general information purposes only, and should not be used as a substitute for
consultation with professional advisors.
www.pwc.com/globalmoneytree www.pwc.in
Contacts
Sandeep Ladda Leader, Technology PwC India [email protected]
Sanjeev Krishan Leader, Private Equity PwC India [email protected]
This report was researched and written by the following:
Pradyumna Sahu Director, Technology PwC India [email protected]
Sibi Sathyan Knowledge Manager, Private Equity PwC India [email protected]
About PwC’s Technology Institute The Technology Institute is PwC’s global research network that studies the business of technology and the technology of business with the purpose of creating thought leadership that offers both fact-based analysis and experienced-based perspectives. Technology Institute insights and viewpoints originate from active collaboration between our professionals across the globe and their first-hand experiences working in and with the technology industry.
About PwC PwC firms help organisations and individuals create the value they are looking for. We’re a network of firms in 157 countries with more than 195,000 people who are committed to delivering quality in assurance, tax and advisory services. Tell us what matters to you and find out more by visiting us at www.pwc.com.
www.pwc.com